Embed Size (px)
Citation preview

Facility Insights
services
Services to improve facility performance and operations
Confidential Property of Schneider Electric

How do we make facility optimization affordable for small and medium buildings?
49%of total
building
market
Large
buildings
Very Small buildings
Small - Mid
size buildings
2Schneider Electric – Facility Insights services
50,001 - 200,000 sqft
5.3% of total buildings in Canada
27.2% of total floor space in Canada
10,001 - 50,000 sqft
25.6% of total buildings in Canada
32.95% of total floor space in Canada
200,000+ sqft
1.1% of total buildings in Canada
24.3% of total floor space in Canada
5,001 – 10,000 sqft
19% of total buildings in Canada
8.1% of total floor space in Canada
Page 3Confidential Property of Schneider Electric |
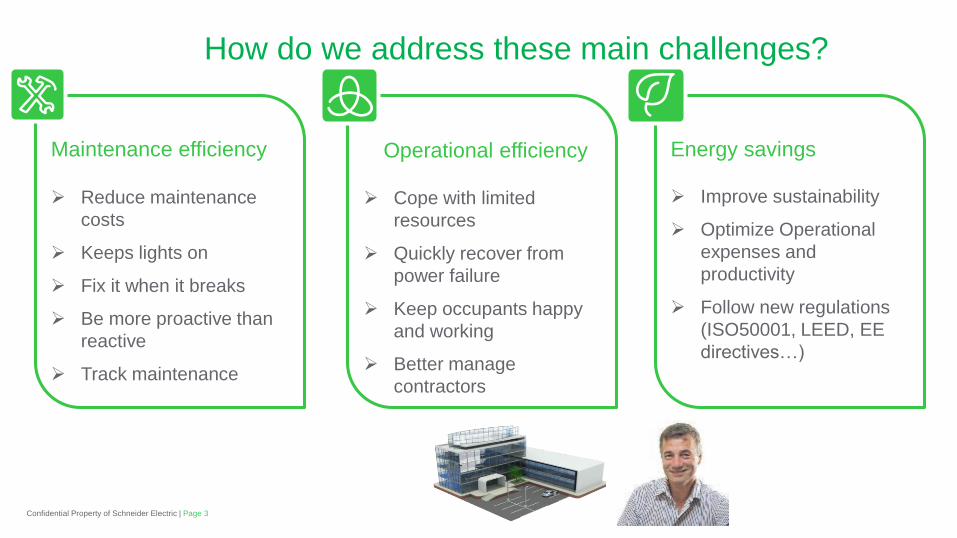
How do we address these main challenges?
Energy savings
Improve sustainability
Optimize Operational
expenses and
productivity
Follow new regulations
(ISO50001, LEED, EE
directives…)
Maintenance efficiency
Reduce maintenance
costs
Keeps lights on
Fix it when it breaks
Be more proactive than
reactive
Track maintenance
Operational efficiency
Cope with limited
resources
Quickly recover from
power failure
Keep occupants happy
and working
Better manage
contractors

Page 4Confidential Property of Schneider Electric |
Facility Insights
Comprehensive cloud based software platform
Manage water, gas, and energy data
Mobile alerts and alarms
Asset level monitoring
Monthly and semi-annual reports
Expert analysis, recommendations, action plans

Page 5Confidential Property of Schneider Electric |
Analytics and services for actionable informationDetect abnormal consumption during
nights & week ends
Benchmark energy consumptions versus
standard, best potential performance
Detect abnormal consumption during
daytime
Detect abnormal operating point during
heating & air conditioning periods
Smart
Diagnostics
Intelligent
Alarms
Reporting
Facility Insights
Service
Advisor
End User
customer

Our 2 Levels of Facility Insights Services
Page 6Confidential Property of Schneider Electric |

Page 7Confidential Property of Schneider Electric |
How do we keep installation costs down?Scalable Facility Insights Model
Modbus RS485
Analog I/O
ZigBee
WT4100 Rx
WT4111 Tx
WT4111 Tx EM4300
Optional
Wireless
Meters
Facility Insights Server
Ethernet | Modbus RS485
Digital I/O
Gas Water Main HVAC Lighting
Assets
Ethernet | Wi-Fi | GPRS
Humidity
Temp
Link150
Refrigeration

Real Time Monitoring
Mobile Alarms
Asset defaults to detect equipment
failures
Out of range parameter detection to
anticipate maintenance and improve
uptime
Abnormal consumption to avoid
unnecessary penalties and leakages
Dashboards
Monitor energy trends and follow
targets
Multisite benchmark to identify poorly
performing sites
Energy cost for electricity, gas, and fluid
tariffs
Energy consumption against business
figures (KPIs)
Monitor any of your connected
equipment to improve maintenance and
uptime
Page 8Confidential Property of Schneider Electric |

Monthly reports
Page 9Confidential Property of Schneider Electric |
Consumption and cost performance by
zone and usage Normalized performance Asset Performance

Semi annual reports
Period Summary
Energy Performance analysis and Recommendations
Action Plan Review
Page 10Confidential Property of Schneider Electric |
The 3 Main Components

Energy Performance Analysis and Recommendations Base load - Summary
Base Load ViewThe Base load represents how much you spend when no activity is taking place in the building such as night
and week-end; this period of time is called the base load period. The base load is represented below in red.
The realistic base load target is represented in green.
KPI tracking
• Monthly potential savings
• Monthly duration
in baseload period
Recommendations• Identify energy usages can be stopped or remaining in operation unnecessarily to obtain a better
baseload
Analysis
• Most days, the base load energy is too high.
• If the best value is produced every day, a potential
savings of 2% on annual consumption is possible.
Ex : Friday, 12th February Ex : Friday, 19th March
2 %
20 hours

Energy Performance Analysis and Recommendations Energy Intensity Map
Energy Intensity Map View – 1QThe following energy intensity map view represents the consumption with colors from green for low
consumption to red for high consumption. It is a visualization of one quarter consumption day by day and
hour per hour. It is easy to visualize repetitive patterns, vertically when it is a daily pattern or horizontally if it
corresponds to specific day types.
Analysis and recommendations• Night consumptions during the winter (heating
probably) were identified in red : potential savings
10% in January to 3% in March.
• An usage is restarting each Sunday evening from
21:00 (probably heating) identified in purple: see
next page
• In February we also observed consumptions
between 18:00 to 21:00 which are identified in blue
: are they some consumptions related to the
production?
• Additional measurements and investigations are to
be carried out to confirm that the heating is the
application concerned by these night
consumptions.
KPI tracking
Night consumption
Total consumption
Night consumption
Day consumption
20 %
25 %

Energy Performance Analysis and Recommendations Energy profiles - Summary
Clusters Calendar ViewThe following year calendar shows the same color for the days with the same behavior. These groups of days
are called cluster : week days, week end or Sunday, specific closed days or holiday are generally visible
KPI tracking
• Abnormal opened days
• Abnormal closed days
Recommendations• Check the actual behavior of the site for six Sundays identified in red (heating restarting in the end
of days a priori) and for weekdays identified in yellow.
Analysis
• The calendar shows a regular consumption
for this this site, mainly divided between
weekdays (opened days) and closed days
(weekends and bank holidays).
• The bank holidays (Easter Monday, 1st and
8th of May and Ascension Thursday) have
the same profile as the closed days.
• Atypical or abnormal days (in red and yellow
on the calendar) were detected, which require
a more thorough investigation to identify
possible improvements.
7
5

Building Signature View – Closed daysOn the diagram below we have plotted the energy consumption versus the external temperature obtained from a
meteorological database :
• The correlation established
(red line) defines a base-line
with a certain tolerance :
thresholds are defined out
of which consumption is
considered as abnormal for a given
outside temperature (dotted lines).
• Abnormal or atypical days with
overconsumption are purple circled
on the chart.
• Other atypical days (other red
points) have an abnormal profile
compared to all other similar days,
but without generating excessive
consumption.
Energy Performance Analysis and Recommendations Building signature view
KPI tracking
• Over consumption days
• Less consumption days
Recommendations
• Abnormal days circled in purple require investigations to identify potential improvements.
Analysis
• The correlation is clear : we can see the
external temperature effect on the site's
energy consumption according to three well
identified periods : winter - mid-season and
summer.
• 5 days (circled in violet on the diagram)
show overconsumption (see details on next
page)
• 1 abnormal consumption day was also
identified.
5
1

Action plan reviewPerformance review
Proposed action plan for next period July – December 2015This section reminds the main potential savings identification and corresponding recommendations ranked for
the next period.
Points of attention
by priority
Energy Intensity Map
• Consumption peaks in the morning that were
detected require investigations to identify the
source (HVAC, process?) and correct the
situation if necessary.
Building signature view
• Atypical energy consumptions during night and
weekend periods (HVAC, process, other?) are
to be identified
Energy profile
• Subscribed power overruns (consumption
peaks) and possible financial penalties
(electricity providor invoices)
Baseload analysis
• Atypical energy consumptions during night and
weekend periods (HVAC, process, other?)
Type of
analysis
Pertinence
indicatorSite behavior Priority
Baseload2% of the consumption on
the periodIdentify the relevant usages **
Energy profiles11 overconsumption
peaks detectedAnalyze abnormal days **
Energy intensity
map
5% of the consumption on
the period
Confirm HVAC optimization
opportunities***
Building
signature
6 overconsumption days
12 under consumption
days
Identify the causes of
overconsumption days***

Page 16Confidential Property of Schneider Electric |
Summary: Facility Insights Benefits
Facility Insights Identify energy improvements
Permanently actionable information to make proper decisions
Deep understanding of site energy performance
Understand pending issues
Be informed on potential improvements on a regular basis
Expert analysis with our service advisor energy experts
Facility Insights ProImprove energy, operation and maintenance
Prioritize maintenance actions
Reduce unnecessary travels for multi site
Anticipate potential failures
Extend equipment life time
Save time identifying root cause on event
Reduce downtime
Improve management of sub contractors

Page 17Confidential Property of Schneider Electric |


