Embed Size (px)
Citation preview

Office of the City Auditor
Report to the City Council City of San José
FACILITIES MAINTENANCE: PROCESS IMPROVEMENTS ARE POSSIBLE, BUT A LARGE DEFERRED MAINTENANCE BACKLOG REMAINS
Report 14-10 November 2014

200 E. Santa Clara Street, San José, CA 95113
Telephone: (408) 535-1250 Fax: (408) 292-6071 Website: www.sanjoseca.gov/auditor/
Office of the City Auditor Sharon W. Erickson, City Auditor
November 13, 2014
Honorable Mayor and Members Of the City Council 200 East Santa Clara Street San José, CA 95113 Facilities Maintenance: Process Improvements Are Possible, But a Large Deferred Maintenance Backlog Remains The City of San José has a large and diverse portfolio of buildings, including City Hall, Mineta San José International Airport, SAP Center (the Arena), San José-Santa Clara Regional Wastewater Facility, San José McEnery Convention Center, cultural facilities, police buildings, fire stations, libraries, and community centers. Most are maintained by the Public Works Department. The purpose of this audit was to assess the department’s process for prioritizing repair and improvement projects. Finding 1: Underinvestment in Facilities Maintenance Has Led to a Large Deferred Maintenance Backlog. Without sufficient maintenance, facilities deteriorate and eventually fall into disrepair, posing health and safety problems to City staff and residents using the facilities. As of April 2014, Public Works estimated that City buildings had a deferred maintenance backlog of roughly $120 million (excluding the Airport, SAP Center, Regional Wastewater Facility, and convention and cultural facilities); however, thorough condition assessments have not been conducted in a decade. During times of limited resources, thorough prioritization of competing needs becomes ever more important. In our opinion, to accurately assess the maintenance backlog and ensure limited funds are put to their best use, Public Works should develop a 5-year plan to conduct condition assessments with lifecycle cost analyses for all City facilities, and conduct regular in-house building assessments. Preventive maintenance, a best practice in facilities management, fell to unacceptable levels for much of the last decade, but the department has completed the vast majority of preventive maintenance work orders since a budget augmentation in FY 2012-13. Despite recent increases, investment levels in facility maintenance do not meet industry standards, and one-time funding has resulted in high contractor use. Efficiencies are possible if funding is made permanent. Finding 2: Improved Use of Enterprise Software Can Lead to Better Asset Management and Improved Customer Service. Facilities Management utilizes an enterprise asset management system that has the capability to manage a large portfolio of assets and optimize the investment in each asset. However, the benefits of the system have yet to be fully realized. Some field staff find the system challenging to work with, and turnover in database administration has impeded full implementation of the system. Further, despite staff trainings on system utilization, data entry and work order creation appear inconsistent, resulting in sometimes inaccurate and unuseful data. Adoption and integration of the system varies across staff, and increased management emphasis is needed.

ii
The current asset management system was chosen ten years ago as the City’s solution to maintenance management across several departments. Initially, system administrators from the user departments met regularly, but that collaboration and communication now appears infrequent. While the other City departments have adapted their use of the management system to achieve added benefits, Facilities continues to utilize the system mostly as a workflow management tool. Further benefits, including investment optimization and asset condition forecasting, are possible with expanded use. Moreover, customer communication can be improved by utilizing the automatic email feature of the system. Finding 3: Responses to High Priority Problems and City Hall Are Quick, but Repairs Outside of City Hall Often Take Much Longer. Public Works receives and initiates nearly 10,000 repairs each year. Priorities and time standards guide its work, with its top priority being addressing health and safety concerns within one day, which it does in nearly all cases. However, it met non-health and safety time standards less than 70 percent of the time. This result was largely driven by its low rate of success meeting the time standard assigned for most work requests, and by difficulties meeting time standards for work requests outside of City Hall. We recommend the department periodically review and revise its prioritization policy and time standards, setting challenging yet reasonably attainable time standards, and reconsider the long-standing special service level that City Hall receives compared to all other City facilities. Finding 4: Enhanced Performance Reporting May Lead to Quicker Repairs at City Facilities. Current performance measures and management reports appear too general to identify specific problems in performance. In aggregate, of work orders assigned the most common priority level, the department completed 60 percent on time. However, when we disaggregated data, we found that timeliness varied significantly across the department’s specialized maintenance shops. For example, 82 percent of Plumbing Shop work orders, but only 34 percent of Carpentry Shop work orders, met time standards. Staffing challenges, particularly in the Electrical Shop, contributed to these results, but the data suggest that the department’s average work order also took longer to complete in FY 2013-14 than in previous years. Other jurisdictions report performance at the shop and staff level, and have used data to encourage reduced cycle times. We recommend the department monitor performance at the shop and staff level and report performance to stakeholders to improve transparency and lessen frustration. This report includes 10 recommendations. We will present this report at the November 20, 2014 meeting of the Public Safety, Finance, and Strategic Support Committee. We would like to thank the Public Works Department for its time and insight during the audit process. The Administration has reviewed the information in this report and their response is shown on the yellow pages. Respectfully submitted,
Sharon W. Erickson City Auditor finaltr SE:lg Audit Staff: Avichai Yotam Cheryl Hedges cc: Ed Shikada Rick Doyle Jennifer Maguire Kevin Baker Matt Loesch Dave Sykes Joe Garcia Patricia Deignan Alex Gurza Vijay Sammeta
This report is also available online at http://www.sanjoseca.gov/audits.

Table of Contents
Cover Letter .............................................................................................................i
Introduction ............................................................................................................ 1
Background ............................................................................................................................. 1
Audit Objective, Scope, and Methodology ...................................................................... 5
Finding I Underinvestment in Facilities Maintenance Has Led to a Large Deferred Maintenance Backlog ............................................................................ 9
Large and Growing Deferred Maintenance Backlog ...................................................... 9
Investment Levels Fall Below Industry Guidelines ...................................................... 10
A Preventive Maintenance Strategy Extends the Useful Life of City Facilities ...... 14
Finding 2 Improved Use of Enterprise Software Can Lead to Better Asset Management and Improved Customer Service ................................................ 17
Benefits of Asset Management System Have Not Yet Been Fully Realized ........... 17
The Asset Management System Is Used Mostly to Manage and Document Workflow ............................................................................................................................. 18
Building and Equipment Inventory May Be Inaccurate ............................................... 18
Inconsistent Data Entry Processes Hinder the Usefulness of the System ............. 20
Turnover of Database Administration and Work Order Desk Staffing ................ 22
Improving Portfolio Management Through Increased Management Emphasis and Use of Reporting Tools ............................................................................................. 23
Sharing Best Practices Across the City’s Infor EAM Users ....................................... 26
Customer Communication Can Be Improved ............................................................. 27
Finding 3 Responses to High Priority Problems and City Hall Are Quick, But Repairs Outside of City Hall Often Take Much Longer ................................... 29
Facilities Management Has Established Priorities and Time Standards to Guide Its Work ................................................................................................................... 29
Health and Safety Issues Have Been Addressed Quickly........................................... 30
Non-Health and Safety Time Standards Have Been Met Far Less Frequently, Especially Outside of City Hall .................................................................. 32
Finding 4 Enhanced Performance Reporting May Lead to Quicker Repairs at City Facilities…………. ................................................................................................. 37
Timeliness of Work Orders Outside of City Hall Varied by Shop ......................... 37

More Specific Performance Reporting Could Help Drive Down Cycle Times ..................................................................................................................................... 40
Customers Are Frustrated by Perceived Untimeliness of Repair Requests ......... 43
Conclusion ............................................................................................................. 45
Appendix A Select Operating Statistic for the Facilities Management Division for Work Orders Created From July 1, 2011 to June 30, 2014 ........................... A-1
Administration’s Response ................................................................. yellow pages

Table of Exhibits
Exhibit 1: Facilities Management Division Organizational Chart as of February 2014 ......................................................................................................... 3
Exhibit 2: Facilities Adopted Budget and Staffing, FY 2009-10 to FY 2014-15 .............................................................................................................. 4
Exhibit 3: Work Orders Created by Type, FY 2011-12 to FY 2013-14 ............ 5
Exhibit 4: Percent of FY 2014-15 Routine Maintenance Need Funded .......... 11
Exhibit 5: Preventive Maintenance Completion Rates Increasing .................. 14
Exhibit 6: Screenshot of Facilities’ Use of the Parts Inventory to Track Contractors ........................................................................................................... 21
Exhibit 7: Facilities’ Staff Labor Hours by Type at Libraries and Community Centers ............................................................................................ 24
Exhibit 8: Priorities and Time Standards for Corrective Maintenance, as of March 2014, and Work Orders Created by Priority for FY 2011-12 to FY 2013-14 ....................................................................................................... 30
Exhibit 9: Staff Responded to Nearly all Health and Safety Works Orders Within One Day ...................................................................................... 31
Exhibit10: Meeting Time Standards by Priority for FY 2011-12 to FY 2013-14 ............................................................................................................ 32
Exhibit 11: Percentage of Priority 3 Work Orders Completed Timely for Facilities Other Than City Hall, by the Number of Days on Which Staff Booked Labor, FY 2011-12 to FY 2013-14 ............................................... 33
Exhibit 12: Meeting Time Standards by Location (City Hall and Citywide) for FY 2011-12 to FY 2013-14 .......................................................... 34
Exhibit 13: Days to Respond/Complete Non-Health and Safety Repairs, by Priority and Location, Over the Last Three Fiscal Years ........................... 34
Exhibit 14: San José City Hall Tower and Rotunda .......................................... 35

Exhibit 15: Meeting 7-Day Time Standard at Facilities Other Than City Hall, by Shop ......................................................................................................... 38
Exhibit 16: Percentage of Priority 3 Repairs Completed With Less Than 4 Hours of Staff Time Charged by Shop, FY 2011-12 to FY 2013-14 ............ 39
Exhibit 17: Example of Facilities’ Quarterly Dashboard .................................. 40
Exhibit 18: Example of Seattle Management Reports - Age and Type of Work Order by Shop ........................................................................................... 41
Exhibit 19: Seattle Management Reports – Graphs of Monthly Average Cycle Times by Shop ........................................................................................... 42
Exhibit 20: Example of a Key Performance Indicator Dashboard at RWF ....................................................................................................................... 43

1
Introduction
The mission of the City Auditor’s Office is to independently assess and report on City operations and services. The audit function is an essential element of San José’s public accountability and our audits provide the City Council, City management, and the general public with independent and objective information regarding the economy, efficiency, and effectiveness of City operations and services.
In accordance with the City Auditor’s fiscal year (FY) 2013-14 Audit Work Plan, we have completed an audit of the Public Works Department’s process for prioritizing facility maintenance repair and improvement projects.
We conducted this performance audit in accordance with generally accepted government auditing standards. Those standards require that we plan and perform the audit to obtain sufficient, appropriate evidence to provide a reasonable basis for our findings and conclusions based on our audit objectives. We believe that the evidence obtained provides a reasonable basis for our findings and conclusions based on our audit objectives. We limited our work to those areas specified in the “Audit Objective, Scope, and Methodology” section of this report.
The Office of the City Auditor thanks the management and staff from the Public Works Department for their time, information, insight, and cooperation during the audit process.
Background
The City of San José operates and maintains hundreds of buildings spanning millions of square feet. Ongoing maintenance is required on the City’s buildings and facilities to ensure safe and functional operations.
Most of the City’s buildings are maintained by the Facilities Management Division of the Public Works Department.1 Public Works oversees the planning, design, construction, and maintenance of city infrastructure and facilities, which includes City buildings (i.e., branch libraries, community centers, and City Hall) and regional facilities. Its mission is “to provide excellent service in building a smart and sustainable community, maintaining and managing City assets, and serving the animal care needs of the community.”
1 The Facilities Management Division moved to Public Works with other divisions previously part of the General Services Department, when the two departments were consolidated in FY 2010-11.

Facilities Maintenance
2
The Facilities Management Division (Facilities) seeks to “provide safe, efficient, comfortable, attractive, and functional buildings and facilities.” It is responsible for providing service to more than 400 buildings with 3 million square feet of space, including City Hall, fire stations, police buildings, libraries, and community centers. These figures exclude certain City buildings maintained by others, such as the Airport, SAP Center, Regional Wastewater Facility, and the City’s convention center and most cultural facilities.2
According to the department, maintenance activities are broken down into three categories that range from reactive to proactive:
• Corrective maintenance is typically complaint-driven and reactive in nature. Work in this category involves repairing broken equipment or building systems, such as leaking faucets, temperatures that are too hot or too cold, or non-functional lights. To manage corrective workflow, Facilities has established priorities and time standards as described in Findings 3 and 4 in this report.
• Preventive maintenance involves testing equipment and building systems on a regular frequency in order to find failed components before facility users experience the need for repairs. Examples include servicing emergency generators, air conditioning equipment, elevators, backflow prevention devices, and fire suppression systems.
• Predictive maintenance involves testing of more complex systems to identify weaknesses and anticipate future failures. Examples include infrared scanning of motors for large mechanical equipment, and testing of high voltage electrical distribution systems. The City does not perform very much of this type of maintenance.
In addition to preventive and corrective maintenance (repairs), Facilities also performs tenant improvements, which are larger projects and enhance (rather than repair) assets.
2 The City has various operating agreements regarding cultural facilities and facilities operated by others, where the City may be partly or fully responsible for maintenance and capital replacement expenses depending on an individual agreement’s details. The School of Arts and Culture at the Mexican Heritage Plaza has a portion of its annual subsidy set aside for capital replacement needs. Additionally, the Children’s Discovery Museum and Tech Museum are participating in an optional partnership with the City, in which the City matches five percent of the current level of each facility subsidy and sets it aside into a Cultural Facilities Capital Maintenance Matching Allocation. As part of the Mayor’s March 2014 Budget Message for FY 2014-15, the Mayor directed a percent of growth in Transient Occupancy Tax revenues (above the FY 2013-14 base year) be used for City-owned cultural facilities’ deferred maintenance and capital replacement needs.

Introduction
3
Facilities Management Division
The division organizes and delivers its services by location and specialty. Management oversight and maintenance staff is divided into City Hall and all other facilities (sometimes referred to as “citywide”). Citywide and City Hall maintenance services are then broken down by various specialties (“shops”) as shown in the organization chart in Exhibit 1.
Exhibit 1: Facilities Management Division Organizational Chart as of February 2014
Source: Public Works Department, Facilities Management Division organization chart
The management and supervision of the Facilities Management Division has undergone significant turnover in the past year. The Deputy Director, both Building Management Administrators, and several shop supervisors joined the division and/or changed roles in the last year.
Facilities Maintenance Staffing and Funding
As shown in Exhibit 2, Facilities authorized staffing declined 40 percent from 113.25 full-time equivalents (FTE) in FY 2009-10 to 68.0 FTE in FY 2011-12. It has increased 15 percent since then, rising to 78.5 FTE in FY 2014-15.

Facilities Maintenance
4
Exhibit 2: Facilities Adopted Budget and Staffing, FY 2009-10 to FY 2014-15
Source: Adopted operating budget for the General Services and Public Works Departments from FY 2009-10 to FY 2014-15
Exhibit 2 also shows that the division’s FY 2014-15 budget was $19.7 million, up 13 percent from FY 2012-13, but down 7 percent from FY 2009-10 when it peaked at $21.1 million. The FY 2014-15 budget was 32 percent more than the low of $14.9 million in FY 2011-12.
The significant budget increase from FY 2011-12 to FY 2012-13 was mostly related to the Preventive Maintenance Program. The City Council augmented the preventive maintenance budget by $1.8 million to increase the completion percentage of preventive maintenance work orders. These budget augmentations support a common goal of any maintenance organization: to minimize the amount of corrective maintenance so as not to interrupt City programs and services, and because corrective maintenance is inefficient and costly in nature compared to routine preventive maintenance.
Facilities’ budget, like its organization, is separated into two categories: City Hall and citywide (all facilities other than City Hall). Personal services make up 65 percent of the City Hall budget ($2.5 of $3.9 million) and 48 percent of the citywide budget ($5.5 of $11.5 million, including the Preventive Maintenance Program). Elevator maintenance accounts for half of City Hall’s $1.4 million non-personal services budget, while the citywide $4.2 million non-personal budget is spread across the division’s shops for contract services.
Workload and Performance Measurement
Facilities tracks and reports performance measures related to building condition, timeliness, workload, and cost. To report on timeliness and workload, the division utilizes Infor EAM, an enterprise asset management system to document, track, and assign corrective and preventive maintenance, and tenant improvement work orders. According to this system’s data, Facilities has created approximately 25,000 work orders annually over the last three years, which includes preventive maintenance, repairs (including building services,

Introduction
5
operation support, and other miscellaneous work), improvements, and event requests. Exhibit 3 summarizes work orders created by type from FY 2011-12 to FY 2013-14.
Exhibit 3: Work Orders Created by Type, FY 2011-12 to FY 2013-14
Work Order Type FY 2011-12 FY 2012-13 FY 2013-14 Total Preventive Maintenance 10,500 14,000 15,500 40,000 Repairs 9,500 10,000 10,000 29,500 Tenant Improvements 1,000 1,000 <500 2,500 Event Services <500 <500 <500 1,000 Total 21,500 25,500 26,000 73,000
Source: Auditor analysis of PW’s Infor EAM data for work orders created between July 1, 2011 and June 30, 2014 Note: Repairs include building services, operation support, and miscellaneous work orders
As shown in Exhibit 3, the annual number of work orders has increased since FY 2011-12. Repair work was relatively consistent whereas preventive maintenance work orders increased as a result of the budget additions described above, and tenant improvements declined. According to staff, decreasing requests for tenant improvements were a reflection of customer department budget constraints. See Appendix A for additional statistics describing Facilities’ workload.
Facilities relies heavily on contractors, and in FY 2013-14 its contractual services adopted budget was $4.5 million. Some maintenance activities are strictly contractor-based because they are beyond the capacity of department staff, such as elevator inspection and maintenance, roofing, and window repairs. Contractors are also called to complete maintenance and improvement requests when Facilities cannot complete a requested project on a specific timeframe or specialized skills are required. To this end, Public Works has an informal arrangement with the Parks, Recreation and Neighborhood Services Department (PRNS) such that Facilities reviews project proposals, and if it cannot deliver a project on the timeline required, PRNS may hire an approved contractor.
Using its asset management system, Facilities reports the percentage of preventive maintenance work orders completed, the percent of health and safety concerns mitigated within 24 hours, and the percent of non-health and safety work completed within time standards. We discuss preventive maintenance in Finding 1, and timeliness in Findings 3 and 4 of this report.
Audit Objective, Scope, and Methodology
The objective of our audit was to assess the Public Works Department’s process for prioritizing facility maintenance repair and improvement projects. Through a series of interviews and analysis of data from the department’s asset management system, we sought to understand the relevant management controls, the type

Facilities Maintenance
6
and volume of work, and staff’s prioritization and handling of maintenance, repair, and improvement work. Specifically, we:
• Reviewed the City Charter and Municipal Code to understand the legal responsibility for maintenance and upkeep of City-owned and operated buildings.
• Reviewed relevant Council memoranda, budget documents, and program reports for the last several years, including program and service delivery changes, and performance measures reported to the Manager’s Budget Office.
• Interviewed management and staff to understand the existing prioritization process and work practices, including the planning and scheduling, issue identification and resolution and record keeping activities.
• Benchmarked prioritization of maintenance and repair practices with other comparable cities, including the cities of Portland, Sacramento, San Diego, and Seattle.
• Reviewed best practices, including:
o International Facility Management Association (2009), Operations and Maintenance Benchmarks Research Report #32.
o U.S. Department of Energy (2010), report entitled, Operations & Maintenance Best Practices.
o National Research Council (2012), Predicting Outcomes from Investments in Maintenance and Repair for Federal Facilities.
o National Research Council (2004), Investments in Federal Facilities: Asset Management Strategies for the 21st Century.
• Interviewed facility management at the Parks, Recreation and Neighborhood Services; Police; Fire; and Library departments to identify communication and reporting practices as well as to understand how customer department requests affect workload and workflow.
• Tested the Infor EAM system for accuracy and completeness. Specifically, we interviewed staff to understand data entry processes and limitations of the data system, and compared Infor EAM data to Financial Management System (FMS) information for a limited sample of work orders.
• Interviewed staff with the Airport and the Regional Wastewater Facility, to understand their implementation and use of the Infor EAM database.

Introduction
7
• Assessed the timeliness and cost of repair work under current procedures. Specifically, we compiled data from the department’s system and performed analyses of work orders created from July 1, 2011 to June 30, 2014, including calculating workload and cycle time by repair type, priority, shop, customer, and location.
This audit focused on the prioritization process of maintenance, repair, and tenant improvement projects for City facilities under Facilities Management’s purview. It did not include an evaluation of the capital replacement program for facilities under contract nor did it include an evaluation of building conditions.

Facilities Maintenance
8
This page was intentionally left blank

9
Finding I Underinvestment in Facilities Maintenance Has Led to a Large Deferred Maintenance Backlog
Summary
Choices made today regarding investment in City facilities directly affect the future quality of workplaces and delivery of City services. Over time, without sufficient maintenance, facilities deteriorate and eventually fall into disrepair, posing health and safety problems to City staff and residents using the facilities. As of April 2014, Public Works estimated that it would cost $120 million to address the backlog of deferred maintenance at City buildings.3 Deferred maintenance cost estimates are rough at best, and may be low.
As with many other City departments, the Facilities Management (Facilities) division weathered significant budget cuts in the last decade. During times of limited resources, thorough prioritization of competing needs becomes ever more important. We recommend City facilities be placed on a 5-year plan for condition assessments with lifecycle cost analyses, which have not been conducted in over a decade, and conduct regular in-house building condition assessments.
Preventive maintenance, a best practice in facilities management, fell to unacceptable levels for much of the last decade. Since a budget augmentation in FY 2012-13, Facilities has completed the vast majority of preventive maintenance work orders. However, despite recent increases, investment levels in facility maintenance do not meet industry standards. Furthermore, one-time funding has resulted in high contractor use, and staff believes cost-efficiency gains are possible if funding is made permanent.
Large and Growing Deferred Maintenance Backlog
Facilities maintains over 400 buildings at approximately 200 facilities across the City’s 175 square miles. These buildings include: City Hall, police buildings, 33 operating fire stations, 22 branch libraries, 12 community centers, 42 reuse facilities, hundreds of park buildings and other small buildings. During the last decade, square footage of City buildings nearly doubled, as the City constructed and opened new community centers, libraries, fire stations, and other facilities.
3 This value does not include deferred maintenance for Airport, SAP Center, or Regional Wastewater Facility buildings, or for city streets and sewer infrastructure.

Facilities Maintenance
10
Despite investments in maintenance and operations, the City has deferred a substantial amount of maintenance. Facilities’ most recent estimate, from April 2014, placed deferred maintenance of City buildings at $120.5 million, with $4.6 million more needed annually to maintain buildings thereafter. To identify this figure, the department extrapolated the deferred maintenance backlog by using square foot improvement costs for facilities with low ratings based on in-house staff’s assessments of a limited number of facilities. Additionally, in FY 2012-13, the Parks, Recreation and Neighborhood Services Department conducted condition assessments at its buildings, and in doing so, saw an increase in its deferred maintenance backlog by $7.3 million. Similarly, it is reasonable to assume the current deferred maintenance estimates underrepresent the need.
Deferring Maintenance Has Significant Consequences
When maintenance is allowed to be deferred, infrastructure deteriorates and prematurely reaches a condition where major work is necessary and, eventually, it is cheaper to rebuild than to perform the deferred maintenance. In an April 2013 memorandum, Public Works provided examples of these consequences of deferring maintenance:
Perhaps no facility more accurately depicts the challenges of deferred maintenance than Fire Station 5. In the course of painting this station, a relatively minor project, staff became aware of increasing deficiencies, eventually including significant moisture and mold in many of the walls. As a result, the station has undergone a significant unanticipated renovation with a total cost in excess of $1 million. These costs are due to failures in waterproofing on roofs, around windows, and in restrooms. This followed a similar significant unanticipated investment in Fire Station 11 last year in excess of $500,000 due to damage resulting from deferred maintenance. The project costs at both facilities are significantly greater than the costs of routine maintenance on the failed elements.
Investment Levels Fall Below Industry Guidelines
The Facilities budget for FY 2014-15 is $19.7 million to maintain a portfolio of buildings worth approximately $1.34 billion.4 Industry standards call for higher funding for facility maintenance.
In 1990, the National Research Council issued a report titled Committing to the Cost of Ownership: Maintenance and Repair of Public Buildings, which became an often cited standard for public facilities management. The study found “credible analyses indicate that we are systematically neglecting the maintenance of public
4 This figure is derived from the Finance Department’s property schedule, and includes only those properties where the City has an insurable interest. For instance, those buildings below or at the $100,000 deductible are excluded. Nonetheless, the property schedule provides a reasonable estimate.

Finding 1
11
facilities at all levels of government. We are spending our assets and wasting our inheritance.” It therefore recommended:
An appropriate budget allocation for routine M&R [maintenance and repair] for a substantial inventory of facilities will typically be in the range of 2 to 4 percent of the aggregate replacement value of those facilities (excluding land and major associated infrastructure). In the absence of specific information upon which to base the M&R budget, this funding level should be used as an absolute minimum value. Where neglect of maintenance has caused a backlog of needed repairs to accumulate, spending must exceed this minimum level until the backlog has been eliminated.
The Finance Department’s schedule of insurable properties lists approximately $1.34 billion of buildings and equipment under Facilities’ purview (which excludes the Airport, SAP Center, Regional Wastewater Facility, Convention Center and certain cultural facilities), so a minimal recommended budget would be $27 million. The City’s current funding level of $19.7 million is thus 73 percent of what is recommended for daily maintenance needs, as shown in Exhibit 4. It should be noted that this estimate of annual maintenance costs does NOT include funding to begin addressing the deferred maintenance backlog or capital replacements.
Exhibit 4: Percent of FY 2014-15 Routine Maintenance Need Funded
Source: Auditor analysis of Facilities FY 2014-15 operating budget and Finance Department’s property schedule as of September 2014
Jurisdictions surveyed and literature we reviewed acknowledged that even reaching 2 percent funding is a challenge, making the need to prioritize limited resources even more important. San Diego, for instance, is addressing this challenge by developing a maintenance and repair budget model based on facility class (i.e., budgeting less for park restrooms than for community centers). A similar approach of allocating funds based on criticality and need may prove useful for San José, as well.

Facilities Maintenance
12
Condition Assessments of City Facilities Are Needed
During times of limited resources, assessing the relative condition of buildings in a portfolio becomes increasingly important to allow for rigorous prioritization of competing needs. To do so, best practices point to regular condition assessments that offer snapshots of building and system conditions as well as lifecycle cost analyses, including current repair needs and possible replacement costs.
A number of jurisdictions surveyed are currently undergoing condition assessments. Seattle, which oversees approximately 115 buildings, has a 5-year contract to evaluate all buildings (approximately 20 annually). Similarly, San Diego, whose contract is based on square feet, is on a 5-year condition assessment project, evaluating about 2 million square feet annually. Sacramento, on the other hand, last conducted a citywide condition assessment in 2000, and they acknowledged the importance of keeping up-to-date with assessments, at least in-house, otherwise the relevancy of the information fades.5
In our opinion, City facilities should be placed on a five-year plan for condition assessments with lifecycle cost analyses, which will help predict capital replacement and associated funding needs.6 Ongoing, basic condition assessments conducted by in-house staff can then assist in monitoring and maintaining accurate information and asset inventories.
Condition Assessments Enable Better Comparison of Competing Needs
Keeping buildings on this sort of regular assessment cycle would allow decision-makers to balance competing demands for limited resources, since it allows for comparison of relative need. One commonly used comparative indicator is the Facility Condition Index (FCI), which is a ratio of deferred maintenance costs to current building replacement. The goal is to ensure that total deferred maintenance cost for a building is less than 5 percent of the replacement cost of the building.
For example, a building with a total replacement value of $1 million and a deferred maintenance cost of $40,000 would have a relatively “good” FCI rating of 4 percent (i.e. the deferred maintenance cost was less than 5 percent of the replacement value of the asset), whereas a $1 million building with a deferred maintenance need of $500,000 would have a “poor” FCI score of 50 percent
5 Utilizing its field and Architecture and Engineering staff, Sacramento recently began efforts to create a comprehensive deferred maintenance list that includes cost of repair estimates for all city facilities. A complete report is expected spring 2015.
6 To fund ongoing maintenance and repairs, some jurisdictions and selected City facilities (such as the convention center and cultural facilities) establish sinking funds. King County in Washington, for instance, established a Major Maintenance Reserve Fund to maintain county-owned buildings, in which revenue from agencies (based on square footage), the general fund, reimbursements from other jurisdictions, and other investment earnings contribute to the Fund.

Finding 1
13
(meaning that the deferred maintenance cost was 50 percent of the replacement value of the asset).7
Other jurisdictions utilize FCI to evaluate the health of their portfolios. For example, King County calculated FCI scores for its building portfolio based on results from condition assessments and found that only 36 percent of its buildings had a relatively good FCI score (i.e. where the deferred maintenance cost was less than 5 percent of the replacement value of the building).
Funding Necessary for Regular Condition Assessments
Comprehensive asset condition assessments, once done by third party consultants, have not been conducted by the Department for over a decade. Facilities has estimated that conducting full assessments at the City’s most essential buildings would cost at least several hundred thousand dollars. Facilities had a consultant under contract for condition assessments, but had only obtained assessments for a limited number of buildings (mainly its cultural facilities). According to Facilities, that consultant agreement is currently being renewed. According to an April 2014 memorandum, funding for remaining buildings has not been identified, though the Department will continue looking for opportunities and analyzing funding approaches to support evaluative work.8
Facilities has in the past conducted basic in-house visual inspections of buildings that primarily evaluated aesthetics, but those were not done the last two years. Per staff, these assessments will be reinstated. However, a more thorough condition assessment evaluation by staff is critical to maintaining updated facility information once a thorough condition assessment has been conducted throughout the City.
Recommendation #1: To enable better asset lifecycle management, Public Works should:
a) identify funding, in coordination with the Manager’s Budget Office, and create a plan to conduct comprehensive condition assessments, including lifecycle cost analyses of City facilities;
b) conduct regular, ongoing condition assessments of City facilities, and
c) provide this information to City Council together with an analysis of the consequences of continuing funding at current versus enhanced levels.
7 Facilities with an FCI value of less than 5 percent are typically considered in “good” condition, 5 to 10 percent are “fair,” and 10 percent and over are “poor”. 8 In April 2014 the City Council adopted a resolution authorizing the department to enter into an agreement with Chevron Energy Solutions to implement energy and utility conservation projects, and install equipment at City facilities. As part of this agreement, Chevron was to assess a number of City facilities from an energy conservation perspective. The department may be able to build on these assessments.

Facilities Maintenance
14
A Preventive Maintenance Strategy Extends the Useful Life of City Facilities
By expending the necessary resources to conduct preventive maintenance, equipment life is extended and its reliability increased, just as regular oil changes extend the useful life of a car. A study of best practices in operations and maintenance by the U.S. Department of Energy found that a preventive maintenance strategy has an estimated 12 to 18 percent cost savings in the long run over a purely reactive strategy. According to Facilities, the “overarching goal of the PM [Preventive Maintenance] program is to reduce the backlog of preventive maintenance work and to help reduce deferred maintenance costs.”
Completion of Preventive Maintenance Fell But Has Increased With Funding
As shown in Exhibit 5 below, the City’s completion of preventive maintenance fell from 90 percent in 2005-06 to about 40 percent for the next six years. Funding fell even further during the same time period, from $1.7 million to $345,000, an 80 percent decline. According to the Department, funding for preventive maintenance declined due to several reasons: the extensive building growth over last decade, increased sophistication and complexity of building systems that require more maintenance, and the decline in the City’s budget.
Exhibit 5: Preventive Maintenance Completion Rates Increasing
Source: Auditor analysis of Facilities Management data
In FY 2012-13, the City directed $1.8 million to preventive maintenance, of which $1.3 million is now ongoing. In FY 2013-14, approximately 90 percent of all preventive maintenance was completed, a drastic increase from two years ago.

Finding 1
15
As shown in Exhibit 5, not only has the completion rate increased, but so has the number of preventive maintenance work orders. According to staff, this is due to the increase in the building portfolio coupled with the identification of “tier two” preventive work, such as tree trimming and debris removal at sites that are heavily surrounded by trees, which can be particularly important. For instance, flooding that occurred at the Police Administration Building in 2013 was due to a lack of debris removal. A failure to complete “tier two” preventive maintenance can have significant consequences.
Preventive Maintenance Now Accounts for Most of Facilities’ Work
The most commonly cited preventive maintenance best practice is a strategy where 80 percent of work conducted is proactive (i.e., preventive) and only 20 percent is reactive (i.e., corrective). In FY 2013-14, approximately 60 percent of completed work orders were preventive and 40 percent were corrective, an increase from FY 2011-12 where 35 percent were preventive and 65 percent were corrective.
Other jurisdictions, similarly, are striving to achieve 80 percent preventive and 20 percent reactive workloads. Seattle estimates that its workload is comprised of 58 percent preventive to 42 reactive, whereas San Diego has increased from 13 percent preventive a year ago to 23 percent preventive. It is currently undergoing a review of its department processes and hopes to see this ratio improve.
One-time Funding Has Resulted in Contracting Much of Preventive Maintenance
According to the Department, one-time funding made it difficult to hire and retain staff. The Facility Repair Worker positions in the preventive maintenance program were temporary. In FY 2014-15 two Facility Repair Worker positions and one Building Maintenance Superintendent were approved for ongoing funding.
Due to the nature of this one-time funding and the large volume of work, Facilities has utilized contractors to complete much of the preventive maintenance. Approximately 50 percent of HVAC preventive maintenance work orders were completed by contractors, 40 percent of Electrical, and 90 percent of Plumbing. The Department estimates $100,000 is spent monthly on contractors. According to staff, the FY 2014-15 ongoing funding will result in some cost efficiencies, and further cost efficiency gains might be possible by transitioning more preventive maintenance to in-house staff (depending on scope and scale of the maintenance required).
The City of Portland’s facility maintenance program underwent a similar transition in recent years. Previously, its staff performed either corrective maintenance or preventive maintenance work, but those responsibilities are now mixed.

Facilities Maintenance
16
According to Portland’s facility maintenance, the effects of transitioning to a more flexible workforce have yet to be determined, but it anticipates evaluating results in the near future.
Recommendation #2: To fully institutionalize the City’s preventive maintenance focused strategy, the City Administration should identify ongoing funding for the Preventive Maintenance Program.

17
Finding 2 Improved Use of Enterprise Software Can Lead to Better Asset Management and Improved Customer Service
Summary Facilities Management utilizes an enterprise asset management system that has the capability to manage a large portfolio of assets and optimize the investment in each asset. However, the benefits of the system have yet to be fully realized. Some field staff finds the system challenging to work with, and turnover in database administration has impeded full implementation of the system. Further, despite staff trainings on system utilization, data entry and work order creation appear inconsistent, resulting in sometimes inaccurate and unuseful data. Adoption and integration of the system varies across staff, and increased management emphasis is needed.
The current asset management system was chosen ten years ago as the City’s solution to maintenance management across several departments. Initially, system administrators from the user departments met regularly, but that collaboration and communication now appears infrequent. While the other City departments have adapted their use of the management system to achieve added benefits, Facilities continues to utilize the system mostly as a workflow management tool. Further benefits, including investment optimization and asset condition forecasting, are possible with expanded use. Moreover, customer communication can be improved by utilizing the automatic email feature of the system.
Benefits of Asset Management System Have Not Yet Been Fully Realized
Facilities utilizes Infor EAM, an enterprise asset management program that has the capability to track incoming work requests, schedule preventive maintenance, determine resource allocation, track asset condition and performance, report key performance indicators, and aid in budget preparation. An enterprise asset management system focuses on managing a portfolio of assets in a way in which the investment for each asset can be optimized, and running an efficient and cost effective maintenance program based on risk and an overall reduction in the cost of capital.
An asset management system is at the core of strategic asset management. One of the key reasons for asset management is the ability to make good decisions, especially between competing priorities, such as cost versus risk, short-term versus long-term, and tangible versus intangible goals. Asset management decisions affect multiple stakeholders, including Finance, City Council, and the

Facilities Maintenance
18
public, so an ability to accurately describe the City’s circumstances and tradeoffs is essential for decision makers.
The consequences of not fully utilizing an asset management system are significant, such as health and safety concerns and interrupted City services. However, the risk extends further. According to the Department’s internal technical support, the risks are not limited to building and equipment-related issues, but also the following:
• Legal health and safety liabilities
• Regulatory non-compliance
• Negative public reputation
• Inefficient use of staff time
Asset management systems automate many logistical functions, increasing efficiency and allowing for data-driven decision making. In its current state, Facilities’ mainly uses its asset management system for workflow management and some asset tracking; however, much more advanced analysis is possible for Facilities to improve its maintenance program.
The Asset Management System Is Used Mostly to Manage and Document Workflow
In the early 2000s, Facilities Management implemented Infor EAM (then known as Datastream) as a way to manage the work flow of its maintenance program. Although the software has further capabilities, it remains mostly a work management tool for the Department.
Customer departments either call or email the Work Order desk, where a request is created. The Work Order desk gives a priority level to the request and assigns it to a shop supervisor. The shop supervisor reviews the work order to ensure it was given the proper priority level and assigns it to staff. Assuming the request is not an emergency, staff then uses his or her discretion and completes work typically on a first-in-first-out basis. At some point upon returning to the office, staff books labor against the work order and marks it as “field complete.” The shop supervisor then reviews the work order and marks it as “complete.” Staff and supervisors typically complete data entry for work orders in batches.
Building and Equipment Inventory May Be Inaccurate
A complete and accurate inventory of buildings and equipment is the basis of any maintenance program. However, City-maintained building counts and square footage vary. Under current processes, there is no agreed-upon definition of what constitutes a building. In addition, the count of buildings reported to the

Finding 2
19
City Council includes pump stations (storm pumps make up 22 buildings and 13,000 square feet) as well as assorted park structures. The Department is currently in the process of updating its building inventory.
Furthermore, the equipment inventory is outdated. According to staff, some retired equipment remains active in the database. As a result, preventive maintenance work orders can be released for equipment, such as exhaust fans, that do not exist. Since much of the preventive maintenance program is contracted, a complete and accurate inventory would help ensure that contractors are not assigned work on equipment that does not exist.
With a large number of buildings containing a considerable amount of equipment, inventory management is daunting. However, inaccurate and incomplete inventory hampers the City’s ability to:
• Accurately calculate financial risk and weigh investment priorities;
• Prevent and predict asset failures, which may interrupt City services;
• Obtain full operational life from equipment.
For example, in November 2013, the Police Administration Building experienced flooding due to a lack of debris removal, creating a clogged pump. According to Facilities, staff had not known about the pump, and as a result, it had not provided appropriate preventive maintenance.
As Facilities identifies equipment, it updates the asset management database, but the Department acknowledges that obtaining a complete inventory of equipment is an ongoing effort. Some jurisdictions and departments determine what to track based on square feet or value minimums. For instance, the City’s Regional Wastewater Facility (RWF), which also uses Infor EAM, suggests setting a minimum value such that if the asset or equipment is valued under that minimum and does not have health and safety requirements, nor is it part of a “critical” system, it may not be worth tracking.
Recommendation #3: For effective financial planning and efficient use of existing staff resources, Facilities should create a policy to regularly review building and asset inventory lists to ensure accuracy in the database. This review could be part of the condition assessment program.
Facilities Maintenance
20
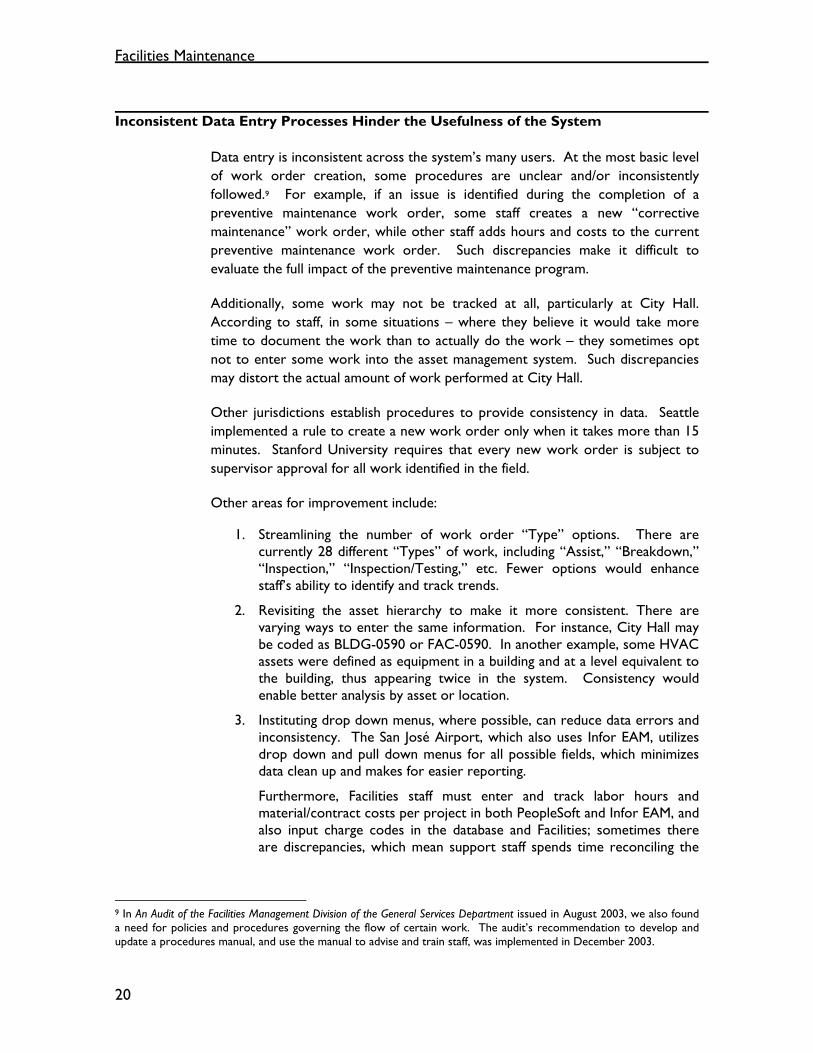
Inconsistent Data Entry Processes Hinder the Usefulness of the System
Data entry is inconsistent across the system’s many users. At the most basic level of work order creation, some procedures are unclear and/or inconsistently followed.9 For example, if an issue is identified during the completion of a preventive maintenance work order, some staff creates a new “corrective maintenance” work order, while other staff adds hours and costs to the current preventive maintenance work order. Such discrepancies make it difficult to evaluate the full impact of the preventive maintenance program.
Additionally, some work may not be tracked at all, particularly at City Hall. According to staff, in some situations – where they believe it would take more time to document the work than to actually do the work – they sometimes opt not to enter some work into the asset management system. Such discrepancies may distort the actual amount of work performed at City Hall.
Other jurisdictions establish procedures to provide consistency in data. Seattle implemented a rule to create a new work order only when it takes more than 15 minutes. Stanford University requires that every new work order is subject to supervisor approval for all work identified in the field.
Other areas for improvement include:
1. Streamlining the number of work order “Type” options. There are currently 28 different “Types” of work, including “Assist,” “Breakdown,” “Inspection,” “Inspection/Testing,” etc. Fewer options would enhance staff’s ability to identify and track trends.
2. Revisiting the asset hierarchy to make it more consistent. There are varying ways to enter the same information. For instance, City Hall may be coded as BLDG-0590 or FAC-0590. In another example, some HVAC assets were defined as equipment in a building and at a level equivalent to the building, thus appearing twice in the system. Consistency would enable better analysis by asset or location.
3. Instituting drop down menus, where possible, can reduce data errors and inconsistency. The San José Airport, which also uses Infor EAM, utilizes drop down and pull down menus for all possible fields, which minimizes data clean up and makes for easier reporting.
Furthermore, Facilities staff must enter and track labor hours and material/contract costs per project in both PeopleSoft and Infor EAM, and also input charge codes in the database and Facilities; sometimes there are discrepancies, which mean support staff spends time reconciling the
9 In An Audit of the Facilities Management Division of the General Services Department issued in August 2003, we also found a need for policies and procedures governing the flow of certain work. The audit’s recommendation to develop and update a procedures manual, and use the manual to advise and train staff, was implemented in December 2003.

Finding 2
21
two sets of records. Implementing dropdowns for valid charge codes will assist maintenance staff charging labor hours to work orders.
4. Updating and checking the validity of labor rates, which were missing for some employees. A cost of $0 appeared for some work orders despite having labor hours booked.
5. Creating mandatory field categories to ensure critical information is entered. Some work orders, presumably for contractors, are marked “Completed” despite no contractor cost or labor booked. This may be related to tedious work order entry.
6. Disaggregating the work order status into more steps in order to provide for more useful analysis. Currently, work orders are “Released” (meaning, received and given to a shop supervisor). The supervisor then assigns it to a staff and once staff completes it, it is marked as “Field Completed.” This obscures the time it takes to assign work, obtain any necessary parts, begin work, and complete work. Other jurisdictions and departments also use “Assigned” and “In Process” statuses to characterize workflow.
7. Utilizing fields correctly. For example, the “inventory” feature of Infor EAM is intended to track parts inventory. However, Exhibit 6 shows that the Department currently uses it to track contractors and their costs.
Exhibit 6: Screenshot of Facilities’ Use of the Parts Inventory to Track Contractors
Source: Auditor screenshot of Public Works’ Infor EAM implementation
These data entry issues make it challenging to create meaningful management reports. For instance, there is no easy way to track those facilities being serviced by contractors, nor analyze how much the material versus contractor costs were per building. Comparing buildings as well as department performance (discussed

Facilities Maintenance
22
in more detail in Finding 4), would highlight those areas in greatest need for updates, repairs or replacements and allow for adjustment in management strategy.
Turnover of Database Administration and Work Order Desk Staffing
The asset database can be challenging to work with. Turnover in the division’s database administrators has added to the difficulty in advancing the system, which was set up by an individual. No data dictionary or documentation of processes exist. According to Public Works’ Technology Services staff, extracting and analyzing information is time-consuming and error-prone, certain fields are customized, and the system was adapted to fit the need of the department at the specific time of its implementation. As staff left, so did the knowledge of the system.
Work Order desk oversight and management has also been inconsistent. In 2012, Work Order desk management was transferred within Public Works, from the Facilities Management Division to the department’s Technology Services Section. It is overseen by a database administrator with support from a Senior Office Specialist (2.0 FTE), and recently two part-time employees have been temporarily added to provide support to the Work Oder desk to address workload and a long term absence.
The Facilities Work Order desk creates a relatively high volume of corrective work orders, about 10,000 annually, with a relatively low number of staff (about 5,000 work orders per FTE, or 20 per day). In comparison, the Airport received approximately 5,500 corrective work orders and is managed by about 1.0 FTE (about 22 per day); whereas RWF receives 3,000 corrective work orders and is run by 3.5 FTE (about 857 work orders per FTE, or 3 per day).
Due to the high work order volume and relatively low staffing levels, staff absences at the Work Order desk greatly affect the number and quality of work orders entered into the database, further highlighting the need to create and document asset management procedures.
In contrast, the Airport’s work order creation process allows all Airport staff to make a work request in Infor EAM, and thus, they input their own information (type and description of request, contact information, etc.). The Airport’s Infor EAM Program Manager then reviews requests and creates a work order. This streamlined process minimizes the amount of time spent by the Program Manager on entering information into Infor EAM and allows more time for prioritizing and assigning work orders.

Finding 2
23
Public Works plans to request additional support staff and resources to assist with the management and operation of the database system. Meanwhile, we believe there are opportunities to continue advancing the system while funding is being sought, such as improving the data entry process as described above, and placing increased management emphasis on improvements to the system. Building on other City staff’s experiences with the system, as described below, may assist with improvements.
Recommendation #4: To improve consistency, Facilities should adopt, document, and train staff on guidelines for asset and work order management (i.e., define minimum threshold for documenting City Hall work, create procedures for commissioning/decommissioning equipment and buildings as well as updating labor rates, simplify work order statuses and data types, and employ drop-down menus).
Improving Portfolio Management Through Increased Management Emphasis and Use of Reporting Tools
The National Academies of Sciences developed best practices in asset management and found that “the usefulness of a facilities asset management system is closely tied to the extent to which an asset management culture has permeated the organization, the quality of data on the asset portfolio, the linkage between the asset management goals and organizational mission, and the skill level of the people involved in the management system.” A heightened level of emphasis on the importance of asset management software from management could result in improvements in portfolio management.
For instance, Exhibit 7 shows the sum of Facilities’ staff labor hours by work order type (i.e., repair, preventive maintenance, or tenant improvement) at libraries and community centers. It shows that Facilities staff charged more hours at Almaden Library and Community Center than Rose Garden, and a majority of maintenance hours were spent on repair-related work. Identifying the direct cause for these repair hours may yield insight into whether equipment or the building is failing, and the tradeoffs of continuing to deploy staff and funding resources to repairs versus upgrades.

Facilities Maintenance
24
Exhibit 7: Facilities’ Staff Labor Hours by Type at Libraries and Community Centers
Source: Auditor analysis of PW’s Infor EAM data for work orders created between July 1, 2011 and June 30, 2014 by class “LIBR,” “PRNSLIBR,” and “PRNS”

Finding 2
25
However, current department practices result in inconsistent and sometimes unreliable data. For example, Old Hillview Library was listed three times in the database:
• BLDG-0094, defined as “Out of Service”
• LOC-0094 (meaning location) and FAC-0094 (“facility”), defined “Not out of service” and classified as a Library
• LOC-0094, “Not out of service,” and unclassified.
As a result, Old Hillview Library was not pulled by our system reports, and thus, it was not part of the geographical analysis shown in Exhibit 7.
According to the Department, there exist challenges in attaining maintenance staff utilization of the software and technology, despite training, resulting in various levels of adoption and integration of the system across staff.
Based on interviews with field staff, reasons for this differ. Some claim the system is slow in the field and some say completing work orders is tedious. There are features in the database to minimize the work required of maintenance staff when tracking labor. For example, the “route” function minimizes the number of work orders staff has to manage on a daily basis, and equally distributes labor hours across all related work orders. This function has proven effective for the Airport. Nonetheless, obtaining accurate, reliable data is essential for any useful EAM.
Additionally, staff told us that during tight fiscal years, when there was a need for every dollar to be tracked, more emphasis was placed on using the database. Labor hours and charge codes were carefully monitored to ensure Facilities did not exceed its budget. Data entry has not been as consistent in subsequent years.
Challenges in staff system adoption are not unique. RWF experienced similar challenges, but noticed a significant improvement after new management began emphasizing the importance of the system. This management emphasis was coupled with weekly trainings and office hours meant to answer staff questions related to use of the system.
Using Data to Improve the Prioritization Process of the Facilities Capital Improvement Program
The capital improvement program is limited in its review of need. Currently, in-house staff, customer departments, and cultural facility operators provide a list of capital needs to Facilities. This list, along with cost estimates and a description of the asset’s history, are compiled and assigned a criticality level of 1 (most critical/imminent failure) through 5 (aesthetic) by Facilities Management. Funding is then sought for the various listed items.

Facilities Maintenance
26
The current process for submitting capital requests does not utilize the asset management system to prepare a systematic evaluation of the tradeoffs for competing resources or identified replacement funds and should be improved in order to accurately calculate the City’s risk. This will provide decision makers with enough information to weigh funding tradeoffs.
Ideally, a facilities capital replacement program has a process in place to gather objective analytical information on facility condition. Best practices in capital maintenance advise creating consistent criteria, and applying weights based on overall organizational objectives. Information collected from the condition assessments can be entered, tracked, and updated in Infor EAM. From this, staff can run reports with updated Facility Condition Index (FCI) assessments based on various parameters, such as the FCI for each building or for each customer department. These reports can be used to model the impact of short- and long-term funding on the condition of a facility or entire portfolio.
Recommendation #5: To enable data-driven decisions, Facilities should increase emphasis on the importance and reliability of its asset management database, and utilize the reporting features of its asset management system to identify failing or costly assets, identify and plan for upcoming fiscal needs, and monitor and track contractor costs.
Sharing Best Practices Across the City’s Infor EAM Users
In the last decade, Public Works, the RWF, and the Airport implemented Infor EAM (then known as Datastream) as a City solution to maintenance management. Since initial implementation, Datastream evolved from a maintenance management system to an enterprise asset management (EAM), which can track the entire enterprise asset portfolio.
Although all the three departments continue to use the asset management system, their investments have varied:
• The RWF’s initial start-up costs to implement Infor EAM were approximately $1.2 million. Its FY 2013-14 service agreement for Infor EAM was approximately $45,000, and it had 3.5 FTE assigned to system maintenance and asset management.
• The Airport, by comparison, incurred start-up costs of $330,000 to implement the system, its FY 2013-14 service fee was about half of RWF’s, at $24,000, and its use of the system was overseen by 1.0 FTE.
• Facilities had signed a three-year support agreement with Infor EAM through August 2015 for $189,112, which is approximately $60,000 per year. Initial purchase, installation, and training for the system was $400,000.

Finding 2
27
Both RWF and the Airport have transitioned to utilizing more of the asset management system’s features and capabilities. For example, the RWF utilizes the Purchase Order function, which automatically generates a purchase order when inventory reaches a certain threshold. Furthermore, they require warranty documents be uploaded for all newly installed equipment.
Initially, Datastream program managers met regularly to coordinate with each other. Today, departments are isolated and communicate infrequently. In our opinion, best practices and lessons learned could be shared across users.
Recommendation #6: To share best practices and lessons learned, administrators of Infor EAM throughout the City should create a working group that meets regularly.
Customer Communication Can Be Improved
Customer departments have varying communication styles with Public Works. Library has a central and informed contact who pre-prioritizes work and appears more satisfied than, say, community centers which have a decentralized reporting system. Additionally, Fire and Police maintain internal work order systems for issue tracking, which seems to duplicate Infor EAM (though these systems are meant for internal communication within those departments). Some City departments, such as Information Technology, allow customer work order tracking. In fact, the Fire Department currently accesses Facilities’ Infor EAM database and tracks work orders.
Facilities’ communication with customer departments is limited and varied. As noted earlier, customers email or call the help desk and place a work request and a work order is created. An email is manually sent to the requestor containing the work order number and the supervisor’s name. It also states,
We aim to address emergency work orders within 24 hours and high priority work requests within 10 working days. Unfortunately, lower priority work orders may take significantly longer, depending on staff availability. Improvement work orders will be handled on a case by case basis and the project manager will contact you to coordinate the schedule.
It does not indicate how the requestor’s work is prioritized nor does it provide an expected timeframe for their request to be completed. The next time the customer may be contacted is upon final completion of the work order (i.e., once the supervisor signs off that the work has been completed by staff, which may be well after the work is completed), where the help desk will send a customer survey. According to the Department, however, there is a small response rate to this satisfaction survey because, at least in part, of email address errors. If the

Facilities Maintenance
28
contact name is the same as that in Outlook, it will send a link to the customer. With turnover, contacts in the system for a certain department may not match Outlook emails.
Based on interviews with customer departments, they are frustrated with a lack of knowledge regarding the status of their work requests. The department has assembled and met with customer department representatives in the form of a Customer Council in June 2013 and April 2014 to solicit feedback from them on a revised prioritization scheme. Customer facility directors we talked to believe that such endeavors are a great first step, and continued communication will help them explain realistic expectations to their department staff.
There are features in Infor EAM that may enhance communication between Facilities and customers, such as email notifications. Other jurisdictions have automatic emails sent to customers as the status of the work order changes. Such communication would likely result in increased transparency and accountability.
Recommendation #7: To improve transparency with customers, Facilities should utilize the automatic email feature of the asset management system.

29
Finding 3 Responses to High Priority Problems and City Hall Are Quick, But Repairs Outside of City Hall Often Take Much Longer
Summary
Facilities Management receives and/or initiates on its own nearly 10,000 repairs each year. Given its limited funding and staffing, it has created priorities and time standards to guide its work. Facilities’ top priority has been and remains addressing health and safety concerns within one day, which it does in nearly all cases. However, it met non-health and safety time standards less than 70 percent of the time. This result was largely driven by its low rate of success meeting the seven-day time standard assigned for most work requests, and by difficulties meeting time standards for work requests outside of City Hall. As a result, we recommend that Facilities should periodically review and revise its prioritization policy and time standards based on its actual results in the field, and that it reconsider the long-standing special service level that City Hall has been afforded compared to all other City facilities under Facilities Management’s purview.
Facilities Management Has Established Priorities and Time Standards to Guide Its Work
Repair work requests are generated by facility users and Facilities staff. From July 1, 2011 to June 30, 2014, Facilities received and/or initiated more than 29,000 work requests/orders for corrective maintenance, building services, operation support, and other miscellaneous help (collectively, we refer to these as “repairs” in the section below).10
Given an annual inflow of nearly 10,000 repair work orders, and in light of limited funding and staffing, Facilities developed priorities and time standards to sequence its work. According to Public Works, work orders are scheduled and prioritized based on: risk to facility user health and safety, the criticality to accomplish the City's mission, site security, preservation of property, and other nuisance and aesthetic concern. Exhibit 8 lists the priorities and time standards in place at the start of the audit, and the number of repair work orders assigned to those priorities over the last three fiscal years.
10 As noted in the Background section of this report, Facilities also created 40,000 preventive maintenance, 2,500 tenant improvement, and 1,000 event support work orders during this period. Finding 1 of this report discussed the improvements Facilities has made in its performance of preventive maintenance. Tenant improvements work orders declined dramatically from over 1,000 in FY 2011-12 to fewer than 500 in FY 2013-14, and the share of Facilities staff time spent on them—as a percent of all hours booked in the asset management system—fell from 21 percent in FY 2011-12 to under 10 percent in FY 2013-14 ,

Facilities Maintenance
30
Exhibit 8: Priorities and Time Standards for Corrective Maintenance, as of March 2014, and Work Orders Created by Priority for FY 2011-12 to FY 2013-14
Priority / Description
Time Standards # of Work Orders Created Response Completion
1 Health and safety 1 day 7 day 1,500 2 Critical non-health and safety 3 day 7 day 2,500 3 Repairs to critical items n/a 7 day 15,500 4 Non-critical n/a 21 day 3,900 5 Date-specific (i.e., to be done by a specific date) n/a n/a 2,400 6 Non-critical n/a 30 day 2,400
Source: Facilities Management documents and auditor analysis of PW’s Infor EAM data for work orders created between July 1, 2011 and June 30, 2014 Note: Another 1,000 repair work orders were created but assigned a priority of “Preventive Maintenance,” which indicates that the repair was identified as a result of preventive maintenance work. This priority did not have an established time standard at the time of the audit.
For performance measurement purposes, Facilities tracks response times for priority 1 and 2 work orders, and its completion times for all other work. It refers to the completion time as its “cycle time.” For both response and cycle times, Facilities measures the number of days that elapse between the date on which an issue is reported and the date on which staff time is either first charged (for response time) or last charged to a work order (for cycle time).
Because health and safety issues are Facilities’ chief concern, the department strives to respond to 100 percent of health and safety work orders within the time standard of 1 day. For the remaining non-health and safety work orders, the department attempts to complete 75 percent within time standards (documented in department operating budgets as a target).
Health and Safety Issues Have Been Addressed Quickly
From July 1, 2011 to June 30, 2014, nearly 1,500 work orders received the highest priority designation (priority 1). Priority 1 work orders pertain to critical work requests that immediately impact facility user health and safety, facility security, or City programs. Exposed wires, the presence of smoke or odors, extreme temperatures, and overflowing plumbing fixtures are examples of issues that should receive a top priority, per internal Facilities documents.
Many City departments and locations were affected by priority 1 issues, including 300 at City Hall, 200 at community centers, 175 at libraries (including facilities shared with community centers), 150 at fire stations, 150 at police buildings, and 100 at parks. Of the 1,500 priority 1 work orders created over the last three fiscal years, 550 were related to electrical issues, another 275 were for heating, ventilation, and air conditioning, and 150 were for plumbing problems.

Finding 3
31
Facilities’ asset management system data show that staff responds quite quickly to such top priority issues. As shown the pie charts in Exhibit 9, three quarters of priority 1 work orders were worked on by staff (rather than by a vendor), and the vast majority (93 percent) of them were timely.11 In fact, nearly 750 of the 950 health and safety work orders that staff labored on had time charged on “day zero”; that is to say, staff booked labor hours in the maintenance management system on the same day an issue was reported in 80 percent of cases.
Exhibit 9: Staff Responded to Nearly all Health and Safety Works Orders Within One Day
Source: Auditor analysis of PW’s Infor EAM data for health and safety work orders created between July 1, 2011 and June 30, 2014, and already in “Completed” status
Note: of the 1,500 priority 1 work orders created in the 3 fiscal years analyzed, 1,300 were marked “Completed”; 75 were marked as “Field Completed” or “Awaiting Invoice” from vendor, but had not been moved by a supervisor to “Completed” status; 75 were in “Released” status indicating work had not yet begun or was in progress; and 50 priority 1 work orders had been cancelled. Contractors are not included in the calculation of timeliness.
For the last five years, the City’s budget has reported that 100 percent of health and safety issues were mitigated timely. After reviewing Facilities’ data and speaking with staff, it is our understanding that the performance reporting in the budget was not based on the data from Infor EAM; rather, it appears to be based on the department’s practice of deploying staff to address such issues promptly.
11 Work orders with zero labor hours booked but marked in “Completed” status were understood to be outsourced.

Facilities Maintenance
32
Non-Health and Safety Time Standards Have Been Met Far Less Frequently, Especially Outside of City Hall
While more than 90 percent of health and safety issues received an initial response within 1 day, less than 70 percent of other work orders were timely over the last 3 years. Exhibit 10 summarizes the number of work orders created by fiscal year and assigned various priority designations, and shows the percentage of them that were completed timely.
Exhibit10: Meeting Time Standards by Priority for FY 2011-12 to FY 2013-14
Priority / Description Time Standard FY 2011-12 FY 2012-13 FY 2013-14* 3-Year Total
# WO % timely # WO % timely # WO % timely # WO % timely
1 Health and safety 1-day response 250 89% 350 99% 350 91% 950 93% Non-Health and Safety
2 Critical non-H&S 3-day response 650 81% 650 72% 450 79% 1,750 77% 3 Repairs to critical items 7-day complete 4,350 67% 3,950 62% 3,200 61% 11,500 64% 4 Non-critical requests 21-day complete 750 87% 1,150 76% 1,100 74% 3,000 78% 6 Non-urgent requests 30-day complete 1,100 74% 500 66% 250 67% 1,850 71%
Non-H&S subtotal 6,850 72% 6,250 66% 5,000 66% 18,100 68% Source: Auditor analysis of PW’s Infor EAM data for repair work orders (i.e., not preventive maintenance, tenant improvements, or event services) created between July 1, 2011 and June 30, 2014, and already in “Completed” status Note: Over the 3 years shown in the table above, there were also about 3,200 repair work orders (in the above priorities) completed without labor being booked, which indicated contractor use. Contractors are not included in the calculations of timeliness. * Because we compiled data in July 2014, some work orders created in late FY 2013-14 were still in progress.
The 7-day Priority Was the Most Frequently Used and Least Frequently Done on Time
As shown in Exhibits 8 and 10, 60 percent of repair work orders received a priority 3 assignment. This priority, described as referring to “repairs to critical items” in Facilities internal documents, has a cycle time expectation of seven days.
Over the last three fiscal years, staff completed 64 percent of these work orders timely – lower than the percentage of work orders completed timely in any other priority with a time standard. In FY 2013-14, the percentage of priority 3 repairs completed timely was just 61 percent. In other words, in FY 2013-14, the seven-day time standard was not met 39 percent of the time, much more than the department’s budgetary target of missing non-health and safety time standards at most 25 percent of the time.
It appears that less timely completion of priority 3 repairs was likely the result of several contributing factors. Obviously, compared to the next lower priority (priority 4 with a 21-day time standard), the seven-day priority is a much more ambitious time standard. Additionally, the performance reflects Facilities’ challenge in balancing workload with its staffing levels. Per the division’s asset management data, only 75 percent of priority 3 work orders show staff booking

Finding 3
33
labor for the first time by the seventh day, and yet almost 30 percent of priority 3 work orders required staff to book labor hours on multiple days. Indeed, outside City Hall, the percentage of priority 3 work orders completed within the time standard falls dramatically as the number of days on which staff books labor increases, as shown in Exhibit 11.
Exhibit 11: Percentage of Priority 3 Work Orders Completed Timely for Facilities Other Than City Hall, by the Number of Days on Which Staff Booked Labor, FY 2011-12 to FY 2013-14
Source: Auditor analysis of PW’s Infor EAM data for seven-day repair work orders (i.e., not preventive maintenance, tenant improvements, or event services) for facilities other than City Hall created between July 1, 2011 and June 30, 2014, and already in “Completed” status
Finally, over-use of the priority may be a factor. The fact that it was the most frequently assigned priority was not surprising given that it had the least explanation in the Work Order Help Desk’s priority cheat sheet: while the document lists many examples of repairs that warrant other priority assignments, the seven-day repair simply says “all repairs required for critical items.” Thus, the seven-day priority level (priority 3) appears to serve effectively as a default.
At the outset of our audit, Facilities drafted a revision to its prioritization policy and time standards, and shared that document with its Customer Council. We believe it is a good practice to periodically review time standards and revise, as necessary, to establish challenging yet reasonably attainable time standards, and keep customers informed. Furthermore, other maintenance organizations, including San José State University’s Facilities Development and Operations, post their service priorities and response timeline online, which further enhances transparency.12
Recommendation #8: To align customer expectations with its capacity, Facilities should periodically review and revise its prioritization policy and time standards based on throughput, cycle times, etc. and continue to share updates with its customer council.
12 San José State University’s Facilities Development and Operations priorities and responses can be found here: http://www.sjsu.edu/fdo/services/priorities/. San José State University’s facilities website also allows users to submit work requests, and check work status, using online forms. In contrast, Facilities intranet website gives employees an email address or phone number for creating work requests.

Facilities Maintenance
34
Long Cycle Times for Buildings Other Than City Hall Kept Them in Need of Repair Longer Than These Buildings Should Be
Earlier, we noted that less than 70 percent of non-health and safety repairs were completed timely over the last three fiscal years, below the division’s target of achieving time standards for 75 percent of these work orders. That overall performance level, however, masks a wide discrepancy between City Hall and all other facilities (sometimes referred to as “citywide”).
As shown in Exhibit 12, over the last three fiscal years, 84 percent of non-health and safety repairs at City Hall were completed timely, compared to just 62 percent for the rest of the buildings under Facilities’ purview.
Exhibit 12: Meeting Time Standards by Location (City Hall and Citywide) for FY 2011-12 to FY 2013-14
Time Standard FY 2011-12 FY 2012-13 FY 2013-14* 3-Year Total
# WO % timely # WO % timely # WO % timely # WO % timely City Hall 2,150 84% 1,800 84% 1,250 82% 5,200 84% Citywide 4,700 66% 4,450 59% 3,750 60% 12,900 62% Total 6,850 72% 6,250 66% 5,000 66% 18,100 68%
Source: Auditor analysis of PW’s Infor EAM data for non-health and safety repair work orders (i.e., not preventive maintenance, tenant improvements, or event services) created between July 1, 2011 and June 30, 2014, and already in “Completed” status
Note: As discussed in Finding 2 in this report, City Hall may be underrepresented in the data because staff may be not recording work that is quick to complete. * Because we compiled data in July 2014, work orders created in late FY 2013-14 were still in progress.
Looked another way, as shown in Exhibit 13, half of all City Hall repairs assigned a non-health and safety priority level were either responded to (in the case of priority 2 work) or completed (for priorities 3, 4, and 6) on the day a problem was identified. The 75 percent target for completing non-health and safety work within time standards was met by day 7 for all priority levels. By comparison, it took 18 days—two and a half weeks—for 75 percent of citywide work orders assigned a seven-day (one week) priority to be completed.
Exhibit 13: Days to Respond/Complete Non-Health and Safety Repairs, by Priority and Location, Over the Last Three Fiscal Years
Priority / Description Time Standard City Hall Citywide
# WO Avg Median 75%ile # WO Avg Median 75%ile 2 Critical non-H&S 3-day response 600 3 0 0 1,150 7 0 5 3 Repairs to critical items 7-day complete 2,500 8 1 7 9,000 18 4 18 4* Non-critical requests 21-day complete 1,550 9 0 3 1,450 29 10 32 6* Non-urgent requests 30-day complete 550 20 0 7 1,300 45 14 48
Source: Auditor analysis of PW’s Infor EAM data for non-health and safety repair work orders (i.e., not preventive maintenance, tenant improvements, or event services) created between July 1, 2011 and June 30, 2014, and already in “Completed” status * Of 2,100 21- and 30-day work orders at City Hall, more than half were for “operation support” or “building services” such as cleaning, picking up or taking items, replacing items, collecting surplus. These types of work requests appear more common at City Hall than at other facilities.

Finding 3
35
The result of the much longer repair timeframes for buildings outside of City Hall is that these buildings are disproportionately in need of repair longer than they should be.
City Hall Has Been Afforded a Special Status for Maintenance and Repair
While the spread out nature of the City’s facilities outside City Hall no doubt contributed to the longer timelines, the stark contrast in responsiveness also reflects long-standing decisions to provide better service to City Hall. City Hall, shown in Exhibit 14, houses thousands employees, hosts City Council and Council Committee meetings, and serves as the main point of contact for residents seeking to obtain building permits, to pay fees and fines, and myriad other services.
Exhibit 14: San José City Hall Tower and Rotunda
Source: City Auditor’s Office
The FY 2006-07 adopted operating budget noted that
City Hall was added to the facility inventory in 2005- 2006. This increased the square footage for which this outcome [Facilities Management] is responsible by 30%. Resources were added to maintain this high profile investment, however, City Hall is unlike any other City facility.

Facilities Maintenance
36
Department staff acknowledged that City Hall receives a higher level of service than other City facilities. The decision to provide a higher level of service at City Hall is reflected in Facilities’ budget allocations as well. City Hall receives a far greater investment in its upkeep than all other buildings, relative to its size. Specifically, in FY 2013-14, Facilities allocated roughly $2.8 million of its budget to maintain City Hall’s 520,000 square feet – or about $5.36 per square foot.13
By comparison, the rest of City buildings under Facilities purview were budgeted $11.5 million (including $2.2 million for preventive maintenance) for 2.25 million square feet, or $5.14 per square foot. While a funding difference of less than $0.25 per square foot may seem small, providing citywide facilities the same level of funding as City Hall would increase the citywide budget by nearly $600,000.
Additionally, it appeared that many work orders for maintenance, building services, and operations support at City Hall were characteristically different than those often requested for repairs at other facilities. For example, we observed thousands of “operation support” or “building services” work requests at City Hall for cleaning, picking up or taking away items, replacing items, collecting surplus, etc. We did not see as many of these requests at other facilities.
Staff mentioned that City Hall’s complexity (elevators requiring extensive, regular service; incredibly large infrastructure under the complex; etc.) will always demand emphasis. However, given the large discrepancy in performance levels and timeliness between City Hall and other City buildings, a review of the relative funding and resources allocated appears warranted.
Recommendation #9: To improve maintenance services at facilities other than City Hall, Facilities Management should redeploy staff designated for City Hall to help serve other facilities, and/or direct more funding and resources to citywide facilities when the budget increases.
13 The total budget of $3.9 million included funding for Audio/Visual Services, City Hall Security, and Special Events Services.

37
Finding 4 Enhanced Performance Reporting May Lead to Quicker Repairs at City Facilities
Summary
Current performance measures and management reports appear too general to identify specific problems in performance. In aggregate, of work orders assigned the most common priority level, the department completed 60 percent on time. However, when we disaggregated data, we found that timeliness varied significantly across the division’s specialized maintenance shops. For example, 82 percent of Plumbing Shop work orders, but only 34 percent of Carpentry Shop work orders, met time standards. Staffing challenges, particularly in the Electrical Shop, contributed to these results, but the data suggest that the division’s average work order also took longer to complete in FY 2013-14 than in previous years. Other jurisdictions report performance at the shop and staff level, and have used data to encourage reduced cycle times. We recommend the department monitor performance at the shop and staff level and report performance to stakeholders to improve transparency and lessen frustration.
Timeliness of Work Orders Outside of City Hall Varied by Shop
As noted in the background section of this report, the division’s citywide (i.e., those facilities outside of City Hall) maintenance and repair services are organized into specialized areas (referred to as “shops”). These shops and their responsibilities include14:
• Carpentry Shop – oversee an array of repairs, including door issues, ceiling tile replacement, windows, as well as cubicle and ergonomic adjustments. Most of work completed is repair work.
• Lock Shop – handles re-keying of facilities, as well as repairs problematic locks, including vehicle locks.
• Paint Shop – manages all aspects of painting projects, including overseeing contractors.
• Plumbing Shop – repairs all plumbing issues, including vandalism and fixture replacement. Most of the work is repairs.
14 Not listed here are the Preventive Maintenance and Contracts shops, whose work is characteristically different than the others, listed above. Preventive Maintenance oversees the PM program, which, as described in Finding 1, spans across shops and is proactive. The Contracts section oversees services that are contracted out to vendors, and they play a project manager/inspector role.

Facilities Maintenance
38
• HVAC – all heating, ventilation, and air conditioning of City buildings. Most of the work orders are preventive maintenance.
• Electrical Services – various electrical issues, from power loss and exposed wires to tripped breakers and decorative lights. Work orders are split between preventive and repair.
Different Approaches to Assigning Work to Shop Staff
The assignment of work orders to maintenance staff varies by shop. For instance, HVAC assigns work based on designated zones – north, central, and south. According to staff, the work order desk is informed daily of staff working in each zone, which allows work to be assigned directly to the mechanic in the appropriate zone.
Conversely, other shops funnel work orders through the supervisor or lead staff. Work orders are then assigned to staff, sometimes based on specialization (i.e., generators or lighting) or customer (i.e., Library or Fire Department). Supervisors told us they also strive to balance workload so that staff members have roughly the same number of work orders in their individual queues. Furthermore, some work orders may remain in the supervisor’s queue so as not to overwhelm staff.
Some Shops Meet Target Timelines While Others Do Not
As discussed in Finding 3 of this report, of the Division’s priority 3 (or 7-day) work orders over the last three fiscal years, 9,000 are “citywide”. Approximately 7,000 of those work orders were assigned to one of the following shops: Plumbing, HVAC, Electrical, Paint, or Carpentry (excluding the lock shop).
In aggregate, approximately 60 percent of these citywide work orders were completed timely. However, achievement of this widely-used time standard varied by shop. As shown in Exhibit 15, Plumbing met the priority 3 time standard most often, completing 82 percent of work orders within 7 days. Carpentry only completed 34 percent of its work orders within 7 days. Electrical, which had over 2,000 work orders over the last three years, completed 53 percent of those within 7 days.
Exhibit 15: Meeting 7-Day Time Standard at Facilities Other Than City Hall, by Shop
Shop FY 2011-12 FY 2012-13 FY 2013-14* 3-Year Total
# WO % timely # WO % timely # WO % timely # WO % timely Plumbing 800 89% 750 87% 700 69% 2,250 82% HVAC 600 61% 650 66% 350 54% 1,600 61% Electrical 950 51% 650 54% 550 55% 2,150 53% Paint 50 53% 50 55% 50 47% 150 51% Carpentry# 250 36% 300 27% 250 40% 800 34%
Source: Auditor analysis of PW’s Infor EAM data for WOs created between July 1, 2011 and June 30, 2014 * Because we compiled data in early July 2014, many WOs created in late FY 2013-14 were still in progress # Excludes the lock shop, which typically has a much faster turnaround. This table also excludes the contracts shop, because the nature of their work is to manage projects (rather than complete the work).

Finding 4
39
Work Orders May Be Taking More Staff Hours Than in Previous Years
As discussed in Finding 3 in this report, more than half of repair work orders over the last three fiscal years were assigned priority 3 (with an expected completion timeline of 7 days). These repairs appear to be taking more staff hours to complete than in previous years (i.e., the average number of hours booked to a work order has increased).
Exhibit 16 displays the percentage of priority 3 work orders completed with fewer than four labor hours charged.15 It shows that in FY 2011-12, the Paint Shop completed 27 percent of its priority 3 work orders with fewer than four labor hours charged. In FY 2013-14, however, only about 5 percent of its priority 3 work orders were able to be completed with less than four labor hours charged. This decline was true for all shops except Plumbing, which completed 94 of its work requests with less than four hours of staff time charged – 8 percent more than in FY 2011-12. According to the Department, a less experienced work force (due to turnover in recent years) may have contributed to the increase in labor hours charged per work order.
Exhibit 16: Percentage of Priority 3 Repairs Completed With Less Than 4 Hours of Staff Time Charged by Shop, FY 2011-12 to FY 2013-14
Shop FY 2011-12 FY 2012-13 FY 2013-14 2-year % change Electrical 58.4% 56.5% 52.4% -6.0% HVAC 43.0% 46.7% 36.4% -6.6% Carpentry 78.3% 74.2% 69.5% -8.8% Plumbing 85.8% 92.3% 94.2% 8.4% Paint 27.0% 21.3% 5.2% -21.8%
Source: Auditor analysis of PW’s Infor EAM data for routine 7-day work orders created between July 1, 2011 and June 30, 2014
Staffing Challenges in Some Shops Have Led to Turnover and Prolonged Vacancies
The Electrical shop noted that persistent vacancies, and challenges filling them, contributed to its slow performance. As of June 2014, there were two Electrician vacancies and one Electrician was acting as Supervisor as well. The Electrical shop has twice as many repair work orders, an average of approximately 50 incoming requests per week, as the other shops. To cope with the large number of work orders it received while short-staffed, the Electrical shop used contractors to complete 30 percent of its repair work over the last three fiscal years, nearly three times the rate of contractor usage by the other shops.
15 Because so many work orders eventually have total labor booked in increments like 3.0 or 4.0 hours, charting the median over time would not highlight trends. Thus, we chose to track the number of work orders completed with fewer than four labor hours charged in order to highlight one potential reason that fewer work orders were completed timely in FY 2013-14 than in prior years.

Facilities Maintenance
40
As in other departments, Facilities faces challenges with recruiting and retention. To address some of these challenges, Facilities utilizes retiree rehires and contractors. The City is also reviewing the Electrician classifications; there may be opportunities for a Facility Repair Worker or low voltage electrician to assist with workloads, allowing Electricians to focus on more complex work orders.
More Specific Performance Reporting Could Help Drive Down Cycle Times
Existing performance reports do not provide sufficient detail to highlight key challenges or provide actionable information for management. Exhibit 17 shows the division’s quarterly dashboard displaying key performance measures reported to the Director’s Office. Similar measures are reported annually to the Budget Office.
Exhibit 17: Example of Facilities’ Quarterly Dashboard
Source: Screenshot of Facilities quarterly dashboard management reports. The department calculates further performance measures at the division-level, which break down performance by City Hall and Citywide. They include an overall average cycle time as well as an average for priority 1 and 2 work orders. Calculations, however, appear to skew results because they may give equal weighting to each priority’s average cycle (or response) time. For instance,

Finding 4
41
average cycle time is calculated by taking the average of each priority’s average cycle time, including the less common priority 1 and 2 work orders that have a much faster response.
Furthermore, it does not appear that the division regularly disaggregates cycle time or average hours booked per work order at the shop-level to identify specific problems in performance. Doing so would allow management to target its attention where most needed for improvement. For instance, as shown above, certain shops met cycle time targets more regularly than did other shops.
Enhanced Reporting and Management Oversight Can Lead to Improved Cycle Times
Other jurisdictions track performance in further detail and have seen improved cycle times as a result. Seattle’s facilities management, for example, extensively monitors performance at the shop and staff level and reportedly decreased its average cycle time from 67 days to 20. It is now aiming for 14 days.
Seattle tracks numerous performance measures disaggregated by shop and by employee. As shown in Exhibits 18 and 19, these management reports include pending work orders by shop, work order age by shop and by work order type, historical trends, and more. This information is shared with shop supervisors and posted for staff to review. According to the Seattle facility management, many individuals did not know their cycle times, so providing such metrics allowed them to see how they were performing against others and increased accountability.
Exhibit 18: Example of Seattle Management Reports - Age and Type of Work Order by Shop
Source: Seattle Facilities Services Division

Facilities Maintenance
42
Exhibit 19: Seattle Management Reports – Graphs of Monthly Average Cycle Times by Shop
Source: Seattle Facilities Services Division
Goal Setting to Minimize Non-Productive Time
An industry expert found that advance scheduling (i.e. setting goals for how much work crews should complete in a week) by the supervisors and attention by management helps increase crew productivity.16
Other research suggests that 60 percent of time is spent on non-productive activities, such as obtaining parts or traveling. Setting expected goals of completion significantly reduces this “non-wrench time” and provides a measurement of whether the number of work orders completed was an adequate rate of productivity. Minimizing this non-productive time is particularly important for San José because due to the size of its portfolio spread across a large geographic area.
Asset Management System Allows for Continuous Monitoring
Both the RWF and Airport have established easy-to-read key performance indicator dashboards, which are tailored to the needs of specific users. Upon signing in to Infor EAM, this user-specific dashboard displays, shown in Exhibit 20, allows the user to easily and continuously monitor the most important operational characteristics under his or her purview.
16 Palmer, R. (2013). The Maintenance Planning and Scheduling Handbook. https://palmerplanning.com/there-is-no-trade-off-between-empowering-and-scheduling/

Finding 4
43
Exhibit 20: Example of a Key Performance Indicator Dashboard at RWF
Source: Regional Wastewater Facility asset management staff
In our opinion, establishing similar sign-on screens with key performance indicators would allow Facilities supervisors and management to monitor work flow and emphasize those aspects, such as cycle times, that are most important. By using performance reports to drive down cycle times, shops could potentially get more work completed.
Customers Are Frustrated by Perceived Untimeliness of Repair Requests
Customers we met with expressed frustration with what they perceived to be inordinate timeframes for completing repairs. They acknowledged that some shops are quicker to respond than others, and in general, work orders requiring the Electrical shop or Carpentry took longer than work orders requiring attention from other shops. Based on our interviews, those frustrations were specifically related to facilities outside of City Hall.
A lack of understanding on work order prioritization also frustrated customers. According to one customer department, “there may be a similar situation at another site, but it takes a couple months for maintenance staff to respond.” As noted in Finding 3 of this report, the division is in the process of re-defining its prioritization process and as part of that, it has requested input from its customer council.
In general, customer departments were satisfied with the quality of work conducted by Facilities. Only once did quality arise as an issue, but it appears to reflect the differing goals of the customer (i.e., having an aesthetic workplace) and the division (i.e., having a functional workplace). According to the Department, the aesthetic nature of work completed is important, but there are different levels that are acceptable depending on whether the building is public-facing or not, and the focus for Facilities is on keeping buildings operational.

Facilities Maintenance
44
Currently, the division occasionally meets with customer department staff to update them on work in progress. We believe sharing current performance levels could also serve to improve transparency and reduce uncertainty on expected timelines.
Recommendation #10: Facilities should monitor performance metrics (response rates, cycle times, etc.) at the shop and individual level, and regularly report shop performance to division managers, supervisors, staff, and customers.

45
Conclusion
The City of San José has a large and diverse portfolio of buildings, most of which are maintained by the Public Works Department. Without sufficient maintenance, facilities deteriorate and eventually fall into disrepair, posing health and safety problems to City staff and residents using the facilities. Despite recent increases, investment levels in facility maintenance do not meet industry standards, and condition assessments with lifecycle cost analyses have not been conducted in a decade. Public Works utilizes an enterprise asset management system that has the capability to manage a large portfolio of assets and optimize the investment in each asset. However, the benefits of the system have yet to be fully realized.
Priorities and time standards guide the department’s workflow through nearly 10,000 repairs annually. The top priority is addressing health and safety concerns within one day, which it does in nearly all cases. However, it met non-health and safety time standards less than 70 percent of the time. Current performance measures and management reports appear too general to identify specific problems in timeliness, but when we disaggregated data we found: (1) a low rate of success meeting the time standard assigned for most work requests, (2) meeting time standards for work requests outside of City Hall to be a challenge, and (3) timeliness varying significantly across the department’s specialized maintenance shops.
RECOMMENDATIONS
Recommendation #1: To enable better asset lifecycle management, Public Works should:
a) identify funding, in coordination with the Manager’s Budget Office, and create a plan to conduct comprehensive condition assessments, including lifecycle cost analyses of City facilities;
b) conduct regular, ongoing condition assessments of City facilities, and
c) provide this information to City Council together with an analysis of the consequences of continuing funding at current versus enhanced levels.
Recommendation #2: To fully institutionalize the City’s preventive maintenance focused strategy, the City Administration should identify ongoing funding for the Preventive Maintenance Program.
Recommendation #3: For effective financial planning and efficient use of existing staff resources, Facilities should create a policy to regularly review building and asset inventory lists to ensure accuracy in the database. This review could be part of the condition assessment program.

Facilities Maintenance
46
Recommendation #4: To improve consistency, Facilities should adopt, document, and train staff on guidelines for asset and work order management (i.e., define minimum threshold for documenting City Hall work, create procedures for commissioning/decommissioning equipment and buildings as well as updating labor rates, simplify work order statuses and data types, and employ drop-down menus).
Recommendation #5: To enable data-driven decisions, Facilities should increase emphasis on the importance and reliability of its asset management database, and utilize the reporting features of its asset management system to identify failing or costly assets, identify and plan for upcoming fiscal needs, and monitor and track contractor costs.
Recommendation #6: To share best practices and lessons learned, administrators of Infor EAM throughout the City should create a working group that meets regularly.
Recommendation #7: To improve transparency with customers, Facilities should utilize the automatic email feature of the asset management system.
Recommendation #8: To align customer expectations with its capacity, Facilities should periodically review and revise its prioritization policy and time standards based on throughput, cycle times, etc. and continue to share updates with its customer council.
Recommendation #9: To improve maintenance services at facilities other than City Hall, Facilities Management should redeploy staff designated for City Hall to help serve other facilities, and/or direct more funding and resources to citywide facilities when the budget increases.
Recommendation #10: Facilities should monitor performance metrics (response rates, cycle times, etc.) at the shop and individual level, and regularly report shop performance to division managers, supervisors, staff, and customers.

APPENDIX A Select Operating Statistics for the Facilities Management Division for Work Orders
Created From July 1, 2011 to June 30, 2014
A-1
Location Square Footage
Work Orders Created* Work Orders Completed* Labor Hours
Charged##
Hours per Work Order
(In-house)
% of Non-Health and Safety Repairs Completed Timely
Preventive Maintenance Repair
Tenant Improvement
Vendor **
In-house
% In-house
City Hall 519,000 2,200 7,608 341 890 7,295 89 27,842 4 84% Citywide
Fire 285,000 8,006 2,744 185 3,226 4,869 60 15,230 3 61% Library# 538,000 6,867 3,471 465 3,224 4,938 60 20,204 4 58% Police 431,000 4,585 2,025 205 1,247 3,648 75 16,039 4 66% Community centers 200,000 4,280 2,592 301 1,956 3,663 65 15,374 4 58% Reuse facilities 165,000 3,195 1,924 194 1,316 2,557 66 12,331 5 59% Visitor services & facilities# 124,000 1,969 1,846 127 869 2,056 70 10,487 5 63% Neighborhood parks 20,000 285 867 52 93 786 89 3,742 5 67% Parking n/a 803 616 64 352 724 67 4,842 7 61% Location undefined# n/a 4,253 3,944 421 1,671 4,896 75 27,724 6 65% Other# 348,000 3,653 1,702 124 882 2,892 77 11,729 4 62%
Source: Auditor analysis of PW’s Infor EAM data for WOs created between July 1, 2011 and June 30, 2014 (because we compiled data in early July 2014, many WOs created in late FY 2013-14 were still in progress) * Work orders created and completed exclude event services. # Library includes joint library-community centers; Visitor services & facilities includes sites such as Happy Hollow and Alum Rock Park; Other includes communication towers, sanitary and storm pumps, some cultural facilities, the Animal Care facility, and some sites for the Environmental Services Department; Location undefined includes buildings that are either unclassified or out of service in Infor EAM, an issue discussed in Finding 2 of this report. ** Based on work orders in “Completed” status without labor charged. ## Approximately 70 percent of all labor hours charged were for repair work orders.

CITYOF~SAN]OSECAPITAL OF SILICON VALLEY
MemorandumTO: Sharon Erickson, City Auditor FROM: David Sykes
SUBJECT: RESPONSE TOTHE 2014 AUDIT DATE: November 12,2014OF PUBLIC WORKS DEPARTMENT'SPROCESS FOR PRIORITIZINGFACILITY MAINTENANCE REPAIRAND IMPROVEMENT PROJECTS
Approved »i{.,,"
Date
The Public Works Department has reviewed the City Auditor's report entitled "The PublicWorks Department's Process for Prioritizing Facility Maintenance Repair and ImprovementProject." We appreciate the professionalism and detailed review of the Facilities ManagementDivision by the City's Auditor Office and we are in general agreement of the recommendations.We look forward to strengthening our service levels, transparency, and customer service throughthis process.
BA:CKGROUND.
The City of San Jose operates and maintains hundreds of buildings and ongoing preventive andcorrective maintenance are required on City owned and operated facilities to ensure safe,reliable, and functional operations.
The Facilities Management Division (Facilities) in the Public Works Department oversees themaintenance and minor repairs of City facilities. Facilities' core service is to "provide safe,efficient, comfortable, attractive, and functional buildings and facilities." Facilities isresponsible for providing service to more than 400 buildings and approximately three millionsquare feet of space, including City Hall, fire stations, police buildings, service yards, libraries,and community centers. These figures exclude certain City buildings maintained by others, suchas the Airport, Regional Wastewater Facility, Convention Center, SAP Center, and most of theCity's cultural facilities. The deferred maintenance backlog for City owned and operatedfacilities maintained by Facilities is over $120 million with an additional $4.6 million neededannually in order to maintain the City's infrastructure in a sustained functional condition. Astatus report on the Deferred Maintenance and Infrastructure Backlog was presented to T&E onMay 5, 2014.
Public Works Department's response to each recommendation is presented below.

HONORABLE MAYOR AND CITY COUNCILNovember 12,2014Subject: Response to Audit of DPW: Process for Prioritizing Fac. Maint. Repairs & Improvement ProjectsPage 2
RECOMMENDATIONS AND RESPONSES
Recommendation #1: To enable better asset lifecycle management, Public Works should:(a) Identify funding, in coordination with the Manager's Budget Office, and create a planto conduct comprehensive condition assessments, including lifecycle cost analyses of Cityfacilities;(b) Conduct regular, ongoing condition assessments of City facilities, and(c) Provide this information to City Council together with an analysis of the consequencesof continuing funding at current versus enhanced levels.
Public Works Response to Recommendation #1: The Department agrees with thisrecommendation. Recent funding augmentations have been focused on catching up withpreventative maintenance objectives. Moving forward, the Department will develop a plan inconjunction with the ESCO Project and, in light of the City's budget condition and other citywide and departmental funding priorities for 2015-2016, a potential budget proposal to fundlifecycle analyses for all City facilities; the goal is to complete all analyses within five years.Over the past few years, a limited number of assessments have been performed including twentyfulllifecycle analyses prepared by an outside consultant, primarily for cultural facilities operatedand maintained by non-City employees. In addition, ongoing condition assessments were beingprogrammed as funding became available. A full lifecycle analysis was recently completed bystaff for the Susan and Phil Hammer Repertory Theatre. The Department will be providingfunding scenarios and infrastructure updates to the City Council through the normal budgetprocess and the annual Deferred Maintenance and Infrastructure Backlog report.
Recommendation #2: To fully institutionalize the City's preventive maintenance focusedstrategy, the City Administration should identify ongoing funding for the PreventiveMaintenance Program.
Public Works Response to Recommendation #2: The Department agrees with thisrecommendation. Despite the General Fund's budget challenges, because the PreventativeMaintenance Program has been a city-wide funding priority, for the past three years both onetime and ongoing funding has been identified for this program and, as of 2014-20 15, $1.3million ofthe $1.8 million program has now been authorized as ongoing funding in the budget.In addition, Facilities has been successful in transforming the Preventive Maintenance Programinto a highly successful program with over 80% of work orders completed on-time. In light ofthe City's budget condition and other city-wide and departmental funding priorities for 20152016, the Department will continue to work with the City Manager's Budget Office to fund thisprogram with as much ongoing funding as possible. Overall, continuation of program fundingwill allow the Department to continue to provide the necessary resources and staffing levels toensure the Preventive Maintenance Program is successful in maintaining and extending theCity's building inventory assets.

HONORABLE MAYOR AND CITY COUNCILNovember 12,2014Subject: Response to Audit of DPW: Process for Prioritizing Fac. Maint. Repairs & Improvement ProjectsPage 3
Recommendation #3: For effective financial planning and efficient use of existing staffresources, Facilities should create a policy to regularly review building and asset inventorylists to ensure accuracy in the database. This review could be part of the conditionassessment program.
Public Works Response to Recommendation #3: The Department agrees with thisrecommendation. Facilities is in the process of developing a comprehensive citywide buildingand asset inventory and will incorporate that information into the lnfor EAM program. Oncefully updated, each shop supervisor will develop an on-going citywide condition assessmentschedule.
Recommendation #4: To improve consistency, Facilities should adopt, document, and trainstaff on guidelines for asset and work order management (i.e., define minimum thresholdfor documenting City Hall work, create procedures for commissioning/decommissioningequipment and buildings as well as updating labor rates, simplify work order statuses anddata types, and employ drop-down menus).
Public Works Response to Recommendation #4: The Department agrees with thisrecommendation. Facilities will continue to host regular training sessions for new andexperienced staff on proper use of the work order procedures and guidelines. Facilities isdeveloping procedures to commission and decommissioning facility assets. The Department willmodify the Infor EAM application and will explore opportunities to create and utilize drop-downmenus. Facilities will increase communication with staff to share statistical data by shop andrelevant performance metrics to evaluate overall performance levels.
Recommendation #5: To enable data-driven decisions, Facilities should increase emphasison the importance and reliability of its asset management database, and utilize thereporting features of its asset management system to identify failing or costly assets,identify and plan for upcoming fiscal needs, and monitor and track contractor costs.
Public Works Response to Recommendation #5: The Department agrees with thisrecommendation. The Department is actively involved in making the necessary changes tooptimize the Infor EAM capabilities as well as developing funding and staffing strategies toimprove overall performance. Upgrading and maintaining the existing Infor EAM system is a toppriority for the Department. The quality of the information is dependent upon collecting andreporting useful, accurate and timely data on our assets (e.g., age, condition, performance,maintenance, cost and replacement value). Optimizing the capabilities of the system isparamount on all levels and in doing so will allow us to process data in a way that helps us tomake better decisions on how we manage our assets.
HONORABLE MAYOR AND CITY COUNCILNovember 12,2014Subject: Response to Audit of DPW: Process for Prioritizing Fac. Maint. Repairs & Improvement ProjectsPage 4
Recommendation #6: To share best practices and lessons learned, administrators of InforEAM throughout the City should create a working group that meets regularly.
.Public Works Response to Recommendation #6: The Department agrees with thisrecommendation. The Department is in the process of re-establishing a working group withEnvironmental Services and Airport departments, the two primary departments that havetechnical staff managing Infor EAM, to share best practices and lessons learned and to fullymaximize the functionality of Infor EAM. The first meeting is scheduled for December 2014.
Recommendation #7: To improve transparency with customers, Facilities should utilize theautomatic email feature of the asset management system.
Public Works Response to Recommendation #7: The Department agrees with thisrecommendation. Currently customer service emails are transmitted to the requester after a workorder has been completed. To improve response rates and accuracy the Department will berevamping the customer service email surveys by adding more specific information so that thecustomer has a clear understanding of the services rendered. Additionally, the Department isevaluating and will employ status updates on generated work orders from client departments.
Recommendation #8: To align customer expectations with its capacity, Facilities shouldperiodically review and revise its prioritization policy and time standards based onthroughput, cycle times, etc. and continue to share updates with its customer council.
Public Works Response to Recommendation #8: The Department agrees with thisrecommendation. Two annual meetings have been held and the next annual meeting will bescheduled in spring 2015 with the Customer Council. For the next annual meeting, Facilitieswill be sharing more data, including cycle times for each priority and each trade (e.g. carpentry,electrical, HVAC, paint, and plumbing). In addition, a thorough review of the PrioritizationPolicy will be discussed to determine if timelines and priorities need to be adjusted to reflectcurrent and desired outputs.
Recommendation #9: To improve maintenance services at facilities other than City Hall,Facilities Management should redeploy staff designated for City Hall to help serve otherfacilities, and/or direct more funding and resources to citywide facilities when the budgetincreases.
PublicWorks Response to Recommendation #9: The Department agrees with thisrecommendation. City Hall work orders are quicker to respond to because staff is located at CityHall, thus travel time is eliminated. To maximize resources and reduce travel times all workorders for the 4th Street Garage (Employee Garage) including the Department of Transportation'sfield offices located at the Employee Garage and the 4th and San Fernando Garage including theSummit Center will be assigned to City Hall Facilities staff.

HONORABLE MAYOR AND CITY COUNCILNovember 12,2014Subject: Response to Audit of DPW: Process for Prioritizing Fac. Maint, Repairs & Improvement ProjectsPage 5
Recommendation #10: Facilities should monitor performance metrics (response rates, cycletimes, etc.) at the shop and individual level, and regularly report shop performance todivision managers, supervisors, staff, and customers.
Public Works Response to Recommendation #10: The Department agrees with thisrecommendation. Facilities is developing updated performance metrics by utilizing Infor EAMprogram. Performance metrics, such as customer satisfaction, cycle times, response rates, andshop performance will be shared at all levels of the organization. Quality performance metricsallow for the distribution of meaningful data for trending, rate-of-change analysis and overallperformance.
CONCLUSION
The audit provided us with an in-depth Facilities analysis, it identified areas of concerns, and ithighlighted funding challenges. The Department will be developing a comprehensiveimplementation strategy and developing funding scenarios for possible future budgetconsideration in order to enhance facility assets. The Department is confident that withadditional resources in the future and improved customer outreach that service levels willsubstantially improve and greater transparency will be recognized by our client departments.
The Department of Public Works would like to thank the City Auditor's Office for conductingthis audit.
/s/
DAVID SYKESDirector of Public Works
For questions please contact Joe Garcia, Deputy Director, at (408) 535-1298.