Embed Size (px)
Citation preview
research papers
Acta Cryst. (2016). D72, 413–420 http://dx.doi.org/10.1107/S2059798316001042 413
Received 24 July 2015
Accepted 18 January 2016
Keywords: ESRF; MAD; experimental phasing;
MXCuBE2.
Facilitating best practices in collecting anomalousscattering data for de novo structure solution at theESRF Structural Biology Beamlines
Daniele de Sanctis,* Marcus Oscarsson, Alexander Popov, Olof Svensson and
Gordon Leonard
ESRF – The European Synchrotron, 71 Avenue des Martyrs, 38000 Grenoble, France. *Correspondence e-mail:
The constant evolution of synchrotron structural biology beamlines, the viability
of screening protein crystals for a wide range of heavy-atom derivatives, the
advent of efficient protein labelling and the availability of automatic data-
processing and structure-solution pipelines have combined to make de novo
structure solution in macromolecular crystallography a less arduous task.
Nevertheless, the collection of diffraction data of sufficient quality for
experimental phasing is still a difficult and crucial step. Here, some examples
of good data-collection practice for projects requiring experimental phasing are
presented and recent developments at the ESRF Structural Biology beamlines
that have facilitated these are illustrated.
1. Introduction
The constantly increasing number of macromolecular crystal
structures deposited in the Protein Data Bank (PDB; Berman
et al., 2007), the increasing number of protein folds that these
contain and the advent of more sensitive methods (McCoy et
al., 2007; Read, 2001; DiMaio et al., 2011) has meant that
molecular replacement (MR) is the overwhelming choice for
structure solution in macromolecular crystallography (MX).
However, the solution of the crystal structures of biological
macromolecules of unknown fold and of large protein–protein
or protein–nucleic acid complexes still often requires experi-
mental phase determination. Most experiments for de novo
structure determination routinely exploit anomalous scat-
tering via the multiwavelength anomalous dispersion (MAD;
Smith, 1991; Hendrickson, 1991) or single-wavelength anom-
alous dispersion (SAD; Rice et al., 2000; Dauter, 2002; Dauter
et al., 2002) techniques. Such experiments are facilitated by the
almost continuous evolution of tunable synchrotron beamlines
at which experimenters are able to accurately measure the
absorption edges of almost any anomalous scatterer that can
be introduced into a crystal and to collect diffraction data at
various energies around these in order to optimize anomalous
and dispersive signals.
When carried out on a single cryocooled crystal, MAD and
SAD experiments, in principle overcome the problems of
non-isomorphism that can plague isomorphous replacement
experiments. Nevertheless, in experiments where anomalous
signals are small (i.e. S-SAD; Hendrickson & Teeter, 1981;
Dauter et al., 1999; Liu & Hendrickson, 2015; Weinert et al.,
2015) care must be taken to reduce systematic errors and,
most of all, errors introduced by radiation damage. Radiation
ISSN 2059-7983

damage is exacerbated in MAD/SAD experiments because it
not only results in a decrease, as a function of absorbed X-ray
dose (Seltzer, 1993; Holton, 2009), in the resolution to which
a crystal diffracts, it also causes specific chemical damage
including disulfide-bond breakage (Weik et al., 2000; Leiros
et al., 2001; Ennifar et al., 2002), changes in electronic state
(Berglund et al., 2002; Schlichting et al., 2000) and, very
importantly, reduction in the ‘occupancy’ of anomalous scat-
terers (Ramagopal et al., 2005; Evans et al., 2003; Ravelli et al.,
2005). Moreover, specific radiation damage of the types
mentioned above may already occur at doses much lower than
the Garman Limit (Owen et al., 2006). Sometimes the effects
of radiation damage can be used to an experimenter’s
advantage, as in radiation-damage-induced phasing (RIP;
Ravelli et al., 2003; de Sanctis & Nanao, 2012) or in the
modelling of the reduced occupancy of heavy atoms (Schiltz et
al., 2004). However, there are often limitations to the use of
such approaches on a systematic basis and, unless this is
intentional, it is advisable to minimize radiation damage as
much as possible. Here, we briefly describe data collection
strategies aimed at reducing both systematic errors and
radiation damage during MAD/SAD experiments and
describe how such strategies can best be put into practice at
the ESRF Structural Biology Beamlines.
2. ESRF MAD Structural Biology Beamlines
The ESRF operates three tunable-wavelength endstations
each covering the energy range 6–20 keV: ID23-1 (Nurizzo et
al., 2006), ID29 (de Sanctis et al., 2012) and ID30B (Mueller-
Dieckmann et al., 2015). The three stations are equipped with
similar diffractometers, MD2 (a microdiffractometer; Arinax,
Moirans, France; Perrakis et al., 1999), MD2M (a mini-
diffractometer; Arinax, Moirans, France) and MD2S (a
microdiffractometer for screening; Arinax, Moirans, France),
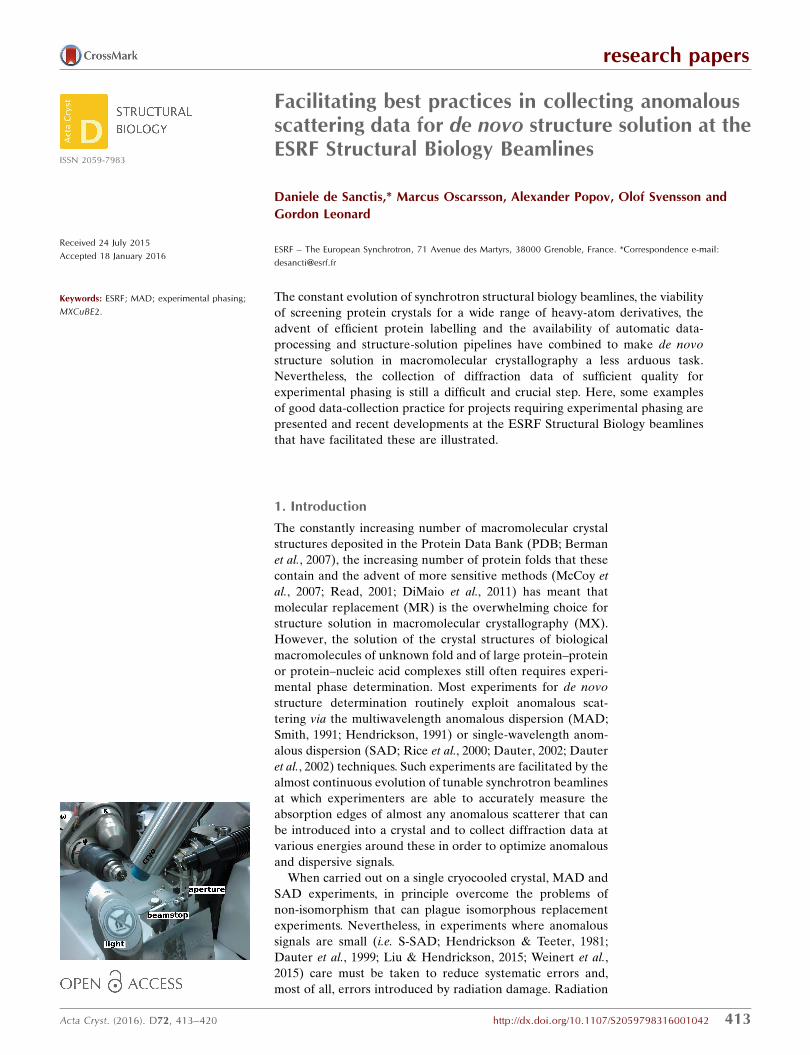
all with on-axis sample visualization. ID23-1 and ID29 have a
fixed focal spot size at the sample position and are equipped
with beam-defining apertures which allow tailoring of the
X-ray beam size to a minimum dimension of 10 mm in
diameter (Fig. 1). ID30B offers a variable beamsize at the
sample position ranging from 20 to 200 mm. All three
endstations share a similar data-collection geometry (! axis
for oscillation scans horizontal and perpendicular to the X-ray
beam) and are equipped with MK3 minikappa goniometers
(Brockhauser et al., 2013) for crystal realignment and
research papers
414 de Sanctis et al. � Best practices in collecting anomalous scattering data Acta Cryst. (2016). D72, 413–420
Figure 1Close-up view of the sample environment on ID29 at the ESRF.Goniometer motors and main components are labelled.
Figure 2(a) Detail of the MXCuBE2 interface. The active centred position ismarked in lime and other saved positions are marked in yellow. Toactivate a saved position it is sufficient to click on it and multiple positionscan be simultaneously activated. (b) Detail of the queue of MXCuBE2. Inthe example shown a two-wavelength MAD (peak and inflection) data setis to be collected, with each data set collected from a different savedposition of the sample 1:5 FAE-g5.

fluorescence detectors for the measurement of absorption-
edge scans, which are carried out at the click of a button and
are automatically analysed with CHOOCH (Evans & Pettifer,
2001) for the determination of anomalous scattering factors
around the absorption edge end and of ‘peak’ and ‘inflection-
point’ energies.
3. The MXCuBE2 concept
User control of experiments on ID23-1, ID29 and ID30B is,
as for all of the ESRF facilities for MX, via the MXCuBE2
(http://www.esrf.eu/mxcube2 and https://github.com/mxcube)
graphical user interface (GUI), the full functionality of which
will be presented elsewhere (Oscarsson et al., in preparation).
Briefly, MXCuBE2, the successor to MXCuBE (Gabadinho et
al., 2010), has been designed to simplify the planning and
execution of MX experiments via a single, integrated and
intuitive interface, which facilitates the carrying out of
experiments with elaborate data-collection strategies by
minimizing error-prone iterative manual intervention. Two
main aspects of MXCuBE2 are relevant for experiments
exploiting anomalous scattering in de novo crystal structure
determination: firstly, MXCuBE2 relies on the concept of
‘saved positions’ for data collection from any given sample
(Fig. 2). Each saved position can be assigned a series of data
collections to build up any complex data-collection scheme.
Secondly, the MXCuBE2 data-collection queue can be
prefilled by expert experimental descriptors, such as EDNA
(Incardona et al., 2009) and workflows (Brockhauser et al.,
2012) that automate data collection and analysis.
4. Good data-collection practice as implemented inMXCuBE2
4.1. Calculation of data-collection strategies
Calculation of a suitable data-collection strategy is among
the ‘good practices’ handed down by crystallographers
(Dauter, 1999; Flot et al., 2006). Typically, the goal is to
determine the minimal angular range and a convenient oscil-
lation range (slicing) and to ensure that complete data with
the desired multiplicity are collected. To ensure the calcula-
tion of optimal data-collection strategies at ESRF MX
beamlines, the EDNA pipeline (Incardona et al., 2009) is used
via the MXCuBE2 ‘Characterization’ tab. The successor to
DNA (Leslie et al., 2002), EDNA has been developed to take
advantage of the evolution of software such as LABELIT
(Sauter et al., 2004), BEST (Bourenkov & Popov, 2010) and
RADDOSE (Paithankar & Garman, 2010) to produce data
collection strategies which take into account global radiation
damage. Crystal symmetry is determined from two or four
diffraction images using either LABELIT or MOSFLM; X-ray
dose is calculated in RADDOSE, assuming an ‘average’
crystal composition, using the energy of the incident beam,
photon flux and beam size, which are automatically provided
by MXCuBE2, and the dimensions of the crystal under study
(Fig. 3). The dose is subsequently used in BEST to propose a
diffraction plan, which is added, in the form of a new data
collection, to the MXCuBE2 queue (Fig. 2). Crystal size can be
measured directly from the sample view using a dedicated tool
that converts lengths measured in pixels to micrometres. Users
can also specify their requirements for data collection, such as
preferred angular range or desired multiplicity, request an
‘anomalous strategy’ (Bourenkov & Popov, 2010; Fig. 3b) and,
if necessary, modify the parameters of the proposed strategy.
For experiments aimed at de novo structure solution, the
collection of highly redundant data is often advisable, and this
becomes even more relevant when weak anomalous signals
are to be exploited (Dauter & Adamiak, 2001; Cianci et al.,
2008; Akey et al., 2014; Weinert et al., 2015; Liu &
Hendrickson, 2015).
4.2. Crystal reorientation
Most MX beamlines at third-generation synchrotron
sources are equipped with a single-axis goniometer to achieve
high mechanical stability (Fig. 1), a requirement that has
become particularly relevant since the advent of microfocus
and microbeam beamlines (Flot et al., 2010; de Sanctis et al.,
2012). However, when exploiting anomalous scattering in MX
the use of a single-axis goniometer presents clear limitations
for experiments designed to reduce systematic errors by either
measuring the ‘true multiplicity’ (i.e. the multiplicity obtained
by recording reflections from multiple different crystal
research papers
Acta Cryst. (2016). D72, 413–420 de Sanctis et al. � Best practices in collecting anomalous scattering data 415
Table 1Data-collection and processing statistics for data sets collected from arandom orientation and with c* aligned with the rotation axis using theMK3 device.
Data were cut at 3.5 A resolution to properly compare the anomalous signal inthe two data sets. No indication of global radiation damage, such as an increasein the unit-cell volume or in the overall B factor, is observed in the data.Values in parentheses are for the outer shell.
Random � (c*)
Beamline ID29 ID29Wavelength (A) 0.9791 0.9791Temperature (K) 100 100Detector Pilatus3 6M Pilatus3 6MData-collection time (s) 50 44Photon flux (photons s�1) 3.5 � 1011 4.5 � 1011
Crystal-to-detector distance (mm) 429.2 463.1Rotation range per image (�) 0.05 0.1Total rotation range (�) 80 80Space group P41212 P41212Unit-cell parameters (A) a = b = 111.38,
c = 65.40a = b = 111.58,
c =65.59Mosaicity (�) 0.060 0.064Resolution range (A) 40–3.5 (3.83–3.50) 40–3.5 (3.83–3.50)Total No. of reflections 30994 (7365) 30586 (7637)No. of unique reflections 5505 (1291) 5500 (1285)Completeness (%) 99.5 (100) 98.6 (97.9)Multiplicity 5.6 (5.7) 5.4 (5.5)hI/�(I)i 36.8 (26.1) 49.4 (38.4)Rr.i.m.† 0.040 (0.064) 0.032 (0.039)ISa 31.04 31.52DelAnom 0.771 (0.448) 0.852 (0.804)Mid-Slope of Anom. Normal
Probability2.564 3.936
† Rr.i.m. =P
hklf1=½NðhklÞ � 1�g1=2 Pi jIiðhklÞ � hIðhklÞij=
Phkl
Pi IiðhklÞ.

orientations) or orienting a specific unit-cell axis parallel to
the ! rotation axis so that Friedel mates can be measured on
the same diffraction image. To overcome this limitation, ESRF
tuneable beamlines are equipped with MK3 minikappa
goniometers (Brockhauser et al., 2013) that allow crystal
reorientation, while sample rotation is performed around !(see Fig. 1 in Brockhauser et al., 2013). Truly redundant data
can straightforwardly be obtained by combining data sets
collected from the same crystal at different � angles. In this
way, equivalent reflections are recorded on a different area of
the two-dimensional detector and with different X-ray path
lengths through the sample. MXCuBE2 facilitates such
experiments by allowing the creation of a queue of data
collections, from the same or from different positions in a
crystal, at different, user-defined
� angles. A more complicated use
of the functionality of the MK3
consists of reorienting the crystal
so that an evenfold rotation axis
of the unit-cell point group is
oriented parallel to the ! rotation
axis (Fig. 4). This allows the
collection of both reflections in a
Friedel pair on the same diffrac-
tion image, thus ensuring that
they are measured at the same
time and after the crystal has
suffered the same X-ray dose.
Calculating the � and ’ angles
required for such a reorientation
can be a complicated task that is
beyond the scope of even
experienced experimenters, as it
requires knowledge of the beam-
line hardware configurations and
limits. However, this procedure
has been automated in the ‘kappa
reorientation’ workflow (Brock-
hauser et al., 2012) directly inter-
faced with MXCuBE2. In this
workflow, two 1� oscillation
images collected 90� apart in ! at
� = 0� are used to identify the
crystal Bravais lattice and calcu-
late a crystal orientation matrix in
the laboratory frame. Subse-
quently, the STAC server
(Brockhauser et al., 2013) calcu-
lates the � and ’ angles that align
an evenfold axis parallel to !.
Once the crystal has been reor-
iented, the user centres the
sample in the X-ray beam, a data-
collection strategy for the
optimum collection of anomalous
data is then calculated with
EDNA and, upon the approval of
the experimenter, executed. In
Table 1 we report data-collection
statistics from a crystal of the
selenomethionine-derivative of
the feruloyl esterase module of
xylanase 10B from Clostridium
thermocellum (Prates et al., 2001;
research papers
416 de Sanctis et al. � Best practices in collecting anomalous scattering data Acta Cryst. (2016). D72, 413–420
Figure 3(a) MXCuBE2 displays the photon flux incident on the sample in photons per second. The value is adjustedwhen changing the beam-defining aperture. This value and the beam size are given to EDNA to allow anestimation of the dose rate deposited on the crystal when calculating data-collection strategies. (b) Panelfor EDNA characterization. Besides information on the data path and file name, users can adjust thecomplexity of the data collection (as in BEST; Bourenkov & Popov, 2010), request a specific strategy foranomalous data collection by opting for ‘Optimize SAD’ (Bourenkov & Popov, 2010) and specify thecrystal dimensions and space group, if already known. (c) Inverse beam is provided as an additional optionfor ‘standard data collection’, in which the number of frames composing each subwedge (in this case ten)for the two data sets to be collected is defined. (d) Interleaved MAD workflow interface: up to four energiescan be interleaved and frames can optionally be recorded in inverse-beam geometry. (e) Workflow interfacefor �-angle reorientation: the anomalous strategy aims to align an evenfold axis parallel to !. Possible �strategies are described in Brockhauser et al. (2013).

PDB entry 1gkk) obtained in space group P42212. Two data
sets were collected from different positions of a single crystal.
The first data set was collected with the crystal in a random
orientation, as harvested in the nylon loop, and the second
with the c* axis aligned parallel to !. In both cases the data-
collection strategies were as recommended by EDNA/BEST.
As can be seen, reorientation along the c* axis results in a
larger anomalous signal (‘DelAnom’ and ‘Mid-Slope of
Anom. Normal Probability’ in Table 1), despite very similar
total doses being used to collect data sets with very similar
completeness and multiplicity.
4.3. Inverse-beam data collection
Although the MK3 is an extremely useful device for
aligning crystals during MAD/SAD experiments (see above)
or for aligning crystals such that a long unit axis is parallel to
!, a combination of unfortunate crystal orientation inside the
sample loop and the limited (24�) � opening angle of the MK3
may mean that the reorientation required is out of reach. In
such cases it may well be desirable in MAD/SAD experiments
to ensure the collection of both reflections in a Friedel pair
close together in time and in X-ray dose by resorting
to inverse-beam geometry (Hendrickson et al., 1985; Dauter,
1997; Fig. 5). In an inverse-beam experiment the two reflec-
tions in a Freidel pair are collected at rotation angles ! and !+ 180�, respectively, and an inverse-beam geometry experi-
ment consists of subdividing the total angular range to be
collected into two data sets 180� apart in ! and collecting
them, often broken down into ‘subwedges’, in sequence
(Figs. 3c and 5). The beamline-control software takes care of
the correct starting angles, image and run numbering for each
data set. The two data sets sets are processed separately and
then scaled together to provide the final data set. Although,
to our knowledge a systematic study on the beneficial use of
inverse-beam geometry is not available, many examples of
successful phasing experiments using this technique have been
reported in the literature (Liu et al., 2012, 2013; Akey et al.,
2014).
4.4. Interleaved MAD data collection
In the early days, MAD experiments were complicated and
required intervention from the local staff to properly prepare
the beamline (i.e. change the
energy and realign the beamline
optical components and sample
environment) at each wavelength
at which MAD data were
collected. The degree of automa-
tion achieved during the last
decade at the ESRF MX beam-
lines (Arzt et al., 2005) and at
other synchrotrons worldwide
(Soltis et al., 2008; Stepanov et al.,
2011; Cork et al., 2006) has
simplified and stabilized the
operation of tunable MX beam-
lines to the extent that energy
changes during MAD experi-
ments are now almost transparent
to the user. This increase in user-
friendliness has allowed users to
concentrate on the optimization
of experiment design, which is
particularly relevant when
extracting small anomalous
signals for de novo structure
solution or when samples are
sensitive to radiation damage. As
already noted, MXCuBE2 is
designed to allow the modular
assembly of data-collection
protocols and gives the opportu-
nity to build the experiment
sequences. One such experiment
sequence available as a
workflow in MXCuBE2 and in
which subwedges of complete
research papers
Acta Cryst. (2016). D72, 413–420 de Sanctis et al. � Best practices in collecting anomalous scattering data 417
Figure 4Effect of the alignment of a rod-like crystal along one of its evenfold symmetry axes, starting from (a) arandom orientation, the result of the harvesting from the crystallization drop, to (b) a final reorientationwith, in this case, c* parallel to !.

diffraction data sets are alternately collected at different
energies is ‘interleaved MAD’ (Finke et al., 2016), a protocol
which ensures that the dispersive differences between the
same reflections in different data sets are minimally affected
by X-ray damage. To demonstrate the ease of carrying out
such a data-collection protocol, we collected, from two
different positions of the same crystal of the feruloyl esterase
module of xylanase 10B from C. thermocellum (Prates et al.,
2001) obtained in space group P212121, a ‘classic’ two-wave-
length MAD data set and a MAD data set in which the
collection of data at the two wavelengths was interleaved by
10� subwedges. The resulting data processing statistics are
reported in Table 2 and show the individual data sets to be of
similar quality. The interface for the ‘interleaved MAD’
workflow permits interleaving of the collection of MAD
diffraction data at up to four different energies and, further-
more, can be used in combination with inverse-beam geometry
(Fig. 3d). Evolution of the workflow to provide new inter-
leaving protocols is straightforward and can easily be imple-
mented. For example, interleaving of the collection of
diffraction data at different detector distances or � angles, for
example, which should reduce systematic detector errors or
compensate for suboptimal absorption correction at lower
energy, is accessible by just
building the desired data-
collection sequence in the
MXCuBE2 GUI.
4.5. Multi-positional datacollection
The advent of microfocus (Flot
et al., 2010) and microbeam (de
Sanctis et al., 2012) endstations
dedicated to MX allows the
measurement of diffraction data
from smaller samples and maxi-
mizes signal-to-noise ratios by
matching beam and crystal sizes
or the scanning of a larger crystal
to find its best diffracting area
(Sanishvili et al., 2008; Bowler et
al., 2010). Microbeams also allow
the collection of diffraction data
from different parts of crystals
larger than the X-ray beam.
MXCuBE2 allows users to centre
different positions of large crys-
tals in the X-ray beam, to save
and store these positions and to
link each position with a series of
data collections (Fig. 2). In this
way, it is possible to sequentially
collect multiple data sets from the
same sample. This functionality
enables different possible strate-
gies: by collecting complete data
sets at different positions it is possible to increase multiplicity
while escaping radiation damage; for highly radiation-
sensitive samples partial data sets can be collected at each
position and merged to produce a single complete data set to
higher resolution than might otherwise have been the case; in
MAD experiments data sets at different energies can be
collected from different positions of the same crystal. This
data-collection method is fully exploited in the MeshAnd-
Collect data-collection workflow (Zander et al., 2015), in which
the positions of micrometre-sized crystals are identified by
diffraction and automatically saved and a partial data set is
collected at each centred point. While MeshAndCollect
completely automates the procedure, beamline users can
optically select the centring positions and define a data
collection plan for each of them. The same rationale can be
applied when collecting data sets at different wavelengths to
perform MAD/SAD phasing experiments. In fact, although
SAD phasing has become extremely popular (also thanks to
the improvement in phasing and density-modification soft-
ware), the fast performance of pixel detectors and beamline
automation nowadays allows a second data set to rapidly be
collected at another energy to obtain experimental phases of
much higher quality (Gonzalez, 2003). In order to avoid
research papers
418 de Sanctis et al. � Best practices in collecting anomalous scattering data Acta Cryst. (2016). D72, 413–420
Figure 5Inverse-beam data collection allows the measurement of reflections in a Friedel pair close together in timeby alternately collecting diffraction images at ! (left) and ! + 180� (right).

contamination with radiation damage in the second (or a third
or subsequent) data set, it would be advisable to collect each
data set from an undamaged volume (Fig. 2b). A caveat when
applying such strategies is that the diffraction quality over the
length and/or area of a crystal can often be heterogeneous
(Sanishvili et al., 2008; Bowler et al., 2010); the recommenda-
tion would then be to characterize each position (using
EDNA/BEST) to make sure that the crystal quality is uniform.
For the reason above, although the execution of helical (Flot et
al., 2010) or vector (Pothineni et al., 2014) data collections is
routinely available in MXCuBE2, these must be carefully
pondered before they are carried out.
5. Conclusions
Experimental phasing by anomalous dispersion techniques are
the most successful and common ab initio methods for struc-
ture determination. The success of an anomalous dispersion
experiment strongly relies on the data quality, and this
becomes more significant when small anomalous signals are
expected. In such circumstances, experiment design and the
tools to perform experiments play a major role. Here, we have
presented a list of the most common ‘best practices’ to be used
in the collection of high-quality diffraction data for use in
MAD or SAD experiments. MXCuBE2, the experiment-
control GUI available at the ESRF Structural Biology
Beamlines, facilitates these by a number of different means.
MXCuBE2 allows the use of EDNA, RADDOSE and BEST
to propose data-collection strategies that take into account
crystal decay caused by radiation damage, it allows the
straightforward implementation of complex data-collection
protocols such as inverse-beam and interleaved data-collec-
tion experiments and it allows the efficient use of minikappa
goniometers and of multi-position and multi-crystal data
collections. Moreover, the MXCuBE2 data-collection queue
modularity smooths the way for the integration of novel data-
collection methods and data analysis, as already demonstrated
with the MeshAndCollect pipeline. MXCuBE2 is constantly
evolving to incorporate new experiment types and to hand
them over to the MX user community.
Acknowledgements
The continuous development of the Structural Biology
Beamlines has been possible thanks to the support from the
ESRF Beamline Control Unit, all Structural Biology Group
members and the feedback from our user community.
MXCuBE2 is the fruit of the collaboration of the partners of
the MXCuBE consortium, which includes ESRF, EMBL, the
MAX IV Laboratory, Synchrotron SOLEIL, HZB–BESSY,
DESY, the ALBA Synchrotron and Global Phasing Ltd.
References
Akey, D. L., Brown, W. C., Konwerski, J. R., Ogata, C. M. & Smith,J. L. (2014). Acta Cryst. D70, 2719–2729.
Arzt, S. et al. (2005). Prog. Biophys. Mol. Biol. 89, 124–152.Berglund, G. I., Carlsson, G. H., Smith, A. T., Szoke, H., Henriksen,
A. & Hajdu, J. (2002). Nature (London), 417, 463–468.
research papers
Acta Cryst. (2016). D72, 413–420 de Sanctis et al. � Best practices in collecting anomalous scattering data 419
Table 2Data-collection parameters and processing statistics for the feruloyl esterase module of xylanase 10B from C. thermocellum (Prates et al., 2001; PDBentry 1gkk).
Data sets were collected from a P212121 crystal in the form of a ‘classic’ two-wavelength MAD experiment and a ‘interleaved’ MAD experiment, in which data arecollected in 10� subwedges alternating between the two energies. Data were cut at 3.5 A resolution to properly compare the anomalous signal in the two data sets.No indication of global radiation damage, such as an increase in the unit-cell volume or in the overall B factor, is observed in the collected data. Values inparentheses are for the outer shell.
Peak ‘classic’ Inflection ‘classic’ Peak ‘interleaved’ Inflection ‘interleaved’
Beamline ID29 ID29 ID29 ID29Wavelength (A) 0.9791 0.9793 0.9791 0.9793Temperature (K) 100 100 100 100Detector Pilatus3 6M Pilatus3 6M Pilatus3 6M Pilatus3 6MData-collection time (s) 24 24 24 24Photon flux (photons s�1) 1.5 � 1011 1.5 � 1011 1.5 � 1011 1.5 � 1011
Crystal-to-detector distance (mm) 391.77 391.75 391.73 391.56Rotation range per image (�) 0.1 0.1 0.1 0.1Total rotation range (�) 120 120 120 120Space group P212121 P212121 P212121 P212121
Unit-cell parameters (A) a = 64.82, b = 108.42,c = 113.21
a = 64.86, b = 108.50,c = 113.29
a = 64.80, b = 108.42,c = 113.16
a = 64.80, b = 108.40,c = 113.17
Mosaicity (�) 0.039 0.040 0.042 0.043Resolution range (A) 40–3.5 (3.83–3.50) 40–3.5 (3.83–3.50) 40–3.5 (3.83–3.50) 40–3.5 (3.83–3.50)Total No. of reflections 44499 (10699) 44430 (10671) 44492 (10384) 44418 (10620)No. of unique reflections 10397 (2478) 10367 (2472) 10384 (2465) 10359 (2470)Completeness (%) 98.9 (99.5) 98.7 (99.3) 98.9 (99.3) 98.8 (99.5)Multiplicity 4.3 (4.3) 4.3 (4.3) 4.3 (4.3) 4.3 (4.3)hI/�(I)i 28.5 (27.1) 28.8 (26.9) 31.1 (28.9) 30.2 (27.9)Rr.i.m.† 0.046 (0.044) 0.045 (0.044) 0.042 (0.042) 0.043 (0.043)ISa 21.82 22.50 25.62 25.06DelAnom 0.679 (0.678) 0.696 (0.674) 0.730 (0.679) 0.718 (0.661)Mid-Slope of Anom. Normal Probability 2.610 2.515 2.733 2.693
† Rr.i.m. =P
hklf1=½NðhklÞ � 1�g1=2 Pi jIiðhklÞ � hIðhklÞij=
Phkl
Pi IiðhklÞ.

Berman, H., Henrick, K., Nakamura, H. & Markley, J. L. (2007).Nucleic Acids Res. 35, D301–D303.
Bourenkov, G. P. & Popov, A. N. (2010). Acta Cryst. D66, 409–419.Bowler, M. W., Guijarro, M., Petitdemange, S., Baker, I., Svensson,
O., Burghammer, M., Mueller-Dieckmann, C., Gordon, E. J., Flot,D., McSweeney, S. M. & Leonard, G. A. (2010). Acta Cryst. D66,855–864.
Brockhauser, S., Ravelli, R. B. G. & McCarthy, A. A. (2013). ActaCryst. D69, 1241–1251.
Brockhauser, S., Svensson, O., Bowler, M. W., Nanao, M., Gordon, E.,Leal, R. M. F., Popov, A., Gerring, M., McCarthy, A. A. & Gotz, A.(2012). Acta Cryst. D68, 975–984.
Cianci, M., Helliwell, J. R. & Suzuki, A. (2008). Acta Cryst. D64,1196–1209.
Cork, C., O’Neill, J., Taylor, J. & Earnest, T. (2006). Acta Cryst. D62,852–858.
Dauter, Z. (1997). Methods Enzymol. 276, 326–344.Dauter, Z. (1999). Acta Cryst. D55, 1703–1717.Dauter, Z. (2002). Curr. Opin. Struct. Biol. 12, 674–678.Dauter, Z. & Adamiak, D. A. (2001). Acta Cryst. D57, 990–995.Dauter, Z., Dauter, M., de La Fortelle, E., Bricogne, G. & Sheldrick,
G. M. (1999). J. Mol. Biol. 289, 83–92.Dauter, Z., Dauter, M. & Dodson, E. J. (2002). Acta Cryst. D58,
494–506.DiMaio, F., Terwilliger, T. C., Read, R. J., Wlodawer, A., Oberdorfer,
G., Wagner, U., Valkov, E., Alon, A., Fass, D., Axelrod, H. L., Das,D., Vorobiev, S. M., Iwaı, H., Pokkuluri, P. R. & Baker, D. (2011).Nature (London), 473, 540–543.
Ennifar, E., Carpentier, P., Ferrer, J.-L., Walter, P. & Dumas, P. (2002).Acta Cryst. D58, 1262–1268.
Evans, G. & Pettifer, R. F. (2001). J. Appl. Cryst. 34, 82–86.Evans, G., Polentarutti, M., Djinovic Carugo, K. & Bricogne, G.
(2003). Acta Cryst. D59, 1429–1434.Finke, A. D., Panepucci, E., Vonrhein, C., Wang, M., Bricogne, G. &
Olieric, V. (2016). Methods Mol. Biol. 1320, 175–191.Flot, D., Gordon, E. J., Hall, D. R., Leonard, G. A., McCarthy, A.,
McCarthy, J., McSweeney, S., Mitchell, E., Nurizzo, D., Ravelli,R. G. B. & Shepard, W. (2006). Acta Cryst. D62, 65–71.
Flot, D., Mairs, T., Giraud, T., Guijarro, M., Lesourd, M., Rey, V., vanBrussel, D., Morawe, C., Borel, C., Hignette, O., Chavanne, J.,Nurizzo, D., McSweeney, S. & Mitchell, E. (2010). J. SynchrotronRad. 17, 107–118.
Gabadinho, J. et al. (2010). J. Synchrotron Rad. 17, 700–707.Gonzalez, A. (2003). Acta Cryst. D59, 1935–1942.Hendrickson, W. A. (1991). Science, 254, 51–58.Hendrickson, W. A., Smith, J. L. & Sheriff, S. (1985). Methods
Enzymol. 115, 41–55.Hendrickson, W. A. & Teeter, M. M. (1981). Nature (London), 290,
107–113.Holton, J. M. (2009). J. Synchrotron Rad. 16, 133–142.Incardona, M.-F., Bourenkov, G. P., Levik, K., Pieritz, R. A., Popov,
A. N. & Svensson, O. (2009). J. Synchrotron Rad. 16, 872–879.Leiros, H.-K. S., McSweeney, S. M. & Smalas, A. O. (2001). Acta Cryst.
D57, 488–497.Leslie, A. G. W., Powell, H. R., Winter, G., Svensson, O., Spruce, D.,
McSweeney, S., Love, D., Kinder, S., Duke, E. & Nave, C. (2002).Acta Cryst. D58, 1924–1928.
Liu, Q., Dahmane, T., Zhang, Z., Assur, Z., Brasch, J., Shapiro, L.,Mancia, F. & Hendrickson, W. A. (2012). Science, 336, 1033–1037.
Liu, Q. & Hendrickson, W. A. (2015). Curr. Opin. Struct. Biol. 34,99–107.
Liu, Q., Liu, Q. & Hendrickson, W. A. (2013). Acta Cryst. D69, 1314–1332.
McCoy, A. J., Grosse-Kunstleve, R. W., Adams, P. D., Winn, M. D.,Storoni, L. C. & Read, R. J. (2007). J. Appl. Cryst. 40, 658–674.
Mueller-Dieckmann, C., Bowler, M. W., Carpentier, P., Flot, D.,McCarthy, A. A., Nanao, M. H., Nurizzo, D., Pernot, P., Popov, A.,Round, A., Royant, A., de Sanctis, D., von Stetten, D. & Leonard,G. A. (2015). Eur. Phys. J. Plus, 130, 70.
Nurizzo, D., Mairs, T., Guijarro, M., Rey, V., Meyer, J., Fajardo, P.,Chavanne, J., Biasci, J.-C., McSweeney, S. & Mitchell, E. (2006). J.Synchrotron Rad. 13, 227–238.
Owen, R. L., Rudino-Pinera, E. & Garman, E. F. (2006). Proc. NatlAcad. Sci. USA, 103, 4912–4917.
Paithankar, K. S. & Garman, E. F. (2010). Acta Cryst. D66, 381–388.Perrakis, A., Cipriani, F., Castagna, J.-C., Claustre, L., Burghammer,
M., Riekel, C. & Cusack, S. (1999). Acta Cryst. D55, 1765–1770.Pothineni, S. B., Venugopalan, N., Ogata, C. M., Hilgart, M. C.,
Stepanov, S., Sanishvili, R., Becker, M., Winter, G., Sauter, N. K.,Smith, J. L. & Fischetti, R. F. (2014). J. Appl. Cryst. 47, 1992–1999.
Prates, J. A. M., Tarbouriech, N., Charnock, S. J., Fontes, C. M. G. A.,Ferreira, L. M. A. & Davies, G. J. (2001). Structure, 9, 1183–1190.
Ramagopal, U. A., Dauter, Z., Thirumuruhan, R., Fedorov, E. &Almo, S. C. (2005). Acta Cryst. D61, 1289–1298.
Ravelli, R. B. G., Leiros, H.-K. S., Pan, B., Caffrey, M. & McSweeney,S. (2003). Structure, 11, 217–224.
Ravelli, R. B. G., Nanao, M. H., Lovering, A., White, S. &McSweeney, S. (2005). J. Synchrotron Rad. 12, 276–284.
Read, R. J. (2001). Acta Cryst. D57, 1373–1382.Rice, L. M., Earnest, T. N. & Brunger, A. T. (2000). Acta Cryst. D56,
1413–1420.Sanctis, D. de et al. (2012). J. Synchrotron Rad. 19, 455–461.Sanctis, D. de & Nanao, M. H. (2012). Acta Cryst. D68, 1152–1162.Sanishvili, R., Nagarajan, V., Yoder, D., Becker, M., Xu, S., Corcoran,
S., Akey, D. L., Smith, J. L. & Fischetti, R. F. (2008). Acta Cryst.D64, 425–435.
Sauter, N. K., Grosse-Kunstleve, R. W. & Adams, P. D. (2004). J. Appl.Cryst. 37, 399–409.
Schiltz, M., Dumas, P., Ennifar, E., Flensburg, C., Paciorek, W.,Vonrhein, C. & Bricogne, G. (2004). Acta Cryst. D60, 1024–1031.
Schlichting, I., Berendzen, J., Chu, K., Stock, A. M., Maves, S. A.,Benson, D. E., Sweet, R. M., Ringe, D., Petsko, G. A. & Sligar, S. G.(2000). Science, 287, 1615–1622.
Seltzer, S. M. (1993). Radiat. Res. 136, 147–170.Smith, J. L. (1991). Curr. Opin. Struct. Biol. 1, 1002–1011.Soltis, S. M. et al. (2008). Acta Cryst. D64, 1210–1221.Stepanov, S., Makarov, O., Hilgart, M., Pothineni, S. B., Urakhchin,
A., Devarapalli, S., Yoder, D., Becker, M., Ogata, C., Sanishvili, R.,Venugopalan, N., Smith, J. L. & Fischetti, R. F. (2011). Acta Cryst.D67, 176–188.
Weik, M., Ravelli, R. B. G., Kryger, G., McSweeney, S., Raves, M. L.,Harel, M., Gros, P., Silman, I., Kroon, J. & Sussman, J. L. (2000).Proc. Natl Acad. Sci. USA, 97, 623–628.
Weinert, T. et al. (2015). Nature Methods, 12, 131–133.Zander, U., Bourenkov, G., Popov, A. N., de Sanctis, D., Svensson, O.,
McCarthy, A. A., Round, E., Gordeliy, V., Mueller-Dieckmann, C.& Leonard, G. A. (2015). Acta Cryst. D71, 2328–2343.
research papers
420 de Sanctis et al. � Best practices in collecting anomalous scattering data Acta Cryst. (2016). D72, 413–420