Embed Size (px)
Citation preview

October 2016
FACES OF JOBLESSNESS IN LITHUANIA: ANATOMY OF EMPLOYMENT BARRIERS
James Browne and Daniele Pacifico


Policy Analysis Note (PAN) for Lithuania © OECD 2016 5
TABLE OF CONTENTS
1.
1. INTRODUCTION AND SUMMARY ........................................................................................................ 8
2. LABOUR MARKET AND SOCIAL CONTEXT .................................................................................... 11
3. EMPLOYMENT BARRIERS IN LITHUANIA ....................................................................................... 17
4. FACES OF JOBLESSNESS IN LITHUANIA ......................................................................................... 21
5. CONCLUSIONS ....................................................................................................................................... 27
ANNEX A LATENT CLASS RESULTS ..................................................................................................... 31
ANNEX B LATENT CLASS ANALYSIS AND MODEL SELECTION ................................................... 34
Tables
Table 2.1.
Table 2.0. % of people at risk of poverty or social exclusion, 2014 ....................................................... 13 Table 3.1. % of people facing different employment-barriers ................................................................ 19 Table A.1. Latent class estimates ........................................................................................................ 31 Table A.2. Characterisation of the latent groups ................................................................................. 31
Figures
Figure 2.1. Employment rates: strong recovery from the crisis ........................................................... 11 Figure 2.0. Dynamics of population groups with potential labour market difficulties ........................ 16 Figure 2.3. Composition of the Lithuanian population with labour market difficulties ...................... 16 Figure 3.1. Employment Barrier – Conceptual framework........................................................................ 17 Figure 3.2. Share of individuals facing increasing numbers of employment barriers ......................... 20 Figure 4.1. Shares of individuals facing multiple employment barriers .............................................. 26 Figure A.1. Share of employed individuals in Group 6 ........................................................................ 33 Figure B.1. Selection of the optimal number of latent classes ............................................................. 35
Boxes
Box 2.1. Population groups experiencing potential labour market difficulties (target population) ........... 15 Box 4.1. Group 1: “Experienced early retirees with health limitations” ................................................... 21 Box 4.2. Group 2: “Older labour-market inactive individuals with limited work experience
and health limitations” ............................................................................................................................... 22 Box 4.3. Group 3: “Prime age long term unemployed with limited work experience
and scarce job opportunities” ..................................................................................................................... 22 Box 4.4. Group 4: “Underemployed workers with low earnings” ............................................................. 23 Box 4.5. Group 5: “Skilled mothers with care responsibilities in higher-income households” ................. 23 Box 4.6. Group 6: “Unemployed youth with limited work experience” ................................................... 24 Box 4.7. Group 7: “Long-term unemployed youth without any past work experience
and scarce job opportunities” ..................................................................................................................... 24 Box 4.8. Group 8: “Disabled with low education and without any past work experience” ....................... 25 Box 4.9. Group 9: “Young mothers without any past work experience and care responsibilities” ........... 25

Policy Analysis Note (PAN) for Lithuania © OECD 2016 6
Box 4.10. Group 10: “Mothers with low skills, care responsibilities and limited work experience” ........ 26

Policy Analysis Note (PAN) for Lithuania © OECD 2016 7
ACKNOWLEDGEMENTS
This document was produced with the financial assistance of the European Union Programme for
Employment and Social Innovation “EaSI” (2014-2020, EC-OECD grant agreement VS/2016/0005,
DI150038). It is part of a joint project between EC and OECD (VS/2016/0005 (DI150038), Cooperation
with the OECD on Assessing Activating and Enabling Benefits and Services in the EU) covering
six countries: Estonia, Ireland, Italy, Lithuania, Portugal and Spain.
The report incorporates feedback received during the project kick-off seminar, held at OECD in Paris
on 3 March 2016 with the participation of the EC and representatives from all participating countries. Lead
authors gratefully acknowledge contributions from colleagues at the OECD (Rodrigo Fernandez, Herwig
Immervoll, Dirk Neumann, Céline Thévenot), as well as comments from colleagues at the World Bank
(Aylin Isik-Dikmelik, Sandor Karacsony, Natalia Millan, Mirey Ovadiya, Frieda Vandeninden, Michele
Davide Zini), who are undertaking a parallel and closely related joint project with the EC covering six
further EU Member States. All views and any errors in this report are the responsibility of the authors. In
particular, the report should not be reported as representing the official views of the OECD, of the
European Union, or of their member countries.
This project is co-funded by the European Union

Policy Analysis Note (PAN) for Lithuania © OECD 2016 8
Faces of Joblessness in Lithuania
Anatomy of Employment Barriers
1. INTRODUCTION AND SUMMARY
This Policy Analysis Note (PAN) for Lithuania assesses the characteristics and employment barriers of
working-age individuals with no or weak labour-market attachment. It is one of six such country notes in a
joint EC-OECD project covering Estonia, Ireland, Italy, Lithuania, Portugal and Spain. The objective of
this project is to provide a novel perspective on employment difficulties, and to aid in the identification of
policy approaches to overcome them. The project website at http://www.oecd.org/social/faces-of-
joblessness.htm provides further information.
Each PAN develops profiles of key employment barriers and quantifies their incidence and intensity
among jobless individuals and among those who work or earn very little or intermittently. The underlying
conceptual framework and statistical approach is described in an associated methodological background
paper (Fernandez et al., 2016; Immervoll and Isik-Dikmelik, 2016) and is consistent with that employed in
a related EC-World Bank activity covering six further EU countries.1 The empirical results from each PAN
will be used to inform a dialogue on policy approaches and options that could address the most prevalent
employment barriers in selected population groups and strengthen their labour-market attachment. This
dialogue will take place in a second part of the EC-OECD project. Its results and an associated policy
inventory will be presented in a series of six Country Policy Papers (CPP).
A key motivation behind this project is the finding from the literature on activation and employment-
support policies (AESPs), and on social protection systems more generally, that careful targeting and
tailoring to individual circumstances are crucial factors for policy success.2 However, policy discussions do
not necessarily reflect this. They often refer to broader labour-market groups such as “young people”,
“older workers”, “people with disabilities” or “lone parents”. Similarities of employment barriers among
members of such broader groups are implicitly assumed but not well documented (for instance, being
“young” is not an employment barrier). As a result, policy interventions targeted on the basis of
characteristics such as age, health status or family situation alone may be ill-adapted to the needs of jobless
individuals and those with precarious employment patterns. An in-depth inventory of people’s employment
barriers, and an identification of groups who share similar combinations of labour-market obstacles, can
contribute to a better match between individual needs and available support, and make associated policy
interventions more effective and less costly.
Countries frequently seek to account for individual circumstances and labour-market difficulties by means
of powerful statistical tools that “profile” individual benefit claimants using administrative data. Such tools
are useful for tailoring the employment programmes that each registered individual is offered. These tools
often rely on administrative data, which have distinct advantages, but tend to cover only a subset of the
out-of-work population, such as the registered unemployed. As a result, the profiling tools built around
these data typically cannot be used to provide a broader perspective on the employment barriers facing the
entire population of those with no or weak labour market attachment. This note complements existing
profiling instruments by adopting more of a “birds-eye” approach that considers the employment barriers
1. Agreement No. 30-CE-0715852/00-01, Portraits of Labor Market Exclusion 2.0.
2. See for example OECD (2013a, 2013b, 2014a, 2015a); Immervoll and Scarpetta (2012); Arias et al.
(2014); World Bank (2013); European Commission (EC) (2015); Eurofound (2012).

Policy Analysis Note (PAN) for Lithuania © OECD 2016 9
of all those with no or weak labour market attachment. This sizeable and heterogeneous group constitutes
the potential client group for AESPs. Understanding their employment barriers is not only important for
linking up services provided by different institutions, but it is also essential for identifying groups who
would benefit from employment-related programmes or incentives, and who are not currently clients of
any of the institutions providing such measures.
A comprehensive assessment of potential employment barriers requires detailed information on people’s
skills, work history, health status, household circumstances and incomes. The European Union Survey on
Income and Living Conditions (EU-SILC) contains rich information for identifying and assessing potential
barriers to employment and is the primary source of data for this note. EU-SILC offers cross-country
comparability, an extended reference period3 over which one can assess the respondents’ main activity
status, and detailed information on individual and family circumstances including people’s work-related
skills end education, work history, health status, income sources, tax liabilities and benefit amounts.
However, there is a relatively long time-lag between data collection and availability (EU-SILC 2014 was
made available in February 2016). EU-SILC also contains less detailed information on labour-force status
than standard labour-force surveys.
This note focuses on the 32% of the working age population4 in Lithuania who, according to SILC data for
2014, can be considered to face potential labour-market difficulties. This group is referred to as the “target
population”. Of this 32%, 21% did not work at all throughout the reference period5 and a further 11% had
“weak labour market attachment” with either unstable jobs, limited working hours or zero or near-zero
earnings. For them, potential employment barriers that are particularly common include no recent work
experience (67% of the target population), limited total past work experience (32%) and health limitations
(34%). Low skills, care responsibilities and high levels of non-labour income are important for some sub-
groups, but less prevalent overall.
Results suggest that the Lithuanian target population can be separated into ten distinct groups with similar
employment-barrier profiles. Focusing on the prevailing characteristics in each group, the emerging groups
may be summarised as follows:
1. “Experienced early retirees with health limitations” (20% of those with no or weak labour market
attachment) 2. “Older labour-market inactive individuals with limited work experience and health limitations” (20%)
3. “Prime age long term unemployed with limited work experience and scarce job opportunities” (17%)
4. “Underemployed workers with low earnings” (14%)
5. “Skilled mothers with care responsibilities in higher-income households” (8%)
6. “Unemployed youth with limited work experience” (7%)
7. “Long-term unemployed youth without any past work experience and scarce job opportunities” (6%)
8. “Disabled with low education and without any past work experience” (5%)
9. “Young mothers without any past work experience and care responsibilities” (2%)
10. “Mothers with low skills, care responsibilities and limited work experience” (2%)
3. SILC data on labour-market status is derived from 13 identical questions referring to different time periods.
Twelve of them relate to each month of the income reference period (the calendar year before the
interview) and an additional question refers to the moment of the interview. The reference period in this
note uses all 13 data points. It begins with the first month of the income reference period and finishes at the
moment of the interview.
4. Ages 18 to 64, excluding individuals in full-time education or compulsory military service.
5. This can be compared with the average proportion of working-age people in Lithuania who were not in
paid work during 2013 (the reference year for the 2014 SILC) from the EU Labour Force Survey, which is
30%. It is expected that this figure would be higher, however, as some people were only out of work for a
portion of the year, so the figures are not necessarily inconsistent.

Policy Analysis Note (PAN) for Lithuania © OECD 2016 10
These group labels indicate that proxy groupings, which are commonly referred to in the policy
debate, such as “women”, “disabled”, “youth”, include distinct sub-groups with different employment-
barrier profiles. For instance, several distinct combinations of employment barriers are common for the
three groups of women with children: all three have care responsibilities that limit their availability for
paid work, but one group is highly skilled and lives in households with high levels of income from other
sources (Group 5), another has no past (paid) work experience and scarce job opportunities (Group 9) and
the third has low skills and some, but still limited, work experience (Group 10). As shown in Section 4,
these groups also differ markedly with respect to their poverty risks, material deprivation levels and other
family or individual circumstances.
In most groups a significant proportion of individuals face more than one potential employment barrier
simultaneously. Two thirds of the target population face at least two such barriers simultaneously, and about
half face three or more. For instance, most of the “Young mothers without any past work experience and
care responsibilities” (Group 9) combine care responsibilities and no previous work history, whereas many
“Long-term unemployed youth without any past work experience and scarce job opportunities” (Group 7)
have no work experience, low skills and also face scarce job opportunities. As a result, addressing one type
of employment obstacle may not be enough to boost employment levels significantly. From a policy
perspective, the results point to a need to carefully sequence different activation and employment support
measures, and to co-ordinate them across policy domains and institutions.
This note proceeds as follows. Section 2 provides some background information on the evolution of social
and labour market conditions in Lithuania and how this compares with the other five countries studied in
the project, and with the EU average. Section 3 uses the most recent EU-SILC data to provide quantitative
measures for different types of employment barriers and their incidence among individuals with no or
weak labour-market attachment. Section 4 applies a statistical clustering technique to organise this
population into groups with homogeneous combinations of employment barriers and presents key
demographic and socio-economic characteristics of each group. A short concluding section highlights
selected directions for further extending the approach.

Policy Analysis Note (PAN) for Lithuania © OECD 2016 11
2. LABOUR MARKET AND SOCIAL CONTEXT
In Lithuania as well as in the five other countries covered by this project, the economic crisis has
significantly impacted labour markets, in turn causing increased poverty and material deprivation. The
impact of the crisis in Lithuania was especially severe during the first years following the onset of the
crisis, but was followed by a strong recovery.
Figure 2.1 shows the employment rates in the six countries between 2007 and 2015 and compares these
with the EU average. The employment rate in Lithuania fell significantly during the crisis, by 7 ppts
between 2007 and 2010, though this was a smaller fall than in Estonia and Ireland. Since then, however,
the recovery in employment has been strong: the employment rate increased by 9 ppts between 2010 and
2015, a larger increase than in all the six countries except Estonia. By 2015, the employment rate in
Lithuania exceeded both its 2007 level and the EU average.
Figure 2.1. Employment rates: strong recovery from the crisis
In % of working-age population
Source: Eurostat Labour Force Statistics.
Despite this, the number of people in employment in Lithuania is still significantly below its 2007 level.
This is because of a sharp decline in the size of the Lithuanian working age population, which is itself a
result of low fertility rates, ageing and significant net emigration, particularly among younger cohorts. Net
emigration averaged 22 000 a year between 2011 and 2015 (European Commission, 2016), and around half
of emigrants were aged 15-24. Poor health outcomes have also played a role. Life expectancy remains low
at 74 years compared to 81 on average in the EU-28, and men have a life expectancy of only 68 years,
compared with the EU average of 78.6
The steady recovery and the tightening labour market have led to the unemployment rate declining since
2010. Unemployment, which stood at 17.8% in 2010 has fallen to 10.8% in 2014 and to 9.1% in 2015,
although it remains above pre-crisis levels (8.4% in 2007).7 Unemployment rates show significant
6. Source: Eurostat mortality statistics.
7. The reduction of 1.6 ppts of unemployment between 2014 and 2015 was due to job growth for 1.1 ppts and
to a shrinking labour force for 0.5 ppts (European Commission 2016).

Policy Analysis Note (PAN) for Lithuania © OECD 2016 12
geographical differences with higher rates in rural areas (14.2% in 2014) than in urban areas (8.6% in
2014).8
Long-term unemployment shows a similar trend, declining from 7.8% of the working-age population in
2010 to 4.8% in 2014 and 3.9% in 2015, though still significantly above its 2007 level of 1.4%. The
number of very long-term unemployed (i.e. more than 48 months) remains high and more stable (0.92% in
2014 compared to EU average of 0.64%). A key reason behind persistent rates of very long-term
unemployment is the lack of skills and qualifications. Skills obsolescence may also be relevant, as about
42% of the very long-term unemployed were aged 50 or older in 2014.
The gap in employment rates between those with high and low levels of education is especially large in
Lithuania. The unemployment rate is among the lowest in the EU for those with a tertiary education (4.2%
in 2014 compared to the EU average of 6.1%), whereas rates for less educated individuals are significantly
above the EU average (13.5% vs 9.4% for those with an upper secondary or post-secondary non-tertiary
education and 29.8% vs 18.5% for those with a lower secondary education or less). This suggests high
levels of skills mismatches in the labour market and reflects both failings in the skills being taught and that
lifelong learning is not well developed.9 Only 5% of workers are engaged in training activities, half the
average share in the EU, and participation of low-to-medium skilled workers is even lower (OECD 2016b,
European Commission, 2016).
As in other countries, active labour market programmes (ALMPs) aim to improve the employability of
low-skilled workers in particular. However, spending on ALMPs is low in Lithuania compared to the rest
of the EU (European Commission, 2016). The coverage rate of ALMPs among active jobseekers was the
seventh lowest in the EU in 2013 (7.2%). In view of the extent of skills-related barriers, spending does not
appear to be well targeted. Spending on vocational training activities accounted for only about 22% of the
ALMP budget in 2015, whereas more than 50% of the budget was spent on employment incentives,
subsidised employment measures and rehabilitation. Furthermore, around 20% of the ALMP budget was
spent in 2015 on measures of direct job creation (public works), which have been shown to be the least
effective at improving employability, including in Lithuania (Card et al., 2010; ESTEP, 2014). A recent
OECD study recommended reducing reliance on employment subsidies and public works programmes and
increasing training opportunities for the long-term unemployed. It also argued for targeting employment
subsidies and direct employment on those furthest from the labour market (OECD, 2016a).
Youth unemployment is following the general downward trend. From the peak of 35.7% in 2010 the
unemployment rate for those aged 15-24 dropped to 16.3% in 2015, 4 ppts below the EU average. The
number of young people aged 15-24 not in employment, education or training (NEET) has also decreased
since 2010 and at 9.9% in 2015 it was 2.5 ppts below the EU average. “Low-skilled” youth (those with a
lower secondary education or less) face much higher unemployment risks in Lithuania than in other
European countries (39.7% in 2014 compared to the EU average of 30.3%). Since most young people in
Lithuania who are NEET are not registered with the Public Employment Service (European Commission,
2016), the outreach of the Youth Guarantee programme is challenging, an issue that has motivated
investments in a new NEET profiling system which is currently under development (European
Commission, 2016).
Income support for the unemployed is comparatively low, resulting in significant risk of poverty in the
case of job loss. It also encourages the unemployed to take jobs for which they are overqualified rather
than waiting to find a job that matches their skill level. The net replacement rate (NRR) of insurance
benefits for low-wage earners was among the lowest in OECD countries in 2014.10
Entitlement criteria are
also among the most restrictive in the OECD, which may be one factor behind very low benefit coverage;
8. 8% of the labour force in 2014 was long-term unemployed in rural areas. Source: Eurostat Labour Force
Survey.
9. See also Eurofound (2013).
10. Source: OECD Tax-Benefit Models (2016).

Policy Analysis Note (PAN) for Lithuania © OECD 2016 13
only 15-17% of unemployed receive unemployment insurance ( European Commission, 2016).11
Since
both unemployment insurance and social assistance benefit levels are low and relatively few people are
entitled to unemployment insurance in the first place, there is a strong incentive for the long term
unemployed to keep looking for a job rather than becoming economically inactive. Low levels of
unemployment insurance benefits and coverage also make it less worthwhile to work in the formal sector
and pay social security contributions (OECD, 2008). Commonly used indicators point to Lithuania’s
informal economy as being one of the largest in the EU (e.g., Schneider, 2015; Putniņš and Sauka, 2015),
with so-called “envelope wages” (that is, undeclared cash payments) common even among workers with
formal employment contracts.
Low pension adequacy means that financial work incentives for older workers are particularly strong in
Lithuania.12
As a result, both the activity and the employment rate of individuals aged 55-64 are above the
EU average (in 2014, 63.0% vs 55.9% for the employment rate, and 56.2% vs 51.8% for the activity rate).
At the same time, 55-64 year-olds who are economically inactive or unemployed face high risks of poverty
compared with other European countries (19.1% compared to the EU average of 15.2%).
Incidence of economic hardship
Lithuania is one of the most unequal countries in the EU with the 4th highest Gini coefficient for disposable
income. The poverty rate in 2014 was only slightly above the EU average of 17.2% (Table 2.1) but the rate
of severe poverty (below 40% of median income) is increasing (European Commission, 2016). The
proportion at risk of poverty or social exclusion (AROPE), although still slightly above the EU average of
25%, has been declining since 2010. This has largely been the result of favourable macroeconomic trends
which have led to a sizeable fall in the proportion living in very low work intensity households.
Table 2.1. Risk of poverty or social exclusion
2014, in % of people aged 16-64
1. Individuals aged 18-64.
2. Individuals aged 18-59.
Source: Eurostat (EU-SILC 2014).
11. Proposals under discussion in Lithuania for a “new social model” might improve the adequacy and
coverage of unemployment insurance; however these proposals had not been finalised at the time of
writing.
12. The share of pensioners (aged 65+) who are at risk of poverty or social exclusion stands at 31.9%, almost
twice the EU average.
Lithuania Estonia Ireland Italy Portugal Spain EU28
People at risk of poverty or social exclusion 26 25 29 29 28 32 25
People at risk of poverty
All 18 20 17 20 19 23 17
Not working 35 36 31 31 32 36 31
Working 8 12 6 11 11 13 10
full-time 7 11 3 10 9 10 8
part-time 24 20 11 17 31 23 16
Households without children 18 25 15 16 16 16 15
Households with children 20 18 16 24 23 28 19
People living in households with severe material deprivation (1)
All 12 6 9 12 10 8 9
Households without children 16 7 6 10 10 6 8
Households with children 12 5 10 13 11 9 10
People living in households with very low work intensity (2)9 8 21 13 13 18 12

Policy Analysis Note (PAN) for Lithuania © OECD 2016 14
Target groups for activation and employment-support policies
Individuals with labour market difficulties frequently move between non-employment and different states
of “precarious” employment. As a result, limiting attention to “snapshots” of non-employed (or
underemployed) individuals at a specific point in time, such as those based on labour force surveys, may
not capture the true extent of labour-market difficulties or the need for policy intervention. To cover the
potential scope of AESPs, the target population of the analysis in this note therefore includes working-
age individuals who are “persistently” out of work (either unemployed or labour-market inactive for more
than 12 consecutive months) as well as individuals whose labour-market attachment is “weak”.13
“Weak”
labour-market attachment can include individuals with unstable jobs working only sporadically, those on
restricted working hours, and those with very low earnings (due to, for example, working informally or in
very low productivity self-employment). Box 2.1 defines the sub-groups of this population and explains
how they are identified using the EU-SILC data. The target population is a sub-set of the reference
population of working-age adults relevant for AESPs. The reference population, in turn, is defined as all
working-age adults except for full-time students and those in compulsory military service as these groups
are typically outside the scope of AESPs. For simplicity, the rest of this note also refers to this reference
group as the “working-age population”.
Clearly, not everybody experiencing potential labour market difficulties may be an intended target for
AESPs.14
The broad definition of labour market difficulties adopted in this note is not intended to be
prescriptive about the appropriate scope of AESPs; instead, it seeks to inform policy decisions by
documenting the employment barriers and circumstances of individuals with no or weak labour market
attachment. The approach is thus descriptive and takes no position on whether policy intervention is
justified for specific groups. The resulting profiles of employment barriers are intended to facilitate discussions
of the strengths and limitations of different policy interventions for concrete groups of individuals. They can
also be used to help inform decisions on whether to channel additional policy efforts towards specific priority
groups.
13. This paper does not attempt to distinguish between voluntary and involuntary joblessness or reduced work
intensity. Individuals can of course choose to be out of work, or in part-time or part-year employment,
voluntarily, and some surveys ask respondents whether they “want to work”. However, those saying they
do not want employment, or prefer to work part-time or part-year, may do so as a result of employment
barriers they face, such as care obligations or weak financial incentives, which policy might potentially
address. If extended voluntary labour-market inactivity or underemployment creates or exacerbate certain
types of employment barriers, it may subsequently give rise to involuntary labour-market detachment or
partial employment in later periods.
14. It is worth noting that, with a definition of working-age as 18-64, some individuals whom policy makers
may wish to include in the scope of AESPs are nevertheless not included in the target group in this note.
Although the 18-64 age cut-offs are common in empirical work, they are becoming less suitable as
populations age, especially in countries that are actively seeking to increase retirement ages beyond 65.

Policy Analysis Note (PAN) for Lithuania © OECD 2016 15
Figure 2.2 shows the evolution of the target population in Lithuania between SILC survey years 2008 and
2014 (since the reference period is the year prior to the interview, these data refer to the period 2007 to
2013). Despite the major definitional differences, the resulting patterns are consistent with the trends based
on LFS data shown earlier in Figure 2.1. Both long-term unemployment and underemployment rose
between 2007 and 2010 (SILC years 2008 and 2011) and then declined from 2011 to 2013 (SILC years
2012 to 2014).
Figure 2.3 shows the composition of the target population in SILC 2014. Of the 67% who were out of work
throughout the reference period, the most common status was unemployment (22% of the target
population). 18% of the target population who did no paid work during the reference period reported that
they were unfit to work and 16% reported that they were retired. The majority of individuals with “weak
labour market attachment” (underemployment) spent part of the year out of the labour force (unstable jobs)
and the rest are split evenly between those who worked part-time throughout the year and those who report
working throughout the year but having very little earnings.
Box 2.1. Population groups experiencing potential labour market difficulties (target population)
The target population in this note includes those who are persistently out-of-work, as well as those with weak labour-market attachment.
The persistently out-of-work population (long-term unemployed or inactive) includes individuals reporting no employment activity throughout the reference period. The reference period corresponds to 12 consecutive monthly observations in the income reference year (January-December of year T-1) plus one additional observation at the moment of the interview (in year T).
The group with weak labour market attachment refers to individuals reporting employment activity during the reference period matching any of the following three situations:
i. Unstable jobs: individuals working only a limited number of months throughout the reference period. The
threshold is equivalent to Eurostat’s low-work-intensity measure: Above zero but no more than 45% of potential working time in the income reference year. To reconcile information reported for the income reference period and at the moment of the interview the following individuals are also considered in this group: 1) Workers who report no work activity during the income reference period but who are working at the moment of the interview and, 2) workers with between 45% and 50% of work activity during the income reference period who do not report any work activity in either the last month of the income reference period or at the moment of the interview.
ii. Restricted hours: workers who spent most or all of the reference period working 20 hours or less a week.1
However, individuals working 20 hours or less who are not likely to have additional work capacity, e.g. due to ongoing education or training, are excluded.
iii. Near-zero earnings: individuals reporting some work activity during the income reference period but negative, zero or near-zero monthly earnings (less than one third of the statutory minimum wage for 2013).
In addition to possible classification error, situations included in this group could signal potential labour market difficulties, such as underpayment and/or informal activities.
1. The 20-hours threshold is approximately in-line with the 45% “part-year” threshold that identifies the group with unstable jobs. For a 40-hours working week in a full-time job, 45% of full-time would correspond to 18 hours a week. However, in SILC, the distribution of working hours in the main job shows a high degree of bunching at 10, 15, 20 and 25 hours a week. As the closest multiple of 5, a value of 20 hours is therefore chosen.

Policy Analysis Note (PAN) for Lithuania © OECD 2016 16
Figure 2.2. Dynamics of population groups with potential labour market difficulties
In % of reference population
Source: Calculations based on EU-SILC 2008-2014. See Box 2.1 for the definitions of the three groups.
Figure 2.3. Composition of the Lithuanian population with labour market difficulties
Note: The six-country average is unweighted.
Source: Calculations based on EU-SILC 2014. See Box 2.1 for the definitions of the three groups.
Persistently out of work (67% of the target population)
Weak labour market attachment (33% of target population)
Unemplo-yed (22%)
Retired (16%)
Unfit to work (18%)
Domestic tasks (8%)
Other inactive
(6%)
61%68%
12%
11%
27%21%
Average of sixcountries LTU
Persistently out of work
Weak labour market attachment
No major difficulties
Restricted
hours (7%)
Near-zeroearnings
(7%)
Unstable jobs(19%)
"Target" population
(32%)
Working age population
(100%)
Policy Analysis Note (PAN) for Lithuania © OECD 2016 17
3. EMPLOYMENT BARRIERS IN LITHUANIA
Working age individuals with no or weak labour-market attachment may face a number of employment
barriers that prevent them from fully engaging in employment activities. A thorough understanding of
these barriers is a pre-requisite for designing and implementing policy interventions in a way that is well-
targeted and suitably adapted to the circumstances of different policy clients. Following Immervoll and
Scarpetta (2012), this note examines three types of employment barrier, namely (see Figure 3.1):
Insufficient work-related capabilities , e.g. a lack of skills, work experience, care responsibilities and
health-related limitations;
Lack of financial work incentive to look for a “good” job, e.g., because of low potential pay,
relatively generous out-of-work benefits, or access to high levels of income independent of their own
work effort;
Scarce job opportunities, e.g., a shortage of vacancies in the relevant labour-market segment, frictions
in the labour market due to information asymmetries, or discrimination in the workplace.
Figure 3.1. Employment barriers: conceptual framework
Source: Fernandez et al. (2016).
The employment barriers outlined above cannot all be measured directly. To operationalise the concepts,
this note implements a set of workable indicators under each of the three main categories. Fernandez et al.
(2016) provides a fuller discussion of the indicators and their rationale, including descriptive statistics for
selected countries. The indicators used for Lithuania are as follows:
Capability, item 1. “Low” education or skills: if an individual has a lower-secondary degree or
less (ISCED-11 standards) or low professional skills (their most recent job was in the lowest
macro-category of the ISCO-08 classification system “Elementary Occupations”). Those who
demonstrate high skills by having a tertiary degree are assumed not to face this employment
barrier even if their most recent job was low-skilled.15
15. This indicator is different from that in Fernandez et al. (2016), which classifies individuals who have
achieved less than upper secondary education as facing an employment barrier. The extent of skill
Employment barrierlack of job opportunities
Employment barrierlack of work-related capabilities
Better-qualityemployment
Policy interventions
Individuals with potential labour market
difficulties
Employment barrierlack of financial incentives
Jobless Unstable jobs
Restricted working hours

Policy Analysis Note (PAN) for Lithuania © OECD 2016 18
Capability, item 2. Two measures of work experience:
No recent work experience: if an individual did no paid work during the reference period
(i.e. they were without employment for at least 12 months).
“Low” relative total work experience: the indicator takes one of three values: 1 for those
who have no past work experience at all, 2 for those who have some work experience but
have worked less than 60% of the time since they left full-time education, and 3 otherwise
(i.e., if their total work experience is not “low”).
Capability, item 3. Health limitations: If an individual reports some or severe long-standing
physical or mental limitations in daily activities.
Capability, item 4. Care responsibilities: if an individual has a (minor or adult) family member
who requires care16
and is either the only potential care giver in the household, or the only person
in the household who is economically inactive or working part-time because of care
responsibilities.
Incentives, item 1. “High” non-labour income: if the household’s income other than that
relating to the work efforts of the individual in question,17
is more than 1.4 times the median
value among the reference population (EUR 4 790/year, adjusted for household size).
Incentives, item 2. “High” earnings-replacement benefits: if an individual’s earnings-
replacement benefits received during the reference year exceed 60% of their estimated potential
earnings in work.18
Opportunity (one item only). “Scarce” job opportunities: if an individual has a “high” risk of
not finding a job despite active job-search and willingness to take up employment during most of
the income reference period (at least seven months) and until the moment of the SILC interview
(inclusive).19
The risk is estimated with a regression model including region, age group, gender,
level of professional skills, education and length of the unemployment spell as independent
variables (see Fernandez et al., 2016 for more details). Individuals with an estimated risk of more
than 1.6 times the median value in the working-age population are considered to face “scarce”
job opportunities. Scarce job opportunities do not only indicate a barrier to employment in the
short term, but if jobseekers become discouraged and stop active job search, it could lead to
further problems in the longer run.
mismatches in the Lithuanian labour market discussed in Section 2 suggests that many of those with an
upper-secondary education have “low” levels of professional skills and so are also likely to face a barrier to
employment.
16. Family members assumed to require care are children under the age of 12 receiving less than 30 hours of
non-parental childcare a week and adults reporting severe limitations in daily activities due to their health
and being economically inactive throughout the reference period (and in the case of those of working age,
that permanent disability is the reason for their inactivity).
17. This includes earnings, individual-level earnings replacement benefits, and the individual’s share of
household-level earnings replacement benefits.
18. Potential earnings are estimated in SILC with a regression model corrected for sample selection. See
Fernandez et al. (2016) for details.
19. The EU-SILC guidelines show that in Lithuania the fieldwork period is between March and June. The 2014
survey provides information only about the quarter the interview took place and shows that for about 60%
of the sample the interviews took place in the second quarter. This means that the individuals with “scarce”
job opportunities had been actively looking for a job for at least nine months.

Policy Analysis Note (PAN) for Lithuania © OECD 2016 19
Table 3.1 shows the share of individuals in the target and the broader reference populations facing each
employment barrier. As expected, the incidence of each barrier is significantly higher in the target
population. In most cases, barriers are also more prevalent among those who were out of work throughout
the entire reference period than for those with weak labour-market attachment. Common barriers include
“low” relative work experience and health limitations (in line with Section 2, which showed that being
unfit to work was the second most common reason given for labour market inactivity). These are both
faced by more than a third of the target population. A special case is the “no recent work experience”
barrier, which not only acts as a potential employment obstacle but also is a direct result of the way the
target population is defined: by definition, those who were persistently out of work did not work at all
during the reference period. As a result, 100% of this group are shown as facing “no recent work activity”
as a potential barrier.
The other employment barriers, in particular “low education or skills”, “care responsibilities” and “high
levels of non-labour income”, are somewhat less prevalent overall (but may still be very important for
some sub-groups). About 10% of the target population receive high levels of earnings replacement benefits
or face scarce job opportunities. This is again consistent with the labour-market context discussed in
Section 2: the coverage and generosity of unemployment insurance in Lithuania are low, and long term
unemployment has been falling.
The “high levels of non-labour income” barrier, and to a lesser extent “care responsibilities”, are the only
barriers that are less prevalent among those who are underemployed than those who are persistently out of
work. A reason for the first of these is that around half of those who work part time (50%) live with a full-
time worker and thus their households have sources of income that are not directly related to their work
efforts.
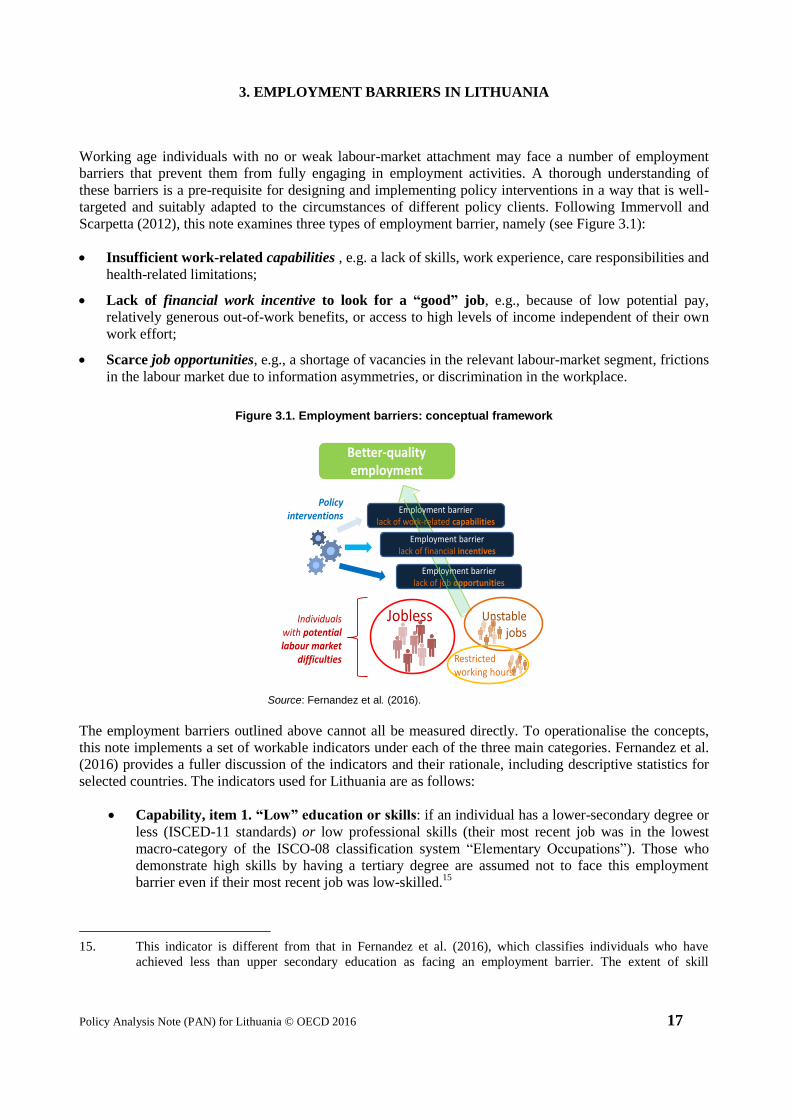
In practice people’s individual and family circumstances are complex and often lead to situations where
they face multiple barriers to employment. Figure 3.2 shows the number of (simultaneous) barriers faced
by individuals in the target population. Nearly one third face two simultaneous barriers, just under a
quarter face three and 10% face four or more barriers. 11% face no major employment barrier. For this
group, the employment-barrier indicator may be slightly below the respective thresholds used in this note,
or they are not working or are “underemployed” for reasons unrelated to the barriers discussed here – for
instance, they may simply have a strong preference for leisure. The next section uses a statistical clustering
technique to examine which combinations of barriers are most common.
Table 3.1. Employment-barrier indicators
% of population facing different types of barrier
Note: See text for definitions and thresholds.
Source: Calculations based on EU-SILC 2014.
AllPersistently out
of work
Weak labour
market attachment
Insufficient work-related capabilities
"Low" education or underemployed skil ls 14 25 29 18
No past work experience 4 10 16 0
Positive but "low" relative work experience 18 32 34 29
No recent work activity 21 67 100 0
Health limitations 16 34 42 18
Care responsabilities 4 13 13 14
Lack of financial work incentives
"High" non-labour income 31 22 19 29
"High" earnings replacements 6 10 12 8
Scarce job opportunities
Scarce job opportunities 10 32 35 27
"Target" populationWorking age
population
Policy Analysis Note (PAN) for Lithuania © OECD 2016 20
Figure 3.2. Number of simultaneous barriers
% of target population
Note: The six-country average is unweighted.
Source: Calculations based on EU-SILC 2014.
10
24
31
23
11
4 or more barriers 3 barriers 2 barriers single barrier No major barrier
13
28
32
20
6
Lithuania Average of six countries

Policy Analysis Note (PAN) for Lithuania © OECD 2016 21
4. FACES OF JOBLESSNESS IN LITHUANIA
This section applies the method described in Fernandez et al. (2016) to segment the target population into
groups of individuals with similar combinations of employment barriers. Using the 2014 SILC data for
Lithuania, the segmentation process leads to the identification of ten groups of individuals with no or
weak labour market attachment (the “target population”).20
The following paragraphs describe each group in detail. At the end of each paragraph a box reports a
Venn diagram showing extent and degree of overlap of the main barriers characterising the group, as well as
a list of selected individual and household characteristics with a “high” probability of occurrence within the
group.21
Together, this information can help attach suitable labels (“faces”) to group members, although the
labels are necessarily arbitrary to some extent and cannot substitute for careful examination of the
comprehensive list of employment barriers and socio-economic characteristics, as reported in Annex
Tables A.1 and A.2.
Group 1 (20% of the target population): “Experienced early retirees with health limitations”. Most
people in this group are relatively old (average age 62 years) and suffer from long-standing physical or
mental health limitations. The majority are women (61%), have considerable paid work experience
(33 years on average, the highest of the ten groups) and live in middle-income households: the average
equivalised disposable income is EUR 4 931/year, the third-highest of the ten groups. Individuals in this
group are largely labour-market inactive (88%), with 60% reporting their labour market status as retired
and 22% as unable to work because of sickness or disability. Weak financial work incentives represent a
potential employment barrier in this group as many members (22%) live in households with significant
income from sources that are not related to their own work effort (e.g. old-age pensions or income of a
partner), and 20% receive early retirement or sickness or disability benefits whose overall amount is high
relative to potential earnings (Box 4.1 shows little overlap between the two work incentive indicators).
Compared to those in other groups, individuals in Group 1 are less likely to face multiple simultaneous
employment barriers (see Figure 4.1).
Box 4.1. Group 1: “Experienced early retirees with health limitations”
Main employment barriers1 Selected characteristics
2
% of the target pop.
- 62 years old (average) - Majority women - Labour-market inactive - 33 years in paid work (average)
- 13.7 years of schooling (average)
- Average equivalised disposable income: EUR 4 931 (3rd
quintile3)
- 1.2 simultaneous employment obstacles (average)
1. Surface areas of shapes in the diagram are proportional to the number of group members facing the related barrier (“Proportional Venn Diagrams”). The outer square represents the group size (100%). The diagram shows the three most prevalent barriers in the group and is based on the indicators discussed in Section 3. An exception is the recent work experience indicator. Although this indicator is included in the numerical results in Annex Table A.1, it is not shown in the diagrams as its high prevalence (due to the strong two way causal links with the other barriers) would dominate all other barriers in the graphical representation in all but three groups. 2. Characteristics that distinguish this group from other groups, i.e., categories that have a high probability of occurring in the group. Table A.2 reports individual and household characteristics in more detail. 3. Income quintiles are calculated for the entire national population. Source: Calculations based on EU-SILC 2014, see Annex Tables A.1 and A.2 for full results.
20. Annex A outlines the segmentation method and the process that lead to the identification of the ten groups.
Fernandez et al. (2016) describes in detail the econometric model and the related methodological
framework.
21. The names of the key barriers characterising each group are highlighted with a different font and are
hyperlinked to the corresponding description in Section 3.

Policy Analysis Note (PAN) for Lithuania © OECD 2016 22
Group 2 (20% of the target population): “Older labour-market inactive individuals with limited work
experience and health limitations”. Like those in Group 1, individuals in this group are relatively old
(average age 55 years) and are on the whole labour-market inactive (82%), with 21% reporting to be
retired and 47% unfit to work. Compared with Group 1, a greater proportion (67%) suffers from long-
standing physical and mental health limitations, with 28% reporting a severe condition, and 52% receive
sickness or disability benefits (EUR 2 144/year on average). They also have significantly less work
experience compared to Group 1 (15 years on average compared to 33 years in Group 1) and face a greater
number of simultaneous employment barriers (1.7, see Figure 4.1).
Box 4.2. Group 2: “Older labour-market inactive individuals with limited work experience and health limitations”
Main employment barriers Selected characteristics % of the
targetpop.
- 55 years old (average) - Majority women - Labour-market inactive - 15 years of paid work (average) - 13.4 years of schooling (average) - Average equivalised disposable income: EUR 4 493 (3
rd quintile)
- 1.7 simultaneous employment obstacles (average)
Group 3 (17% of the target population): “Prime age long term unemployed with limited work experience
and scarce job opportunities”. 65% of this group are middle-aged men (average age 50), and they
predominantly live in rural areas (70%). Almost all are persistently out of work and face limited job
opportunities (91%): 100% were unemployed and looking for work for most of the reference period, and
88% throughout the entire reference period and still at the time of interview. 36% were previously
employed in “Elementary Occupations” (as defined by the ISCO-08 international standards), indicating a
low level of work-related skills which could further reduce their (re-) employability. With only 18 years of
paid work on average, many individuals in this group also have low overall work experience relative to
their potential (56%). 67% are in the bottom income quintile (average disposable income of
EUR2 823/year) and at risk of poverty, with 55% being in receipt of social-assistance benefits.
Box 4.3. Group 3: “Prime age long term unemployed with limited work experience and scarce job opportunities”
Main employment barriers Selected characteristics % of the
target pop.
- 50 years old (average)
- Unemployed. 12+ months of unemployment spell (average)
- 18 years of paid work (average)
- 13.2 years of schooling (average)
- At risk of poverty
- Typically from rural areas
- Average equivalised disposable income: EUR 2 823 (bottom quintile)
- 2.1 simultaneous employment obstacles (average)
Group 4 (14% of the target population): “Underemployed workers with low earnings”. Individuals in this
group are mostly women (64%), are relatively young (average age 37) and have the second-highest
education levels of all ten groups. Although 97% report some work activity during the reference period,
52% declared zero or near-zero earnings while the rest had unstable job patterns or worked part-time
throughout the year with restricted working hours. While around a third of those “underemployed”
individuals are self-employed whose earnings may be expected to be volatile, the large share of individuals
reporting near-zero earnings could indicate informal employment (undeclared work is relatively common

Policy Analysis Note (PAN) for Lithuania © OECD 2016 23
in Lithuania, and leads to workers not being covered by social insurance programmes, see Putniņš and
Sauka, 2015), underpayment or simply be the result of measurement error (for example, workers not
declaring earnings from undeclared work to the SILC survey). Individuals in this group may also face
weak financial work incentives for (formal) employment: 70% live in households where at least one other
person has employment and earnings (the third-highest percentage of all ten groups), and for 33% of this
group, this income that does not depend on their own work effort is high.
Box 4.4. Group 4: “Underemployed workers with low earnings”
Main employment barriers Selected characteristics % of the
target pop.
- 37 years old (average)
- Majority women
- 13 years of paid work (average)
- 14.5 years of schooling (average)
- Average equivalised disposable income: EUR 5 175 (3rd
quintile) - 0.7 simultaneous employment obstacles (average)
Group 5 (8% of the target population): “Skilled mothers with care responsibilities in higher-income
households”. This group consists typically of women (91%) who are relatively young (31 years on
average) and who have care responsibilities (65%) for their young children (100% have children, the
youngest child is 3 years old on average). 85% of group members live with someone who is in paid work
(in most their partner) and 54% have weak work incentives resulting from high levels of household income
that are not related to their own work effort (this group has the highest equivalised household incomes of
all ten groups, EUR 6 089/year). Although all group members have worked in the past with nine years of
paid work experience on average, for 31% this work experience is low relative to their potential. Despite
these barriers, there are signs that many group members are moving into work as their children get older:
72% were out of work during most of the income reference period, whereas 43% were in work at the time
of the interview (and a further 5% were actively seeking employment). Other characteristics of this group
also point to strong employability. The group has the highest average level of education of all the groups
(14.7 years on average) with 44% having a tertiary degree and many (33%) have previously worked in one
of the three highest skilled occupation types in the ISCO-08 standards: professionals, managers or
technicians and associate professionals.
Box 4.5. Group 5: “Skilled mothers with care responsibilities in higher-income households”
Group 6 (7% of the target population): “Unemployed youth with limited work experience”. This group
consists largely of young individuals (29 years on average) with limited job opportunities (91%) who have
been unemployed for an average of ten months during the reference period. The majority (72%) of group
members have children, but care responsibilities are only a barrier to employment for 29% either because
their children are of school age or because they live in households with other potential care givers.
Main employment barriers Selected characteristics % of the
target pop.
- 31 years old (average)
- Women with young children living with their working partner
- Labour market inactive
- 9 years of paid work experience (average)
- 14.7 years of schooling (average)
- Average equivalised disposable income: EUR 6 089 (4th
quintile)
- 1.6 simultaneous employment obstacles (average)

Policy Analysis Note (PAN) for Lithuania © OECD 2016 24
Individuals in this group have all some past work experience but for 54% this is low relative to their
potential. 53% live in households in the bottom quintile of the income distribution and although 54%
receive social assistance benefits and 47% family benefits, 51% of group members are at risk of poverty
(the third-highest level of all groups). While 65% were still seeking employment at the moment of the
SILC interview about 30% managed to find a job despite their opportunity and capability barriers.22
Box 4.6. Group 6: “Unemployed youth with limited work experience”
Group 7 (6% of the target population): “Long-term unemployed youth without any past work experience
and scarce job opportunities”. This group consists of young (72%, 25 years on average) individuals from
rural areas (78%) who have no past work experience (74%) and have been unemployed for more than
12 months (74%). Many have low education (26% do not have an upper secondary degree) or acquired
low-medium skills in their past occupation, with the result that 31% are classified as having low work-
related skills. The combination of low skills, no past work experience and other characteristics such as
their age and geographical area are all factors that reduce their employment possibilities and result in
job opportunities. This group faces an average of 2.5 employment barriers, which is higher than the
average for the target population as a whole. The average equivalised household income of this group is
relatively low at EUR 3 359 per year, and 47% are at risk of poverty.
Box 4.7. Group 7: “Long-term unemployed youth without any past work experience and scarce job opportunities”
Group 8 (5% of the target population): “Disabled with low education and without any past work
experience”. The majority in this group report a permanent disability (77%) as the main cause of their
labour market inactivity during the reference period. 86% suffer from long-standing physical or mental
22. Figure A.1 shows that the employment chances of some group members increased over time. About half of
those how were employed at the moment of the SILC interview (15% of group members) are however
identified as facing “scarce” job opportunities. This depends on the characteristics of these individuals, in
particular their age and the length of unemployment spell (corresponding to about 11 months on average).
Main employment barriers Selected characteristics % of the
target pop.
- 29 years old (average)
- Unemployed / recently employed
- 10 months of unemployment spell
- 7 years of paid work experience (average)
- 13.5 years of schooling (average)
- Typically from urban areas
- Average equivalised disposable income: EUR 3 688 (2nd
quintile)
- 2.2 simultaneous employment obstacles (average)
Main employment barriers Selected characteristics % of the
target pop.
- 25 years old (average)
- Living with their parents
- Mostly men
- Unemployed. 12+ months of unemployment (average)
- 3 years of paid work experience (average)
- 12.9 years of schooling (average)
- Typically from rural areas
- Average equivalised disposable income: EUR 3 359 (2
nd quintile)
- 2.5 simultaneous employment barriers (average)

Policy Analysis Note (PAN) for Lithuania © OECD 2016 25
health limitations in their daily activities and for 57% these limitations are severe. The majority has no past
work experience (79%) and 87% have low education with 44% having achieved only primary education
and 43% lower-secondary. This group has only 7.9 years of schooling on average, the lowest of the ten
groups. The majority (80%) received sickness and disability payments of EUR 3 331/year on average, and
for 60% these payments are high relative to their potential earnings in work. Individuals in this group have
the largest average number of simultaneous obstacles to employment (3.9). They are relatively young (the
average age is 34) and equally split between men and women.
Box 4.8. Group 8: “Disabled with low education and without any past work experience”
Group 9 (2% of the target population): “Young mothers without any past work experience and care
responsibilities”. This group is characterised by young (89%, 26 years on average) labour-market inactive
women (97%) who live with a partner (79%) and their young children (100%). They all face significant
care responsibilities (99%) and do not have any past work experience (100%). Members of this group live
in households in the bottom half of the income distribution, though at 37% their at-risk-of-poverty rate is
lower than for the target population as a whole, partly because most individuals (80%) in this group have at
least one other household member in paid work. 79% received social assistance benefits (EUR 690/year on
average) and 90% family-related benefits (EUR 543/year). The combination of no work-related
professional skills, low education (12.5 years on average, the third lowest of the ten groups) and the fact
that 67% live in rural areas, where unemployment is relatively higher, helps to explain why many group
members (80%) are likely to face scarce job opportunities if they were to seek employment. Individuals in
this group face the second-largest average number of simultaneous obstacles to employment (3.3).
Box 4.9. Group 9: “Young mothers without any past work experience and care responsibilities”
Main employment barriers Selected characteristics % of the
target pop.
- 26 years old (average)
- Women with young children living with their (working) partner
- Labour market inactive
- No past work experience
- 12.5 years of schooling (average)
- Receive family benefits and social assistance payments
- Typically from rural areas
- Average equivalised disposable income: EUR 3 408 (2
nd quintile)
- 3.3 simultaneous employment obstacles (average)
Group 10 (2% of the target population): “Mothers with low skills, care responsibilities and limited work
experience”. This group is made of prime-aged (79%) women (92%) from rural areas (75%) with no recent
work experience (100%) and care responsibilities (99%). This group differs from Group 9 in that they are
older (37 years on average) and have some past work experience, although for the majority (68%) this is
Main employment barriers Selected characteristics % of the
target pop.
- 34 years old (average)
- Labour-market inactive reporting a permanent disability
- Severe long-lasting limitations in daily activities
- Receive disability payments
- No past work experience
- 7.9 years of schooling (average)
- Average equivalised disposable income: EUR 3 768 (2
nd quintile)
- 3.9 simultaneous employment obstacles (average)

Policy Analysis Note (PAN) for Lithuania © OECD 2016 26
low relative to their age and education. They also have low work-related skills (55% worked in
“Elementary Occupations” based on the ISCO-08 standards in their previous job). Low professional skills
in this group are often combined with low education: 48% have no more than a lower secondary degree
and the group has the second-lowest average years of education of the ten groups (11.9 years of schooling
on average). This group has also the highest risk of poverty of all ten groups with 75% of group members
being in the bottom quintile of the income distribution. 65% receive social assistance benefits
(EUR 1 201/year on average) and 65% family benefits (ERU 803/year on average). Individuals in this
group face three simultaneous barriers to employment on average (the third-highest among the ten groups).
Box 4.10. Group 10: “Mothers with low skills, care responsibilities and limited work experience”
Main employment barriers Selected characteristics % of the
target pop.
- 37 years old (average)
- Women with young children living with their partner
- Mainly labour market inactive
- No past work experience
- 11.9 years of schooling (average)
- At risk of poverty
- Average equivalised disposable income: EUR 2 351 (1st
quintile) - Typically from rural areas
- 3.0 simultaneous employment obstacles (average)
Figure 4.1. Share of individuals facing multiple employment barriers in each group
In descending order of shares facing at least three barriers
Note: Group sizes are reported on the horizontal axis. See Box 4.1 to Box 4.10 for details. Groups are as follows: 1. “Experienced early retirees with health limitations”, 2. “Older labour-market inactive individuals with limited work experience and health limitations”, 3. “Prime age long term unemployed with limited work experience and scarce job opportunities”, 4. “Underemployed workers with low earnings”, 5. “Skilled mothers with care responsibilities in higher-income households”, 6. “Unemployed youth with limited work experience”, 7. “Long-term unemployed youth without any past work experience and scarce job opportunities”, 8. “Disabled with low education and without any past work experience”, 9. “Young mothers without any past work experience and care responsibilities”, 10. “Mothers with low skills, care responsibilities and limited work experience”.
Source: Calculations based on EU-SILC 2014.

Policy Analysis Note (PAN) for Lithuania © OECD 2016 27
5. CONCLUSIONS
This note has used a novel method for identifying, analysing and visualising the most common
employment barrier profiles characterising the Lithuanian population with potential labour market
difficulties. The underlying premise is that out-of-work individuals (unemployed and inactive) and workers
with weak labour market attachment face a number of possible employment obstacles, and each of them
may call for different policy responses. The success of activation and employment-support policies
(AESPs), and of social protection measures more generally, is expected to hinge on effective strategies to
target and tailor policy interventions to these barriers and to individual circumstances.
The segmentation method used in this note has uncovered patterns that can provide concrete guidance for
policy design and targeting strategies in Lithuania. Results show that “short-hand” groupings that are often
referred to in the policy debate, such as “youth”, “women”, “unemployed”, are far from homogeneous, and
may distract attention from the specific employment obstacles that policies seek to address. Indeed, some
of these categories include several distinct sub-groups with very different combinations of employment
barriers.
For example, the statistical clustering has identified three quite different groups of women with children
that are likely to respond to policies in different ways. One group is characterised by high levels of
household incomes and no barriers to employment other than the need to care for children. It is likely that
this group would be relatively unresponsive to policies that attempted to encourage them to move into paid
work by offering stronger financial incentives or more childcare provision. By contrast, the second group
of mothers lives in much poorer households and has relatively little work experience. The third group faces
more severe barriers to employment, having never been in paid work at all and combining scarce job
opportunities with care responsibilities. Financial incentives such as in-work support and affordable
childcare may be effective for the second group, but a longer-term approach to addressing employment
barriers including active labour market policies to tackle skill deficits is likely to be necessary for the third.
The statistical clustering has also identified two distinct sub-groups among unemployed youth. One group
has no employment history and low skills, while another group of young individuals who have a shorter
unemployment spell is more educated, but has very limited work experience. In view of these different
characteristics, a uniform approach for unemployed youth would likely be inappropriate.
Similarly, the statistical clustering has identified two groups of older people facing different employment
barriers. Both have some health limitations, but one group is older with a long employment record and
faces weak financial work incentives, while the other has low work experience relative to their age and
more severe health problems. Again, these differences suggest scope for employing quite different policy
approaches for different groups of older working-age people.
Although the clustering results do not in themselves say which groups should be the focus for AESPs, they
can highlight priority groups for policy interventions and can help guide policy measures in specific
directions. For instance, high poverty risks, a large number of young people or a strong over-representation
of women in some groups may signal a need to review whether existing targeting strategies meet
governments’ social cohesion objectives. A high poverty risk combined with weak work incentives may
call for caution in applying benefit sanctions (such as for some individuals in Group 8). By contrast, groups
with relatively high incomes and financial disincentives caused by high levels of income replacement
benefits (such as Group 1) may indicate scope for targeted benefit reductions or for tightening benefit
eligibility conditions.

Policy Analysis Note (PAN) for Lithuania © OECD 2016 28
Likewise, information on the intensity and number of barriers faced by individuals can inform difficult
policy decisions involving trade-offs between helping those in greatest need and targeting those who are
likely to be the most responsive to policy interventions. For example, it is debatable whether resources
should be channelled primarily to those with severe or multiple barriers who are, in some sense, furthest
from obtaining or holding a stable job or to groups with moderate employment difficulties, for whom
policy interventions may have a greater probability of success.
A forthcoming Country Policy Paper to be produced as part of this project will take stock of existing policy
measures for some of the groups identified here. Based on that policy inventory, it will seek to analyse
whether they are well-aligned with the employment barriers identified in this paper.

Policy Analysis Note (PAN) for Lithuania © OECD 2016 29
REFERENCES
Arias, O.S., C. Sánchez-Páramo, M. E. Dávalos, I. Santos, E.R. Tiongson, C. Grun, N. de Andrade Falcão,
G. Saiovici and C.A. Cancho (2014), Back to Work: Growing with Jobs in Europe and Central Asia,
Washington, DC, doi:10.1596/978-0-8213-9910-1.
Card, D., J. Kluve and A.Weber (2010), “Active Labour Market Analysis Policy Evaluations: A Meta-
Analysis”, Economic Journal, No. 120.
Collins, L.M. and S.T. Lanza (2013), Latent Class and Latent Transition Analysis: With Applications in the
Social, Behavioral, and Health Sciences, Vol. 718, John Wiley & Sons.
ESTEP (2014), ES struktūrin s paramos poveikio gyvenimo kokybei, socialin s atskirties ir skurdo
mažinimui Lietuvoje vertinimas, Galutinė vertinimo ataskaita, p. 194.
Eurofound (2012a), “NEETS - Young People Not in Employment, Education or Training: Characteristics,
Costs and Policy Responses in Europe”, Publications Office of the European Union, Luxembourg.
Eurofound (2012b), “Fifth European Working Condition Survey”, Publications Office of the European
Union, Luxembourg.
European Commission (2016a), “Country Report: Lithuania 2016”, Commission Staff Working Document.
European Commission (2016b), “Employment and Social Developments in Europe”.
European Commission (2015), “Upskilling Unemployed Adults (aged 25 to 64): The Organisation,
Profiling and Targeting of Training Provision”, Publications Office of the European Union,
Luxembourg.
Fernandez , R., H. Immervoll, D. Pacifico and C. Thévenot (2016), “Faces of Joblessness. Characterising
Employment Barriers to Inform Policy”, Forthcoming SEM Working Paper, OECD, Paris.
Immervoll, H. and A. Isik-Dikmelik (2016), “Cooperation with the OECD on Assessing Activating and
Enabling Benefits and Services in the EU: OECD-World Bank Joint Methodological Report”,
unpublished report submitted to the European Commission, March.
Immervoll, H. and S. Scarpetta (2012), “Activation and Employment Support Policies in OECD Countries.
An Overview of Current Approaches”, IZA Journal of Labor Policy, Vol. 1(1), pp. 1-20.
OECD (2016a), OECD Economic Surveys: Lithuania 2016, OECD Publishing, Paris.
OECD (2016b), Getting Skills Right: Assessing and Anticipating Changing Skill Needs, OECD Publishing,
Paris.
OECD (2015a), “Activation Policies for More Inclusive Labour Markets”, in OECD Employment Outlook
2015, OECD Publishing, Paris, http://dx.doi.org/10.1787/empl_outlook-2015-7-en.
OECD (2015c), Education at a Glance: OECD Indicators, OECD Publishing, Paris.
OECD (2015d), International Migration Outlook 2015, OECD Publishing, Paris.
OECD (2014a), “The Crisis and its Aftermath: A ‘Stress Test’ for Societies and for Social Policies”,
Society at a Glance: OECD Indicators, OECD Publishing, Paris.

Policy Analysis Note (PAN) for Lithuania © OECD 2016 30
OECD (2013a), “Activation Strategies for Stronger and More Inclusive Labour Markets in G20 Countries:
Key Policy Challenges and Good Practices”, G20Task Force on Employment, Report prepared for
the G20 Summit in St. Petersburg, July, http://www.oecd.org/g20.
OECD (2013b), “Activating Jobseekers: Lessons from Seven OECD Countries”, in OECD Employment
Outlook 2013, OECD Publishing, Paris, http://dx.doi.org/10.1787/empl_outlook-2013-7-en.
OECD (2013c), OECD Skills Outlook 2013: First Results from the Survey of Adult Skills, OECD
Publishing, Paris.
OECD (2008), “Declaring Work or Staying Underground: Informal Employment in Seven OECD
Countries”, in OECD Employment Outlook 2008, OECD Publishing, Paris,
http://dx.doi.org/10.1787/empl_outlook-2008-4-en.
Putniņš, T.J. and A. Sauka (2015), “Shadow Economy Index for the Baltic Countries 2009–2014”,
Stockholm School of Economics in Riga, Riga.
Schneider, F. (2015), “Size and Development of the Shadow Economy of 31 European and 5 Other OECD
Countries from 2003 to 2015: Different Developments”, mimeo,
http://www.econ.jku.at/members/Schneider/files/publications/2015/ShadEcEurope31.pdf.
Schwarz, G.E. (1978), “Estimating the Dimension of a Model”, Annals of Statistics, Vol. 6(2),
pp. 461-464, Doi:10.1214/aos/1176344136.
Vermunt J. K. and J. Magidson (2016), Technical Guide for Latent GOLD 5.1: Basic, Advanced, and
Syntax, Statistical Innovations Inc., Belmont, MA.

Policy Analysis Note (PAN) for Lithuania © OECD 2016 31
ANNEX A
LATENT CLASS RESULTS
Using the 2014 SILC data for Lithuania, the segmentation algorithm outlined in Annex B leads to a model
with 11 groups. Table A.1 shows the estimated parameters, i.e. the share of individuals facing the
employment barriers in each latent group and the related group size in the target population (first row).
Groups are ordered by size; colour shadings are used to highlight barriers with higher (dark blue) and
lower (light blue) frequencies in each group.
Table A.1. Latent class estimates
Percentage of individuals with selected characteristics, by group
Note: Section 2 describes the indicators and applicable thresholds. Group sizes refer to the target population as defined in Section 1. Colour shadings identify categories with high (dark blue) and lower (light blue) frequencies. Complementary categories (e.g. “high” education) are omitted. Additional information on model selection and model specification is provided in Annex B.
Source: Authors’ calculations based on EU-SILC 2014
Table A.2. Characterisation of the latent groups
Percentage of individuals with selected characteristics, by group
Group 1 Group 2 Group 3 Group 4 Group 5 Group 6 Group 7 Group 8 Group 9 Group 10Target
Pop
Group Size (Target population=100) 20 20 17 14 8 7 6 5 2 2 100
"Low" education or sk ills 19 18 35 10 13 20 31 89 40 70 25
No past work experience 0 1 0 0 0 0 74 79 100 2 11
Positive but "low" relative work experience 0 56 56 14 31 54 26 20 0 68 32
No recent work activity 84 90 75 3 44 17 100 99 100 100 67
Health limitations 55 67 20 4 0 6 6 86 0 35 34
Care responsabilities 8 2 2 2 65 29 1 0 99 99 13
High non-labour income 22 18 11 33 54 20 24 12 9 0 22
High earnings replacements 20 11 1 1 11 5 1 60 0 0 10Scarce job opportunities 0 0 91 0 0 91 92 53 80 37 32
Core
indicators
Group 1 Group 2 Group 3 Group 4 Group 5 Group 6 Group 7 Group 8 Group 9 Group 10Target
Pop
Number of individuals (%) 20 20 17 14 8 7 6 5 2 2 100Number of individuals (frequency) 109081 107516 93814 74537 42176 35436 34141 24914 12071 10268 543955
Unstable jobs 7 5 25 35 29 83 2 1 2 0 19
Restricted work ing hours 9 6 0 32 16 0 0 1 0 0 9
Zero or near-zero earnings 4 3 1 52 16 8 0 0 0 0 10
Women* 61 60 39 64 91 60 42 50 97 92 60
Youth 0 0 1 36 41 57 72 43 89 0 21
Prime age 8 55 82 58 58 42 28 48 11 79 47Old-age 92 45 17 5 2 1 0 9 0 21 32
Age (average) 62 55 50 37 31 29 25 34 26 37 47
Employed FT 1 1 0 16 8 0 0 0 0 0 3
Employed PT 8 5 0 26 8 0 0 1 0 0 7
Self-employed FT 1 1 0 14 3 0 0 0 0 0 3
Self-employed PT 1 1 0 16 9 0 0 0 0 0 3
Unemployed 0 10 100 0 0 99 76 16 5 30 32
Retired 60 21 0 2 2 0 0 2 0 12 17
Unfit to work /disable 22 47 0 3 2 0 9 77 0 0 18Housework 5 11 0 4 25 0 8 2 91 50 9
Other inactive 1 2 0 19 43 0 7 2 4 7 7
Employed 12 6 5 81 43 32 0 1 0 0 22
Unemployed 1 10 88 10 5 65 74 17 3 31 29
Inactive 88 84 3 9 52 2 26 82 97 69 48Length of unemployment spell † .. +12 +12 .. .. 10 +12 .. .. .. 12
Primary 0 1 1 0 2 8 3 44 4 3 4
Lower secondary 8 6 15 3 6 8 23 43 35 45 12
Upper secondary 75 81 73 63 49 58 57 12 47 45 66
Tertiary 17 11 12 34 44 26 16 1 14 7 19Years of education 13.7 13.4 13.2 14.5 14.7 13.5 12.9 7.9 12.5 11.9 13.3
Age groups*
Main activity
during the
reference
period
Main activity
at the
moment of
the interview
Level of
education
(ISCED)

Policy Analysis Note (PAN) for Lithuania © OECD 2016 32
Table A.2. Characterisation of the latent groups (cont.)
Percentage of individuals with selected characteristics, by group
Note: Colour shadings identify categories with high (darker) frequencies. The average number of simultaneous barriers per individual is computed for the core indicators in Table A.1 with the exception of recent work experience. Income quintiles refer to the entire population. Poverty risks and material deprivation are calculated with the Eurostat methodology. “Length of unemployment spell” only covers reference period: unemployment spells that started before the start of the reference period are left-censored at the start of the reference period.
* The variable enters as an additional indicator in the latent class model. See Annex B for details.
† Average across observations with strictly positive values.
Source: Authors’ calculations based on EU-SILC 2014.
Group 1 Group 2 Group 3 Group 4 Group 5 Group 6 Group 7 Group 8 Group 9 Group 10Target
Pop
Number of individuals (%) 0 1 0 0 0 0 69 79 100 1 10
No work-related sk ills 0 1 0 0 0 0 69 79 100 1 10
Elementar occupations 19 18 36 14 12 23 10 17 0 55 20
Craft and machine operators 30 36 36 17 17 19 13 2 0 23 26
Clerk and sales 25 23 14 44 37 34 7 2 0 14 24
Technicians et al. 7 8 5 6 5 20 0 0 0 3 7
Professionals 13 11 6 14 25 2 0 0 0 2 10
Managers 6 4 2 5 3 1 0 0 0 1 3Years of paid work experience † 33 15 18 13 9 7 3 .. .. 12 19
Severe health limitations 13 28 3 2 0 0 0 57 0 1 11Migrant 10 6 8 5 7 3 14 2 0 9 7Equivalent disposable income (€/year - average) 4931 4443 2823 5175 6089 3688 3359 3768 3408 2351 4279
Bottom quintile 25 34 67 35 17 53 47 35 37 75 40
Second quintile 26 24 16 14 26 24 27 28 26 23 22
Third quintile 24 21 8 20 28 9 12 24 33 2 19
Fourth quintile 13 13 6 14 10 4 10 9 4 0 10Top quintile 12 8 2 17 19 10 3 4 0 0 9
AROPE (eurostat methodology) 24 33 67 34 17 51 47 35 37 75 39
No material deptivation 66 55 37 69 74 52 47 48 52 40 56Deprived 16 22 22 15 17 18 16 19 19 31 19
Severe 19 23 41 16 9 30 36 34 29 29 25
Sickness and disability recipients (%), 36 52 10 16 9 7 20 80 15 10 28
they receive, in average †1879 2178 1012 1035 .. .. .. 3331 .. .. 1998
Unemployment benefits recipients (%), 8 5 18 15 15 39 5 5 12 6 12
they receive, in average †1521 .. 811 650 .. 495 .. .. .. .. 820
Social Assistance recipients (%), 14 23 55 30 38 54 57 35 79 65 36
they receive, in average †492 623 1021 545 609 861 792 544 690 1201 769
Housing Benefits recipients (%), 3 7 9 2 2 7 7 4 9 6 5
they receive, in average †.. .. 180 .. .. .. .. .. .. .. 178
Family-related benefits recipients (%), 7 7 8 23 72 47 25 22 90 65 22
they receive, in average †1678 .. 604 2212 2517 787 887 .. 543 803 1523
Old-age Benefits recipients (%), 61 23 1 3 1 0 0 3 0 11 18
they receive, in average †2650 2285 .. .. .. .. .. .. .. .. 2523
Single 25 21 33 8 0 2 8 10 0 0 17
Couple without children 44 42 22 26 0 5 13 26 0 3 27
Couple with children 6 14 17 26 61 48 23 30 79 72 24
2+ adults without children 15 17 18 19 0 15 34 20 0 1 16
2+ adults with children 9 6 7 17 31 17 11 13 8 7 12
Lone parents 1 1 3 4 7 12 11 0 13 16 4Have children* 10 6 11 27 100 72 26 26 100 91 28
Number of children † 1.3 .. 1.4 1.5 1.6 1.4 1.4 .. 1.7 1.5 1.5
Age of the youngest child † 5 .. 7 3 3 6 6 .. 4 6 5
Live in rural area* 53 59 70 48 52 42 78 66 67 75 58Household with other work ing household members 43 46 34 70 85 69 61 42 80 60 53
Number of simultaneous barriers 1.2 1.7 2.1 0.7 1.6 2.2 2.5 3.9 3.3 3.0 1.8
Position in
the income
distribution
Material
deprivation
(Eurostat)
Benefits -
Recipiens
and average
amounts
(€/year)
Household
type
Work-related
sk ills (ISCO)

Policy Analysis Note (PAN) for Lithuania © OECD 2016 33
Figure A.1. Share of employed individuals in Group 6
Percentage of group members
Source: Authors’ calculations based on EU-SILC 2014.

Policy Analysis Note (PAN) for Lithuania © OECD 2016 34
ANNEX B
LATENT CLASS ANALYSIS AND MODEL SELECTION
The segmentation method used in this note is Latent Class Analysis (LCA). This method exploits the
interrelations of an array of indicators through a fully-specified (i.e. parametric) statistical model for
organising the target population into homogeneous groups. In the present framework, the indicators
represent employment barriers and the statistical algorithm therefore identifies population sub-groups
sharing similar barriers to employment, e.g. “low skills and scarce job opportunities” for Group 1; “low
work experience and low financial work incentives” for Group 2, etc.
LCA has three main advantages relative to other common segmentation (or “clustering”) methods:
1) Formal statistical tests guide the selection of the optimal number of groups and other model’s features;
2) LCA does not allocate individuals into specific groups in a deterministic way but, instead, provides
probabilities of group membership, thus reducing possible classification errors in any post-estimation
analysis; 3) LCA deals easily with common data-related issues such as missing data and complex survey
designs.
Latent Class Analysis does not automatically provide an estimate of the optimal number of latent classes.
Instead, models with different number of classes are estimated sequentially and the optimal model is
chosen based on a series of statistical criteria. To summarise, the model selection process starts with the
definition of a standard latent-class model that is repeatedly estimated for an increasing number of latent classes
(Step 1).23
The choice of the optimal number of classes is primarily based on goodness-of-fit and
error-classification statistics (Step 2, see also Figure B.1), and then on the analysis of potential misspecification
issues (Step 3). Fernandez et al. (2016) describes these steps in details and provides guidelines for
practitioners interested in adapting the approach to specific analytical needs or data.
Figure B.1 summarises graphically Step 2 outlined above for the Lithuanian SILC 2014; The blue bars
show the percentage variations of the Bayesian Information Criterion (BIC; Schwartz, 1978)24
for
increasing numbers of latent groups, whereas the black line shows, for the same groups, the classification
error statistics (Vermunt and Magdison, 2016).25
In general, a smaller value of the BIC indicates a more
optimal balance between model fit and parsimony, whereas a smaller value of the classification error
statistics means that individuals are well-classified into one (and only one) group. In Figure B.1 the BIC is
minimized for a model with ten classes and the classification error of 9% indicates that the model provides
a good representation of the heterogeneity in the underlying data.
23. A standard latent class model means that the likelihood function is derived under the so-called Local
Independence Assumption (LIA). See Fernandez et al. (2016) for details.
24. The BIC summarises into a single index the trade-off between the model’s ability to fit the data and the
model’s parametrization: a model with a higher number of latent classes always provide a better fitting of
the underlying data but at the cost of complicating the model’s structure.
25. The classification error shows how-well the model is able to classify individuals into specific groups. To
understand the meaning of the classification error index it is important to keep in mind that LCA does not
assign individuals to specific classes but, instead, estimates probabilities of class membership. One has
therefore two options to analyses the results: allocate individuals into a given cluster based on the highest
probability of class-membership (modal assignment) or weighting each person with the related class-
membership probability in the analysis of each class (proportional assignment). The classification error
statistics is based on the share of individuals that are miss-classified according to the modal assignment.

Policy Analysis Note (PAN) for Lithuania © OECD 2016 35
Figure B.1. Selection of the optimal number of latent classes
Post-estimation tests based on the Bivariate Residuals (Vermunt and Magdison, 2005) show for the
ten-class model some residual within-group correlation between four pairs of indicators. This indicates that
the model violates to some extent the Local Independence Assumption (LIA).26
Increasing the number of
latent classes always reduces the residual dependencies between indicators. For instance, the 15-class
model shows no signs of local dependencies, but this comes at the cost of a higher classification error
(18%).
Following Fernandez et al. (2016) and Vermunt and Magdison (2005) the residual dependencies between
indicators is addressed with the so-called direct effects; these are ad-hoc terms that enter the specification
of the likelihood function to model explicitly the joint probabilities of pairs of indicators conditional on
group membership. The inclusion of direct effects eliminates any residual correlation between the relevant
pair of indicators but it also requires repeating the model selection process, as the new baseline model with
local dependencies may lead to a different optimal number of classes. For the new baseline model with
direct effects the BIC still points to the ten-class model, which therefore remains the favourite solution.27
26. The LIA shapes the algebraic specification of the model and, in practice, requires the indicators to be
pairwise independent within latent groups. Bivariate residuals are Pearson chi-squared tests comparing the
observed associations between pairs of indicators with the expected association under the assumption of
local independence; large differences between estimated and observed associations signal violations of the
LIA.
27. Age, gender and regional differences define labour market segments that are worth including in the latent
class model to account for differences between and within these groups. Fernandez et al. (2016) discusses
three possibilities for including additional variables in the model’s specification. In SILC-2014 for
Lithuania the favoured specification in terms of lower classification error, interpretation of the results and
specification tests includes age differences directly in the classification model while gender and regional
differences (degree of urbanisation) enter as active covariates. Figure B.1 is based on a model that already
includes information on age (three categories: 18-29, 30-54, 55-64), gender and degree of urbanisation
(three categories).