Embed Size (px)
Citation preview
Forschungsinstitut zur Zukunft der ArbeitInstitute for the Study of Labor
DI
SC
US
SI
ON
P
AP
ER
S
ER
IE
S
“Face the Bullet, Spare the Rod?”Evidence from the Aftermath of theShining Path Insurgency
IZA DP No. 10093
July 2016
Alvaro MoralesPrakarsh Singh

“Face the Bullet, Spare the Rod?”
Evidence from the Aftermath of the Shining Path Insurgency
Alvaro Morales Amherst College
Prakarsh Singh
Amherst College and IZA
Discussion Paper No. 10093 July 2016
IZA
P.O. Box 7240 53072 Bonn
Germany
Phone: +49-228-3894-0 Fax: +49-228-3894-180
E-mail: [email protected]
Any opinions expressed here are those of the author(s) and not those of IZA. Research published in this series may include views on policy, but the institute itself takes no institutional policy positions. The IZA research network is committed to the IZA Guiding Principles of Research Integrity. The Institute for the Study of Labor (IZA) in Bonn is a local and virtual international research center and a place of communication between science, politics and business. IZA is an independent nonprofit organization supported by Deutsche Post Foundation. The center is associated with the University of Bonn and offers a stimulating research environment through its international network, workshops and conferences, data service, project support, research visits and doctoral program. IZA engages in (i) original and internationally competitive research in all fields of labor economics, (ii) development of policy concepts, and (iii) dissemination of research results and concepts to the interested public. IZA Discussion Papers often represent preliminary work and are circulated to encourage discussion. Citation of such a paper should account for its provisional character. A revised version may be available directly from the author.
IZA Discussion Paper No. 10093 July 2016
ABSTRACT
“Face the Bullet, Spare the Rod?” Evidence from the Aftermath of the Shining Path Insurgency*
We investigate whether violence occurring outside the confines of a home can alter intra-household violence inter-generationally. This paper is the first to explore whether exposure to violence from an armed conflict affects the later use of physical punishment as a child discipline method. Our identification strategy relies on the spatial and temporal variation of the Peruvian civil conflict that occurred between 1980 and 2000. We find that a mother exposed to an additional one hundred violent conflict-related events in her district is 3.4-3.8 percentage points less likely to physically punish her children. This effect is equivalent in magnitude to an additional 10 years of education. We find suggestive evidence that the conflict could have increased parenting knowledge and support. Communities that experienced higher levels of conflict violence saw greater increases in social spending and had more health resources in the post-conflict period. Additionally, we find women’s conflict exposure is associated with a higher likelihood of accessing these resources. JEL Classification: J13, D1, J16 Keywords: domestic violence, civil conflict, physical child abuse, Peru Corresponding author: Prakarsh Singh Department of Economics Amherst College P.O. Box 2201 Amherst, MA 01002-5000 USA E-mail: [email protected]
* For financial support, we would like to thank the Dean of the Faculty at Amherst College. We are grateful to Dan Barbezat, Adam Honig, Jessica Reyes, Kate Sims, and several seminar participants for comments. Thanks to Andy Anderson and Gonzalo Hernandez for their support and we are indebted to Gianmarco León, Fernando Aragon, and Dominik Noe for their kind willingness to share their data sets. The views expressed in this paper are those of the authors and do not necessarily reflect those of granting and funding agencies.

2
I. Introduction
Civil conflict adversely affects the level of economic development through destruction of
physical and human capital, the latter being particularly susceptible to investments at an early age.
Although early life human capital investment is usually measured through education and health,
an important determinant of both is parenting quality. Physical child abuse (hereafter, “PCA”),
which is inherently linked to (lack of) parenting quality, has been shown to negatively impact early
childhood nutritional outcomes as well as increase the probability of committing crime (Morales
& Singh, 2015; Currie & Terkin, 2006). We investigate whether violence occurring outside the
confines of a home can change patterns of intrahousehold violence intergenerationally. Using the
Peruvian civil conflict that occurred between 1980 and 2000, this paper is the first to explore
whether exposure to violence from an armed conflict affects the later use of physical punishment
as a child discipline method.
Civil conflict can have long-term effects on the use of PCA through various channels. Conflict
can normalize and desensitize violent behavior, but it can also lead to positive psychological
growth—witnessing conflict may lead to rejection of abusive punishment. Conflict may have a
direct or inter-generational impact on parental discipline methods. Intimate partner violence
(hereafter, “IPV”) or physical child abuse may increase during civil conflict. Therefore, civil
conflict may mark the beginning of a cycle since childhood exposure to domestic violence is

3
strongly correlated to PCA-use as a parent.1 There could also be indirect effects. Conflict could
influence an individual’s child-rearing capacity through disruptions in schooling, income, or post-
conflict changes in social services. Figure 1 summarizes these channels and relates civil conflict
exposure to subsequent changes in PCA-use.
<Insert Figure 1 Here>
This paper’s identification strategy relies on the spatial and temporal variation of Peru’s civil
conflict. We use a fixed effects model to identify a causal relationship between exposure to conflict
and the later use of physical punishment as reported in three cross-sections of the Peruvian
Demographic and Health Surveys (DHS). The extensive use of fixed effects allows us to obtain
estimates within districts and within birth year cohorts. The main result and a series of robustness
checks confirm that a mother exposed to an additional one hundred violent conflict-related events
in her district is 3.4-3.8 percentage points less likely to physically punish her children, with respect
to survey year, birth year cohort, and district averages as well as regional time trends. This effect
is equal to the impact of an additional 4-10 years of education.
We explore the mechanisms driving the results. The conflict could have increased parenting
knowledge and support. Communities that experienced higher levels of conflict violence (hereafter
“CV”) saw greater increases in social spending and had more health resources in the post-conflict
period. Moreover, women’s CV exposure is associated with a higher likelihood of accessing these
resources. We also conclude that a change in parents’ education or their own history of physical
child punishment does not influence the main result.
We check the external validity of the main results using recent armed violence in Colombia,
one of Peru’s northern neighbors. While the Peru context shows long-term effects, in the Colombia
1 This paper places both “physical child abuse” and “intimate partner violence” (the latter referring more specifically to intimate partner physical violence) under the more general “domestic violence” umbrella.
4
analysis the time gap between the exposure to civil conflict and the reporting of child discipline
strategies is much shorter, thereby allowing for the identification of short-term effects on physical
punishment. Replicating the analysis from Peru, we also find women’s conflict exposure in
Colombia is associated with a decrease in abusive child discipline.
This paper contributes to the literature studying child welfare and the consequences of conflict.
Peru offers fertile ground for investigating the nexus of physical child punishment and armed
political violence. First, physical child abuse is commonplace in Peru. A Gallup study found 29
percent of those polled in Peru knew of “a child who was beaten or physically mistreated by his
or her parents, guardians, or any extended family in the past 30 days” (English & Godoy, 2010).
Recognizing the widespread presence of violence in the home, in the last decade the Peruvian
government has implemented legislative measures and raised public awareness around the issue
(Ombudsman Against Physical and Humiliating Punishment of Children and Adolescents, 2009).
Second, the daily lives of Peruvian citizens were tangibly altered by the internal conflict. The Truth
and Reconciliation Commission (TRC), created to investigate the impact of the violence, estimates
over 69,000 people died as a result of the 20-year conflict, and previous academic research
indicates its repercussions on an array of development-related outcomes.2
Research on the consequences of armed conflict has boomed in the past decade. A third of all
nations have experienced civil conflict since 1960, which may explain the recent uptick in research
in this area of interest (Marshall & Gurr, 2005). Previous conflict research on child welfare finds
2 Grimard & Laszlo (2010) argue in utero exposure to civil conflict negatively affected adult women’s height and anemia status. Galdo (2010) finds a one standard deviation increase in civil conflict exposure is associated with a four percent decrease in adult monthly earnings as reported in 2006 and 2007 household surveys. Gallegos (2012) estimates urban women’s exposure to civil conflict increased their probability of being employed by 8 percent. Sánchez (2010) uses the differences in siblings’ conflict exposure to study its effect on infant mortality and short-term nutritional outcomes. He finds the latter is adversely impacted for those born during times of higher regional conflict intensity. León (2012) finds negative long-term effects on human capital accumulation. He estimates the average child affected by the conflict prior to starting school accumulated around 0.21 fewer years of education.

5
youth’s education, health, and labor outcomes are negatively affected across various settings
(Justino et al., 2011; Blattman & Annan, 2010; Minoiu & Shemyakina, 2014). The conflict
literature has focused on the short-term consequences for children directly exposed to civil conflict
and war (Singh & Shemyakina, 2016). However, the impact of conflict is likely persistent and
inter-generational. Accordingly, this paper adds to the literature by exploring an outcome affecting
the generation of children born to parents who lived through an era of armed violence.
The negative effects of physical punishment are well-documented across the medical,
psychology, and public health literature. In the United States, the total lifetime economic burden
resulting from child maltreatment is estimated to be about $124 billion (Fang et al., 2012).
Physically abused children have worse physical and mental health as adults (Springer et al., 2007;
Felitti et al., 1998). They also have a higher risk of attempted suicide and drug abuse (Dube et al.,
2001). Moreover, physical abuse in childhood is associated with delinquent and violent behavior
in adolescence and adulthood (Gilbert et al., 2009). The majority of PCA research focuses on its
determinants or post-facto outcomes, but little is known about how child abuse rates change in
response to macro-level shocks.3
Given the main finding, this paper joins the small subsection of the conflict literature that
highlights the positive effects that can occur post-conflict.4 Previous studies on conflict’s effect on
domestic violence appear to contradict our main result. Gutierrez & Gallegos (2011), Noe &
3 To our knowledge, only economic shocks have been researched. Using hospital records, Wood et al. (2012) show economic downturns are correlated with greater pediatric admissions for injuries related to abuse. Lindo et al. (2013) use California Department of Justice data to study how the Great Recession affected the prevalence of child abuse. They find male layoffs increase abuse while female layoffs have the opposite effect. Similarly, Markowitz & Grossman (2000) find increases in beer taxes reduce physical punishment by females but not by males. 4 Tilly (1975) argues wars have promoted nation and state formation in Europe. Bellows & Miguel (2009) find an increase in political engagement for individuals that were most affected by the 1991-2002 Sierra Leone civil war. Blattman (2009) finds conflict in Uganda increased political engagement among former combatants. Gil-Alana & Singh (2013) determine longer civil conflicts tend to have faster economic recoveries. Buvinic et al. (2013) argue post-conflict political transitions have increased women’s participation in civil and political life.

6
Rieckmann (2013), and La Mattina (2013) find women’s conflict exposure is linked to an increased
probability of IPV-victimhood in Peru, Colombia, and Rwanda, respectively. However, in a
departure from previous literature, we focus on violence directed at children rather than adults and
perpetrated by women rather than men.5 Moreover, we show that our outcomes are not mutually
inconsistent with previous research by presenting evidence for the normalization of violence, the
theory Gutierrez & Gallegos (2011) employed to explain their results.
In the next section, we provide a background on the Shining Path Insurgency. Section III
describes the data. Section IV delineates the conceptual framework and the main empirical
strategy. Section V presents the main results and a series of robustness checks, and Section VI
tests for the possible channels behind the main results. Section VII focuses on an external validity
check using civil conflict in Colombia. Section VIII concludes.
II. History of Peru’s Civil Conflict
Peru’s civil conflict cost the lives of an estimated 69,280 people (TRC, 2004). The violence
traces back to a small town in Peru’s Ayacucho region, where ballot boxes were burned during the
1980 presidential elections. The event symbolized the beginning of what the Shining Path (Sendero
Luminoso), a Maoist rebel group, called the “popular war” against the state (TRC, 2004). A smaller
armed rebel group, the Túpac Amaru Revolutionary Movement (Movimiento Revolucionario
Túpac Amaru; MRTA), also gained traction in the early 1980s. These groups arose from radical
left-wing ideologies that grew in pockets of Peru’s southern Andes (TRC, 2004).
The Shining Path terrorized communities by killing local government officials and police,
5 This paper focuses on PCA-use by mothers because the data stem from private interviews with women. Male PCA-use was not recorded as often, even in households where the husband was present. Moreover, the data do not make a clear distinction between husbands, non-spouse intimate partners, and the fathers of the respondents’ children (due to these data limitations, this paper assumes the three are synonymous). Nonetheless, a section on general household and fathers’ PCA-use is available in the Appendix.

7
disrupting elections, and bombing police stations, bank agencies, and town halls (Sánchez, 2010).
The Shining Path’s strategy involved proceeding from rural areas to cities (León, 2012). Affected
communities were forced to join or support the Shining Path, although many resisted by creating
their own paramilitary forces. The central government underestimated the Shining Path’s influence
and failed to send the National Army to affected areas until 1983. As the rebel forces retreated
from the Army, the violence spread to the Amazonian region in the eastern part of the country and
across the Andes.
The Peruvian army was ill-prepared to fight the insurgency. Guerilla tactics overwhelmed
soldiers, who were mostly unfamiliar with indigenous languages and the geographic layout of the
areas where they fought. This led to the indiscriminate use of violence against civilians by the
army and police, thus further fueling the conflict’s expansion. Violence intensity escalated in the
late 1980s and early 1990s when the Shining Path again spread geographically and advanced to
major cities. After Alberto Fujimori’s auto-coup in 1992, the fight against the Shining Path took a
dramatic turn. He enacted a curfew system and limited civil liberties with new anti-terrorism laws.
The conflict’s intensity began to decline soon after the arrest of Abimael Guzman, the Shining
Path’s leader, in September, 1992. Many people abandoned guerilla groups after the capture of
other high-ranking leaders and the government’s subsequent campaign touting the success of its
anti-terrorism agenda (Sánchez, 2010).
<Insert Figure 2 here>
<Insert Figure 3 here>
Figures 2 and 3 illustrate the conflict’s temporal and spatial progression. Although the fighting
was concentrated in the Andes Mountains and Amazon jungle, the conflict affected each one of
Peru’s 25 regions. The violence peaked in 1984 and 1989-1992 before a steady decline until 2000.
This paper’s identification strategy uses the conflict’s non-monotonic variation over time and
8
space, which is rarely observed in conflict data, to identify the causal impact of conflict exposure
on children’s physical punishment.
III. Data
Criticisms of the government’s use of violence against civilians in the fight against the Shining
Path increased after President Fujimori fled Peru in 2000.6 Consequently, the Truth and
Reconciliation Commission (TRC) was established in 2001 to assess the impact of the civil conflict
and the extent of the previous government’s abuses.7 The TRC gathered data on human rights
violations that occurred between 1980 and 2000. Eleven offices were installed in different parts of
the country to receive and actively collect testimonies (Sánchez, 2010). Between September 2001
and 2003, well-advertised public hearings took place in 530 districts from 137 provinces to collect
testimonies from victims, relatives, and witnesses. The data received were evaluated against six
other datasets from non-profit human rights organizations and the government. The resulting
dataset contains detailed information (perpetrator’s affiliation, victim’s characteristics, location,
date, etc.) on violent conflict-related events: murders, kidnappings, forced recruitments, forced
disappearances, tortures, rapes, and injuries.
We merge the civil conflict dataset with three cross-sections of the Peruvian Demographic and
Health Surveys (DHS) from 2000, 2011, and 2012.8 DHS are nationally representative, randomly
sampled, and standardized.9 They contain data from private in-home interviews with 74,248
6 For more on the controversial series of events leading to President Fujimori’s fall from office, see Perry (2005). 7 León (2012) gives more context to the TRC: “The [TRC] was a flagship program of the transition government, and it was declared one of its priorities. It was well resourced, with a total budget of about US$19 million over two years of operation, provided by the government and aid agencies. Apart from designating reputable commissioners, the [TRC] also recruited top academics and young professionals for the two years it operated” (999). 8 Data on self-reported use of PCA were only available in the 2000, 2011, and 2012 DHS surveys. 9 The use of a random sample differentiates this paper from most domestic violence research. Yount et al. (2011) highlight family violence research is constrained by the use of data from small clinical samples or purposive samples from nonrandom populations. However, reporting of domestic violence may be nonrandom as discussed later.

9
women ranging from 15 to 49 years old, and almost 40,000 of those interviews included questions
regarding domestic violence and child discipline. The respondents were asked how they and their
partners (if applicable) discipline their children. The binary variables ‘PCA-use’ and ‘Partner
PCA-use’ takes a value of one if the respondent mentions “beatings/physical punishment” (as
interpreted by the interviewer) as a way she or her partner punish their children. It is important to
note that we are using self-reported punishment of children and that this physical punishment is
our proxy for PCA.
Forty percent of respondents and 39 percent of their partners use PCA, and PCA-use is present
in 48 percent of all two-parent households in the sample. These estimates are consistent with other
government and UNICEF statistics from Peru (Ombudsman for Children and Adolescents, 2009).
The measure of PCA-use does not account for the intensity or frequency of punishment, yet it is
considered a reliable proxy for the presence of PCA in a household.10 Testing for the general use
of physical punishment minimizes the concern that the most abusive parents are more likely to
hide their maltreatment; however, misreporting may still be a concern. The share of women who
use PCA decreased from 43 percent in 2000 to 38 percent in 2011-2012. This decrease may stem
from a combination of evolving norms, a younger generation of parents, and new laws against
domestic violence. It is also possible that the change in laws decreased the reporting of PCA rather
than its actual use. Nonetheless, these concerns can be addressed by analyzing a less incriminating
question that may also reflect changing views on the use of abusive child discipline. Respondents
were asked whether physical punishment is a necessary part of children’s education: 36 percent
agreed in 2000 and only 20 percent in 2011-2012. This suggests a change in attitudes towards
physical child abuse over time.
10 Gage & Silvestre (2010) use a similar measure of physical child abuse. Moreover, the child discipline module is widely used around the world to estimate the prevalence of physical punishment (UNICEF, 2010).
10
Civil conflict exposure variables are determined by DHS survey respondents’ district of
residence and date of birth. The main explanatory variable used throughout the paper, ‘Lifetime
Conflict Exposure’, sums the number of violent civil-conflict-related events that took place in a
respondent’s district after her birth date. Conflict intensity or exposure is also alternatively
measured by the following variables: ‘0-8’,‘9-16’, and ‘17+’. These count the number of violent
civil conflict events that occurred in the respondent’s district according to the age interval in which
she was exposed to them. The specific age intervals were chosen for three reasons. First, they are
consistent with the related literature (Gutierrez & Gallegos, 2011). Second, they roughly align with
Peru’s educational system (schooling is compulsory for children 6-16 years old). Finally, these
intervals allow us to test for heterogeneous results.11
<Insert Table I here>
Table I presents the descriptive statistics. Sixty-six percent of women live in a district where
at least one conflict-related event occurred in their lifetime. On average, they were exposed to
seven events between the ages of 0-8, 11 events between the ages of 9-16, and 23 events after
turning 17 years old. On average, women exposed to CV in their district have more schooling and
wealth than those never affected. They are also more likely to use physical punishment, to be
victims of IPV, and to have histories of childhood abuse. Nonetheless, since the normalized
differences are all less than 0.25, the selected characteristics are similar for conflict-affected
women compared to women never exposed to conflict.
11 We hypothesize the effect of childhood exposure to conflict on PCA-use greatly differs from the effect of exposure during adolescence or adulthood. For example, referring to the causal channels established in Figure 1, an individual’s education or childhood history of PCA may not be impacted by conflict if it occurs once the individual is older, has completed her education, and is no longer disciplined by her parents. Accordingly, the use of three age intervals for conflict exposure provides a useful placebo check for the results in the Channels section.

11
IV. Conceptual Framework and Empirical Strategy
A. Conceptual Framework
In relation to prior civil conflict exposure, the probability a parent uses physical punishment
can be modelled by the following risk factors: exposure to civil conflict (C), domestic violence
history (D), child-rearing capacity (E), and other factors (Φ) not affected by civil conflict. The
model takes the form:
(1) Pr(PCA) = ƒ(C , D(C) , E(C) , Φ), assuming > 0 and < 0
i. Exposure to civil conflict (C): Considering the timespan between the end of the conflict and
the DHS data collection, the direct psychological impact of exposure to civil conflict on the
probability of PCA-use is a long-term effect that is difficult to isolate. On average, the last time a
respondent was exposed to a conflict-related event in her district was 1996, which is four, 15, and
16 years prior to the survey for women interviewed in 2000, 2011, and 2012, respectively. Any
direct effect conflict has on PCA-use could diminish over these long intervals.
Nonetheless, C may still be a relevant channel. Living through an armed conflict could perma-
nently alter one’s attitudes towards the use of violence. The normalization theory posits aggressive
behavior can stem from the desensitization of violence, which is attributed to a history of witnessing it
(Fowler et al., 2009). In contrast, the post-traumatic growth theory considers the positive psycho-
logical development that can occur after significant trauma. This theory suggests that individuals who
lived through conflict may realize the faults in using aggression as a negotiation tool and sub-sequently
be less likely to punish their children. Powell et al. (2003) find evidence for psychological growth
among former refugees and displaced persons affected by war in former Yugoslavia, and Carmil &
Breznitz (1991) argue Israeli Holocaust survivors are more religious and optimistic.12
12 See also Maguen et al. (2007); Pietrzak et al. (2010); Feder et al. (2008).

12
ii. Domestic violence history (D): There is a strong relationship between being a victim of
physical punishment as a child and using it as a parent (Gage & Silvestre, 2010; Newcomb &
Locke 2001; Berlin et al. 2011; Walker, 2009). Witnessing IPV as a child is also correlated to
PCA-use as a parent (Cunningham & Baker, 2007). This is known as the inter-generational
persistence of domestic violence, which implies that any shock to domestic violence may have
long-term effects on parental behavior.
Civil conflict could affect domestic violence in the short-run through the above-mentioned
normalization of violence and post-traumatic growth theories.13 Other channels may be relevant
as well. Domestic violence could rise during conflicts due to increased stress levels, budgetary
constraints, and insecurity. Conversely, it could decrease if the conflict affects time allocated for
child-rearing (see Lindo et al., 2013). Parents might spend more time with their children due to
conflict’s impact on the labor market, curfew laws, and violence and instability on the streets.
iii. Child-rearing capacity (E): Physical punishment is not an effective discipline method
(Gershoff, 2002). As a result, we assume PCA-use is a sub-optimal behavior that occurs when
there is a lack of child-rearing capacity, meaning there is a shortage of resources allocated to proper
child discipline. Through its effects on income, socio-economic status, and child-rearing
knowledge, education increases the amount of resources available for proper child discipline. The
amount of resources available for proper child discipline may also increase due to community-
level factors. For example, through support in children’s healthcare, schooling, or nutrition, a
community can increase a parent’s child-rearing capacity.
13 In exploring conflict’s effect on individuals’ domestic violence histories, we focus on their exposure to physical child abuse as children because no data are available on whether respondents witnessed IPV while growing up. Nonetheless, conflict’s short-term effect on IPV likely runs through similar channels as the effect on PCA.

13
The long-term effect of conflict on child-rearing capacity can go in either direction. Fearful or
poverty-stricken parents may delay or interrupt their children’s schooling. Parents’ reallocation of
resources towards boys and away from girls could also affect education outcomes (Singh &
Shemyakina, 2016). There may be supply side shocks as well; Léon (2012) finds attacks on
teachers partly drive the decrease in schooling in the aftermath of Peru’s civil conflict.
Nevertheless, education could increase if conflict’s negative effect on available wages lowers the
opportunity cost of schooling (Arcand & Wouabe, 2009). Conflict can also have a long-term effect
on the level of community resources available to parents. On the supply side, post-conflict
reconstruction policies could influence the level of social and health services in communities
affected by conflict (Grimard & Laszlo, 2013). On the demand side, through conflict’s effects on
income and health, parents may need to access resources such as hospitals and social programs
more frequently.
<Insert Figure 4 here>
B. Empirical Strategy
We estimate the net effect of past exposure to civil conflict on the probability of PCA-use
several years after the violence has ceased. Figure 4 suggests individuals born in the same year
will have varied conflict exposures depending on their district of birth. In addition, Figure 4
highlights that even individuals born in the same district but in different years will be affected by
different levels of conflict intensity. This within district variation is observed throughout the
country. Consequently, we use a fixed effects (FEs) model, one that mimics a Difference-in-
Difference-in-Difference (D-I-D-I-D) estimation, to isolate the impact of conflict that cannot be
14
predicted by fixed factors within a district and time-varying factors across the country.14 In
addition to fixed effects, we further control for omitted variable bias with relevant covariates like
wealth, education, household characteristics, and childhood history of PCA. The following
specification compares an individual’s PCA-use against the average of those born in the same
district and those born in the same year by using variation in conflict exposure stemming from the
changing intensity of conflict violence in a specific location and the timing of respondents’ birth
(the latter assumed to be exogenous). From Equation (1), we estimate the following reduced-form
model:
(2) Yicsjrt = β0 + β (Violence Exposurecj) + Xi + ηj + νc + ωt + δr(s) + εicsjrt
where i indexes survey respondents, c represents cohorts based on birth years, s indexes five-year
birth cohorts, j denotes districts in regions r, and t marks survey year. Yicsjrt is a binary variable
identifying whether the survey respondent uses physical punishment to discipline her children. The
‘Violence Exposure’ variable takes one of two forms, as described at the end of Section III. Xi is
a vector of individual and household-level controls. η represents district FEs, which control for the
average differences across districts in observed or unobserved predictors. Similarly, ν denotes birth
year cohort FEs and controls for the variation purely due to year of birth. For example, individuals
born in earlier decades might be more likely to use physical punishment. Birth year cohort FEs
also control for the average country level changes in correlates of conflict (such as nationwide
changes in government services, military capacities, and political and economic institutions). ω
allows for survey year dummies, which help account for the differences in the reported use of PCA
across the three DHS surveys. The model also includes flexible region-specific trends for each
five-year birth cohort, as denoted by δr(s). These trends account for any differences across five-
14 The model mimics a D-I-D-I-D estimation in that it controls for differences across space with district fixed effects and controls for differences across time with birth year cohort and survey fixed effects. Moreover, the common trend assumption is partly relaxed with the inclusion of regional time trends.

15
year birth cohorts in each region; they capture trending effects such as the difference in each
region’s development over time.
The identification strategy assumes there are no preexisting non-linear trends affecting PCA-
use in districts that experienced CV. We use data on whether respondents were themselves
disciplined with PCA to check the validity of this assumption, albeit in an imperfect manner. Table
II reveals PCA-use over time may have decreased by more in districts that were not exposed to
CV in comparison to districts that were. Consider Column (1). Accounting for district fixed effects,
respondents born in the 1960s, 1970s, 1980s, and 1990s in districts that never experienced CV
were respectively 1.8 (not significant), 2.4, 7.9, and 24.8 percentage points less likely to have a
childhood history of PCA in comparison to those born in the 1950s. Meanwhile, the changes were
either insignificant or not as large for those born in districts that experienced at least one violent
conflict event.
<Insert Table II here>
The marked difference across districts within a region is the pivotal reason behind using district
FEs. Districts are the smallest geographic subdivisions in Peru while regions are the largest. In a
country as geographically and culturally diverse as Peru, it is difficult to compare persons living
within the same region but in different districts. Estimations without district FEs are biased because
there are likely district-level omitted variables that are correlated with civil conflict intensity and
PCA. As La Mattina (2013) notes for Rwanda’s genocide, weak social networks or poor law and
policing structures at the local level could be related to both domestic violence and civil conflict.
Consequently, district-level FEs (1,083 units) are preferred to region or province-level FEs (25
and 183 units, respectively) although some variance in the explanatory variable is compromised
in exchange for improved control against bias. Since the large set of fixed effects eliminates
considerable variation in the main explanatory variable, the estimates presented are conservative.

16
Additionally, the unobservable in the error term could be serially correlated for individuals within
the same district both within and across survey periods. To allow for this serial correlation, the
standard errors in all regressions are clustered at the district level.15
V. Results
A. Main Results
<Insert Table III here>
Table III, Columns (1) – (3) display the results for the main specification using a linear
probability model (LPM) and Columns (4) – (6) show the marginal effects at the mean from a
probit model. The fixed effects influence how the results should be interpreted. All results
presented denote the marginal effect of civil conflict violence exposure with respect to district,
birth year, and survey year averages (first two levels of controls) and also with respect to regional
trends (third level of controls).16
The ‘Lifetime Conflict Exposure’ marginal effects are consistent across the two models in
Table III. At the strictest level of controls, the linear probability model can be interpreted as
follows: exposure to an additional hundred conflict-related events decreases the probability that a
mother will use PCA by 3.4 percentage points, with respect to birth year cohort, district, and survey
year averages as well as regional time trends. In Column (6), the marginal effects at the mean
predict a 3.8 percentage point decrease. These estimates imply a one standard deviation increase
in lifetime exposure to violence would decrease the probability of using PCA by 3.2 percentage
points. Both estimates are significant at the 1% level.
15 The main results are robust to clustering at “lower” or “higher” levels (survey cluster and province or region level, respectively). 16 Léon (2012) highlights the fundamental difference in showing the effects at the district level instead of the national level. Consider Table III. At the first level of controls, the ‘Lifetime Conflict Exposure’ coefficients are positive and significant (1% level) when omitting all spatial FEs, negative and insignificant when using region FEs, and negative and significant (1% level) when using province FEs (results not shown). As the FEs “zoom in” the effect of conflict on PCA-use becomes more negative.
17
Other coefficients contextualize the size of civil conflict’s effect on PCA. The biggest predictor
of PCA-use is whether the respondent was physically punished in childhood; all else equal, women
who were punished physically as children were 17.3 percentage points more likely to use PCA.
This effect highlights the importance of the inter-generational continuity of domestic violence. The
effect of wealth is notable as well; women in the highest wealth quintile are 7.7 percentage points
less likely to use PCA relative to those in the lowest quintile. Assuming a strictly linear relationship
between years of education and PCA-use, the ‘Lifetime Conflict Exposure’ coefficient is more
than 10 times the size of the effect of an additional year of schooling for women or their husbands.
The rest of the covariates affect PCA in expected ways.17
<Insert Table IV here>
Table IV shows how additional exposure to violence during different life stages affects the
later use of physical punishment.18 The marginal effects of exposure to civil conflict between the
ages of 0 and 8 years are negative but generally statistically indifferent from zero. In Column (3)
in Table IV, the coefficients for the ‘9-16’ and ‘17+’ exposure variables are -0.034 and -0.037,
respectively. Although similar in magnitude, the coefficient on ‘9-16’ is more significant than
‘17+’. Similar to Table III, the marginal effects for the three violence exposure variables are
consistent across LPM and probit specifications.19
17 The covariates affect PCA in the direction the child maltreatment literature would predict; this reinforces the dependent variable’s validity as an indicator of physical abuse. Partner’s age, number of household members, and number of children under the age of five are not significantly associated with PCA-use (although they might be highly correlated with other significant predictors). The effect of respondents’ age (not included as a control in the regressions) on the use of PCA is unclear because 99.7 percent of its variation is absorbed by the birth and survey year FEs (which control for age indirectly).
18 The results in Table IV are consistent with Table A.II (available in Appendix), which uses alternate age intervals (0-4, 5-9, 10-14, 15-19, 20+) to measure exposure to civil conflict. Exposure to conflict after childhood continues to drive the decrease in the probability of PCA-use as a parent. 19 Gutierrez & Gallegos (2011) note using separate age intervals assumes the conflict exposure variables are additive separable. For example, the results from Table IV assume the exposure to civil conflict during a given age interval is independent from the exposure during another interval. Table A.III in the Appendix shows only the coefficient for ‘17+’ remains negative and significant when the additive separable assumption is relaxed by interacting the three violence exposure variables with each other. Table A.II, Column (3) suggests an additional 100 events of civil conflict exposure after the age of 17 years is associated with a 3.1 percentage point decrease in the probability of PCA-use, conditional to

18
Table A.I (available in the Appendix) attempts to estimate the effects at varying levels of
conflict exposure. In contrast to the previous two tables, these results focus on estimating average
marginal effects (AMEs).20 The coefficients for the AMEs at varying levels are consistent with
both the LPM and probit outcomes.21 The rest of this paper will apply the linear probability model
to the main specification for the following two reasons. First, as shown by Table A.I, there is no
empirical evidence for non-linear effects of civil conflict exposure on PCA-use. Second, LPM and
probit regressions produce comparable results.22
B. Robustness Check: Migration
Failing to account for migration could bias the estimates. Given data limitations, it is
impossible to determine the districts where respondents were born or where they lived during their
childhood or teenage years. Consequently, individuals who ever lived in another district may be
assigned incorrect civil conflict exposure values. We compare the descriptive statistics for
migrants and non-migrants using a DHS data variable noting the number of years a respondent has
lived in her current home, see Table A.IV in the Appendix. On average, migrant women have
higher rates of childhood history of PCA and PCA-use.23 Moreover, migration and civil conflict
exposure are positively correlated: an estimated 435 communities were abandoned as a result of
having never experienced violence prior to turning 17. 20 The marginal effects at the mean in Tables III and IV represent the marginal effects for the average observation (the average observation is assigned the mean values of the covariates in the regression). The average marginal effects in Table A.I, calculated using Stata’s margins command, are useful in this scenario since the “average observation” is difficult to conceptualize, especially given the large set of fixed effects. The AME is calculated by averaging the marginal effect estimated independently for each individual.
21 The estimations’ similarity across varying margins is an unexpected result, and it is not clear why the response to low conflict intensity should be the same as high intensity. Consequently, Table A.I should be interpreted with caution because it may expose the shortcomings of the margins command in Stata. Consider the commands’ AMEs estimations for ‘Years of schooling’ and ‘Partner’s years of schooling’. They also do not change across varying margins—which intuitively appears highly unlikely. 22 Probit results shown are robust to using logit. Logit follows standard logistic distribution, while probit follows the standard normal distribution. Logit’s distribution has a lower peak and fatter tails relative to probit models. 23 A respondent who has always lived in her current home or lived there prior to the start of the civil conflict in 1980 is considered a non-migrant.
19
Peru’s civil conflict (Gallegos, 2012). Consequently, if the bias resulting from the inclusion of
migrants in the analysis is accounted for, then the estimates on Tables III and IV will be even more
negative.24
<Insert Table V here>
Table V tests whether Table III is robust to controlling for migrants. The migrant variable is
significant at the first two levels of controls, which may suggest migrant women were more likely
to use PCA. The interaction variable of lifetime conflict exposure and the dummy variable for
migrants are not significant, and the conflict exposure variable has similar coefficients and
significance as in Table III.
C. Robustness Check: Propensity Scores
This subsection uses propensity scores to improve the composition of the sample used in the
main analysis. Figure 3 shows certain areas near Peru’s peripheries were not affected by violence
and the most affected districts were located in the Andes region east of Lima (Peru’s capital).
There exists large economic and cultural differences between Peru’s coastal and Andean regions,
and these differences might be correlated both with the pervasiveness of PCA-use and a region’s
civil conflict history. The use of district fixed effects alleviates this concern. Nevertheless,
propensity scores can further improve the analysis by restricting the sample to more comparable
individuals and thus reduce the amount of extrapolation involved in the LPM (Stuart, 2010).
Propensity scores estimate the probability that any given district will be exposed to a certain
level of violence (the treatment), conditional on a set of covariates. Unlike in the main analysis,
here we use a dataset of districts rather than individuals. We define the treatment group to include
24 It is worth highlighting that the distinction between migrants and non-migrants is problematic. First, the classification of migrants is flawed; due to data limitations, respondents who ever moved to different homes yet stayed within their birth district are erroneously considered migrants. Second, migrants who were displaced by the conflict were likely the ones most affected by it, so overlooking their outcomes distorts the true relationship between conflict exposure and physical child punishment.

20
districts exposed to at least nine conflict-related events from 1980-2000 (the median for districts
affected by violence); the remaining districts are part of the control group. We use districts’
characteristics to estimate the conditional probability (propensity score) of an individual district
receiving the treatment.25
<Insert Table VI here>
We use the district-level estimated probabilities of treatment in two ways. First, the
probabilities are used to restrict the main specification to individuals living in districts that are
within the “common support” of propensity scores. This means the regressions include only
observations whose propensity scores belong to the overlap of the propensity scores for the
treatment and control districts.26 These results are presented in Table VI, Panel A. ‘Lifetime
Conflict Exposure’ remains significant at the 1% level and is larger than previous estimates.
Second, we use the propensity scores to replicate Table III with a weighted least squares (WLS)
specification, which downweights individuals who live in districts that were likely to receive
treatment and upweights those who live in districts that were unlikely to receive treatment based
on the covariates used in the probit model (Bjerk, 2009).27 Using propensity score weights in the
regression makes the treated and untreated groups more comparable in terms of the distribution of
25 Table A.V (available in the Appendix) shows the probit model used to obtain the propensity scores. We assume the treatment meets the conditional independence assumption: after controlling for the covariates included in the probit model, the treatment is independent of the outcomes. Stuart (2010) explains the assumption is not as strict as it might sound, “controlling for the observed covariates also matches on or controls for the unobserved covariates, in so much as they are correlated with those that are observed” (3). We also assume the conditional probabilities of receiving the treatment given the covariates is strictly between zero and one.
The covariates included in the model should be measured before 1980 so that they are unaffected by the treatment. However, in Table A.V, Columns (3) – (4), we include the variables ‘Population per district,’ ‘Number of schools,’ and ‘Number of Health Posts’ from a 1993 census. Since district data are unavailable before 1980, these variables are used to proxy for pre-treatment values. Léon (2012) explains schools were not targeted by the Shining Path, therefore it is unlikely ‘Number of schools’ is an outcome variable. 26 The goal behind the common support restriction is to include in the LPM only control districts that are similar enough based on propensity scores to be matched to treated districts, and vice versa (Bryson et al., 2002). 27 The formula used to create weights is shown in the notes of Table VI. Weighting by propensity scores creates a pseudo-population where there is no confounding (Cole & Hernán, 2008). The combination of weighting and regression leads to a model that is “doubly robust”—meaning the estimator is consistent if either the propensity scores probit model or the least squares model is correctly specified (Inbens, 2004).
21
covariates that are correlated with being treated (ibid.). Table VI, Panel B shows the results for the
weighted model, which are also consistent with the main finding.
VI. Channels
A. Acceptance or Rejection of Domestic Violence: Normalization vs. Post-traumatic Growth
In this subsection, we test whether Peru’s civil conflict had long-lasting effects on the
acceptance or rejection of the use of violence in the home. As discussed in Section IV, post-
traumatic psychological growth could explain the main result. Conflict exposure could reveal the
perils of using violence as a negotiation method, therefore decreasing affected women’s use of
physical punishment. Table VII contests this hypothesis by presenting the relationship between
civil conflict and attitudes towards domestic violence. Despite this paper’s main result, Column
(3) in Table VII may suggest women affected by higher conflict intensity are more likely to agree
that physical punishment is a necessary part of children’s education, though the coefficients are
only significant at the 10% level. More suggestive evidence for the normalization of violence is
observed by employing tests similar to ones used by Gutierrez & Gallegos (2011): Columns (4) –
(6) show mothers exposed to higher levels of civil conflict might be more likely to accept
justifications for intimate partner violence (IPV), although this relationship is not significant at the
strictest level of controls. Additionally, out of the women abused by their partners, those exposed
to higher conflict intensity were less likely to report the abuse or seek help. Column (9) suggests
women exposed to an additional hundred conflict-related events are four percentage points less
likely to report IPV; this result is significant at the 5% level.
<Insert Table VII here>
Table VII indicates conflict exposure might increase the acceptance of domestic violence,
thereby supporting the normalization of violence theory. In accordance with what Gutierrez &
22
Gallegos (2011) find, this hints that previous exposure to conflict may increase the likelihood that
women are victims of IPV. On the surface, these findings contradict the main result.28 However,
it is imperative to distinguish between the two ways the normalization of violence could work. It
could normalize the use of violence, or it could normalize being a victim of violence. Table VII
lends more support to the latter; therefore we cannot conclude that conflict-affected affected by
violence are less likely to physically punish their children due to changed views regarding the use
of violence.
B. Domestic Violence History
There is overwhelming evidence that parents who were physically punished while growing up
are more likely to use corporal punishment (Gage & Silvestre, 2010; Newcomb & Locke 2001;
Pears & Capaldi, 2001; Berlin et al., 2011). However, the conflict exposure variables on Tables III
and IV remain strongly significant and mostly unchanged once mothers’ own history of PCA-
exposure is accounted for. Therefore we rule out a parent’s own PCA exposure as an active channel
behind the main results.
<Insert Table VIII here>
Nonetheless, Table VIII explores whether CV affected parents’ exposure to PCA. Columns (1)
– (3) show cumulative violence exposure is significantly associated with a history of PCA, and
Columns (4) – (6) further reveal exposure during ages 9 - 16 is also significant. More importantly,
Column (6) suggests women exposed to an additional 100 conflict-related events between the ages
of 9-16 were 3.7 percentage points less likely to have been physically punished by their parents
28 The results on Table VII, which appear to contradict the main results, hint at the problem of misreporting in the data. It is possible this paper’s main result is driven by mothers who were exposed to civil conflict are less likely to report their use of physical child abuse as parents, thereby biasing the results.
23
(with respect to controls, fixed effects, and trends). The effect’s magnitude is large relative to other
predictors. The results suggest civil conflict had short-term effects on child discipline strategies.
Table IX complements the above analysis by exploring the heterogeneous effects of conflict
with respect to previous exposure to domestic violence. ‘Lifetime Conflict Exposure’ is interacted
with an indicator variable identifying a childhood history of PCA in Columns (1) – (3) and an
indicator variable for IPV-victimhood in Columns (4) – (6). The focus is on Columns (7) – (9)
since they include both interaction variables. Column (9) shows the probability of PCA-use
increases by 16.6 percentage points if the respondent has a childhood history of PCA and by 7.9
percentage points if she has been exposed to IPV. These figures highlight the extent of the inter-
generational continuity of domestic violence.
<Insert Table IX here>
The positive coefficient for ‘Lifetime Conflict Exposure*Childhood History’ of PCA implies
the effect of conflict on PCA-use is smaller in magnitude for women who were physically punished
in childhood. Conversely, the interaction term ‘Lifetime Conflict Exposure*Exposed to IPV’ has
a negative coefficient. Conditional on a one hundred conflict-related event increase in exposure
for both groups, women who are victims of IPV are 2.8 percentage points less likely to use PCA
than women who have never been affected by IPV. The effect on the probability of PCA-use
associated with a hundred event increase in conflict exposure for victims of IPV—a 6.4 percentage
point decrease (-3.6 + -2.8)—is nearly as large as the effect of being in the 4th quintile of the wealth
index relative to the lowest—a 6.5 percentage point decrease. It appears different types of domestic
violence histories have differing interactive effects on PCA. One reinforces the effect (childhood
history of PCA) and the other subtracts from it (IPV). This affects how the abovementioned
evidence for the normalization of violence should be assessed. The negative coefficient for
24
‘Lifetime Conflict Exposure*Exposure to IPV’ contradicts the theory that conflict-affected women
were normalized to the use of violence.
C. Child-rearing Capacity As motived in Section IV, the effect of civil conflict on PCA could be explained by parents’
child-rearing capacities, which are partly determined by parents’ education and access to
community resources related to parenting. As with mothers’ childhood histories of PCA, mothers’
formal education is not an active channel behind the main results because the coefficients for the
CV variables on Tables III and IV are not affected by the inclusion of schooling controls.
Table X serves to further reject that changes in parents’ educational achievement influenced
the results. The table does not provide conclusive evidence that CV exposure is linked to years of
schooling for either respondents or their partners.
<Insert Table X>
Formal education is related to PCA-use in part through schooling’s impact on the level of
resources a parent can use on proper child discipline. A better educated parent may be better able
to afford healthcare services, may have better child-rearing knowledge, and may have more time
to spend with her children. Community resources and social spending can lead to the same
outcomes from the supply side. For example, parents in a community with greater access to
healthcare will in effect “outsource” some of their child-rearing to medical professionals that are
better trained to support an ill child. A health visit might also have spillover effects on child-rearing
knowledge. Although we use healthcare as an illustrative example, the same can apply to any
community resource that can support parents in their child-rearing.
<Insert Table XI>

25
Table XI is used to test the hypothesis that the main results could be driven by an increase in
community resources available to mothers in the districts that civil conflict affected most.29 The
‘Healthcare personnel (logged)’ variable is the natural log of the sum of public medical personnel
in each district in 2012. Columns (1) – (3) show a positive relationship between civil conflict
intensity and higher levels of government-provided healthcare. After controlling for districts’
characteristics and region fixed effects, Column (3) estimates districts that experienced an
additional 100 civil conflict events had on average 30.3 percent more public health personnel in
2012. This increase implies an additional 125 healthcare workers.30
We utilize yearly district revenue data from 1998 to 2008 to explore civil conflict’s impact on
the growth of social spending, which may affect the level of community resources available to
mothers. Columns (4) – (6) in Table XI focus on transfers to district governments from the
Municipal Compensation Fund (FONCOMUN). These equalization grants are transferred to
districts with the goal of promoting development in the most marginalized communities. Columns
(4) – (5) show the total violence a district experienced is significantly correlated with higher
growth in FONCUM transfers. The magnitude of the effect remains consistent and the significance
drops just under the 10% level once region fixed effects are introduced. Vaso de Leche, a
nationwide nutritional assistance program that distributes foods through public kitchens and
mothers’ clubs, is unlike FONCOMUN in that it specifically targets mothers and children (Tanaka
& Trivelli, 2002). Vaso de Leche is of special interest because its development over time in districts
29 Data used in Table XI come from the Ministry of Health, a 1999 census, and from a panel dataset of Peruvian districts’ revenue and expenditure records from 2001–2007, as stated on official annual reports prepared by district governments. 30 These results are based on a stock variable measured in 2012 and thus only show a one dimensional picture. It is possible districts that experienced greater conflict intensity had more government health resources even before the conflict began. Grimard & Laszlo (2013) address this concern with their use of longitudinal data. The authors investigate the changes in health services following the Peruvian civil conflict and find the number of public and private health centers increased during recovery periods from 1992-1996 in districts that were affected by civil conflict violence. Notably, they find there is a greater increase in public health centers.
26
that were most affected could suggest an increase in social networks and support for mothers.
Column (9) suggests districts exposed to an additional 100 conflict-related events saw an 82.7
percentage point increase in the growth of Vaso de Leche transfers from 1998-2008 (the average
growth over the time period is 214 percent). Since Vaso de Leche is intended to target poor
districts, this result is remarkable because districts’ poverty indicators, property tax revenue
growth, and size of total fiscal budget are controlled for. The findings support the hypothesis that
there was an increase in social spending in districts that were most affected by conflict.
<Insert Table XII here>
We test the hypothesis that women exposed to greater conflict intensity are more likely to
access community resources in Table XII.31 The DHS data contain a few variables that can be
used, although imperfectly, to address this hypothesis. Columns (1) – (3) suggest mothers affected
by higher conflict intensity are more likely to access healthcare resources.32 Then, Columns (4) –
(6) test whether conflict exposure is associated with increased access to nutritional assistance
programs.33 Column (6) suggests mothers exposed to an additional one hundred conflict-related
events are 3.9 percentage points more likely to access nutrition assistance programs with respect
to fixed effects and trends averages. This is a notable effect since only 15 percent of the sample
reported using these programs.
31 The table’s notes detail the dependent variables’ definitions. It is important to highlight that Table XII adds the variables ‘District’s Health Resources Per Capita’ and ‘District’s Social Spending Transfers’ as controls in addition to the set of controls previously used. 32 Although we use the ‘Health Visit Last Year’ variable to proxy for respondents’ access to and use of healthcare, the variable might indicate the demand for health services. It is possible women exposed to higher conflict intensity need to visit health facilities more often. 33 In the 2000 survey, respondents were asked how many times in the previous week they fed their children “mashed potatoes from social programs.” In the 2011 and 2012 surveys, respondents were asked whether they gave their children “porridge from social programs.” The ‘Used Nutrition Social Programs’ variable takes a value of one if the respondents gave a non-zero response for the 2000 survey or an affirmative answer for the latter surveys. Although these questions are restrictively specific, they are the only ones available that can be used to deduce nutritional program utilization. The social programs the data refer to are likely Vaso de Leche or one of its spinoffs since the former is the largest and oldest food program in Peru (Valdivia, 2004).

27
The review of possible channels shows the main results could be explained by increases in
parents’ child-rearing capacity through changes in social services. Although we cannot definitively
confirm exposure to violence is associated with an increased propensity to access healthcare, we
find women affected by violence may increase their use of social services, particularly services
connected to mothers’ clubs like Vaso de Leche.
VII. External Validity Check: Evidence from Colombia
Through a series of robustness checks and an exploration of possible channels, we have
motivated the internal validity of the main finding. In this section, we explore its external validity
since the found relationship between conflict and child punishment may be idiosyncratic to Peru
and not generalizable to other settings.
There are two reasons in particular why Colombia is a useful case study. First, Colombia’s
civil conflict is similar to Peru’s in many aspects (both gained momentum in the early 1980s and
both arose from radical left-wing ideologies).34 Second, it complements the Peru case in that we
can observe the short-term effects of exposure to conflict since the child punishment data were
collected either during the conflict or just two years later, whereas in Peru the individual-level data
were collected up to 12 years after the civil conflict ceased nation-wide.
The Colombian government, through a special “Presidential Program for Human Rights and
International Humanitarian Law” program, records homicides, massacres, kidnappings, and other
34 Guerilla groups in Colombia have their roots in La Violencia (“The Violence”), a civil war from 1948-1958 between the conservative and liberal political parties. These guerilla groups, Fuerzas Armadas Revolucinarias de Colombia (FARC) and Ejército de Liberación Nacional (ELN), were founded on similar Marxist and radical left-wing ideologies as the Shining Path in Peru. They were made up of almost exclusively poor rural citizens. The FARC and ELN did not gain prominence until the early 1980s—when their military capacities increased thanks to financing from kidnappings, extortion, and drug trade (Steele, 2007). Peasant groups formed their own paramilitary forces in order to defend themselves against the FARC and the ELN. Consequently, Colombia has for decades been constantly plagued by fighting between guerrilla groups, paramilitary forces, and the military. For more detailed histories of the Colombian civil conflict, see Steele (2007) and Ruiz (2001).

28
violent events related to the civil conflict. Using available data on the number of armed
confrontations (fighting between government and non-governmental armed groups) at the
municipal level for the years 2003-2008, we create an ‘Exposure to Violence’ variable for
respondents from Colombian DHS surveys from 2004, 2005, 2009, and 2010.35 The Colombian
conflict was widely spread geographically, and this variation is utilized by the identification
strategy employed to estimate the effect of conflict on child punishment.
While the Peruvian dataset contains one variable indicating the use of physical punishment,
the proxies for PCA in the Colombian data are not as direct. Punishment strategies in the
Colombian data included palmadas (which can be translated to spanking or slaps) or hitting with
objects. 30 and 47 percent of women in the sample use spanking and hitting with objects,
respectively, as punishment methods.
<Insert Table XIII here>
We use the same fixed effects LPM specified in Equation (2). Due to the standardization of
DHS data across countries, we are able to use the same controls as in the Peruvian analysis. The
main results for Colombia can be found in Table XIII. Columns (1) – (4) show the results for
‘Spanks’ and Columns (5) – (8) for ‘Hits with an Object’. The final columns in each panel restrict
the sample to respondents who have lived in their current residences since 2002.36 The results
suggest mothers who are exposed to higher conflict intensity are not more likely to hit their
children with an object as punishment but are more likely to use spanking.37 The ‘Exposure to
35 The individual-level data come from phase V (2005) and VI (2010) of Colombian DHS surveys. The combined sample has a total of 94,865 observations representing every region in the country and 358 municipalities. 36 Although this helps assure respondents are not assigned an incorrect conflict exposure, this sample restriction is problematic, as it was in the Peru case, because it omits respondents who have simply moved within their same municipality. Nonetheless, given the short time period in between the civil conflict violence and the time of the surveys, the restriction to a non-migrant sample here is much more reliable than in the Peru analysis.
37 The results for whether the father uses ‘spanks’ or ‘hitting with an object’ as punishment methods suggest no decrease for ‘spanks’ and a slightly significant increase in ‘hitting with an object’ (although there is no relationship when the sample is restricted to non-migrants). These results are not reported in this version.

29
Violence’ coefficient in Column (4), the preferred specification, suggests mothers who are exposed
to an extra 20 conflict-related events (one standard deviation in ‘Exposure to Violence’) are 5.08
percentage points less likely to spank their children, in respect to municipality, birth year, and
survey year averages and after controlling for regional trends flexibly. This effect is greater than
the one observed in Peru. Notably, the R-squared values across the specifications (0.08-0.16) are
consistent with those observed in Peru (0.12-0.19).
The above findings are complicated by data restrictions. The civil conflict in Colombia did not
necessarily end in 2008 (the last year we have data for), so respondents interviewed in 2009 and
2010 could have been exposed to additional armed confrontations that were unaccounted for.
Perhaps even more problematic, the exposure to armed confrontations for all respondents before
2003 is unknown. Nevertheless, the observed results for Colombia suggest there is external validity
to the main finding. The results here specifically corroborate those from Table VIII: conflict
exposure may have short-term effects on abusive discipline strategies. Future research should
explore the channels behind this relationship in Colombia since the channels may differ greatly
from those identified in the Peru case.
VIII. Discussion and Conclusion
Using three large cross-sections of nationally representative data, we find earlier civil conflict
exposure is associated with a decrease in the use of physical punishment as a discipline method
inter-generationally. After controlling for known predictors of domestic violence, mothers exposed
to an additional hundred conflict-related events in their lifetime are 3.4 percentage points less
likely to use physical punishment, with respect to district, birth year cohort, and survey year fixed
effects and regional time trends. This effect appears to be driven by exposure to conflict after early
childhood.

30
A parent’s ability to discipline the child effectively might be affected by civil conflict—the
main results could be explained by conflict’s impact on parents’ child-rearing capacity. We show
women impacted by conflict may be more likely to access health and social programs. We also
find districts that were more affected by conflict saw higher social spending growth in the post-
conflict period. Using a case study from a shanty town in Lima largely occupied by migrants from
regions deeply affected by armed violence, Isla (1997) writes, “Both the [community kitchens]
and Vaso de Leche have helped women to move out of the private household to a public and
communal sphere. In these committees, women discuss issues of survival, social, and communal
conflicts as well as personal and gender problems such as violence in their home.” The author
highlights the child-rearing capacity that may be built up through social services. Social services
can directly support parents through the provision of resources, but they may lead to child-rearing
knowledge spillover effects.
We also find civil conflict may decrease physical punishment in the short-run. Women who
were affected by greater conflict intensity between the ages of 9-16 years were less likely to have
been physically abused by their parents. This finding is reinforced by analyzing civil conflict in
Colombia, where recent conflict exposure is also associated with decreased use of abusive
punishment against children.
If political violence brings fear and isolation, then the affected population’s higher uptake of
social programs can be leveraged to rebuild social networks and trust. Programs that support child-
rearing and integrate community and women’s clubs, like Vaso de Leche, may be particularly
effective. Accordingly, future reconstruction policies should aim to empower women—they may
help recovery by promoting safe and healthy childhood development within a family.
31
The findings also suggest that conflict exposure does not affect intrahousehold violence in a
homogeneous way. While previous work suggests conflict increases IPV, we find conflict-affected
women reduce their use of physical punishment. This effect is greater for those who have been
physically abused by their intimate partners, suggesting the more violence women are exposed to
in adulthood, the less likely they are to inflict it upon their children. Trying times can expose
resiliency and it is encouraging to observe that those affected by civil conflict may help curb the
use of physical punishment in the future.
32
Bibliography Abu-Musa, A. (2008). Effect of war on fertility: a review of the literature. Reproductive
BioMedicine, 17(1), 43-53.
Akresh, R., Lucchetti, L., & Thirumurthy, H. (2012). Wars and child health: Evidence from the Eritrean–Ethiopian conflict. Journal of Development Economics, 99(2), 330-340.
Allison, P. D. (2009). Fixed Effects Regression Models. SAGE Publications, Inc.
Aragon, F. (2013). Local spending, transfers and costly tax collection. National Tax Journal, 66(2), 343-370.
Arcand, J.-L., & Wouabe, E. D. (2009). Households in a time of war: Instrumental variables evidence for Angola. The Graduate Institute, Geneva Working Paper.
Bellows, J., & Miguel, E. (2009). War and local collective action in Sierra Leone. Journal of Public Economics, 93, 1144-1157.
Berger, L. M., & Waldfogel, J. (2011). Economic determinants and consequences of child maltreatment. OECD Social, employment and migration working papers No. 111.
Berlin, L. J., Appleyard, K., & Dodge, K. A. (2001). Intergenerational Continuity in Child Maltreatment: Mediating Mechanisms and Implications for Prevention. Child Development, 82(1), 162-176.
Bjerk, D. (2009). How Much Can We Trust Causal Interpretations of Fixed-Effects Estimators in the Context of Criminality? IZA Discussion Papers No. 4387.
Blattman, C. (2009). From Violence to Voting: War and Political Participation in Uganda. American Political Science Review, 103(2), 231-247.
Blattman, C., & Annan, J. (2010). The Consequences of Child Soldiering. The Review of Economics and Statistics, 92(4), 882-889.
Bryson, A., Dorsett, R., & Purdon, S. (2002). The Use of Propensity Score Matching in the Evaluation of Labour Market Policies. Working Paper No. 4, Department for Work and Pensions.
Buvinic, M., Das Gupta, M., Casabonne, U., & Verwimp, P. (2013). Violent conflict and gender inequality. The World Bank Research Observer, 28(1), 110-138.
Callen, M., Isaqzadeh, M., Long, J. D., & Sprenger, C. (2014). Violence and Risk Preference: Experimental Evidence from Afghanistan. The American Economic Review, 104(1), 123-148.
Cole, S. R., & Hernán, M. A. (2008). Constructing Inverse Probability Weights for Marginal Structural Models. American Journal of Epidemiology, 168(6), 656-664.
Cunningham, A., & Baker, L. (2007). Little eyes, little ears: how violence against a mother shapes children as they grow. Centre for Children & Families in the Justice System.
33
Currie, J., & Tekin, E. (2006). Does child abuse cause crime? IZA Discussion Papers, No. 2063.
Degregori, C. I., Coronel, J., Del Pino, P., & Starn, O. (1996). Las Rondas Campesinas y la Derrota de Sendero Luminoso. Lima: IEP/Universidad Nacional de San Cristóbal de Huamanga.
Dube, S. R., Anda, R. F., Felitti, V. J., Chapman, D. P., Williamson, D. F., & Giles, W. H. (2001). Childhood abuse, household dysfunction, and the risk of attempted suicide throughout the life span: findings from the Adverse Childhood Experiences Study. The Journal of the American Medical Association, 286(24), 3089-3096.
English, C., & Godoy, J. (2010, June 4). Child Abuse Underreported in Latin America. Retrieved from Gallup: http://www.gallup.com/poll/139376/child-abuse-underreported-latin-america.aspx
Fang, X., Brown, D., Florence, C., Mercy, J., (2012) The economic burden of child maltreatment in the United States and implications for prevention, Child Abuse & Neglect, 36(2), February 2012, Pages 156-165, ISSN 0145-2134, http://dx.doi.org/10.1016/j.chiabu.2011.10.006.
Feder, A., Southwick, S. M., Goetz, R. R., Wang, Y., Alonso, A., Smith, B. W., . . . Vythilingam, M. (2008). Posttraumatic Growth in Former Vietnam Prisoners of War. Psychiatry: Interpersonal and Biological Processes, 7(4), 359-370.
Felitti, V. J., Anda, R. F., Nordenberg, D., Williamson, D. F., Spitz, A. M., Edwards, V., . . . Marks, J. S. (1998). Relationship of Childhood Abuse and Household Dysfunction to Many of the Leading Causes of Death in Adults. American Journal of Preventive Medicine, 14(4), 245-258.
Fowler, P. J., Tompsett, C. J., Braciszewski, J. M., Jacques-Tiura, A. J., & Baltes, B. B. (2009). Community Violence: A Meta-Analysis on the Effect of Exposure. Development and Psychopathology, 21, 227-259.
Gage, A. J., & Silvestre, E. A. (2010). Maternal Violence, Victimization, and Child Physical Punishment in Peru. Child Abuse & Neglect: The International Journal, 34(7), 523-533.
Galdo, J. (2010). The Long-Run Labor-Market Consequences of Civil War: Evidence from the Shining Path in Peru. IZA Discussion Paper Series No. 5028.
Gallegos, J. V. (2012). The Effects of Civil Conflicts on Women’s Labor Force Participation: A Causal Mechanism Approach.
Gershoff, E. T. (2002). Corporal Punishment by Parents and Associated Child Behaviors and Experiences: A Meta-Analytic and Theoretical Review. Psychological Bulletin, 128(4), 539-579.
Gil-Alana, L. A., & Singh, P. (2013). Economic Growth and Recovery After Civil Wars. Working paper available at: http://papers.ssrn.com/sol3/papers.cfm?abstract_id=2332900.

34
Gilbert, R., Widom, C. S., Browne, K., Fergusson, D., Webb, E., & Janson, S. (2009). Burden and Consequences of Child Maltreatment in High-Income Countries. Lancet, 373, 68-81.
Grimard, F., & Laszlo, S. (2010). Long Term Effects of Civil Conflict on Women’s Health Outcomes in Peru. McGill University, Department of Economics Departmental Working Papers 2010-05.
Grimard, F., & Laszlo, S. (2013). Civil Conflict and the Political Economy of Delivering Health Services in Peru. McGill University Working Paper.
Gupta, J., Reed, E., Kelly, J., Stein, D. J., & Williams, D. R. (2012). Men’s exposure to human rights violations and relations with perpetration of intimate partner violence in South Africa. Journal of Epidemiology and Community Health, 66(6), e2-e2.
Gutierrez, I. A., & Gallegos, J. V. (2011). The Effect of Civil Conflict on Domestic Violence: the Case of Peru. SSRN Working Paper Series.
Imbens, G. W., & Rubin, D. B. (1997). Bayesian Inference for Casual Effects in Randomized Experiments with Noncompliance. Annals of Statistics, 25, 305-877.
Imbens, G. W., & Woolridge, J. M. (2009). Recent Developments in the Econometrics of Program Evaluation. NBER Working Paper 14251.
Inbens, G. W. (2004). Nonparametric Estimation of Average Treatment Effects Under Exogeneity: A Review. Review of Economics and Statistics, 86(1).
Isla, A. (1997). Coping with Structural Adjustment: Women's Organizing in Peru. Canadian Woman Studies, 78-84.
Justino, P., Leone, M., & Salardi, P. (2011). Education and Conflict Recovery: The Case of Timor Leste. MICROCON Research Working Paper 55.
La Mattina, G. (2013). Armed Conflict and Domestic Violence: Evidence from Rwanda. Available at SSRN: http://papers.ssrn.com/sol3/papers.cfm?abstract_id=2186916.
Lee, B. J., & Goerge, R. M. (1999). Poverty, early childbearing, and child maltreatment: A multinomial analysis. Children and Youth Services Review, 21(9-10), 755-780.
León, G. (2012). Civil Conflict and Human Capital Accumulation: The Long-term Effects of Political Violence in Perú. The Journal of Human Resources, 992-1022.
Lindo, J., Schaller, J., & Hansen, B. (2013, February 3). Retrieved from Economic Conditions and Child Abuse: http://wpcarey.asu.edu/economics-degree/news/upload/02-18-Schaller_Draft.pdf
Maguen, S., Vogt, D. S., King, L. A., King, D. W., & Litz, B. T. (2006). Posttraumatic Growth Among Gulf War I Veterans: The Predictive Role of Deployment-Related Experiences and Background Characteristics. Journal of Loss and Trauma: International Perspectives on Stress & Coping, 11(5), 373-388.
35
Markowitz, S., & Grossman, M. (2000). The effects of beer taxes on physical child abuse. Journal of Health Economics, 19(2), 271-282.
Marshall, M. G., & Gurr, T. R. (2005). Peace and Conflict 2005: A Global Survey of Armed Conflicts, Self-Determination Movements, and Democracy. CIDCM Center for International Development & Conflict Management.
Minoiu, C., & Shemyakina, O. N. (2014). Armed Conflict, Household Victimization, and Child Health in Côte d'Ivoire. Elsevier, vol. 108(C), pages 237-255.
Morales, A. M., & Singh, P. (2015). The Effects of Child Abuse on Nutritional Outcomes. Journal of Development Studies, 51(7), pages 826-850.
Newcomb, M. D., & Locke, T. F. (2001). Intergenerational cycle of maltreatment: a popular concept obsucred by methodological limitations. Child Abuse & Neglect, 25(9), 1219-1240.
Noe, D., & Rieckmann, J. (2013). Violent Behaviour: The effect of civil conflict on domestic violence in Colombia. Courant Research Centre: Poverty, Equity, and Growth -- Discussion Papers, No. 136.
Ombudsman Against Physical and Humiliating Punishment of Children and Adolescents. (2009). ¡Adiós al castigo! Lima.
Ombudsman for Children and Adolescents. (2009, April 29). Press Release. Lima.
Pears, K. C., & Capaldi, D. M. (2001). Intergenerational transmission of abuse: a two-generational prospective study of an at-risk sample. Child Abuse & Neglect, 25, 1439-14641.
Perry, E. (Director). (2005). The Fall of Fujimori [Motion Picture].
Pietrzak, R. H., Goldstein, M. B., Malley, J. C., Rivers, A. J., Johnson, D. C., Morgan, C. A., & Southwick, S. M. (2010). Posttraumatic growth in Veterans of Operations Enduring Freedom and Iraqi Freedom. Journal of Affective Disorders, 126(1-2), 230-235.
Pinheiro, P. S. (2006). World Report On Violence Against Children. Geneva: United Nations Secretary-General's Study on Violence against Children.
Powell, S., Rosner, R., Butollo, W., Tedeschi, R. G., & Calhoun, L. G. (2003). Posttraumatic growth after war: a study with former refugees and displaced people in Sarajevo. Journal of Clinical Psychology, 59(1), 71-83.
Ruiz, B. (2001). The Colombian Civil War. Jefferson, NC: McFarland & company, Inc.
Sánchez, A. (2010). Transitory shocks and long-term human capital accumulation: the impact of conflict on physical health in Peru. Working Paper.
36
Singh, P., & Shemyakina, O. (2016). Gender-Differential Effects of Conflict on Education: The Case of the 1981-1993 Punjab Insurgency. Economics of Education Review. doi:10.1016/j.econedurev.2016.02.003
Steele, A. (2007). Massive Civilian Displacement in Civil War: Assessing Variation in Colombia. Households in Conflict Network Working Paper 29.
Stuart, E. A. (2010). Matching methods for causal inference: A Review and a look forward. Statistical Science, 25(1), 1-21.
Tanaka, M., & Trivelli, C. (2002). Las trampas de la focalización y la participación: Pobreza y políticas sociales en el Perú durante la década de Fujimori. Instituto de Estudios Peruanos.
Tedeschi, R. G., & Calhoun, L. G. (2004). Posttraumatic Growth: Conceptual Foundations and Empirical Evidence. Psychological Inquiry, 15(1), 1-18.
Thornberry, T. P., & Henry, K. L. (2013). Intergenerational Continuity in Maltreatment. Journal of Abnormal Child Psychology, 41(4), 555-569.
Tilly, C. (1975). The Formation of National States in Western Europe. Princeton, NJ: Princeton University Press.
Truth and Reconciliation Comission (TRC). (2004). Final Report. Lima. Data gathered available at https://sites.google.com/a/pucp.pe/informe-final-de-la-cvr--peru/ .
UNICEF. (2009). Machel Study 10-Year Strategic Review: Children and Conflict in a Changing World. New York City.
UNICEF. (2010). Child Disciplinary Practices at Home: Evidence from a Range of Low- and Middle-Income Countries. New York.
Valdivia, M. (2005). Peru: Is Identifying the Poor the Main Problem in Reaching Them with Nutritional Programs? Health, Nutrition, and Population (HNP) Discussion Paper: Reaching the Poor Program Paper No. 7.
Walker, L. E. (2009). The Battered Woman Syndrome. New York: Springer Publishing Company, LLC.
Williams, R. (2011, July). PowerPoint presentation for Stata Conference: "Using the Margins Command to Estimate and Interpret Adjusted Predictions and Marginal Effects". Retrieved from University of Notre Dame's web site: https://www3.nd.edu/~rwilliam/stats/Margins01.pdf
Wood, J., Medina, S., Feudtner, C., Luan, X., Localio, R., Fieldston, E., & Rubin, D. (2012). Local macroeconomic trends and hospital admissions for child abuse, 2000-2009. Pediatrics, 130(2), e358-e364.
World Health Organization (WHO). (2002). World report on violence and health.
37
Yount, K., DiGirolamo, A., & Ramakrishnan, U. (2011). Impacts of domestic violence on child growth and nutrition: A conceptual review of the pathways of influence. Social Science & Medicine, 72(9), 1534–1554.

38

39

40
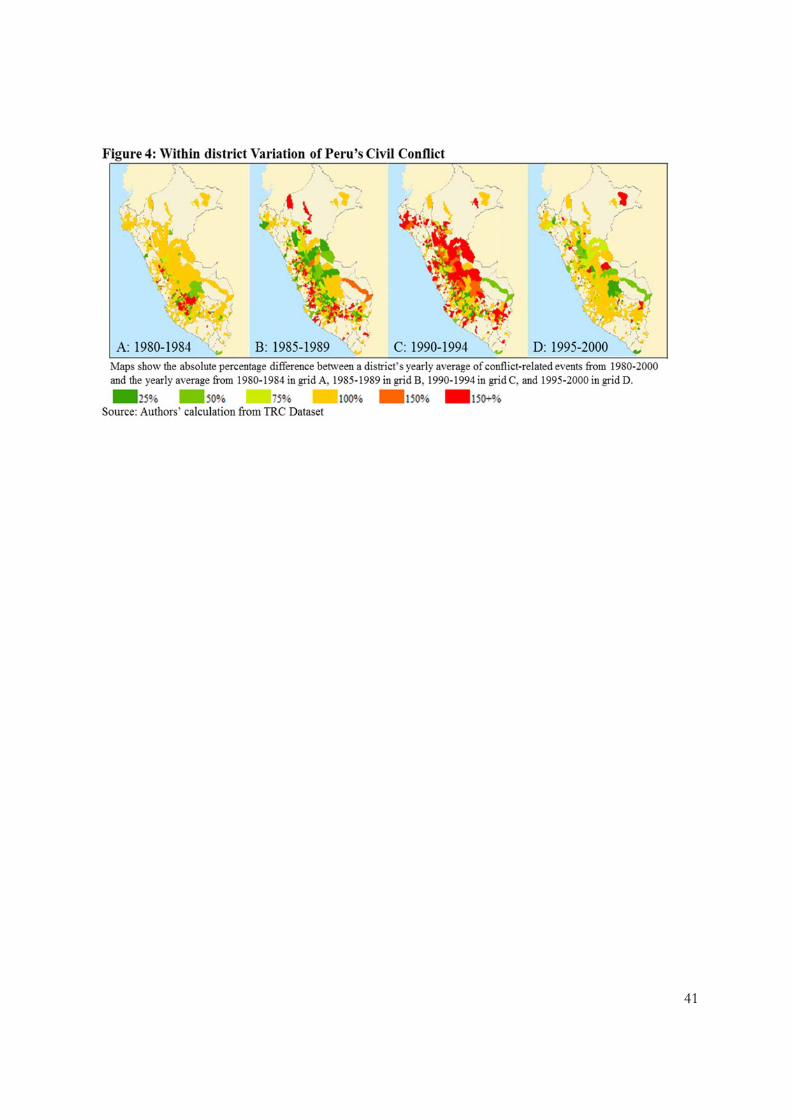
41
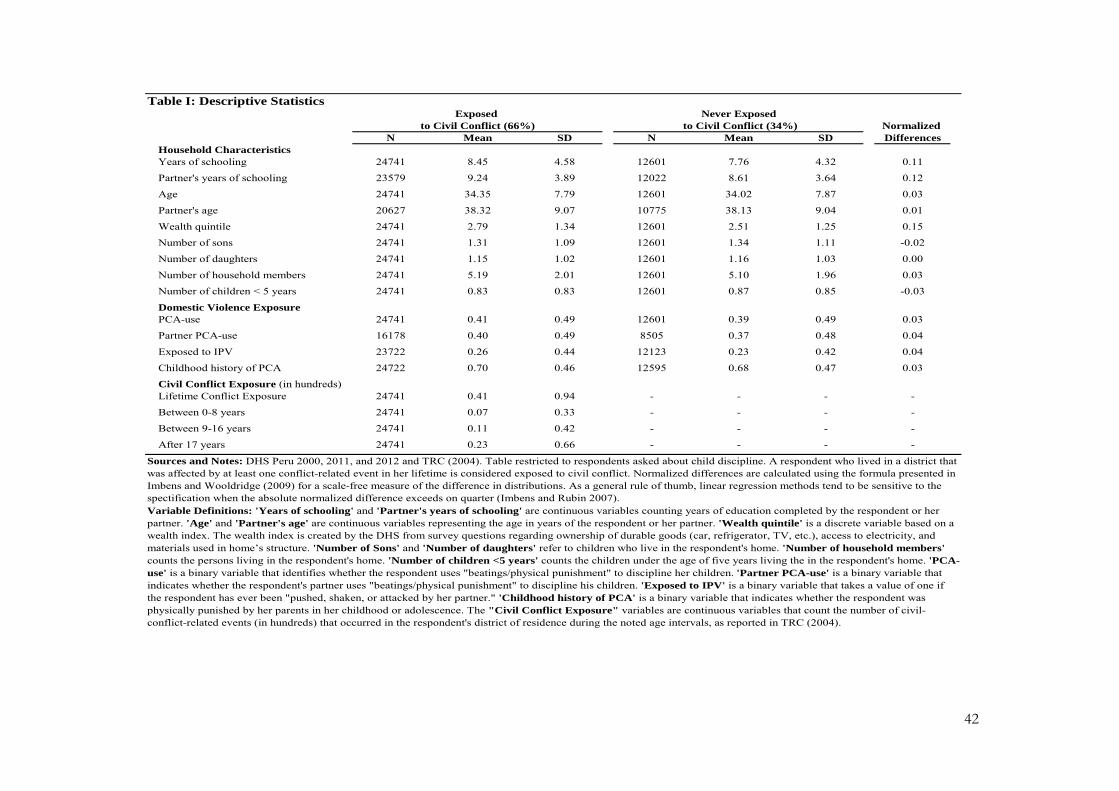
42
Table I: Descriptive StatisticsExposed Never Exposed
to Civil Conflict (66%) to Civil Conflict (34%) Normalized N Mean SD N Mean SD Differences
Household CharacteristicsYears of schooling 24741 8.45 4.58 12601 7.76 4.32 0.11
Partner's years of schooling 23579 9.24 3.89 12022 8.61 3.64 0.12
Age 24741 34.35 7.79 12601 34.02 7.87 0.03
Partner's age 20627 38.32 9.07 10775 38.13 9.04 0.01
Wealth quintile 24741 2.79 1.34 12601 2.51 1.25 0.15
Number of sons 24741 1.31 1.09 12601 1.34 1.11 -0.02
Number of daughters 24741 1.15 1.02 12601 1.16 1.03 0.00
Number of household members 24741 5.19 2.01 12601 5.10 1.96 0.03
Number of children < 5 years 24741 0.83 0.83 12601 0.87 0.85 -0.03
Domestic Violence ExposurePCA-use 24741 0.41 0.49 12601 0.39 0.49 0.03
Partner PCA-use 16178 0.40 0.49 8505 0.37 0.48 0.04
Exposed to IPV 23722 0.26 0.44 12123 0.23 0.42 0.04
Childhood history of PCA 24722 0.70 0.46 12595 0.68 0.47 0.03
Civil Conflict Exposure (in hundreds)Lifetime Conflict Exposure 24741 0.41 0.94 - - - -
Between 0-8 years 24741 0.07 0.33 - - - -
Between 9-16 years 24741 0.11 0.42 - - - -
After 17 years 24741 0.23 0.66 - - - -
Sources and Notes: DHS Peru 2000, 2011, and 2012 and TRC (2004). Table restricted to respondents asked about child discipline. A respondent who lived in a district that was affected by at least one conflict-related event in her lifetime is considered exposed to civil conflict. Normalized differences are calculated using the formula presented in Imbens and Wooldridge (2009) for a scale-free measure of the difference in distributions. As a general rule of thumb, linear regression methods tend to be sensitive to the spectification when the absolute normalized difference exceeds on quarter (Imbens and Rubin 2007). Variable Definitions: 'Years of schooling' and 'Partner's years of schooling' are continuous variables counting years of education completed by the respondent or her partner. 'Age' and 'Partner's age' are continuous variables representing the age in years of the respondent or her partner. 'Wealth quintile' is a discrete variable based on a wealth index. The wealth index is created by the DHS from survey questions regarding ownership of durable goods (car, refrigerator, TV, etc.), access to electricity, and materials used in home’s structure. 'Number of Sons' and 'Number of daughters' refer to children who live in the respondent's home. 'Number of household members' counts the persons living in the respondent's home. 'Number of children <5 years' counts the children under the age of five years living the in the respondent's home. 'PCA-use' is a binary variable that identifies whether the respondent uses "beatings/physical punishment" to discipline her children. 'Partner PCA-use' is a binary variable that indicates whether the respondent's partner uses "beatings/physical punishment" to discipline his children. 'Exposed to IPV' is a binary variable that takes a value of one if the respondent has ever been "pushed, shaken, or attacked by her partner." 'Childhood history of PCA' is a binary variable that indicates whether the respondent was physically punished by her parents in her childhood or adolescence. The "Civil Conflict Exposure" variables are continuous variables that count the number of civil-conflict-related events (in hundreds) that occurred in the respondent's district of residence during the noted age intervals, as reported in TRC (2004).

43
Table II: Previous Trends in PCA-use, by Presence of Civil Conflict Violence in DistrictChildhood History of PCA
(1) (2)District Sample Restrictions: Never exposed to Exposed to at least
violence one violent eventBirth Decade (1950s omitted)
1960s -0.018 0.009(-1.46) (0.81)
1970s -0.024** -0.007(-2.07) (-0.59)
1980s -0.079*** -0.068***(-6.25) (-4.85)
1990s -0.248*** -0.204***(-15.75) (-13.92)
Fixed Effects: X XObservations 32601 29026R-squared 0.086 0.080Notes: Parentheses show t-statistics estimated from robust standard errors adjusted at the district level (1082 clusters). Column (1) restricts the sample to individuals living in districts that were not affected by civil conflict violence, Column(2) to individuals living in districts that experienced at least one conflict-related event. Fixed effects effects include district(1082) and survey year (3) dummy variables. The dependent variable takes a value of one if the survey respondent wasphysically abused by her parents while growing up.

44
Table III: Effect of Civil Conflict Exposure On Use of Physical Child AbuseLinear Probability Model Probit (marginal effects)
PCA-use PCA-use(1) (2) (3) (4) (5) (6)
Lifetime Conflict Exposure -0.033*** -0.026** -0.034*** -0.039*** -0.032*** -0.038***(in hundreds) (-2.71) (-2.55) (-2.96) (-2.93) (-2.70) (-2.75)
Wealth Quintile (lowest omitted)2nd 0.005 0.002 0.008 0.004
(0.52) (0.19) (0.73) (0.39)3rd -0.009 -0.014 -0.007 -0.012
(-0.76) (-1.14) (-0.51) (-0.88)4th -0.060*** -0.064*** -0.063*** -0.068***
(-4.30) (-4.57) (-4.16) (-4.48)5th -0.073*** -0.077*** -0.082*** -0.087***
(-4.58) (-4.82) (-4.77) (-5.06)
Number of Sons 0.057*** 0.048*** 0.065*** 0.055***(15.44) (12.97) (-15.67) -12.97
Number of Daughters 0.047*** 0.036*** 0.054*** 0.042***(12.59) (9.48) (12.67) (9.44)
Childhood History of PCA 0.173*** 0.173*** 0.196*** 0.199***(26.92) (26.67) (28.62) (28.45)
Number of Household Members -0.003 0.000 -0.004* -0.001(-1.60) (-0.09) (-1.76) (-0.26)
Number of Children < 5 Years 0.001 0.005 0.002 0.006(0.34) (1.11) (0.44) (1.29)
Years of Schooling -0.002* -0.003*** -0.002* -0.003***(-1.81) (-2.74) (-1.85) (-2.77)
Partner's Years of Schooling -0.003*** -0.003*** -0.004*** -0.004***(-3.25) (-3.28) (-3.22) (-3.31)
Partner's Age 0.000 0.000 0.000 0.000(-0.10) (0.12) (-0.01) (0.22)
Fixed Effects: X X X X X XTrends: X X
Observations 37342 31250 31250 37018 30919 30884R-squared (pseudo for probit) 0.120 0.176 0.186 0.088 0.134 0.143Notes: Parentheses show t-statistics estimated from robust standard errors adjusted at the district level (1082 clusters). *** p<0.01, ** p<0.05, * p<0.1. Fixed effects include district (1083), survey year (3), and birth year cohort (48) dummies.Trends refers to region-specific time trends (a dummy is created for survey five-year birth cohorts from each region).
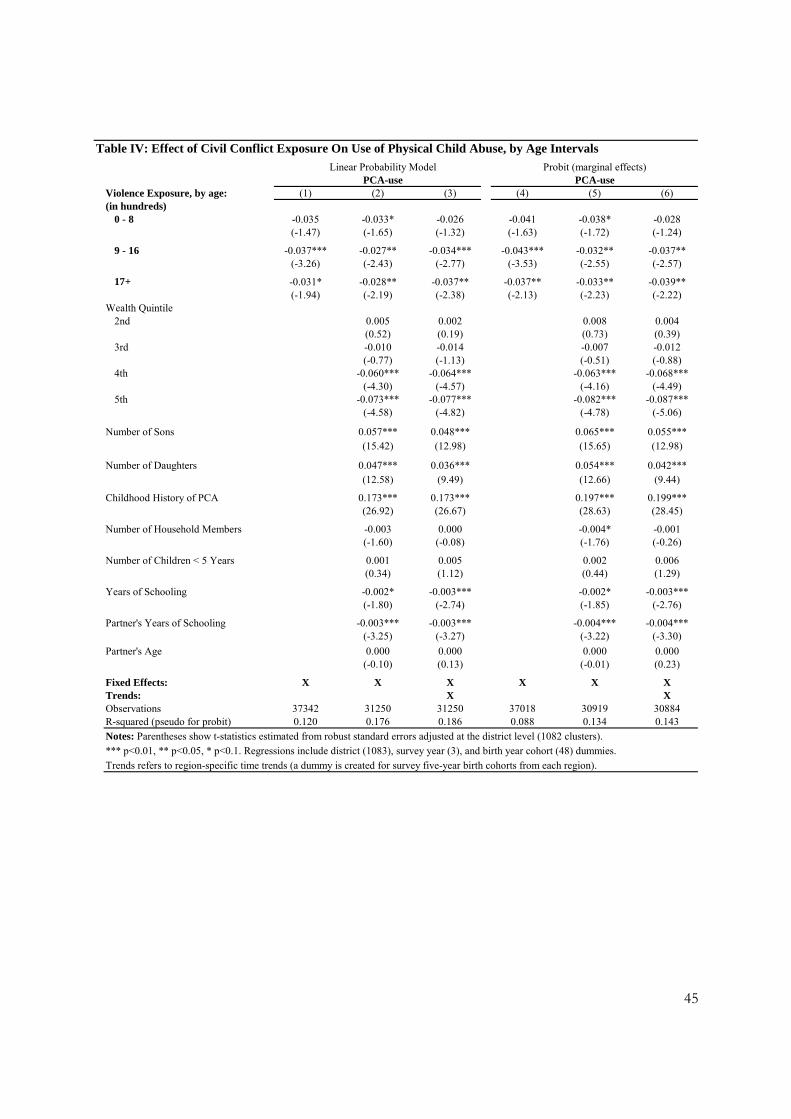
45
Table IV: Effect of Civil Conflict Exposure On Use of Physical Child Abuse, by Age Intervals
Linear Probability Model Probit (marginal effects)PCA-use PCA-use
Violence Exposure, by age: (1) (2) (3) (4) (5) (6)(in hundreds)
0 - 8 -0.035 -0.033* -0.026 -0.041 -0.038* -0.028(-1.47) (-1.65) (-1.32) (-1.63) (-1.72) (-1.24)
9 - 16 -0.037*** -0.027** -0.034*** -0.043*** -0.032** -0.037**(-3.26) (-2.43) (-2.77) (-3.53) (-2.55) (-2.57)
17+ -0.031* -0.028** -0.037** -0.037** -0.033** -0.039**(-1.94) (-2.19) (-2.38) (-2.13) (-2.23) (-2.22)
Wealth Quintile2nd 0.005 0.002 0.008 0.004
(0.52) (0.19) (0.73) (0.39)3rd -0.010 -0.014 -0.007 -0.012
(-0.77) (-1.13) (-0.51) (-0.88)4th -0.060*** -0.064*** -0.063*** -0.068***
(-4.30) (-4.57) (-4.16) (-4.49)5th -0.073*** -0.077*** -0.082*** -0.087***
(-4.58) (-4.82) (-4.78) (-5.06)
Number of Sons 0.057*** 0.048*** 0.065*** 0.055***(15.42) (12.98) (15.65) (12.98)
Number of Daughters 0.047*** 0.036*** 0.054*** 0.042***(12.58) (9.49) (12.66) (9.44)
Childhood History of PCA 0.173*** 0.173*** 0.197*** 0.199***(26.92) (26.67) (28.63) (28.45)
Number of Household Members -0.003 0.000 -0.004* -0.001(-1.60) (-0.08) (-1.76) (-0.26)
Number of Children < 5 Years 0.001 0.005 0.002 0.006(0.34) (1.12) (0.44) (1.29)
Years of Schooling -0.002* -0.003*** -0.002* -0.003***(-1.80) (-2.74) (-1.85) (-2.76)
Partner's Years of Schooling -0.003*** -0.003*** -0.004*** -0.004***(-3.25) (-3.27) (-3.22) (-3.30)
Partner's Age 0.000 0.000 0.000 0.000(-0.10) (0.13) (-0.01) (0.23)
Fixed Effects: X X X X X XTrends: X XObservations 37342 31250 31250 37018 30919 30884R-squared (pseudo for probit) 0.120 0.176 0.186 0.088 0.134 0.143
Notes: Parentheses show t-statistics estimated from robust standard errors adjusted at the district level (1082 clusters). *** p<0.01, ** p<0.05, * p<0.1. Regressions include district (1083), survey year (3), and birth year cohort (48) dummies.
Trends refers to region-specific time trends (a dummy is created for survey five-year birth cohorts from each region).

46
Table V: Effect of Civil Conflict Exposure On Use of Physical Child AbuseRobustness Check: Migration a
PCA-use(1) (2) (3)
Lifetime Conflict Exposure -0.033*** -0.029*** -0.037***(in hundreds) (-2.61) (-2.74) (-2.97)
Migrant 0.026*** 0.011* 0.010
(4.55) (1.78) (1.61)
Lifetime Conflict Exposure 0.003 0.006 0.007(in hundreds) * Migrant (0.38) (1.24) (1.25)
Wealth Quintile
2nd 0.004 0.001(0.46) (0.13)
3rd -0.010 -0.014(-0.80) (-1.17)
4th -0.060*** -0.064***(-4.26) (-4.54)
5th -0.072*** -0.077***(-4.53) (-4.78)
Number of Sons 0.057*** 0.048***
(15.46) (13.00)
Number of Daughters 0.047*** 0.036***
(12.56) (9.48)
Childhood History of PCA 0.172*** 0.173***(26.71) (26.49)
Number of Household Members -0.003 -0.000(-1.52) (-0.03)
Number of Children < 5 Years 0.001 0.005(0.31) (1.08)
Years of Schooling -0.002* -0.003***(-1.67) (-2.61)
Partner's Years of Schooling -0.003*** -0.003***(-3.32) (-3.34)
Partner's Age -0.000 0.000(-0.16) (0.06)
Fixed Effects: X X XTrends: X
Observations 37342 31250 31250R-squared 0.121 0.176 0.186Notes: Parentheses show t-statistics estimated from robust standard errors adjusted at the district level (1082 clusters). *** p<0.01, ** p<0.05, * p<0.1. Regressions include district (1083), survey year (3), and birth year cohort (48)dummies. Trends refers to region-specific time trends (a dummy is created for survey five-year birth cohorts fromeach region). Migrant'' refers to a dummy variable indicating whether the respondent has always lived in hercurrent home or lived there prior to the start of the conflict.
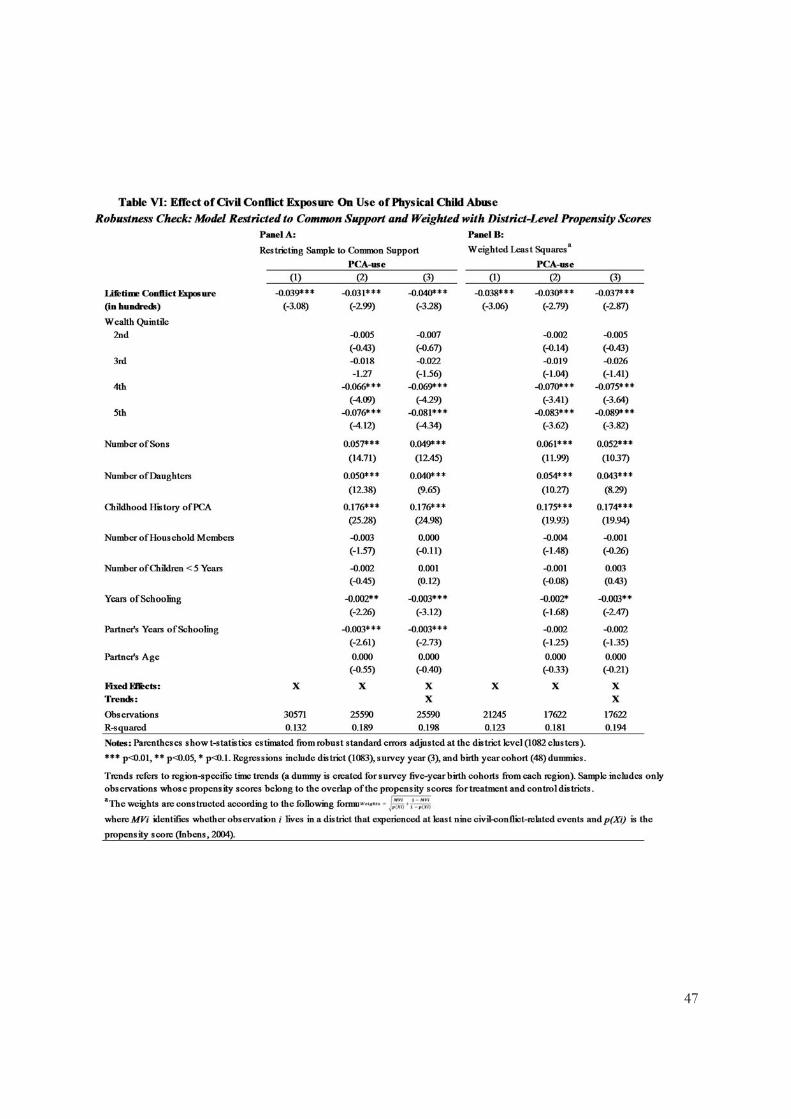
47

48
Table VII: Effect of Civil Conflict on Domestic Violence AttitudesPunishment Necessarya IPV Justificationb Reported IPVc
(1) (2) (3) (4) (5) (6) (7) (8) (9)
Lifetime Conflict Exposure 0.010 0.020 0.031* 0.010** 0.010** 0.010 -0.030* -0.037** -0.040**(in hundreds) (0.65) (1.39) (1.71) (2.20) (2.08) (1.36) (-1.94) (-2.17) (-2.38)
Wealth Quintile2nd -0.012 -0.012 -0.007 -0.006 0.008 0.006
(-1.22) (-1.27) (-1.10) (-1.01) (0.65) (0.50)3rd -0.013 -0.013 -0.007 -0.006 0.006 0.001
(-0.99) (-1.03) (-0.89) (-0.78) (0.40) (0.09)4th -0.008 -0.008 -0.009 -0.008 -0.02 -0.023
(-0.56) (-0.58) (-1.04) (-0.93) (-1.07) (-1.23)5th 0.016 0.015 -0.017* -0.015 -0.051** -0.052**
(0.99) -0.91 (-1.71) (-1.54) (-2.50) (-2.55)
Number of Sons 0.024*** 0.022*** -0.001 -0.001 0.008** 0.007(7.35) (6.90) (-0.54) (-0.41) (1.98) (1.52)
Number of Daughters 0.020*** 0.018*** -0.004 -0.004 0.011** 0.009*(6.28) (5.56) (-1.54) (-1.56) (2.52) (1.94)
Childhood History of PCA 0.101*** 0.101*** -0.001 -0.001 -0.023** -0.023**(17.49) (17.18) (-0.30) (-0.25) (-2.33) (-2.35)
Number of Household Members -0.001 0.000 0.001 0.001 -0.005** -0.005**(-0.38) (-0.10) (0.74) (0.66) (-2.19) (-2.00)
Number of Children < 5 Years 0.012*** 0.013*** 0.000 0.000 -0.008 -0.008(3.18) (3.34) (0.12) (0.11) (-1.55) (-1.44)
Years of Schooling -0.004*** -0.004*** -0.003*** -0.003*** 0.000 0.000(-4.07) (-4.20) (-5.81) (-5.84) (0.17) (-0.06)
Partner's Years of Schooling -0.003*** -0.003*** -0.001 -0.001 -0.001 -0.001(-3.41) (-3.44) (-1.03) (-1.08) (-0.67) (-0.67)
Partner's Age 0.000 0.000 0.000 0.000 0.000 0.000(-0.03) (-0.04) (0.43) (0.39) (0.27) (0.29)
Fixed Effects: X X X X X X X X XTrends: X X X
Observations 37311 31227 31227 21829 18268 18268 19547 16033 16033R-squared 0.132 0.157 0.162 0.07 0.082 0.09 0.084 0.098 0.106
Notes: Parentheses show t-statistics estimated from robust standard errors adjusted at the district level (1082 clusters).
*** p<0.01, ** p<0.05, * p<0.1. Regressions include district (1083), survey year (3), and birth year cohort (48) dummies.Trends refers to region-specific time trends (a dummy is created for survey five-year birth cohorts from each region).a Respondents were asked whether physical punishment is a necessary part of children’s education. The variable ‘Punishment Necessary’ takes a value of zero if they answered with “no/never” and a value of 1 otherwise.b Respondents were asked five questions on scenarios where it would be justified for a husband to beat his wife. The ‘IPV Justification’ variable that takes a value of oneif the respondents agree wife beating is justified in any of the following scenarios: wife 1) goes out without telling [the partner], 2) neglects the children, 3) argues with
[the partner], 4) refuses to have sex with [the partner], or 5) burns the food.c Respondents were asked whether they have ever sought help from an institution (police, courts, ministry of women, public defender, etc.) after experiencing IPV. The ‘Reported IPV’ variables takes a value of one if the respondent sought help from an institution, zero otherwise.
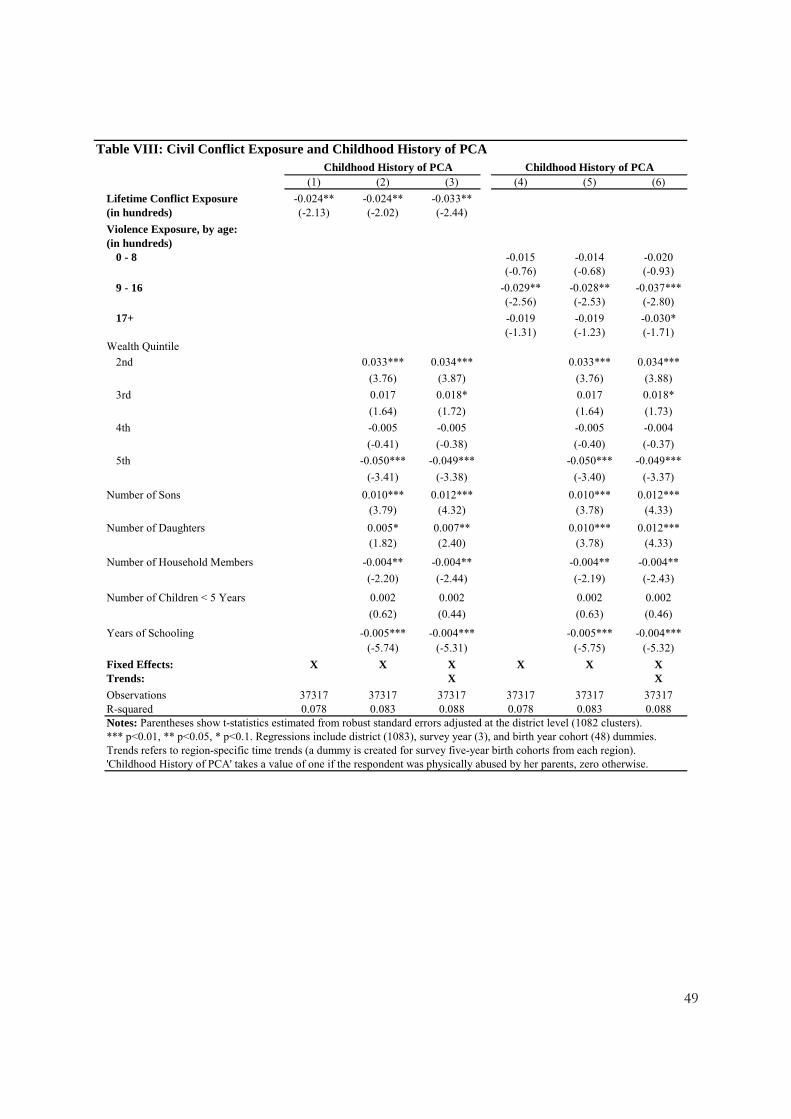
49
Table VIII: Civil Conflict Exposure and Childhood History of PCA Childhood History of PCA Childhood History of PCA
(1) (2) (3) (4) (5) (6)
Lifetime Conflict Exposure -0.024** -0.024** -0.033**(in hundreds) (-2.13) (-2.02) (-2.44)
Violence Exposure, by age:(in hundreds)
0 - 8 -0.015 -0.014 -0.020(-0.76) (-0.68) (-0.93)
9 - 16 -0.029** -0.028** -0.037***(-2.56) (-2.53) (-2.80)
17+ -0.019 -0.019 -0.030*(-1.31) (-1.23) (-1.71)
Wealth Quintile
2nd 0.033*** 0.034*** 0.033*** 0.034***
(3.76) (3.87) (3.76) (3.88)
3rd 0.017 0.018* 0.017 0.018*
(1.64) (1.72) (1.64) (1.73)
4th -0.005 -0.005 -0.005 -0.004
(-0.41) (-0.38) (-0.40) (-0.37)
5th -0.050*** -0.049*** -0.050*** -0.049***
(-3.41) (-3.38) (-3.40) (-3.37)
Number of Sons 0.010*** 0.012*** 0.010*** 0.012***(3.79) (4.32) (3.78) (4.33)
Number of Daughters 0.005* 0.007** 0.010*** 0.012***(1.82) (2.40) (3.78) (4.33)
Number of Household Members -0.004** -0.004** -0.004** -0.004**
(-2.20) (-2.44) (-2.19) (-2.43)
Number of Children < 5 Years 0.002 0.002 0.002 0.002
(0.62) (0.44) (0.63) (0.46)
Years of Schooling -0.005*** -0.004*** -0.005*** -0.004***(-5.74) (-5.31) (-5.75) (-5.32)
Fixed Effects: X X X X X XTrends: X X
Observations 37317 37317 37317 37317 37317 37317R-squared 0.078 0.083 0.088 0.078 0.083 0.088Notes: Parentheses show t-statistics estimated from robust standard errors adjusted at the district level (1082 clusters). *** p<0.01, ** p<0.05, * p<0.1. Regressions include district (1083), survey year (3), and birth year cohort (48) dummies.Trends refers to region-specific time trends (a dummy is created for survey five-year birth cohorts from each region). 'Childhood History of PCA' takes a value of one if the respondent was physically abused by her parents, zero otherwise.
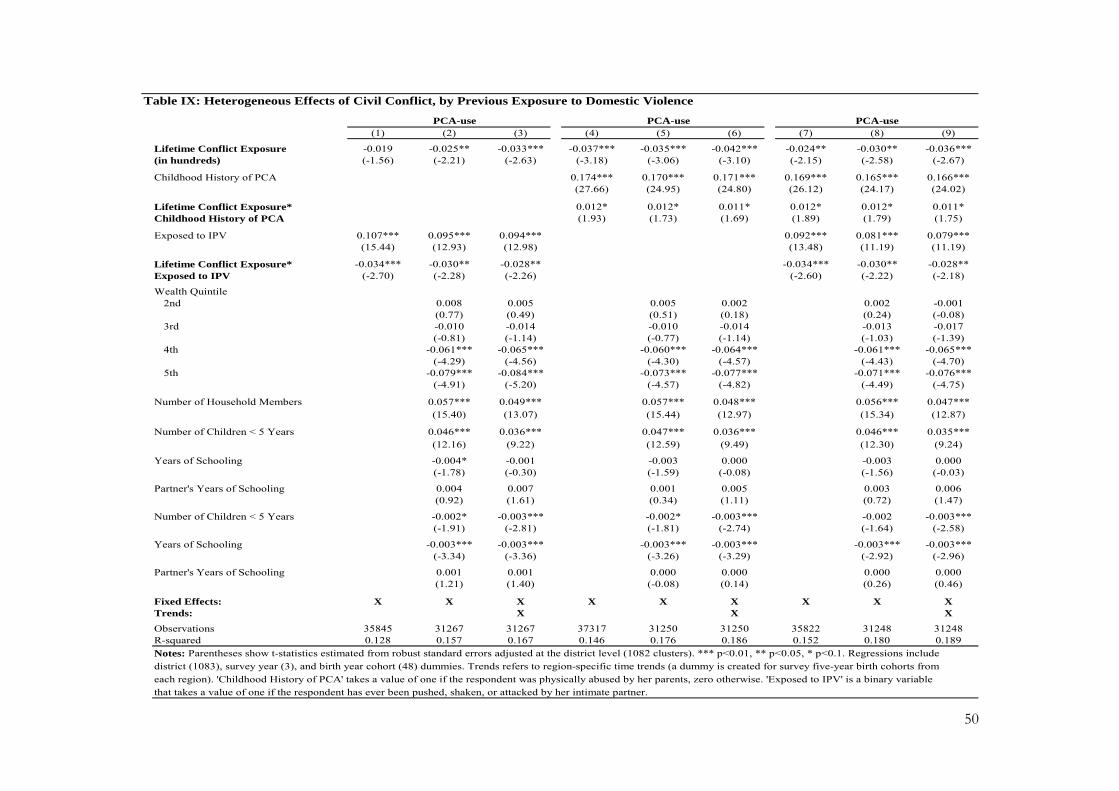
50
Table IX: Heterogeneous Effects of Civil Conflict, by Previous Exposure to Domestic Violence
PCA-use PCA-use PCA-use(1) (2) (3) (4) (5) (6) (7) (8) (9)
Lifetime Conflict Exposure -0.019 -0.025** -0.033*** -0.037*** -0.035*** -0.042*** -0.024** -0.030** -0.036***(in hundreds) (-1.56) (-2.21) (-2.63) (-3.18) (-3.06) (-3.10) (-2.15) (-2.58) (-2.67)
Childhood History of PCA 0.174*** 0.170*** 0.171*** 0.169*** 0.165*** 0.166***(27.66) (24.95) (24.80) (26.12) (24.17) (24.02)
Lifetime Conflict Exposure* 0.012* 0.012* 0.011* 0.012* 0.012* 0.011*Childhood History of PCA (1.93) (1.73) (1.69) (1.89) (1.79) (1.75)
Exposed to IPV 0.107*** 0.095*** 0.094*** 0.092*** 0.081*** 0.079***(15.44) (12.93) (12.98) (13.48) (11.19) (11.19)
Lifetime Conflict Exposure* -0.034*** -0.030** -0.028** -0.034*** -0.030** -0.028**Exposed to IPV (-2.70) (-2.28) (-2.26) (-2.60) (-2.22) (-2.18)
Wealth Quintile2nd 0.008 0.005 0.005 0.002 0.002 -0.001
(0.77) (0.49) (0.51) (0.18) (0.24) (-0.08)3rd -0.010 -0.014 -0.010 -0.014 -0.013 -0.017
(-0.81) (-1.14) (-0.77) (-1.14) (-1.03) (-1.39)4th -0.061*** -0.065*** -0.060*** -0.064*** -0.061*** -0.065***
(-4.29) (-4.56) (-4.30) (-4.57) (-4.43) (-4.70)5th -0.079*** -0.084*** -0.073*** -0.077*** -0.071*** -0.076***
(-4.91) (-5.20) (-4.57) (-4.82) (-4.49) (-4.75)
Number of Household Members 0.057*** 0.049*** 0.057*** 0.048*** 0.056*** 0.047***(15.40) (13.07) (15.44) (12.97) (15.34) (12.87)
Number of Children < 5 Years 0.046*** 0.036*** 0.047*** 0.036*** 0.046*** 0.035***(12.16) (9.22) (12.59) (9.49) (12.30) (9.24)
Years of Schooling -0.004* -0.001 -0.003 0.000 -0.003 0.000(-1.78) (-0.30) (-1.59) (-0.08) (-1.56) (-0.03)
Partner's Years of Schooling 0.004 0.007 0.001 0.005 0.003 0.006(0.92) (1.61) (0.34) (1.11) (0.72) (1.47)
Number of Children < 5 Years -0.002* -0.003*** -0.002* -0.003*** -0.002 -0.003***(-1.91) (-2.81) (-1.81) (-2.74) (-1.64) (-2.58)
Years of Schooling -0.003*** -0.003*** -0.003*** -0.003*** -0.003*** -0.003***(-3.34) (-3.36) (-3.26) (-3.29) (-2.92) (-2.96)
Partner's Years of Schooling 0.001 0.001 0.000 0.000 0.000 0.000(1.21) (1.40) (-0.08) (0.14) (0.26) (0.46)
Fixed Effects: X X X X X X X X XTrends: X X X
Observations 35845 31267 31267 37317 31250 31250 35822 31248 31248R-squared 0.128 0.157 0.167 0.146 0.176 0.186 0.152 0.180 0.189
Notes: Parentheses show t-statistics estimated from robust standard errors adjusted at the district level (1082 clusters). *** p<0.01, ** p<0.05, * p<0.1. Regressions include
district (1083), survey year (3), and birth year cohort (48) dummies. Trends refers to region-specific time trends (a dummy is created for survey five-year birth cohorts from
each region). 'Childhood History of PCA' takes a value of one if the respondent was physically abused by her parents, zero otherwise. 'Exposed to IPV' is a binary variable that takes a value of one if the respondent has ever been pushed, shaken, or attacked by her intimate partner.
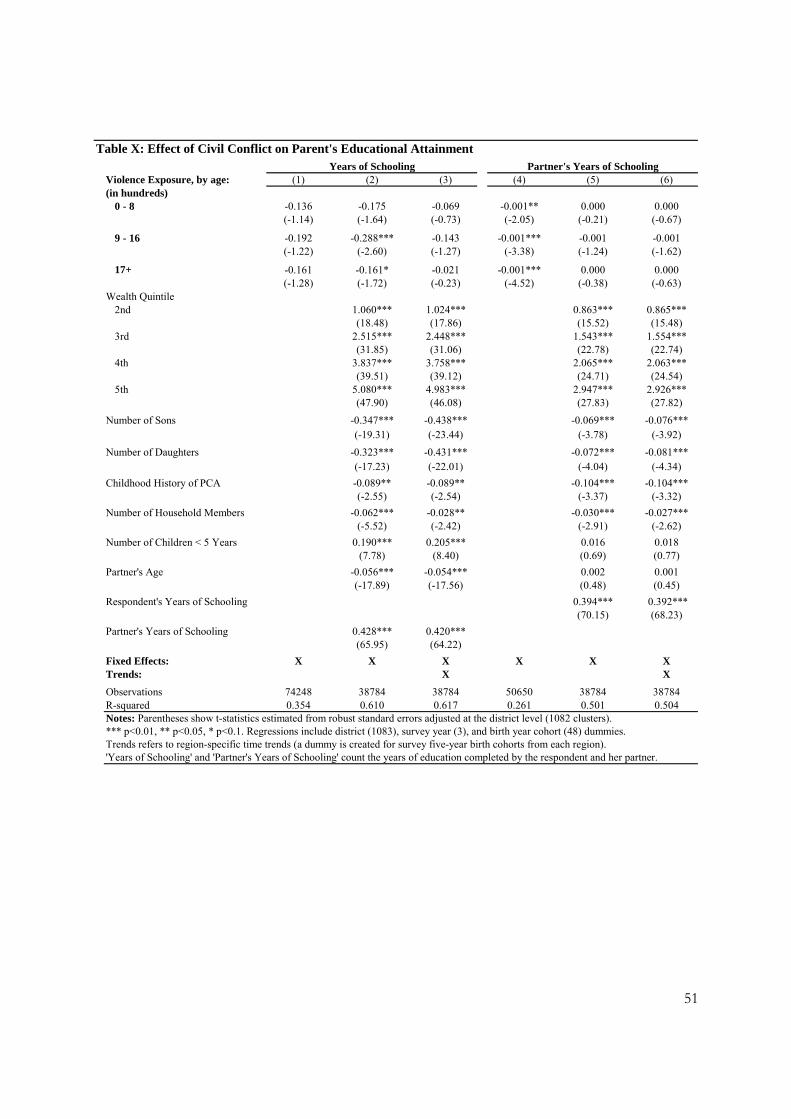
51
Table X: Effect of Civil Conflict on Parent's Educational AttainmentYears of Schooling Partner's Years of Schooling
Violence Exposure, by age: (1) (2) (3) (4) (5) (6)(in hundreds)
0 - 8 -0.136 -0.175 -0.069 -0.001** 0.000 0.000(-1.14) (-1.64) (-0.73) (-2.05) (-0.21) (-0.67)
9 - 16 -0.192 -0.288*** -0.143 -0.001*** -0.001 -0.001(-1.22) (-2.60) (-1.27) (-3.38) (-1.24) (-1.62)
17+ -0.161 -0.161* -0.021 -0.001*** 0.000 0.000(-1.28) (-1.72) (-0.23) (-4.52) (-0.38) (-0.63)
Wealth Quintile2nd 1.060*** 1.024*** 0.863*** 0.865***
(18.48) (17.86) (15.52) (15.48)3rd 2.515*** 2.448*** 1.543*** 1.554***
(31.85) (31.06) (22.78) (22.74)4th 3.837*** 3.758*** 2.065*** 2.063***
(39.51) (39.12) (24.71) (24.54)5th 5.080*** 4.983*** 2.947*** 2.926***
(47.90) (46.08) (27.83) (27.82)
Number of Sons -0.347*** -0.438*** -0.069*** -0.076***(-19.31) (-23.44) (-3.78) (-3.92)
Number of Daughters -0.323*** -0.431*** -0.072*** -0.081***(-17.23) (-22.01) (-4.04) (-4.34)
Childhood History of PCA -0.089** -0.089** -0.104*** -0.104***(-2.55) (-2.54) (-3.37) (-3.32)
Number of Household Members -0.062*** -0.028** -0.030*** -0.027***(-5.52) (-2.42) (-2.91) (-2.62)
Number of Children < 5 Years 0.190*** 0.205*** 0.016 0.018(7.78) (8.40) (0.69) (0.77)
Partner's Age -0.056*** -0.054*** 0.002 0.001(-17.89) (-17.56) (0.48) (0.45)
Respondent's Years of Schooling 0.394*** 0.392***(70.15) (68.23)
Partner's Years of Schooling 0.428*** 0.420***(65.95) (64.22)
Fixed Effects: X X X X X XTrends: X X
Observations 74248 38784 38784 50650 38784 38784R-squared 0.354 0.610 0.617 0.261 0.501 0.504Notes: Parentheses show t-statistics estimated from robust standard errors adjusted at the district level (1082 clusters). *** p<0.01, ** p<0.05, * p<0.1. Regressions include district (1083), survey year (3), and birth year cohort (48) dummies.Trends refers to region-specific time trends (a dummy is created for survey five-year birth cohorts from each region). 'Years of Schooling' and 'Partner's Years of Schooling' count the years of education completed by the respondent and her partner.

52
Table XI: Effect of Conflict on District-Level Health Resources and Social Spending
Healthcare personnel (logged)a % Change FONCOMUNb % Change Vaso de Lecheb
(1) (2) (3) (4) (5) (6) (7) (8) (9)
Total Violence (in hundreds) 0.245 0.264 0.303 0.054 0.062 0.051 0.62 0.909 0.827(3.60)*** (5.51)*** (5.21)*** (1.86)* (2.15)** (1.22) (2.22)** (3.21)*** (2.39)**(4.45)*** (7.36)*** (6.50)*** (1.73)* (1.93)* (1.27) (1.58) (2.25)** (2.04)**
Population (in thousands) 0.015 0.014 -0.001 -0.001 -0.015 -0.012(3.89)*** (4.17)*** (-2.04)* (-2.29)** (-1.92)* (-2.17)**(3.62)*** (3.84)*** (-1.75)* (-1.88)* (-2.05)** (-2.00)**
Poverty Rate -0.041 -0.051 0.002 0.008 -0.012 -0.102(-4.06)*** (-3.86)*** (0.56) (1.74)* (-0.09) (-0.54)(-5.47)*** (-6.27)*** (0.46) (1.59) (-0.08) (-0.53)
Percentage Without Piped Water 0.003 0.002 0.002 0.001 0.046 0.076(1.37) (1.28) (1.26) (0.91) (1.36) (1.58)(2.21)** (1.77)* (1.27) (0.93) (1.35) (1.48)
Percentage Without Piped Sewage/Drains 0.005 0.003 -0.002 -0.002 -0.048 -0.042(2.26)** (1.71) (-1.15) (-1.02) (-1.08) (-0.98)(2.05)** (1.46) (-1.09) (-1.10) (-0.94) (-0.86)
Percentage Without Electricity 0.001 0.000 0.002 0.002 -0.008 -0.011(0.30) (0.06) (1.50) (2.49)** (-0.26) (-0.25)(0.42) (0.08) (1.62) (1.76)* (-0.25) (-0.24)
Total Budget Growth from 1998-2008 -0.008 0.001 -0.002 -0.003 0.053 0.034(-2.58)** (0.18) (-0.82) (-1.00) (0.85) (0.46)(-1.96)* (0.17) (-0.90) (-1.10) (0.80) (0.44)
Total Budget Used 2008 (in millions) 0.004 0.003 -0.001 -0.001 0.000 0.004(2.61)** (2.58)** (-3.20)*** (-2.72)** (0.05) (0.79)(2.77)*** (2.77)*** (-3.48)*** (-3.05)*** (0.05) (0.78)
Region Fixed Effects: X X X
Observations 1819 1049 1049 1053 1052 1052 1057 1056 1056R-squared 0.027 0.417 0.495 0.003 0.023 0.072 0.001 0.008 0.032
Notes: First row of parentheses show t-statistics estimated from robust standard errors at the region level (25 clusters). Second row of parentheses show t-statistics estimated
from robust standard errors at the province level (202 clusters). *** p<0.01, ** p<0.05, * p<0.1. The district-level covariates were obtained from a 1999 census and from a
panel dataset of Peruvian districts’ revenue and expenditure records from 2001–2007, as stated on official annual reports prepared by district governments.
'Total Violence' refers to the number of civil-conflict-related events occurred in a district between 1980-2000.a The ‘Healthcare personnel (logged)’ variable is the natural log of the sum of the public medical personnel in each district in 2012. The medical personnel are hired by the
Ministry of Health (Ministerio de Salud, MINSA) or regional governments. Medical personnel is defined as the number of doctors, nurses, dentists, OBs, psychologists,
nutritionists, pharmacists, medical technologists, and healthcare administrative personnel. The variables '% Change FONCOMUN’ and ‘% Change Vaso de Leche’ measure b The variables '% Change FONCOMUN’ and ‘% Change Vaso de Leche’ measure the percentage change in FONCOMUN and Vaso de Leche transfers from 1998 to 2008.
Alternatively, one could measure the percentage change from the 1998-2000 average to the 2006-2008 average. The FONCOMUN results presented here are robust to the
alternative measure. Due to data limitations, only 829 districts have values for the ‘% Change Vaso de Leche’ variable when using the alternate definition, compared to the 1060
districts that have values using the preferred growth measure used in this table.

53
Table XII: Civil Conflict Exposure and Access to Community Resources and Social Programs
Health Visit Last Year Used Nutrition Social Programs(1) (2) (3) (4) (5) (6)
Lifetime Conflict Exposure 0.012* 0.027** 0.016 0.029*** 0.039** 0.039**(in hundreds) (1.87) (2.52) (1.31) (2.99) (2.57) (2.41)
District's Health Resources Per Capita -0.001*** -0.001*** -0.003*** 0.001*** 0.002*** 0.003***(-4.94) (-4.54) (-11.38) (6.92) (7.18) (4.15)
District's Social Spending Transfers 0.000 0.000 0.000 0.000 0.000 0.000-0.08 (-0.33) (-0.33) (-1.07) (-0.85) (-0.82)
Wealth Quintile2nd 0.014 0.013 -0.025* -0.026*
(1.25) (1.15) (-1.73) (-1.79)3rd 0.037*** 0.035** -0.057*** -0.058***
(2.72) (2.54) (-3.81) (-3.79)4th 0.095*** 0.091*** -0.073*** -0.074***
(5.61) (5.38) (-4.38) (-4.40)5th 0.174*** 0.172*** -0.067*** -0.070***
(9.74) (9.70) (-3.70) (-3.85)
Number of Sons 0.003 0.002 -0.004 -0.005(1.00) (0.66) (-0.99) (-1.17)
Number of Daughters 0.001 0.001 0.004 0.003(0.32) (0.15) (0.99) (0.66)
Childhood History of PCA 0.015** 0.014** 0.009 0.009(2.23) (2.15) (1.38) (1.33)
Number of Household Members -0.002 -0.002 -0.004** -0.004**(-0.80) (-0.90) (-2.56) (-2.32)
Number of Children < 5 Years -0.002 -0.001 -0.011** -0.012**(-0.53) (-0.18) (-1.99) (-2.25)
Years of Schooling 0.014*** 0.014*** -0.006*** -0.006***(13.41) (13.30) (-4.45) (-4.47)
Partner's Years of Schooling 0.002* 0.002* -0.002 -0.001(1.96) (1.91) (-1.21) (-1.03)
Partner's Age 0.000 0.000 0.001 0.001(0.47) (0.65) (0.98) (1.10)
Fixed Effects: X X X X X XTrends: X X
Observations 61436 31759 31759 13851 10729 10729R-squared 0.065 0.104 0.109 0.268 0.294 0.305Notes: Parentheses show t-statistics estimated from robust standard errors adjusted at the district level (1082 clusters). *** p<0.01, ** p<0.05, * p<0.1. Regressions include district (1083), survey year (3), and birth year cohort (48) dummies.Trends refers to region-specific time trends (a dummy is created for survey five-year birth cohorts from each region). ‘Health Visit Last Year’ takes a value of one if the respondent had a medical visit in the previous year. In the 2000 survey, respondents were asked how many times in the previous week they fed their children “mashed potatoes from social programs.” In the 2011 and 2012 surveys, they were asked whether they gave their children “porridge from social programs.” The ‘Used Nutrition Social Programs’ variable takes a value of one if the respondents gave a non-zero response for the 2000 survey or an affirmative answer for the latter surveys. 'District's Health Resources Per Capita' refers to the total number of medical personnel per capita (in thousands) in districts in 2012. 'District's Social Spending Transfers' refers to the total amount (in thousands) of FONCONDES and Vaso de Leche transfers received by district in 1998 (for those surveyed) in 2000 and in 2008 for those surveyed in 2011 or 2012.
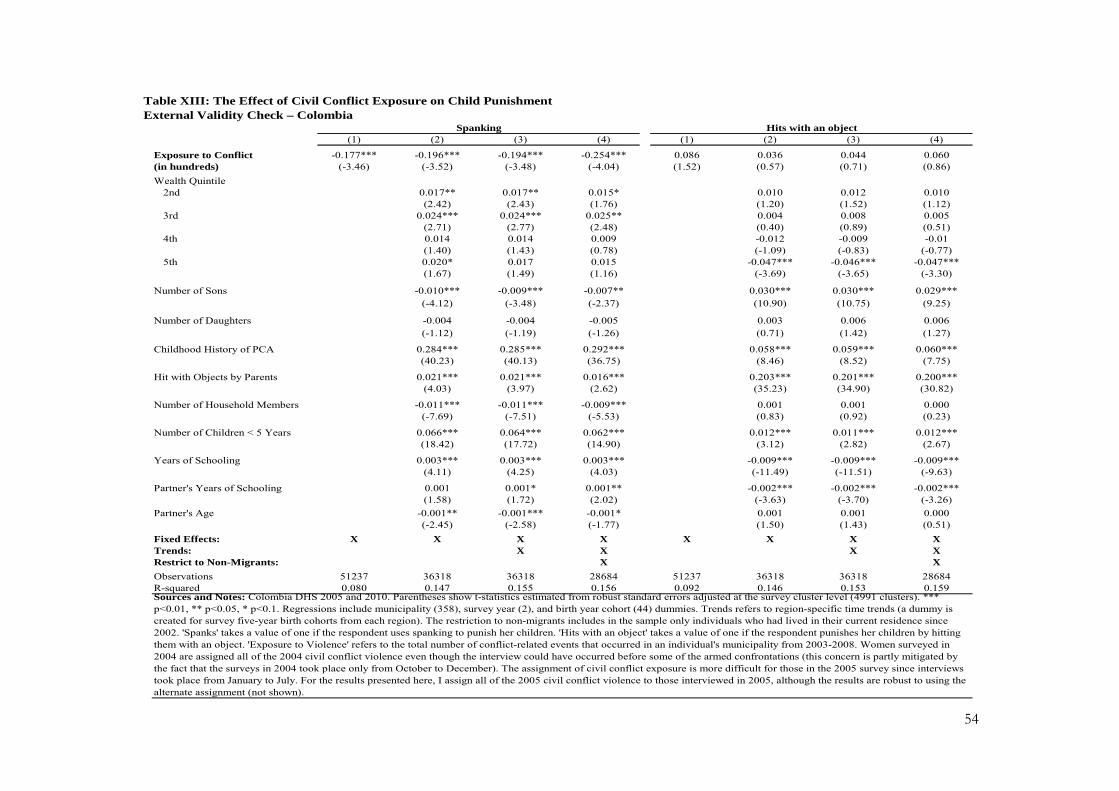
54
Table XIII: The Effect of Civil Conflict Exposure on Child PunishmentExternal Validity Check – Colombia
Spanking Hits with an object(1) (2) (3) (4) (1) (2) (3) (4)
Exposure to Conflict -0.177*** -0.196*** -0.194*** -0.254*** 0.086 0.036 0.044 0.060(in hundreds) (-3.46) (-3.52) (-3.48) (-4.04) (1.52) (0.57) (0.71) (0.86)
Wealth Quintile2nd 0.017** 0.017** 0.015* 0.010 0.012 0.010
(2.42) (2.43) (1.76) (1.20) (1.52) (1.12)3rd 0.024*** 0.024*** 0.025** 0.004 0.008 0.005
(2.71) (2.77) (2.48) (0.40) (0.89) (0.51)4th 0.014 0.014 0.009 -0.012 -0.009 -0.01
(1.40) (1.43) (0.78) (-1.09) (-0.83) (-0.77)5th 0.020* 0.017 0.015 -0.047*** -0.046*** -0.047***
(1.67) (1.49) (1.16) (-3.69) (-3.65) (-3.30)
Number of Sons -0.010*** -0.009*** -0.007** 0.030*** 0.030*** 0.029***(-4.12) (-3.48) (-2.37) (10.90) (10.75) (9.25)
Number of Daughters -0.004 -0.004 -0.005 0.003 0.006 0.006(-1.12) (-1.19) (-1.26) (0.71) (1.42) (1.27)
Childhood History of PCA 0.284*** 0.285*** 0.292*** 0.058*** 0.059*** 0.060***(40.23) (40.13) (36.75) (8.46) (8.52) (7.75)
Hit with Objects by Parents 0.021*** 0.021*** 0.016*** 0.203*** 0.201*** 0.200***(4.03) (3.97) (2.62) (35.23) (34.90) (30.82)
Number of Household Members -0.011*** -0.011*** -0.009*** 0.001 0.001 0.000(-7.69) (-7.51) (-5.53) (0.83) (0.92) (0.23)
Number of Children < 5 Years 0.066*** 0.064*** 0.062*** 0.012*** 0.011*** 0.012***(18.42) (17.72) (14.90) (3.12) (2.82) (2.67)
Years of Schooling 0.003*** 0.003*** 0.003*** -0.009*** -0.009*** -0.009***(4.11) (4.25) (4.03) (-11.49) (-11.51) (-9.63)
Partner's Years of Schooling 0.001 0.001* 0.001** -0.002*** -0.002*** -0.002***(1.58) (1.72) (2.02) (-3.63) (-3.70) (-3.26)
Partner's Age -0.001** -0.001*** -0.001* 0.001 0.001 0.000(-2.45) (-2.58) (-1.77) (1.50) (1.43) (0.51)
Fixed Effects: X X X X X X X XTrends: X X X XRestrict to Non-Migrants: X X
Observations 51237 36318 36318 28684 51237 36318 36318 28684R-squared 0.080 0.147 0.155 0.156 0.092 0.146 0.153 0.159Sources and Notes: Colombia DHS 2005 and 2010. Parentheses show t-statistics estimated from robust standard errors adjusted at the survey cluster level (4991 clusters). *** p<0.01, ** p<0.05, * p<0.1. Regressions include municipality (358), survey year (2), and birth year cohort (44) dummies. Trends refers to region-specific time trends (a dummy is created for survey five-year birth cohorts from each region). The restriction to non-migrants includes in the sample only individuals who had lived in their current residence since 2002. 'Spanks' takes a value of one if the respondent uses spanking to punish her children. 'Hits with an object' takes a value of one if the respondent punishes her children by hitting them with an object. 'Exposure to Violence' refers to the total number of conflict-related events that occurred in an individual's municipality from 2003-2008. Women surveyed in 2004 are assigned all of the 2004 civil conflict violence even though the interview could have occurred before some of the armed confrontations (this concern is partly mitigated by the fact that the surveys in 2004 took place only from October to December). The assignment of civil conflict exposure is more difficult for those in the 2005 survey since interviews took place from January to July. For the results presented here, I assign all of the 2005 civil conflict violence to those interviewed in 2005, although the results are robust to using the alternate assignment (not shown).

55
Appendix
Supplementary Materials for “Face the bullet, spare the rod?” Evidence from the
aftermath of the Shining Path Insurgency
Alvaro Morales and Prakarsh Singh

56
Appendix
V. Results: D. Robustness Check: Spatial Identification
In this subsection, we run robustness checks that consider spatial identification problems.38
Respondents could have been unaware of, or unaffected by, conflict-related acts that occurred within
their district but very far from where they lived. Therefore, the conflict exposure variables for larger
districts may overinflate actual exposure. Similarly, residents from smaller districts are likely affected
by conflict events that occur in nearby districts.39 In this case, the violence exposure variables for
smaller districts may underestimate actual exposure.
In order to address the above concerns, we exclude respondents from districts whose areas are
less than the 20th percentile of all districts (smaller than 6,613.45 km squared), and in separate
regressions, we exclude respondents from districts whose areas are more than the 80th percentile of all
districts (greater than 101,764.7 km squared). Table A.VII presents these results. For the regressions
excluding the smaller districts, the effect of ‘Lifetime Conflict Exposure’ on women’s PCA-use is
smaller than the effect for the unrestricted sample. Meanwhile, for the regressions excluding the largest
districts, the ‘Lifetime Conflict Exposure’ coefficients are larger. Both results remain significant at the
5% or 1% level across the levels of controls. These results suggest civil conflict exposure is
overinflated for larger districts and underestimated for smaller ones.
V. Results: E. Household Use of Physical Punishment
The related conflict literature on domestic violence has overlooked men’s conflict exposure
(Gutierrez & Gallegos, 2011; Noe & Rieckmann, 2013). However, the conceptual framework for
38 These tests were inspired by similar ones run by Noe & Rieckmann (2013). 39 As Noe & Rieckmann (2013) note, the civil conflict violence “does not sharply stop at a district border, which is why conflict intensity measures for neighbouring districts are anyway correlated” (15).
57
conflict’s effect on PCA-use also applies to men. Columns (1) – (3) in Table A.XIII suggest men’s
exposure to conflict is not significantly associated with their PCA-use. This result should be
interpreted with caution. Only the husband’s age at the time of the interview is known, so the exposure
to violence is not as precisely measured as it is for women. Nonetheless, the results suggest that men
do not respond to conflict exposure in the same way women do. This may explain why previous
research finds conflict exposure is associated with increases in IPV-victimhood, while we find it
reduces physical child abuse.
To better explore the heterogeneous effects of conflict on PCA-use by gender, Panel B analyzes
both parents. The dependent variable tests for the general presence of physical punishment in a
household: ‘Household PCA-use’ takes a value of one if either the respondent or her husband
physically punish their children. Panel B includes both the respondents’ and their partners’ conflict
exposure variables along with their interaction. In contrast to Panel A, Column (6) shows both the
respondents’ and their male partners’ conflict exposures have an effect on child physical punishment.
A one hundred event increase in a women’s lifetime exposure to conflict is associated with a 5.7
percentage point decrease in the probability either her or her partner use PCA. The same conflict
intensity increase for a husband is associated with a 3.7 percentage point decrease. Due to the
interaction of conflict exposures, the results for women are conditional to their husbands having never
experienced violence, and vice versa. Overall, the findings suggest the general presence of PCA-use is
more sensitive to the conflict exposure of mothers than the exposure of fathers.
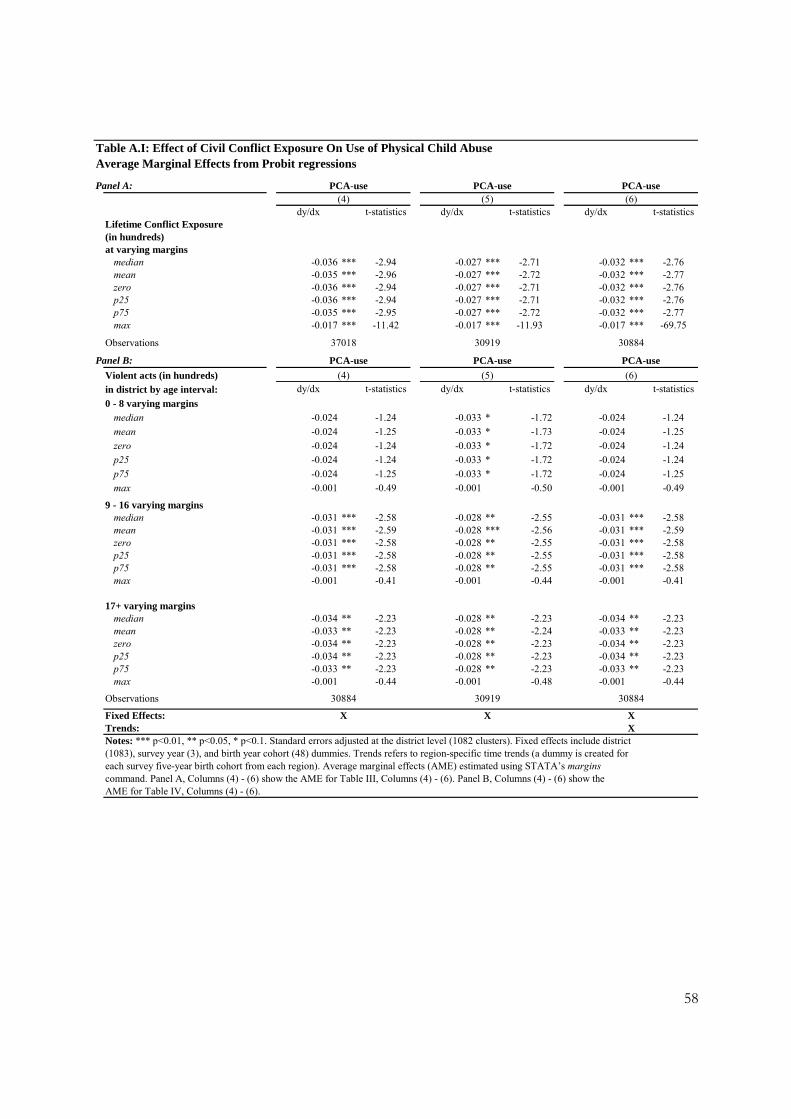
58
Table A.I: Effect of Civil Conflict Exposure On Use of Physical Child AbuseAverage Marginal Effects from Probit regressions
Panel A: PCA-use PCA-use PCA-use(4) (5) (6)
dy/dx t-statistics dy/dx t-statistics dy/dx t-statisticsLifetime Conflict Exposure(in hundreds)at varying margins
median -0.036 *** -2.94 -0.027 *** -2.71 -0.032 *** -2.76mean -0.035 *** -2.96 -0.027 *** -2.72 -0.032 *** -2.77zero -0.036 *** -2.94 -0.027 *** -2.71 -0.032 *** -2.76p25 -0.036 *** -2.94 -0.027 *** -2.71 -0.032 *** -2.76p75 -0.035 *** -2.95 -0.027 *** -2.72 -0.032 *** -2.77max -0.017 *** -11.42 -0.017 *** -11.93 -0.017 *** -69.75
Observations 37018 30919 30884
Panel B: PCA-use PCA-use PCA-use
Violent acts (in hundreds) (4) (5) (6)
in district by age interval: dy/dx t-statistics dy/dx t-statistics dy/dx t-statistics
0 - 8 varying marginsmedian -0.024 -1.24 -0.033 * -1.72 -0.024 -1.24
mean -0.024 -1.25 -0.033 * -1.73 -0.024 -1.25zero -0.024 -1.24 -0.033 * -1.72 -0.024 -1.24p25 -0.024 -1.24 -0.033 * -1.72 -0.024 -1.24
p75 -0.024 -1.25 -0.033 * -1.72 -0.024 -1.25max -0.001 -0.49 -0.001 -0.50 -0.001 -0.49
9 - 16 varying marginsmedian -0.031 *** -2.58 -0.028 ** -2.55 -0.031 *** -2.58mean -0.031 *** -2.59 -0.028 *** -2.56 -0.031 *** -2.59zero -0.031 *** -2.58 -0.028 ** -2.55 -0.031 *** -2.58p25 -0.031 *** -2.58 -0.028 ** -2.55 -0.031 *** -2.58p75 -0.031 *** -2.58 -0.028 ** -2.55 -0.031 *** -2.58max -0.001 -0.41 -0.001 -0.44 -0.001 -0.41
17+ varying marginsmedian -0.034 ** -2.23 -0.028 ** -2.23 -0.034 ** -2.23mean -0.033 ** -2.23 -0.028 ** -2.24 -0.033 ** -2.23zero -0.034 ** -2.23 -0.028 ** -2.23 -0.034 ** -2.23p25 -0.034 ** -2.23 -0.028 ** -2.23 -0.034 ** -2.23p75 -0.033 ** -2.23 -0.028 ** -2.23 -0.033 ** -2.23max -0.001 -0.44 -0.001 -0.48 -0.001 -0.44
Observations 30884 30919 30884
Fixed Effects: X X XTrends: XNotes: *** p<0.01, ** p<0.05, * p<0.1. Standard errors adjusted at the district level (1082 clusters). Fixed effects include district (1083), survey year (3), and birth year cohort (48) dummies. Trends refers to region-specific time trends (a dummy is created for each survey five-year birth cohort from each region). Average marginal effects (AME) estimated using STATA’s margins command. Panel A, Columns (4) - (6) show the AME for Table III, Columns (4) - (6). Panel B, Columns (4) - (6) show the AME for Table IV, Columns (4) - (6).

59
Table A.II: Effect of Civil Conflict Exposure On Use of Physical Child Abuse, by Five Age Intervals
Linear Probability ModelPCA-use
Violent acts (in hundreds) (1) (2) (3)in district by age interval:
0 - 4 -0.032 -0.039 -0.032(-0.73) (-1.21) (-0.98)
5 - 9 -0.038** -0.028 -0.027(-2.27) (-1.47) (-1.46)
10 - 14 -0.028 -0.022 -0.031*(-1.56) (-1.22) (-1.83)
15 - 19 -0.043* -0.038* -0.044**(-1.90) (-1.85) (-2.02)
20+ -0.027 -0.027* -0.036**(-1.49) (-1.90) (-2.31)
Wealth Quintile2nd 0.005 0.002
(0.51) (0.18)3rd -0.01 -0.014
(-0.78) (-1.14)4th -0.060*** -0.064***
(-4.31) (-4.58)5th -0.073*** -0.077***
(-4.59) (-4.83)
Number of Sons 0.057*** 0.048***(15.43) (12.99)
Number of Daughters 0.047*** 0.036***(12.57) (9.48)
Childhood History of PCA 0.173*** 0.173***(26.92) (26.68)
Number of Household Members -0.003 0.000(-1.60) (-0.09)
Number of Children < 5 Years 0.001 0.005(0.34) (1.12)
Years of Schooling -0.002* -0.003***(-1.80) (-2.74)
Partner's Years of Schooling -0.003*** -0.003***(-3.25) (-3.27)
Partner's Age 0.000 0.000(-0.10) (0.12)
Fixed Effects: X X XTrends: X
Observations 37342 31250 31250R-squared (Pseudo for probit) 0.120 0.176 0.186
Notes: Parentheses show t-statistics estimated from robust standard errors adjusted at the district level (1082 clusters). *** p<0.01, ** p<0.05, * p<0.1. Regressions include district (1083), survey year (3), and birth year cohort (48) dummies.Trends refers to region-specific time trends (a dummy is created for survey five-year birth cohorts from each region).
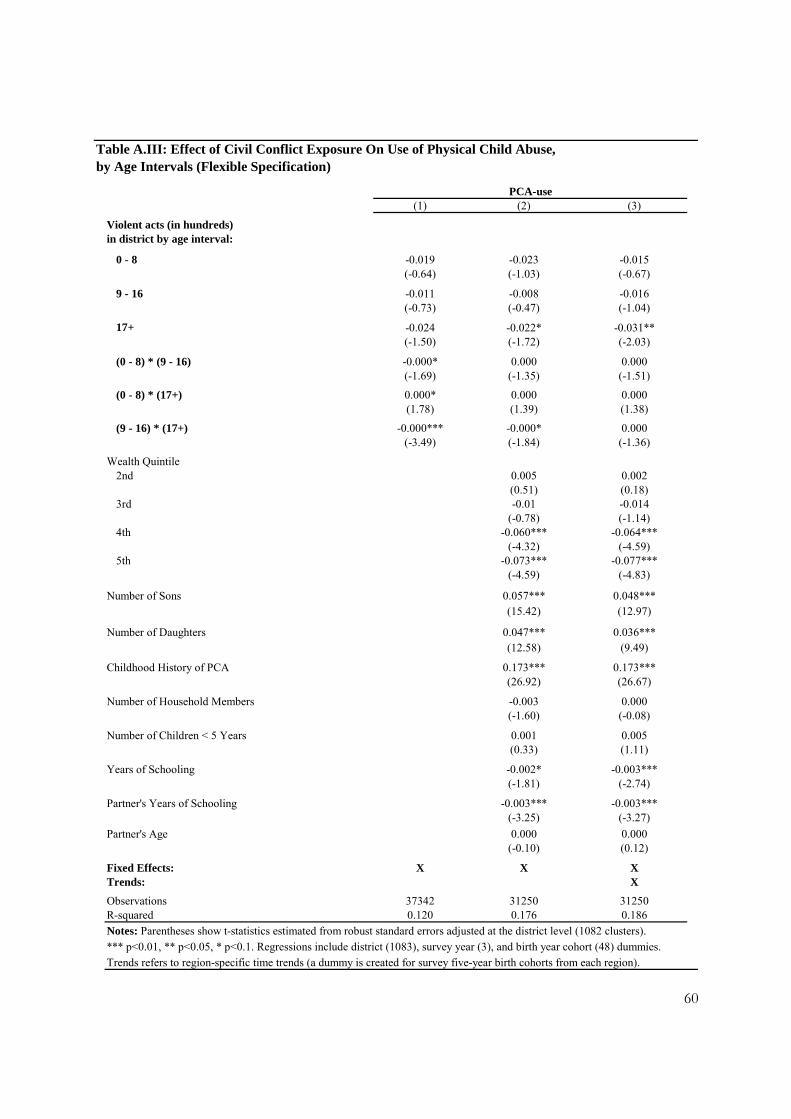
60
Table A.III: Effect of Civil Conflict Exposure On Use of Physical Child Abuse, by Age Intervals (Flexible Specification)
PCA-use(1) (2) (3)
Violent acts (in hundreds)in district by age interval:
0 - 8 -0.019 -0.023 -0.015(-0.64) (-1.03) (-0.67)
9 - 16 -0.011 -0.008 -0.016(-0.73) (-0.47) (-1.04)
17+ -0.024 -0.022* -0.031**(-1.50) (-1.72) (-2.03)
(0 - 8) * (9 - 16) -0.000* 0.000 0.000(-1.69) (-1.35) (-1.51)
(0 - 8) * (17+) 0.000* 0.000 0.000(1.78) (1.39) (1.38)
(9 - 16) * (17+) -0.000*** -0.000* 0.000(-3.49) (-1.84) (-1.36)
Wealth Quintile2nd 0.005 0.002
(0.51) (0.18)3rd -0.01 -0.014
(-0.78) (-1.14)4th -0.060*** -0.064***
(-4.32) (-4.59)5th -0.073*** -0.077***
(-4.59) (-4.83)
Number of Sons 0.057*** 0.048***(15.42) (12.97)
Number of Daughters 0.047*** 0.036***(12.58) (9.49)
Childhood History of PCA 0.173*** 0.173***(26.92) (26.67)
Number of Household Members -0.003 0.000(-1.60) (-0.08)
Number of Children < 5 Years 0.001 0.005(0.33) (1.11)
Years of Schooling -0.002* -0.003***(-1.81) (-2.74)
Partner's Years of Schooling -0.003*** -0.003***(-3.25) (-3.27)
Partner's Age 0.000 0.000(-0.10) (0.12)
Fixed Effects: X X XTrends: X
Observations 37342 31250 31250R-squared 0.120 0.176 0.186
Notes: Parentheses show t-statistics estimated from robust standard errors adjusted at the district level (1082 clusters).
*** p<0.01, ** p<0.05, * p<0.1. Regressions include district (1083), survey year (3), and birth year cohort (48) dummies.
Trends refers to region-specific time trends (a dummy is created for survey five-year birth cohorts from each region).

61
Table A.IV: Descriptive Statistics for Migrants vs. Non-MigrantsNon-Migrant Migrant
N Mean SD N Mean SDHousehold CharacteristicsYears of schooling 19498 8.33 4.63 17844 8.09 4.37
Partner's years of schooling 18380 9.04 3.91 17221 9.02 3.72
Age 19498 34.93 8.03 17844 33.48 7.51
Partner's age 15902 38.81 9.26 15500 37.68 8.81
Wealth quintile 19498 2.77 1.38 17844 2.62 1.24
Number of sons 19498 1.35 1.12 17844 1.28 1.06
Number of daughters 19498 1.18 1.06 17844 1.13 0.99
Number of household members 19498 5.31 2.09 17844 4.99 1.86
Number of children < 5 years 19498 0.83 0.85 17844 0.86 0.82
Domestic Violence ExposurePCA-use 19498 0.38 0.49 17844 0.42 0.49
Partner PCA-use 12445 0.38 0.49 12238 0.40 0.49
Exposed to IPV 18496 0.27 0.44 17349 0.23 0.42
Childhood history of PCA 19479 0.66 0.47 17838 0.73 0.45
Civil Conflict Exposure (in hundreds)Lifetime Conflict Exposure 19498 0.26 0.79 17844 0.28 0.79
Between 0-8 years 19498 0.04 0.27 17844 0.05 0.27
Between 9-16 years 19498 0.07 0.34 17844 0.08 0.36
After 17 years 19498 0.16 0.57 17844 0.15 0.52
Sources and Notes: DHS Peru 2000, 2011, and 2012 and TRC (2004). A respondent who has always lived in her current home or lived there prior to the start of the civil conflict is considered a non-migrant. Variable
descriptions can be found in the Sources and Notes section of Table I.

62
Table A.V: District Probability of Experiencing Median Level of Violence Robustness Check: District Propensity Scores
Probit ModelTreatment: Median Level of Violence or Above
(1) (2) (3) (4)
GDP growth from 1975 to 1980 -0.347** -0.127 -0.343** 0.251(% change) (-2.02) (-0.20) (-2.02) (0.39)
GDP per capita in 1980 (in thousands) -0.007*** -0.005** -0.006*** -0.002(-2.97) (-2.01) (-2.77) (-0.96)
Altitude Quintile (highest altitude omitted)
1st -0.480*** -0.121 -0.776*** -0.459*(-2.71) (-0.50) (-3.89) (-1.87)
2nd -0.130 0.170 -0.233 -0.018(-0.75) (0.86) (-1.30) (-0.09)
3rd -0.170 -0.221 -0.195 -0.246(-0.90) (-1.20) (-1.02) (-1.30)
4th 0.121 -0.048 0.127 -0.049(0.75) (-0.32) (0.77) (-0.33)
Proxy for pre-treatment variables:a
Population per district -0.001 -0.002(in thousands) (-0.42) (-0.59)
Number of Schools 0.004 0.008***(1.48) (2.81)
Number of Health Posts 0.013 0.009(0.62) (0.41)
Region Fixed Effects: X X
Observations 822 819 822 819Pseudo R-squared 0.062 0.169 0.062 0.169Notes: Parentheses show t-statistics estimated from robust standard errors adjusted at the province level (202 clusters). *** p<0.01, ** p<0.05, * p<0.1. Dependent variable takes a value of one if district was exposed to at least nine conflict-related events (the median for districts that were exposed to conflict violence). 'GDP growth from 1975 to 1980' and 'GDP per capita in 1980' are estimated using region-level GDP figures and district-level population estimates from a 1993 census. The propensity scores used in Table VI are estimated from the probit model in Column (4). a 'Population per district,’ ‘Number of schools,’ and ‘Number of Health Posts’ come from a 1993 census, however they should approximately proxy for pre-treatment values.

63
Table A.VI: Effect of Civil Conflict Exposure on PCA, by Post-Conflict District Social Spending Growth
Panel A: Median or Above Spending Growth Panel B: Below Median Spending GrowthPCA-use PCA-use
(1) (2) (3) (1) (2) (3)
Lifetime Conflict Exposure -0.029* -0.028** -0.051*** -0.084 -0.054 -0.053(in hundreds) (-1.95) (-2.17) (-3.33) (-1.07) (-0.69) (-0.80)
Wealth Quintile2nd 0.015 0.010 -0.020 -0.021
(0.89) (0.60) (-1.13) (-1.14)3rd -0.013 -0.023 -0.031 -0.034
(-0.70) (-1.28) (-1.34) (-1.46)4th -0.069*** -0.077*** -0.077*** -0.079***
(-3.42) (-3.77) (-3.10) (-3.18)5th -0.064*** -0.069*** -0.107*** -0.111***
(-2.86) (-3.00) (-4.03) (-4.18)
Number of Sons 0.056*** 0.045*** 0.061*** 0.053***(8.60) (7.14) (10.56) (9.13)
Number of Daughters 0.046*** 0.034*** 0.051*** 0.041***(6.74) (4.94) (8.80) (6.70)
Childhood History of PCA 0.180*** 0.178*** 0.164*** 0.165***(16.18) (16.32) (15.99) (15.65)
Number of Household Members -0.005 -0.002 -0.003 0.000(-1.28) (-0.56) (-1.14) (-0.10)
Number of Children < 5 Years 0.005 0.007 -0.004 -0.002(0.66) (1.07) (-0.57) (-0.21)
Years of Schooling -0.003* -0.004** -0.003 -0.004**(-1.84) (-2.28) (-1.43) (-2.08)
Partner's Years of Schooling -0.001 -0.002 -0.002 -0.002(-0.83) (-1.10) (-1.30) (-1.32)
Partner's Age 0.001 0.001 0.000 0.000(1.13) (0.99) (-0.36) (-0.36)
Fixed Effects: X X X X X XTrends: X X
Observations 12988 10788 10788 14375 11950 11950R-squared 0.109 0.170 0.190 0.120 0.176 0.189Notes: T-statistics estimated from robust standard errors in parentheses. *** p<0.01, ** p<0.05, * p<0.1. Standard errors adjusted at the district level (1082 clusters). Fixed effects include district (1083), survey year (3), and birth year cohort (48) dummies.Trends refers to region-specific time trends (a dummy is created for survey five-year birth cohorts from each region). Panel A restricts the sample to individuals living in districts that had the median or higher growth in FONCONUM and Vaso de Lechetransfers from 1998-2008, and Panel B restricts the sample to individuals living in districts that had lower than the median growth.
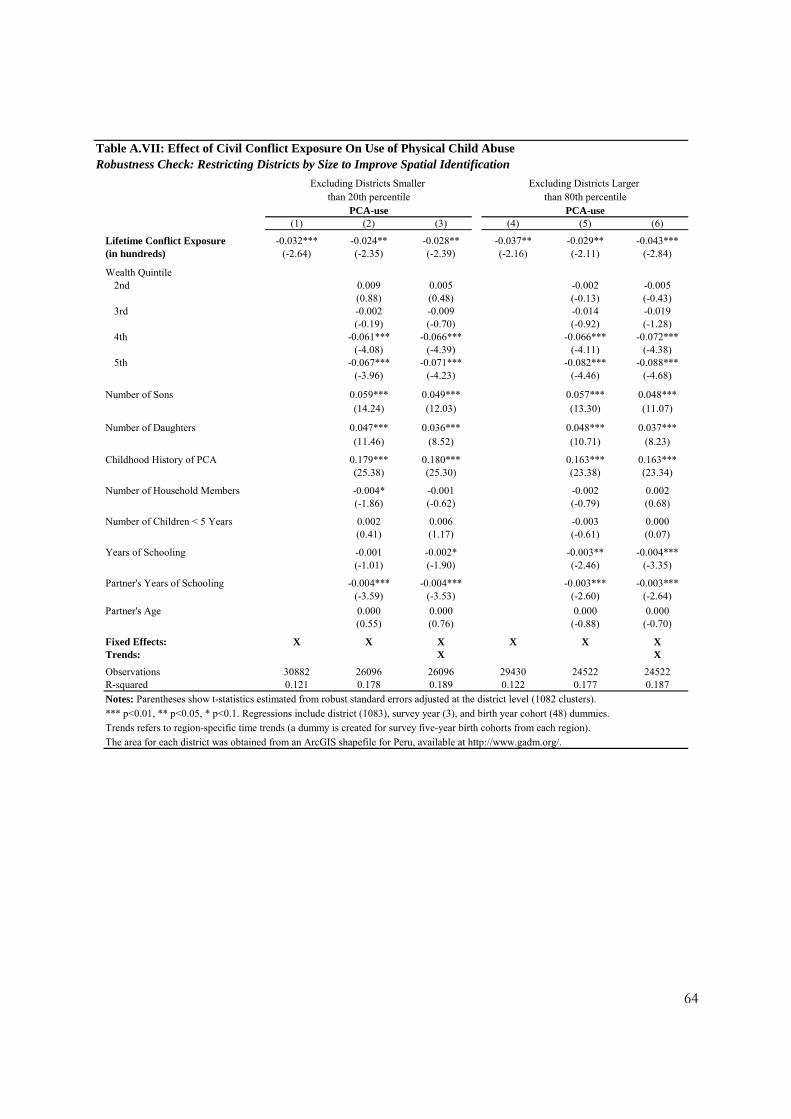
64
Table A.VII: Effect of Civil Conflict Exposure On Use of Physical Child AbuseRobustness Check: Restricting Districts by Size to Improve Spatial Identification
Excluding Districts Smaller Excluding Districts Larger than 20th percentile than 80th percentile
PCA-use PCA-use(1) (2) (3) (4) (5) (6)
Lifetime Conflict Exposure -0.032*** -0.024** -0.028** -0.037** -0.029** -0.043***(in hundreds) (-2.64) (-2.35) (-2.39) (-2.16) (-2.11) (-2.84)
Wealth Quintile2nd 0.009 0.005 -0.002 -0.005
(0.88) (0.48) (-0.13) (-0.43)3rd -0.002 -0.009 -0.014 -0.019
(-0.19) (-0.70) (-0.92) (-1.28)4th -0.061*** -0.066*** -0.066*** -0.072***
(-4.08) (-4.39) (-4.11) (-4.38)5th -0.067*** -0.071*** -0.082*** -0.088***
(-3.96) (-4.23) (-4.46) (-4.68)
Number of Sons 0.059*** 0.049*** 0.057*** 0.048***(14.24) (12.03) (13.30) (11.07)
Number of Daughters 0.047*** 0.036*** 0.048*** 0.037***(11.46) (8.52) (10.71) (8.23)
Childhood History of PCA 0.179*** 0.180*** 0.163*** 0.163***(25.38) (25.30) (23.38) (23.34)
Number of Household Members -0.004* -0.001 -0.002 0.002(-1.86) (-0.62) (-0.79) (0.68)
Number of Children < 5 Years 0.002 0.006 -0.003 0.000(0.41) (1.17) (-0.61) (0.07)
Years of Schooling -0.001 -0.002* -0.003** -0.004***(-1.01) (-1.90) (-2.46) (-3.35)
Partner's Years of Schooling -0.004*** -0.004*** -0.003*** -0.003***(-3.59) (-3.53) (-2.60) (-2.64)
Partner's Age 0.000 0.000 0.000 0.000(0.55) (0.76) (-0.88) (-0.70)
Fixed Effects: X X X X X XTrends: X X
Observations 30882 26096 26096 29430 24522 24522R-squared 0.121 0.178 0.189 0.122 0.177 0.187
Notes: Parentheses show t-statistics estimated from robust standard errors adjusted at the district level (1082 clusters).
*** p<0.01, ** p<0.05, * p<0.1. Regressions include district (1083), survey year (3), and birth year cohort (48) dummies.
Trends refers to region-specific time trends (a dummy is created for survey five-year birth cohorts from each region).
The area for each district was obtained from an ArcGIS shapefile for Peru, available at http://www.gadm.org/.

65
Table A.XIII: Effect of Civil Conflict Exposure On Use of Physical Child AbuseIntimate Partner and General Household PCA-use
Panel A: Panel B:Partner PCA-use Household PCA-use
(1) (2) (3) (4) (5) (6)
Lifetime Conflict Exposure -0.033* -0.036 -0.057*(in hundreds) (-1.74) (-1.13) (-1.69)
Partner Lifetime Conflict Exposure 0.001 -0.018 -0.025 0.045*** -0.031** -0.037**(in hundreds) (0.08) (-0.86) (-0.97) (5.34) (-2.21) (-2.49)
Lifetime Conflict Exposure * -0.000** 0.000 0.000Partner Lifetime Conflict Exposure (-2.53) (0.94) (1.49)
Wealth Quintile2nd -0.005 -0.007 0.007 0.004
(-0.45) (-0.65) (0.76) (0.41)3rd -0.034** -0.038*** -0.015 -0.02
(-2.45) (-2.65) (-1.24) (-1.64)4th -0.075*** -0.078*** -0.070*** -0.075***
(-4.76) (-4.91) (-5.17) (-5.45)5th -0.107*** -0.112*** -0.093*** -0.099***
(-6.54) (-6.67) (-6.01) (-6.32)
Number of Sons 0.071*** 0.063*** 0.074*** 0.065***(20.18) (17.75) (22.22) (19.23)
Number of Daughters 0.045*** 0.036*** 0.056*** 0.045***(11.85) (9.23) (15.76) (12.10)
Childhood History of PCA 0.133*** 0.134*** 0.174*** 0.174***(20.17) (20.21) (27.54) (27.41)
Number of Household Members -0.006*** -0.003 -0.004** -0.001(-2.61) (-1.37) (-2.10) (-0.51)
Number of Children < 5 Years -0.005 -0.003 -0.005 -0.001(-1.07) (-0.58) (-1.18) (-0.24)
Years of Schooling -0.007*** -0.008*** -0.004*** -0.005***(-6.82) (-7.43) (-4.33) (-5.32)
Partner's Years of Schooling -0.004*** -0.004*** -0.003*** -0.004***(-3.59) (-3.52) (-3.79) (-3.84)
Partner's Age -0.001* -0.001 -0.001 -0.001(-1.88) (-1.61) (-1.30) (-1.06)
Fixed Effects: X X X X X XTrends: X X
Observations 25976 25714 25714 37936 31828 31828R-squared 0.153 0.208 0.216 0.137 0.205 0.215Notes: Parentheses show t-statistics estimated from robust standard errors adjusted at the district level (1082 clusters). *** p<0.01, ** p<0.05, * p<0.1. Regressions include district (1083), survey year (3), and birth year cohort (48) dummies.Trends refers to region-specific time trends (a dummy is created for survey five-year birth cohorts from each region). 'Partner PCA-use' takes a value of one if the respondent's husband physically punishes their children. ‘Household PCA-use’ takes a value of 1 if either the respondent or her partner use PCA, zero otherwise.