Embed Size (px)
Citation preview

Project No. 09-775
Fabrication of Tungsten-Rhenium Cladding Materials via Spark Plasma Sintering for Ultra High Temperature
Reactor Applications
I ti t I iti t d R h F l C l R&DInvestigator-Initiated Research, Fuel Cycle R&D
Dr. Indrajit CharitUniversity of Idaho
In collaboration with:Boise State University
Idaho National Laboratory
James Cole, Technical POCFrank Goldner, Federal POC

Project No. 09-775
2
FINAL REPORT
Project Title: Fabrication of Tungsten-Rhenium Cladding Materials via Spark Plasma Sintering for Ultra High Temperature Reactor Applications
Technical Workscope: IIR-1
Project Period: Oct. 1, 2009 to Sep. 30, 2012
Project Tracking ID: CFP-09-775
Principal Investigators: Indrajit Charit (PI), University of Idaho, Moscow, ID 83844 208-885-5964; e-mail: [email protected] Darryl P. Butt (co-PI) and Megan Frary (co-PI) Boise State University, Boise, ID 83725
Mark C. Carroll (co-PI) Idaho National Laboratory, Idaho Falls, ID 83401
Project Objectives An essential long term goal for nuclear reactor is to develop the capability of operating nuclear reactors at temperatures in excess of 1500 K. This capability has applications in space exploration and some special terrestrial uses where high temperatures are needed in certain chemical or reforming processes. Refractory alloys have been identified as being capable of withstanding higher temperatures and considered critical for the development of ultra high temperature reactors. Tungsten alloys are known to possess extraordinary properties, such as excellent high temperature capability as well as the ability to resist leakage of fissile materials when used as a fuel clad. However, there are difficulties with the development of refractory alloys: lack of basic experimental data on thermodynamics, mechanical and physical properties, and difficulties associated with processing of these alloys. The research conducted in this project developed an optimized, cost-effective method for producing high purity tungsten and tungsten-rhenium alloyed dense fuel clad forms that are crucial for the development of very high temperature reactors. This study provides critical insight into the fundamental behavior of W-Re alloys made using a novel fabrication process comprising high energy ball milling and spark plasma sintering. A broader goal was to re-establish the US lead in the research field of refractory alloys, such as W-Re system, with potential applications in very high temperature nuclear reactors. Table of Content

Project No. 09-775
3
Cover Page 1 Project Objectives 2
1. Technical Background 5 1.1.Tungsten Alloys 5 1.2. Spark Plasma Sintering 6
2. Research Methods and Results 8
Task A. Processing and Fabrication of W and W-Re Alloys 10 Subtask A1. Procurement and Fabrication of W-Re Alloys 10
A1.1. Particle Size Analysis of As Received Powder 11 A1.2. Reduction Process of Powders 11
Subtask A2. Ball Milling of Powders 13 A2.1. Variable Milling of Powder 13 A2.2. Optimized Powder 14 A2.3. Particle Size Distribution – Variable Milling Powders 14 A2.4. Particle Size Distribution in Optimized Powders 16 A2.5. SEM Analysis of Milled and Blended Powders 17 A2.6. SEM Analysis of Optimized Powders 18 A2.7. XRD of Powders 20 Subtask A3. Spark Plasma Sintering 21 A3.1. SPS System & Accessories 21 A3.2. Sintering Profiles 23 A3.2.1. Variable Milling Powders 23 A3.2.2. Optimized Powders 23 A3.3. Dynamic Kinetics Experiments – Tungsten 24 A3.4. Dynamic Kinetics Experiments – Tungsten-Rhenium 26 A3.5. Finishing Operations on SPSed Samples 30 Subtask A4. Post-SPS treatment 32
Task B. Microstructural and Properties Characterization Subtask B1. Density Measurement 33 B1.1. Density of Tungsten Samples 33 B1.2. Density of Tungsten-Rhenium Samples 35 Subtask B2. Microstructural Characterization of SPSed Samples 38 B2.1. Microstructural Characterization of SPSed tungsten 41 B2.2. Microstructural Characterization of W-Re Alloys 51
B2.1.1. Variable Milling and Temperature Samples 41 B2.1.2. Optimized W-Re Alloy Samples 51
Project No. 09-775
4
Subtask B3. Mechanical Testing 59 B3.1. Hardness of Tungsten Samples 59 B3.2. Hardness of W-Re Samples 64 B3.23. Tensile Testing 65 Task C. Data Analysis and Dissemination 66
3. Technical Summary 67
4. Future Work 68
5. Training/Educational Components 69
6. Acknowledgement 69
7. References 69
8. Appendix 72
1. Technical Background

Project No. 09-775
5
1.1. Tungsten alloys
The use of tungsten in engineering applications dates back many decades. Alloying approaches were used to improve tungsten alloys for the NASA space reactor program. However, with the closure of the program in the 1970s, research in this area was stalled until the development of compact nuclear system (SP-100) in the 1980s as thermal and electrical power sources for certain space and air force missions [1]. These efforts continued on and off for some time. However, recently it has been realized that tungsten alloys possess a number of properties which could be utilized in making ultra high temperature reactors, such as space nuclear propulsion reactors. They are critical for future space missions to the Moon, Mars and beyond as well as many significant terrestrial applications.
The initial days of nuclear thermal propulsion saw the unique advantages of using tungsten over other potential reactor fuel encapsulation materials since it has excellent chemical compatibility with uranium dioxide and uranium mononitride fuels at elevated temperatures [2]. Tungsten has a very high melting temperature (3,683 K) and high elastic modulus (405 GPa). Furthermore, it has high corrosion resistance, high thermal conductivity, high creep resistance, and the lowest vapor pressure of metals. Although alloying of tungsten (body centered cubic or BCC crystal structure) helped increase the high temperature strength, tungsten alloys suffer from the lack of ductility at ambient temperatures. One of the major drawbacks of tungsten has been the relatively high ductile-brittle transition temperature (DBTT) about ~ 573 K; however, the DBTT varies with the sample purity and microstructural state. In this regard, alloying tungsten with rhenium provides particular advantages. Rhenium (hexagonal close packed or HCP structure) itself is a refractory metal with a melting point of 3,453 K and elastic modulus of 460 GPa [1]. Tungsten and rhenium form a single phase solid solution (α-phase) up to ~33 atom% Re at higher temperatures; however, depending on the treatment, limited formation of second phases (sigma or W2Re3, chi or WRe3) are not uncommon. In this form, W retains its high melting temperature and high elastic modulus.
The addition of Re to W showed a marked reduction in the DBTT, and finer grained materials also lead to the desired decrease in the DBTT as shown in Figure 1a [3]. Further, strain rate, purity, surface condition and even environmental condition (such as irradiation) tend to influence DBTT. Hardness values of W-Re alloys of various compositions are shown in Fig. 1b [3]. There exist to specific effects. At lower Re concentrations (5-15 atom%), solid softening effect develops before it starts strengthening the matrix metal at higher concentrations. However, at higher concentrations (25-33 atom%) of Re, improved ductility is achieved through so called ‘rhenium ductilizing effect’ wherein Re causes heavy twinning and an increase in the number of slip planes [3]. It can be noted that although other solutes in Groups VIIa and VIIIa would affect softening in tungsten, only Re has improved ductility. Sufficient amount of Re addition to W alloys also show improved short term tensile strength at higher temperatures [1].

Project No. 09-775
6
(a) (b) Figure 1. Plots of DBTT as a function of average recrystallized grain diameter for pure tungsten and W-24Re/W-26Re (a) and hardness (VHN) as a function of rhenium content (b). Adapted from Klopp [3].
Given all the interesting attributes of tungsten, it is important to devise appropriate fabrication procedure for tungsten and tungsten alloys. Given the high melting temperatures of the constituents, it was impractical to consider conventional solidification processing as the fabrication route. Work in 1960s and 1970s used electron-beam melted and arc-melted materials whose purity was suspect. Even though there is immense interest in producing cermet fuels, there was no prior systematic attempt to devise new processing routes to improve properties and standardize the production of cermet fuels. The powder metallurgy route is a promising option. In this regard, spark plasma sintering offers some distinct advantages. Below a brief technical background on spark plasma sintering (SPS) is given.
1.2. Spark Plasma Sintering
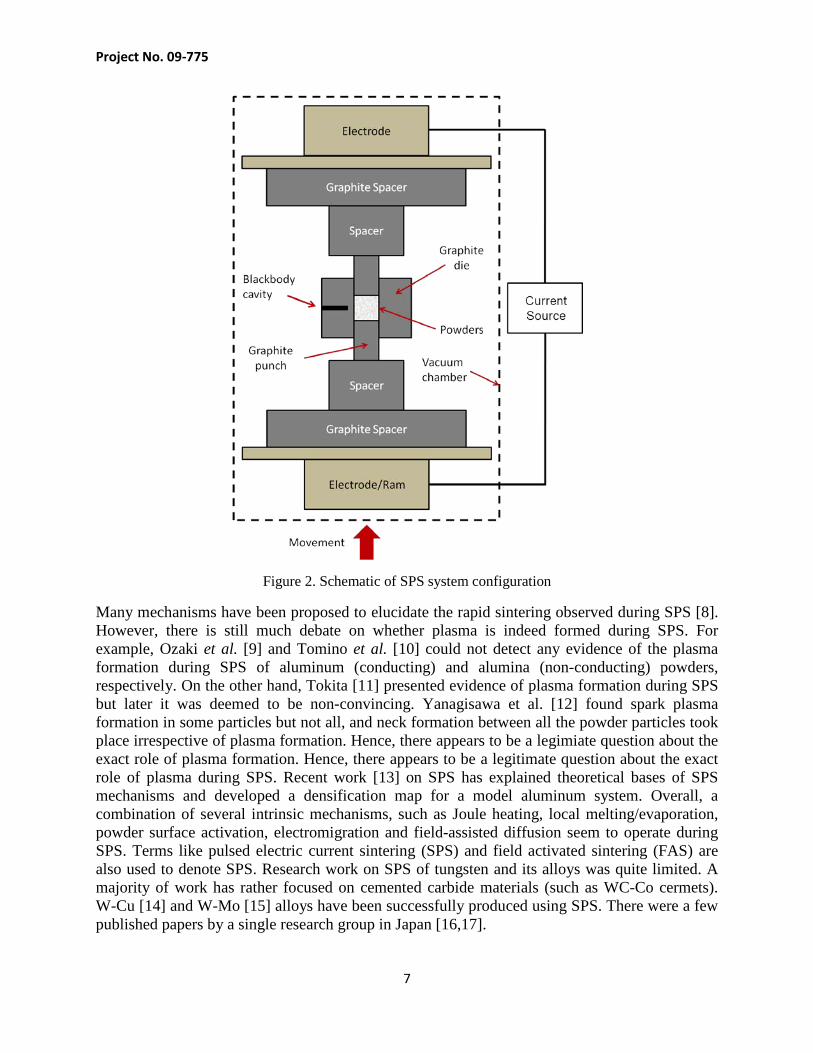
Although the history of activated sintering is quite old, SPS dates back to the 1960s when it was invented and patented by Inoue et al. [4, 5]. Although it was envisioned that the technique would be used for processing of advanced materials, it did not gain much attention during that period. During the 1980s, the patent expired and various companies started manufacturing SPS equipment based on the original technique [6]. Since then, SPS has slowly emerged as a promising powder consolidation technology that makes possible sintering of all forms of conventional powder metals, nano-phase materials, ceramics, composites, polymer-metallic composites, and even high porosity materials. SPS technology does not need separate green compacts or a pre-sintering stage; it is capable of producing near-net shapes directly from powder. A SPS system generally contains a water-cooled chamber vacuum chamber; a schematic of a SPS system is shown in Fig. 2 [7]. The powders are placed in a die (typically made of graphite) and heating is achieved by passing a pulsed DC electric current while applying simultaneous pressure. It has been recognized that the process leads to greater densities and lower sintering temperatures along with resulting benefits of smaller grain size, less segregation to grain boundaries and improvement in mechanical, corrosion/oxidation properties, electrical and magnetic properties [8].
Project No. 09-775
7
Figure 2. Schematic of SPS system configuration
Many mechanisms have been proposed to elucidate the rapid sintering observed during SPS [8]. However, there is still much debate on whether plasma is indeed formed during SPS. For example, Ozaki et al. [9] and Tomino et al. [10] could not detect any evidence of the plasma formation during SPS of aluminum (conducting) and alumina (non-conducting) powders, respectively. On the other hand, Tokita [11] presented evidence of plasma formation during SPS but later it was deemed to be non-convincing. Yanagisawa et al. [12] found spark plasma formation in some particles but not all, and neck formation between all the powder particles took place irrespective of plasma formation. Hence, there appears to be a legimiate question about the exact role of plasma formation. Hence, there appears to be a legitimate question about the exact role of plasma during SPS. Recent work [13] on SPS has explained theoretical bases of SPS mechanisms and developed a densification map for a model aluminum system. Overall, a combination of several intrinsic mechanisms, such as Joule heating, local melting/evaporation, powder surface activation, electromigration and field-assisted diffusion seem to operate during SPS. Terms like pulsed electric current sintering (SPS) and field activated sintering (FAS) are also used to denote SPS. Research work on SPS of tungsten and its alloys was quite limited. A majority of work has rather focused on cemented carbide materials (such as WC-Co cermets). W-Cu [14] and W-Mo [15] alloys have been successfully produced using SPS. There were a few published papers by a single research group in Japan [16,17].

Project No. 09-775
8
2. Research Methods and Results
The University of Idaho (UI) carried out fabrication of tungsten samples via spark plasma sintering, and relevant microstructural and mechanical characterization. Ball milling was not required for the tungsten powder before SPS as the alloying was not the requirement. This work involved optimization of SPS parameters and determining the sintering kinetics. The graduate student also carried out some neutronic calculations (using MCNP-5) pertaining to the use of tungsten and tungsten-rhenium based cermet fuels for fast reactor application. However, those neutronic calculations have been published, only fabrication and characterization results of tungsten and tungsten-rhenium alloys will not be discussed here.
The fabrication part of W-Re alloys was carried out primarily at the Boise State University (BSU). The experimental effort of this study was comprised of two components:
*The first was to establish the effects of the SPS temperature and hold times, along with the ball milling energy on the tungsten-rhenium powders. This was accomplished by mixing one set of W-25 at% Re powders and varying the temperature and dwell time during SPS. A second set of powders (of the same composition) were ball milled with increasing rotational energy and the resulting powders sintered at one temperature with varying dwell times. The density, grain size, σ-phase content, and hardness values of both sets of consolidated samples were evaluated using SEM/BSE, TEM, XRD, EBSD (for microstructural characterization), and Archimedes method (density measurement). *The second experimental component consisted of using parameters determined from the first set that result in little to no σ-phase, high density (i.e. less porosity), fine grain size, along with minimized contamination. These processing parameters were used to fabricate alloy samples with rhenium compositions ranging from 0 to 25 at%. Microstructural evaluation of these samples was conducted using characterization techniques similar to the first set.
Here a summary of the optimization procedure is given below. Specific details will be given in the latter sections:
SPS Temperature and Dwell Time: The variation of SPS temperature on the W-25 at% Re samples showed that:
• High densities were achieved regardless of temperature • Grain growth dramatically increased when sintered at 1900°C • σ-phase content substantially decreased at 1900°C while the decrease for 1500°C and
1700°C was not as large • The attrition rate for the graphite punches was much higher for the 1900°C samples as the
current densities needed to achieve that hold temperature typically caused the punches to deform
Given this information, the ideal temperature for the optimized samples was chosen to be 1800°C. This was a desired balance of the higher dissolution rates seen at >1700°C but a lower degree of grain growth seen in the 1900°C samples. Also, previous experience had shown that the current densities typically required to reach an 1800°C hold temperature resulted in significantly less damage to the graphite punches. The AXF-5Q punches would routinely hold up without chipping or buckling even with hold times as long as 60 minutes.
Project No. 09-775
9
The sintering dwell times showed that:
• other than the 10 minute dwell for the 1500°C temperature, densification did not increase with longer dwell times
• most σ-phase dissolution occurred within the first 20 minutes • grain growth was non-linear with most growth occurring within the first 10-20 minutes
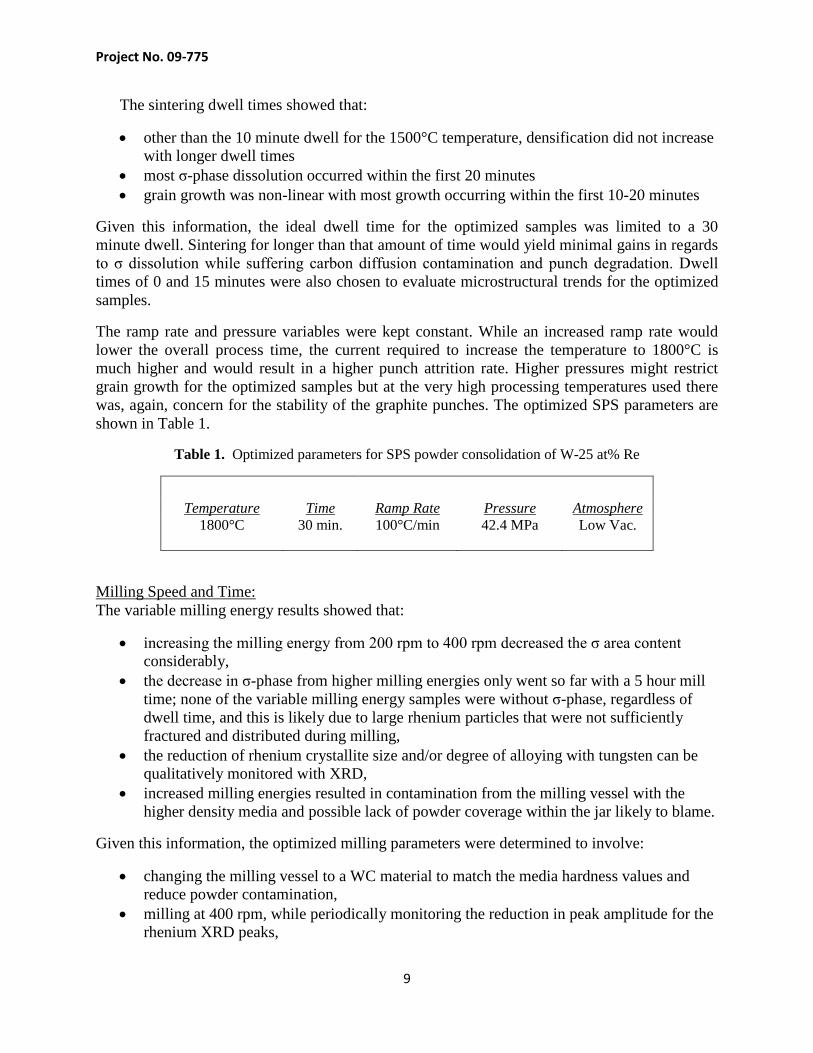
Given this information, the ideal dwell time for the optimized samples was limited to a 30 minute dwell. Sintering for longer than that amount of time would yield minimal gains in regards to σ dissolution while suffering carbon diffusion contamination and punch degradation. Dwell times of 0 and 15 minutes were also chosen to evaluate microstructural trends for the optimized samples.
The ramp rate and pressure variables were kept constant. While an increased ramp rate would lower the overall process time, the current required to increase the temperature to 1800°C is much higher and would result in a higher punch attrition rate. Higher pressures might restrict grain growth for the optimized samples but at the very high processing temperatures used there was, again, concern for the stability of the graphite punches. The optimized SPS parameters are shown in Table 1.
Table 1. Optimized parameters for SPS powder consolidation of W-25 at% Re
Temperature Time Ramp Rate Pressure Atmosphere 1800°C
30 min.
100°C/min
42.4 MPa
Low Vac.
Milling Speed and Time: The variable milling energy results showed that:
• increasing the milling energy from 200 rpm to 400 rpm decreased the σ area content considerably,
• the decrease in σ-phase from higher milling energies only went so far with a 5 hour mill time; none of the variable milling energy samples were without σ-phase, regardless of dwell time, and this is likely due to large rhenium particles that were not sufficiently fractured and distributed during milling,
• the reduction of rhenium crystallite size and/or degree of alloying with tungsten can be qualitatively monitored with XRD,
• increased milling energies resulted in contamination from the milling vessel with the higher density media and possible lack of powder coverage within the jar likely to blame.
Given this information, the optimized milling parameters were determined to involve:
• changing the milling vessel to a WC material to match the media hardness values and reduce powder contamination,
• milling at 400 rpm, while periodically monitoring the reduction in peak amplitude for the rhenium XRD peaks,

Project No. 09-775
10
• using a higher powder charge which would likely better shield the vessel walls from the impacting media. The powder will also be periodically scraped and dislodged between milling intervals to ensure that areas that receive fewer impacts from the media (such as the region where the lid and jar join) are properly milled.
These optimized milling parameters are more qualitative than those determined for the SPS parameters, particularly the milling time. The monitoring of the rhenium peaks during milling is a balance of σ-phase dissolution and contamination effects. While a complete removal of the 100% rhenium peak would be an indicator favorable to minimal σ-phase content, the milling contamination may be unacceptable. The ideal approach is to evaluate the peaks, and when an agreeable peak amplitude is achieved, sinter the milled W-25 at% Re powders using the SPS optimized parameters. If σ has not dissolved, longer milling is required. For these optimized parameters, preliminary milling of W-25 at% Re was found to be eliminated with 30 hours of milling (25 effective hours given the 5:1 duty cycle used). The optimized ball milling parameters are shown in Table 1.
Table 2. Optimized parameters for high-energy ball milling process of W-25 at% Re
Speed Time Vessel type Powder Mass Charge 400 rpm
30 hrs
WC-6Co
60.0 g
3.89
Task A: Processing and Fabrication of W-Re alloys
Subtask A1: Procurement and Fabrication of W and W-Re alloys Tungsten (99.99% pure) and rhenium (99.999% pure) powders were purchased from Buffalo Tungsten, Inc. (Depew, NY) and Rhenium Alloys, Inc. (Elyria, OH), respectively. According to Buffalo Tungsten, the average powder size was 0.65 μm. While Rhenium Alloys, Inc. provided a particle size distribution, Buffalo Tungsten did not. To characterize the particle size distribution of the tungsten powders, the diameters of 500 particles were measured from SEM images. The SEM analysis revealed that the tungsten powders form polygonal aggregates while the rhenium powders were more rounded and ligamental. The rhenium was also seen to aggregate together to a much higher degree than the tungsten powders and to be much larger in size. The structure and morphologies of the two powder types can be seen in Figure 3.
Figure 3. SEM images of the as received Buffalo tungsten powder feed stock (left) and b) rhenium powder (right)
Project No. 09-775
11
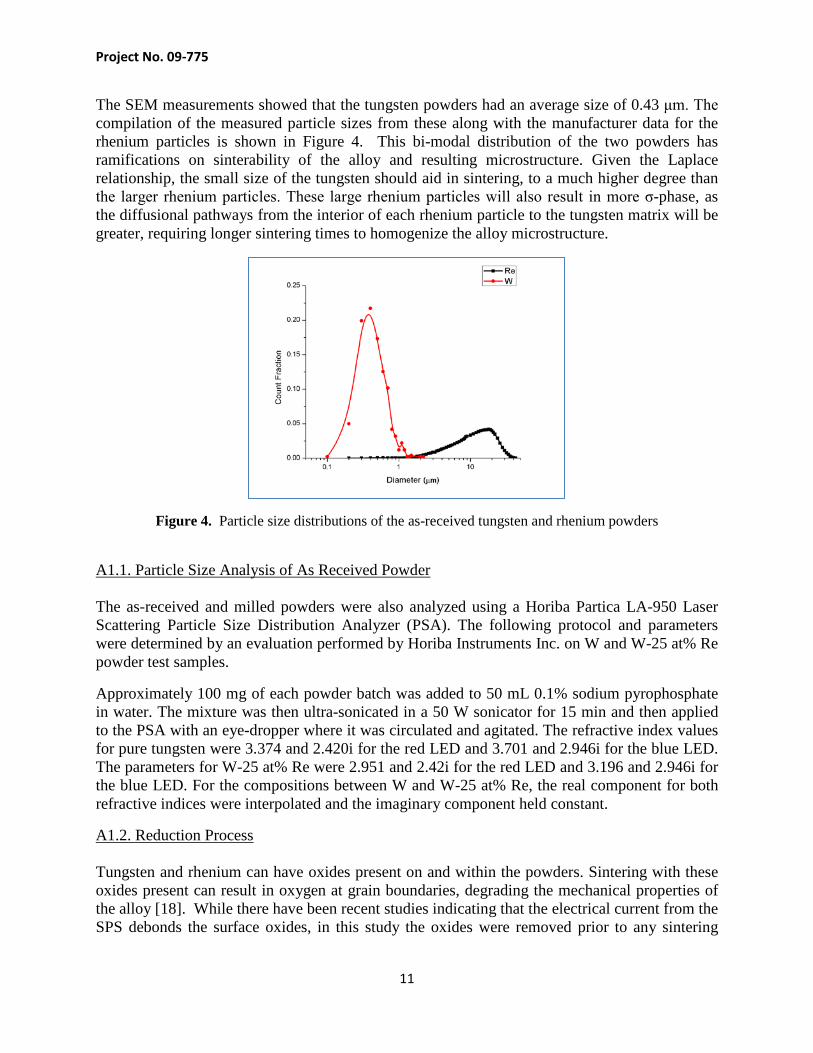
The SEM measurements showed that the tungsten powders had an average size of 0.43 μm. The compilation of the measured particle sizes from these along with the manufacturer data for the rhenium particles is shown in Figure 4. This bi-modal distribution of the two powders has ramifications on sinterability of the alloy and resulting microstructure. Given the Laplace relationship, the small size of the tungsten should aid in sintering, to a much higher degree than the larger rhenium particles. These large rhenium particles will also result in more σ-phase, as the diffusional pathways from the interior of each rhenium particle to the tungsten matrix will be greater, requiring longer sintering times to homogenize the alloy microstructure.
Figure 4. Particle size distributions of the as-received tungsten and rhenium powders
A1.1. Particle Size Analysis of As Received Powder The as-received and milled powders were also analyzed using a Horiba Partica LA-950 Laser Scattering Particle Size Distribution Analyzer (PSA). The following protocol and parameters were determined by an evaluation performed by Horiba Instruments Inc. on W and W-25 at% Re powder test samples.
Approximately 100 mg of each powder batch was added to 50 mL 0.1% sodium pyrophosphate in water. The mixture was then ultra-sonicated in a 50 W sonicator for 15 min and then applied to the PSA with an eye-dropper where it was circulated and agitated. The refractive index values for pure tungsten were 3.374 and 2.420i for the red LED and 3.701 and 2.946i for the blue LED. The parameters for W-25 at% Re were 2.951 and 2.42i for the red LED and 3.196 and 2.946i for the blue LED. For the compositions between W and W-25 at% Re, the real component for both refractive indices were interpolated and the imaginary component held constant.
A1.2. Reduction Process Tungsten and rhenium can have oxides present on and within the powders. Sintering with these oxides present can result in oxygen at grain boundaries, degrading the mechanical properties of the alloy [18]. While there have been recent studies indicating that the electrical current from the SPS debonds the surface oxides, in this study the oxides were removed prior to any sintering
Project No. 09-775
12
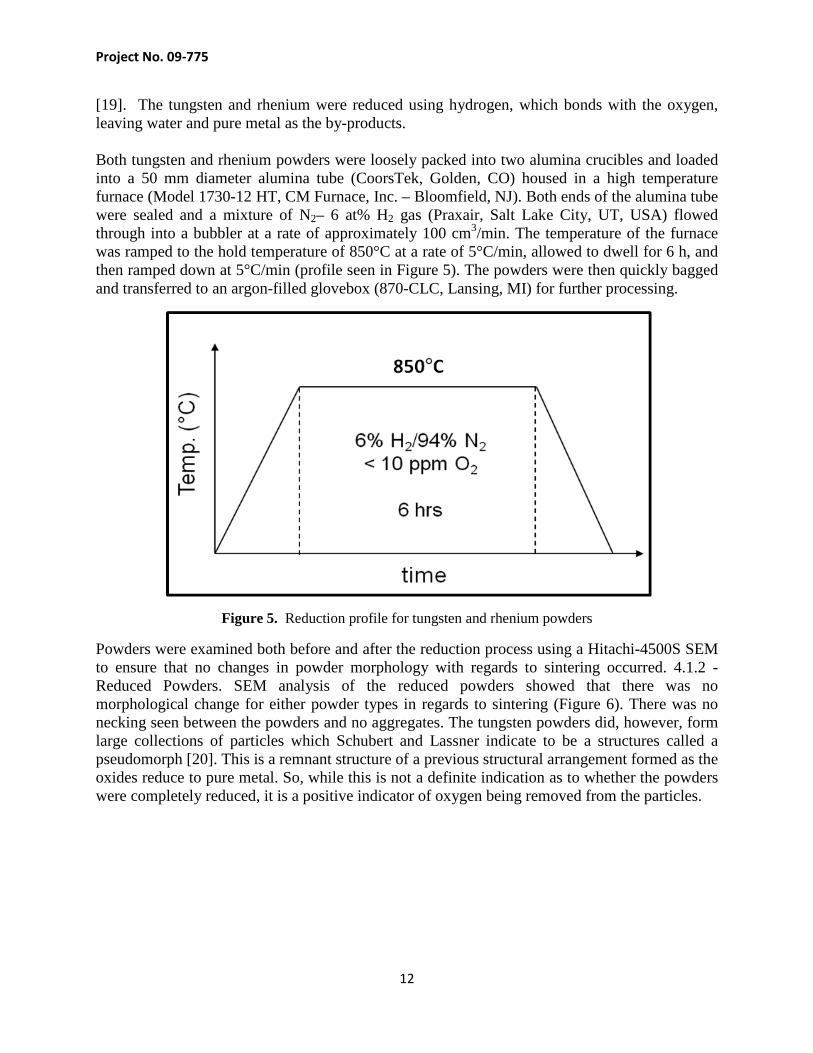
[19]. The tungsten and rhenium were reduced using hydrogen, which bonds with the oxygen, leaving water and pure metal as the by-products. Both tungsten and rhenium powders were loosely packed into two alumina crucibles and loaded into a 50 mm diameter alumina tube (CoorsTek, Golden, CO) housed in a high temperature furnace (Model 1730-12 HT, CM Furnace, Inc. – Bloomfield, NJ). Both ends of the alumina tube were sealed and a mixture of N2– 6 at% H2 gas (Praxair, Salt Lake City, UT, USA) flowed through into a bubbler at a rate of approximately 100 cm3/min. The temperature of the furnace was ramped to the hold temperature of 850°C at a rate of 5°C/min, allowed to dwell for 6 h, and then ramped down at 5°C/min (profile seen in Figure 5). The powders were then quickly bagged and transferred to an argon-filled glovebox (870-CLC, Lansing, MI) for further processing.
Figure 5. Reduction profile for tungsten and rhenium powders
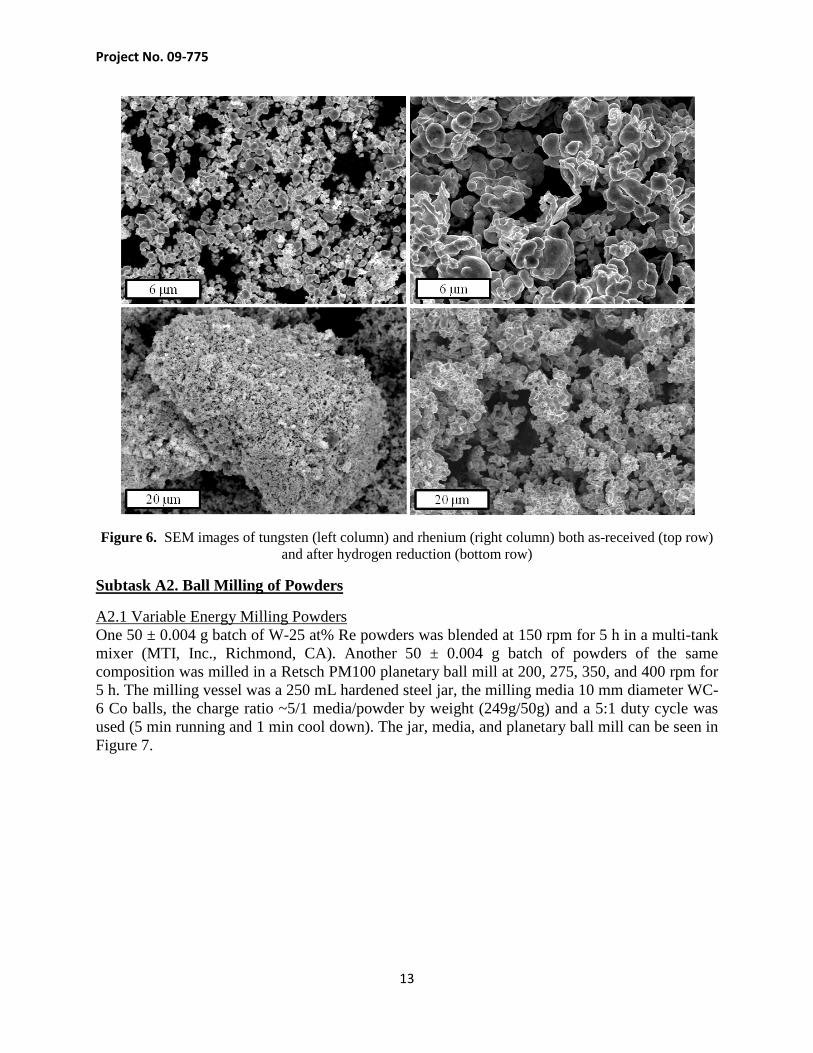
Powders were examined both before and after the reduction process using a Hitachi-4500S SEM to ensure that no changes in powder morphology with regards to sintering occurred. 4.1.2 - Reduced Powders. SEM analysis of the reduced powders showed that there was no morphological change for either powder types in regards to sintering (Figure 6). There was no necking seen between the powders and no aggregates. The tungsten powders did, however, form large collections of particles which Schubert and Lassner indicate to be a structures called a pseudomorph [20]. This is a remnant structure of a previous structural arrangement formed as the oxides reduce to pure metal. So, while this is not a definite indication as to whether the powders were completely reduced, it is a positive indicator of oxygen being removed from the particles.
Project No. 09-775
13
Figure 6. SEM images of tungsten (left column) and rhenium (right column) both as-received (top row) and after hydrogen reduction (bottom row)
Subtask A2. Ball Milling of Powders
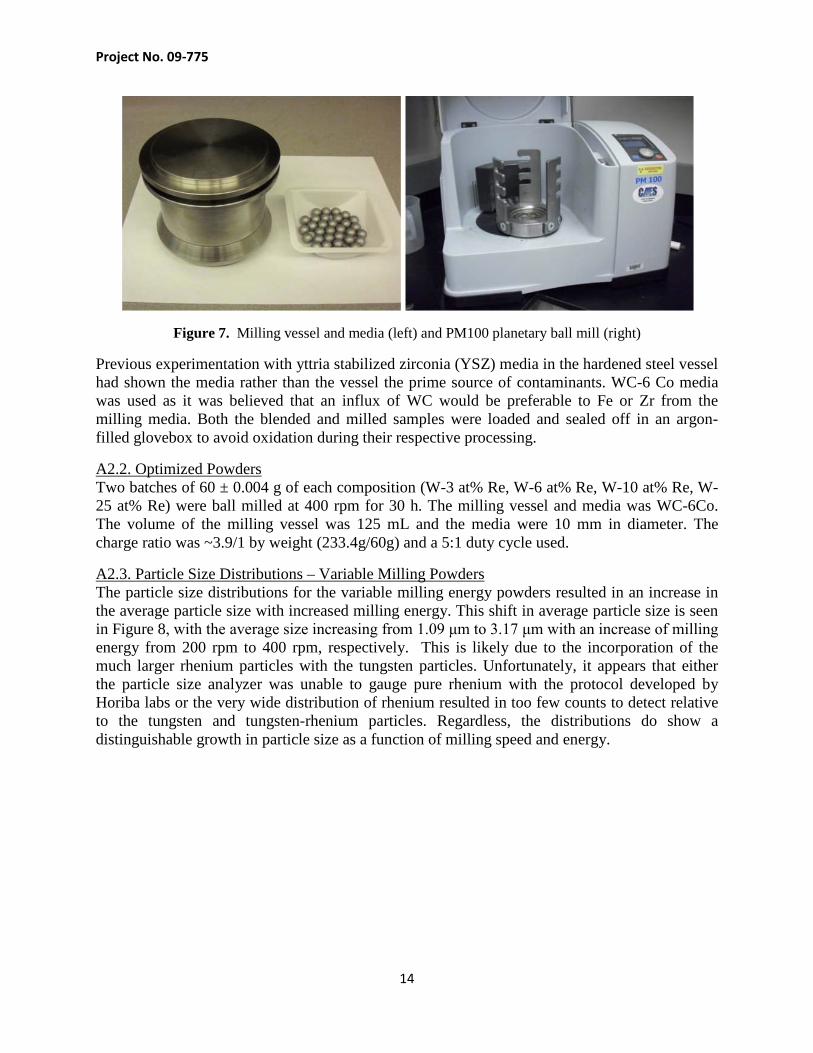
A2.1 Variable Energy Milling Powders One 50 ± 0.004 g batch of W-25 at% Re powders was blended at 150 rpm for 5 h in a multi-tank mixer (MTI, Inc., Richmond, CA). Another 50 ± 0.004 g batch of powders of the same composition was milled in a Retsch PM100 planetary ball mill at 200, 275, 350, and 400 rpm for 5 h. The milling vessel was a 250 mL hardened steel jar, the milling media 10 mm diameter WC-6 Co balls, the charge ratio ~5/1 media/powder by weight (249g/50g) and a 5:1 duty cycle was used (5 min running and 1 min cool down). The jar, media, and planetary ball mill can be seen in Figure 7.
Project No. 09-775
14
Figure 7. Milling vessel and media (left) and PM100 planetary ball mill (right)
Previous experimentation with yttria stabilized zirconia (YSZ) media in the hardened steel vessel had shown the media rather than the vessel the prime source of contaminants. WC-6 Co media was used as it was believed that an influx of WC would be preferable to Fe or Zr from the milling media. Both the blended and milled samples were loaded and sealed off in an argon-filled glovebox to avoid oxidation during their respective processing.
A2.2. Optimized Powders Two batches of 60 ± 0.004 g of each composition (W-3 at% Re, W-6 at% Re, W-10 at% Re, W-25 at% Re) were ball milled at 400 rpm for 30 h. The milling vessel and media was WC-6Co. The volume of the milling vessel was 125 mL and the media were 10 mm in diameter. The charge ratio was ~3.9/1 by weight (233.4g/60g) and a 5:1 duty cycle used.
A2.3. Particle Size Distributions – Variable Milling Powders The particle size distributions for the variable milling energy powders resulted in an increase in the average particle size with increased milling energy. This shift in average particle size is seen in Figure 8, with the average size increasing from 1.09 μm to 3.17 μm with an increase of milling energy from 200 rpm to 400 rpm, respectively. This is likely due to the incorporation of the much larger rhenium particles with the tungsten particles. Unfortunately, it appears that either the particle size analyzer was unable to gauge pure rhenium with the protocol developed by Horiba labs or the very wide distribution of rhenium resulted in too few counts to detect relative to the tungsten and tungsten-rhenium particles. Regardless, the distributions do show a distinguishable growth in particle size as a function of milling speed and energy.

Project No. 09-775
15
Figure 8. Particle size distributions for the W-25 at% Re powders milled with variable speeds
The tungsten-rhenium powders milled at 400 rpm are compared to the as-received powders in Figure 9. The differences in the distributions constitute a signifigant alteration in the tungsten and, more importantly, the rhenium average powder sizes.
Figure 9. Particle size distributions for the as-received tungsten, rhenium along with the W-25 at% Re milled at 400 rpm
Project No. 09-775
16
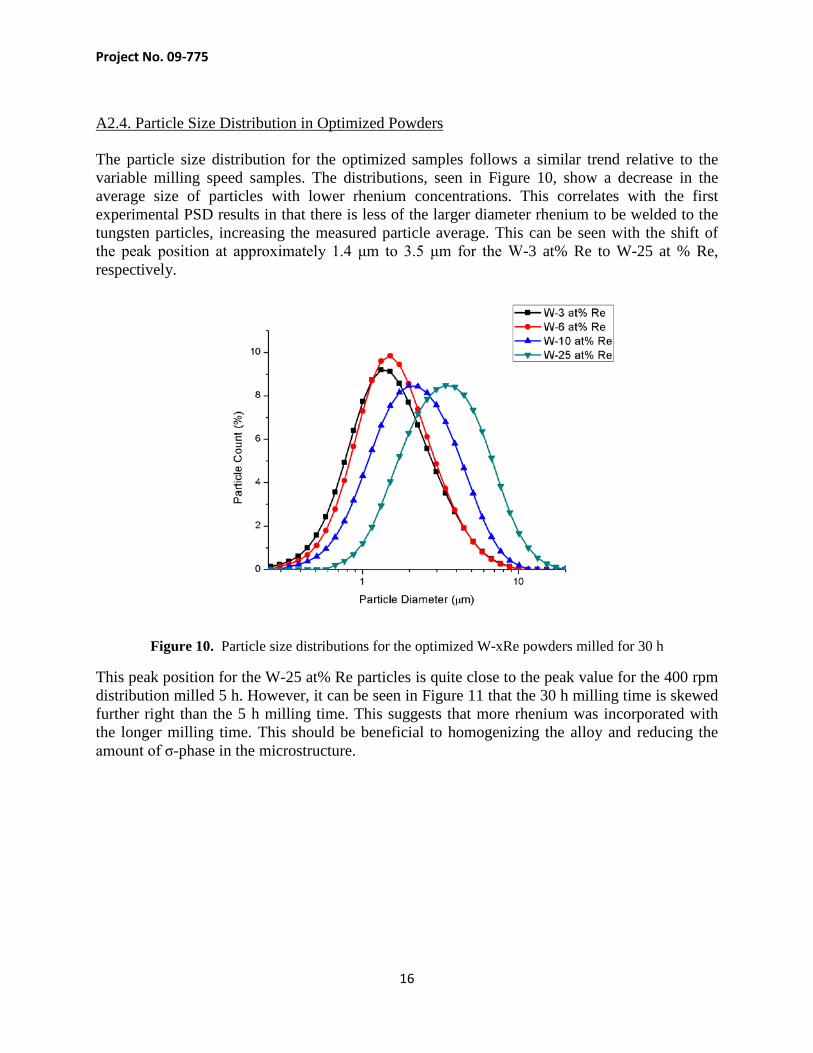
A2.4. Particle Size Distribution in Optimized Powders The particle size distribution for the optimized samples follows a similar trend relative to the variable milling speed samples. The distributions, seen in Figure 10, show a decrease in the average size of particles with lower rhenium concentrations. This correlates with the first experimental PSD results in that there is less of the larger diameter rhenium to be welded to the tungsten particles, increasing the measured particle average. This can be seen with the shift of the peak position at approximately 1.4 μm to 3.5 μm for the W-3 at% Re to W-25 at % Re, respectively.
Figure 10. Particle size distributions for the optimized W-xRe powders milled for 30 h
This peak position for the W-25 at% Re particles is quite close to the peak value for the 400 rpm distribution milled 5 h. However, it can be seen in Figure 11 that the 30 h milling time is skewed further right than the 5 h milling time. This suggests that more rhenium was incorporated with the longer milling time. This should be beneficial to homogenizing the alloy and reducing the amount of σ-phase in the microstructure.

Project No. 09-775
17
Figure 11. Comparison of particle size distributions for W-25 at% Re milled 5 hrs and 30 hrs
A2.5. SEM Analysis of Milled and Blended Powders The SEM micrographs illustrate that there is little change in the morphology of the blended powders when compared to the as-received tungsten and rhenium powders. The blending process was low energy and only intended to uniformly mix the two powder types, not change their shape or particle size. The interspersed powders can be seen in Figure 11.
Figure 11. SEM image of blended W-25 at% Re powders
There was, however, a significant change in the morphology of the milled samples. Figure 12 shows that there is disparity in particle sizes for the 200 rpm batch. The disparity appears to shrink with higher milling energies; until at 400 rpm, the particles seem more homogeneous in size and the general morphology of the particles becomes more rounded in shape. This increase in particle size agrees with the changes seen in the particle size distributions.

Project No. 09-775
18
Figure 12. SEM images of W-25 at% Re powders ball milled at 200 rpm to 400 rpm
A2.6. SEM Analysis of Optimized Powders The SEM characterization seen in Figure 13 shows a consistent, rounded morphology of the powders. The average size of the powders also appeared to decrease with lower rhenium concentrations in the other compositional sets. The particle size analysis confirmed this, showing that milling with less rhenium decreased the mean size of the milled powders. The higher rhenium content powders were also seen to be more homogeneous in size with a more rounded morphology.
The milled powders were imaged conventionally with SEM and with secondary and backscatter detection. A large portion of the powders appear to be crystallites embedded in larger particles as can be seen in the SEM image in the top left of Figure 59. However, a significant number of particles exhibited the layering effect seen in literature for a brittle/ductile system. Both the embedded and layered powder types would be expected to enhance the homogenization in the alloy as there would be more diffusion channels from crystalline deformation and by decreasing the diffusional pathway from the center of a rhenium crystal to its surrounding tungsten matrix.

Project No. 09-775
19
Figure 13. SEM images of the optimized W-xRe powders
Figure 14. SEM images of optimized W-25 at% Re powders milled 30 hours showing embedded combinations (top left) and layered powders (remaining images)
Project No. 09-775
20
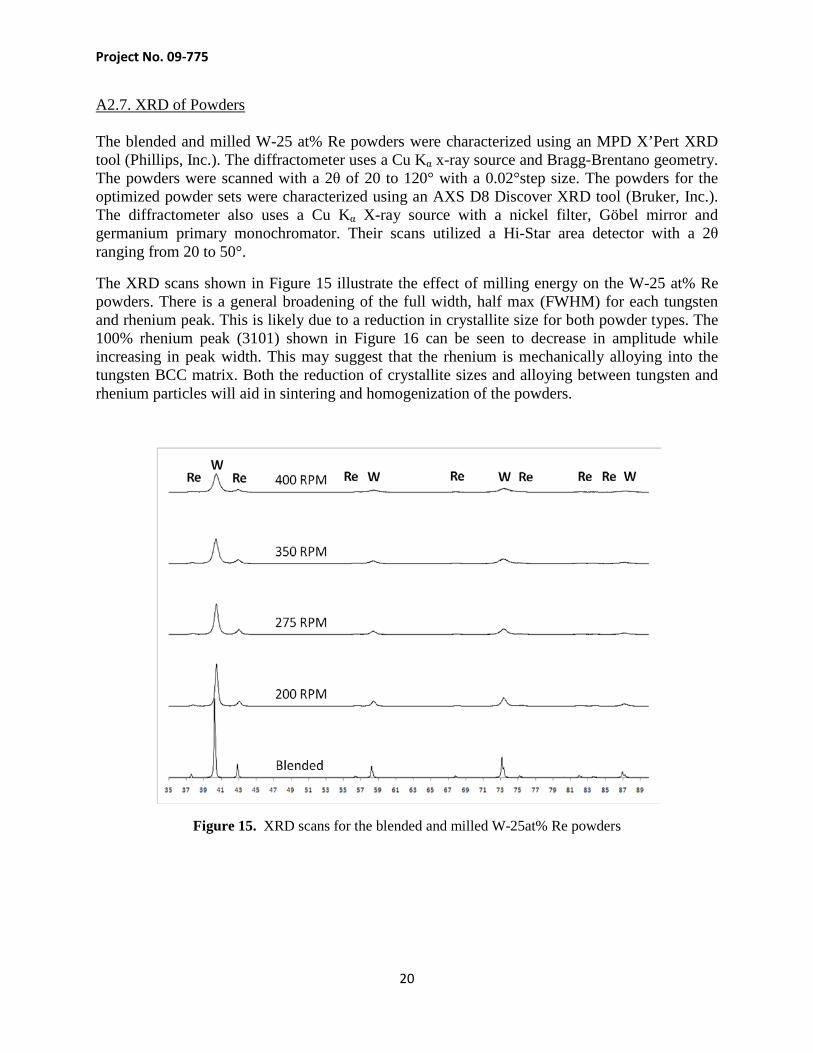
A2.7. XRD of Powders The blended and milled W-25 at% Re powders were characterized using an MPD X’Pert XRD tool (Phillips, Inc.). The diffractometer uses a Cu Kα x-ray source and Bragg-Brentano geometry. The powders were scanned with a 2θ of 20 to 120° with a 0.02°step size. The powders for the optimized powder sets were characterized using an AXS D8 Discover XRD tool (Bruker, Inc.). The diffractometer also uses a Cu Kα X-ray source with a nickel filter, Göbel mirror and germanium primary monochromator. Their scans utilized a Hi-Star area detector with a 2θ ranging from 20 to 50°.
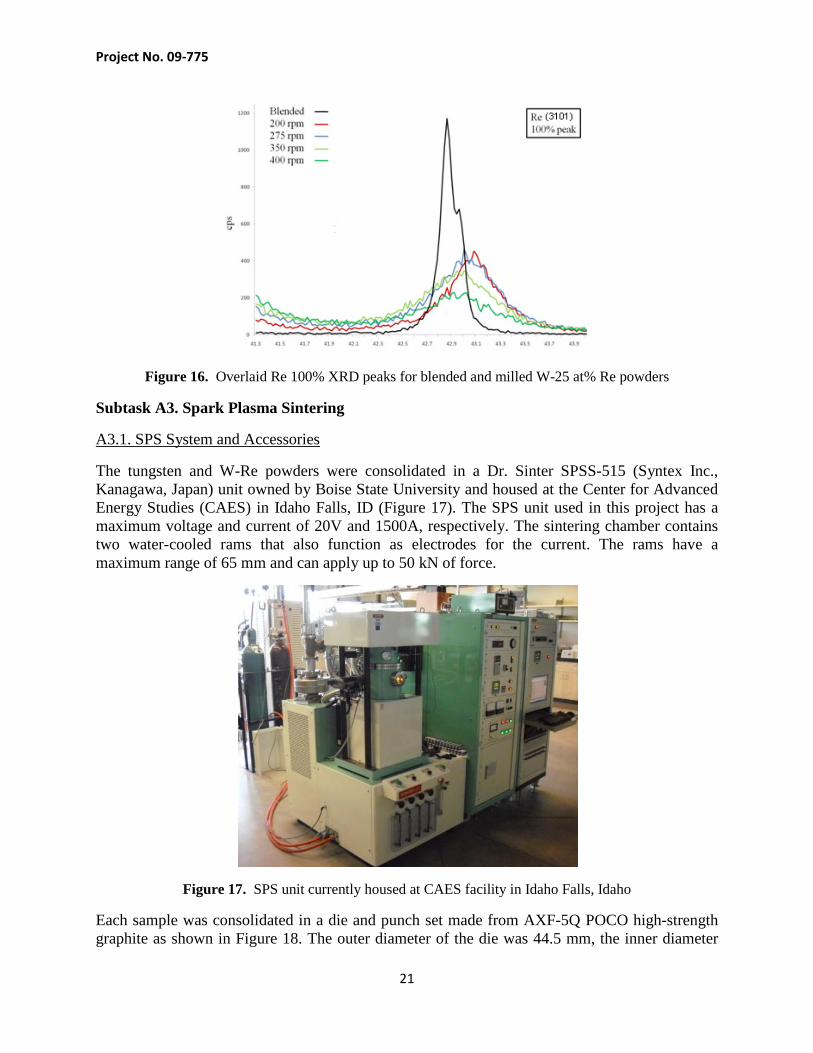
The XRD scans shown in Figure 15 illustrate the effect of milling energy on the W-25 at% Re powders. There is a general broadening of the full width, half max (FWHM) for each tungsten and rhenium peak. This is likely due to a reduction in crystallite size for both powder types. The 100% rhenium peak (3101) shown in Figure 16 can be seen to decrease in amplitude while increasing in peak width. This may suggest that the rhenium is mechanically alloying into the tungsten BCC matrix. Both the reduction of crystallite sizes and alloying between tungsten and rhenium particles will aid in sintering and homogenization of the powders.
Figure 15. XRD scans for the blended and milled W-25at% Re powders
Project No. 09-775
21
Figure 16. Overlaid Re 100% XRD peaks for blended and milled W-25 at% Re powders
Subtask A3. Spark Plasma Sintering
A3.1. SPS System and Accessories
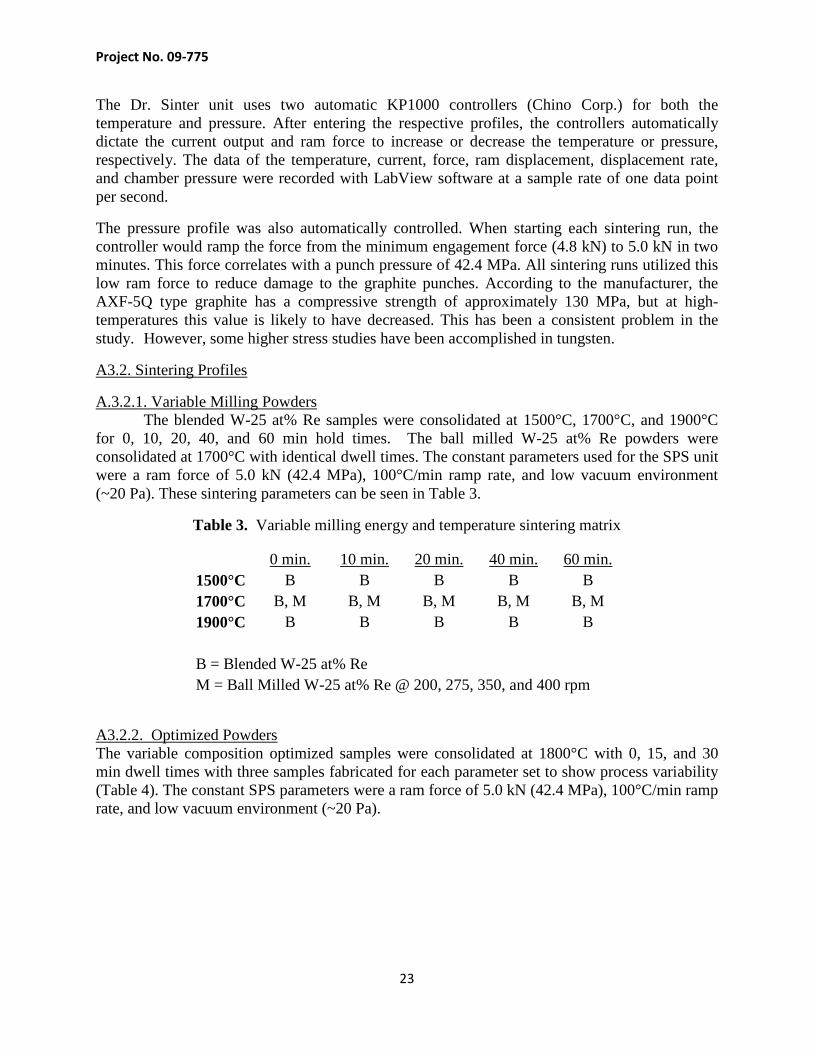
The tungsten and W-Re powders were consolidated in a Dr. Sinter SPSS-515 (Syntex Inc., Kanagawa, Japan) unit owned by Boise State University and housed at the Center for Advanced Energy Studies (CAES) in Idaho Falls, ID (Figure 17). The SPS unit used in this project has a maximum voltage and current of 20V and 1500A, respectively. The sintering chamber contains two water-cooled rams that also function as electrodes for the current. The rams have a maximum range of 65 mm and can apply up to 50 kN of force.
Figure 17. SPS unit currently housed at CAES facility in Idaho Falls, Idaho
Each sample was consolidated in a die and punch set made from AXF-5Q POCO high-strength graphite as shown in Figure 18. The outer diameter of the die was 44.5 mm, the inner diameter

Project No. 09-775
22
12.7 mm, and the height 30 mm. The die used two punches which had diameters of 12 mm, were 20 mm in length, and were fabricated from the same type of POCO graphite. Each die had a 1.6 mm bore that extended 11.2 mm in from the external surface. This bore was used as the target for the pyrometer and acted as a blackbody radiation source. A portable radiation thermometer (Chino IR-AHS) viewed the bore through a quartz window in the side of the SPS chamber.
Figure 18. Photograph of two graphite punches, die, tungsten powders and resulting pellet
For each sample, the interior of the die was lined with high-purity graphite foil to prevent inter-diffusion between the powders and the carbon in the die. This resulted in a foil encapsulation that required significant grinding to remove, though without the foil the pellet could not be removed without breaking the die. For each sample, a 12 mm graphite foil disk was placed on top of the bottom punch and 8.0 ± 0.02 g were poured into the die. Another 12 mm graphite foil disk was placed on top of the powders and the top punch inserted. The graphite die was then covered with a 4 mm thick carbon felt insulation to minimize heat loss and the thermal gradient from the center of the punches to the edge of the die. Two circular layers of felt were also applied to the top and bottom of the die, with 12 mm holes cut out to allow punch access.
After the die is loaded with powders and the punches inserted, the die set is placed in the SPS chamber. Each electrode has two cylindrical graphite separators; a 25.4 mm thick, 38.1 mm diameter cylinder on top of a 12.7 mm thick, 101.6 mm diameter cylinder. These separators protect the electrodes from both the high temperatures and force from the punch. The die is balanced on the top separator with the bore directed toward the pyrometer. Two complementary separators were then balanced on the top punch to protect the top electrode. The bottom ram was then raised, compressing the punches into the die. The pyrometer is then aligned and the chamber closed. For each sintering run, the chamber was evacuated and purged three times using a rough pump and argon supply. After the last purge cycle, a booster pump engages which typically decreases the pressure to 20-30 Pa (2 – 3×10⁻⁴ torr).
Project No. 09-775
23
The Dr. Sinter unit uses two automatic KP1000 controllers (Chino Corp.) for both the temperature and pressure. After entering the respective profiles, the controllers automatically dictate the current output and ram force to increase or decrease the temperature or pressure, respectively. The data of the temperature, current, force, ram displacement, displacement rate, and chamber pressure were recorded with LabView software at a sample rate of one data point per second.
The pressure profile was also automatically controlled. When starting each sintering run, the controller would ramp the force from the minimum engagement force (4.8 kN) to 5.0 kN in two minutes. This force correlates with a punch pressure of 42.4 MPa. All sintering runs utilized this low ram force to reduce damage to the graphite punches. According to the manufacturer, the AXF-5Q type graphite has a compressive strength of approximately 130 MPa, but at high-temperatures this value is likely to have decreased. This has been a consistent problem in the study. However, some higher stress studies have been accomplished in tungsten.
A3.2. Sintering Profiles
A.3.2.1. Variable Milling Powders The blended W-25 at% Re samples were consolidated at 1500°C, 1700°C, and 1900°C
for 0, 10, 20, 40, and 60 min hold times. The ball milled W-25 at% Re powders were consolidated at 1700°C with identical dwell times. The constant parameters used for the SPS unit were a ram force of 5.0 kN (42.4 MPa), 100°C/min ramp rate, and low vacuum environment (~20 Pa). These sintering parameters can be seen in Table 3.
Table 3. Variable milling energy and temperature sintering matrix
0 min. 10 min. 20 min. 40 min. 60 min.
1500°C B B B B B 1700°C B, M B, M B, M B, M B, M 1900°C B B B B B
B = Blended W-25 at% Re M = Ball Milled W-25 at% Re @ 200, 275, 350, and 400 rpm
A3.2.2. Optimized Powders The variable composition optimized samples were consolidated at 1800°C with 0, 15, and 30 min dwell times with three samples fabricated for each parameter set to show process variability (Table 4). The constant SPS parameters were a ram force of 5.0 kN (42.4 MPa), 100°C/min ramp rate, and low vacuum environment (~20 Pa).

Project No. 09-775
24
Table 4. Optimized sample sintering matrix with each condition processed 3 times
0 min. 15 min 30 min W-3 at% Re x 3 x 3 x 3 W-6 at% Re x 3 x 3 x 3 W-10 at% Re x 3 x 3 x 3 W-25 at% Re x 3 x 3 x 3
The optical pyrometer has a minimum temperature limit of 570°C, so for each sintering run the controller would slowly increase the current until the die temperature was above the minimum. The current would drop, allowing the temperature to return to a programmed hold temperature of 600°C. After stabilizing for 2 min, the current would ramp back up such that the temperature ramp rate would be 100°C/min, which would be maintained until reaching the hold temperature. At the end of the hold time, the current would shut off and the die set would quickly cool to room temperature, which would typically take around 15-20 min. The current and corresponding temperature measurement for a typical processing run is shown in Figure 19.
Figure 19. Typical temperature and current profiles
One of the data recorded by the SPS is the ram displacement as each sample is consolidated. The rate and degree of displacement can provide clues with regards to dominant mechanisms, densification rates, packing efficiency, etc. The displacements for the blended W-25 at% Re samples are seen in Figure 17.
A3.3. Dynamic Kinetics Experiments – Tungsten Two subsets of dynamic kinetics experiments were carried out on tungsten powder to determine the mechanisms responsible for rapid sintering under SPS conditions. The first set of experiments involved the consolidation of 4 specimens each containing 10 g of tungsten powder under the influence of a 40 MPa applied stress. The specimens were sintered in the Dr. Sinter
Project No. 09-775
25
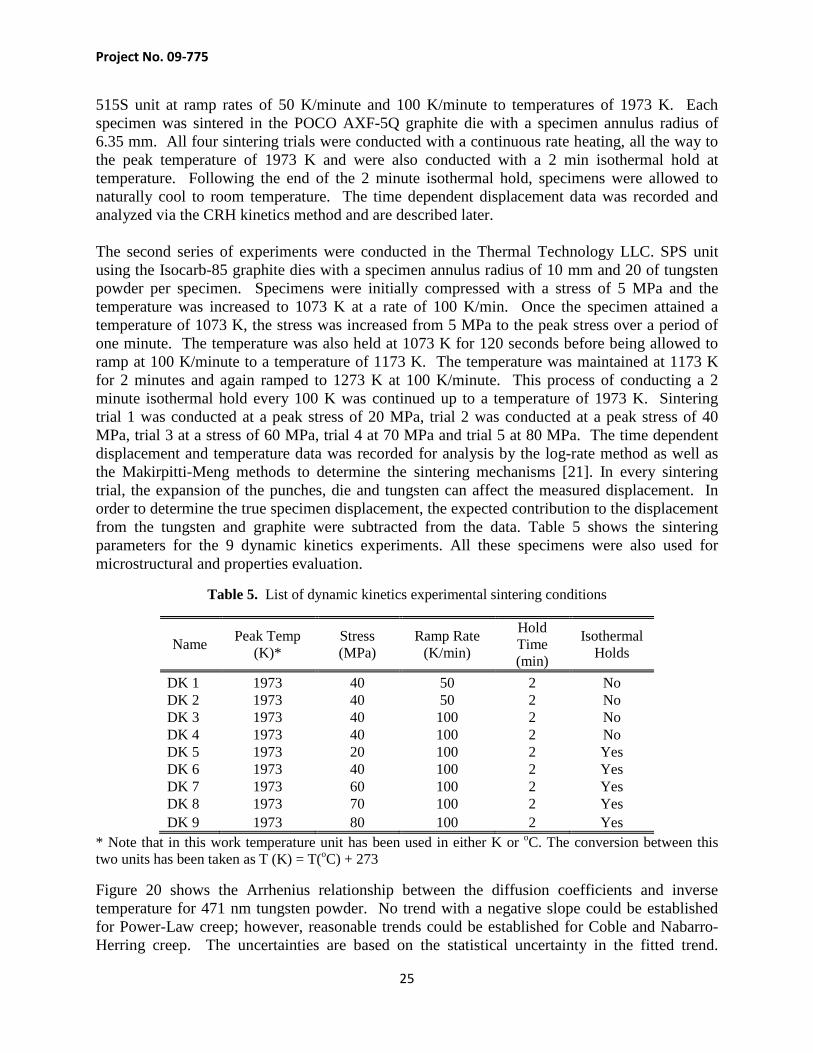
515S unit at ramp rates of 50 K/minute and 100 K/minute to temperatures of 1973 K. Each specimen was sintered in the POCO AXF-5Q graphite die with a specimen annulus radius of 6.35 mm. All four sintering trials were conducted with a continuous rate heating, all the way to the peak temperature of 1973 K and were also conducted with a 2 min isothermal hold at temperature. Following the end of the 2 minute isothermal hold, specimens were allowed to naturally cool to room temperature. The time dependent displacement data was recorded and analyzed via the CRH kinetics method and are described later. The second series of experiments were conducted in the Thermal Technology LLC. SPS unit using the Isocarb-85 graphite dies with a specimen annulus radius of 10 mm and 20 of tungsten powder per specimen. Specimens were initially compressed with a stress of 5 MPa and the temperature was increased to 1073 K at a rate of 100 K/min. Once the specimen attained a temperature of 1073 K, the stress was increased from 5 MPa to the peak stress over a period of one minute. The temperature was also held at 1073 K for 120 seconds before being allowed to ramp at 100 K/minute to a temperature of 1173 K. The temperature was maintained at 1173 K for 2 minutes and again ramped to 1273 K at 100 K/minute. This process of conducting a 2 minute isothermal hold every 100 K was continued up to a temperature of 1973 K. Sintering trial 1 was conducted at a peak stress of 20 MPa, trial 2 was conducted at a peak stress of 40 MPa, trial 3 at a stress of 60 MPa, trial 4 at 70 MPa and trial 5 at 80 MPa. The time dependent displacement and temperature data was recorded for analysis by the log-rate method as well as the Makirpitti-Meng methods to determine the sintering mechanisms [21]. In every sintering trial, the expansion of the punches, die and tungsten can affect the measured displacement. In order to determine the true specimen displacement, the expected contribution to the displacement from the tungsten and graphite were subtracted from the data. Table 5 shows the sintering parameters for the 9 dynamic kinetics experiments. All these specimens were also used for microstructural and properties evaluation.
Table 5. List of dynamic kinetics experimental sintering conditions
Name Peak Temp (K)*
Stress (MPa)
Ramp Rate (K/min)
Hold Time (min)
Isothermal Holds
DK 1 1973 40 50 2 No DK 2 1973 40 50 2 No DK 3 1973 40 100 2 No DK 4 1973 40 100 2 No DK 5 1973 20 100 2 Yes DK 6 1973 40 100 2 Yes DK 7 1973 60 100 2 Yes DK 8 1973 70 100 2 Yes DK 9 1973 80 100 2 Yes
* Note that in this work temperature unit has been used in either K or oC. The conversion between this two units has been taken as T (K) = T(oC) + 273
Figure 20 shows the Arrhenius relationship between the diffusion coefficients and inverse temperature for 471 nm tungsten powder. No trend with a negative slope could be established for Power-Law creep; however, reasonable trends could be established for Coble and Nabarro-Herring creep. The uncertainties are based on the statistical uncertainty in the fitted trend.

Project No. 09-775
26
Experiments with the 471 nm tungsten particles yielded Coble creep and Nabarro-Herring creep activation energies of 347±14 kJ/mol and 204±53 kJ/mol, respectively. Thus, the Coble creep activation energies of 347±14 kJ/mol are very close to the accepted value for grain boundary diffusion in tungsten; however, the activation energies for Nabarro-Herring creep is less than half of the accepted value for lattice diffusion. While Coble creep does appear to be the densification mechanism for these non-isothermal sintering experiments, the pre-exponential frequencies were between two and three order of magnitude higher than would be expected for traditional Coble creep at these temperatures. This indicates that additional processes may be happening at the microstructural level to accelerate the creep process, which is also predicted by the field theories proposed by Olevsky and Froyen [13,22,23].
Figure 20. Experimental diffusion coefficients for Coble creep, Nabarro-Herring creep and Power-Law creep for non-isothermal sintering of tungsten powder.
A.3.4. Dynamic Kinetics Experiments – Tungsten-Rhenium
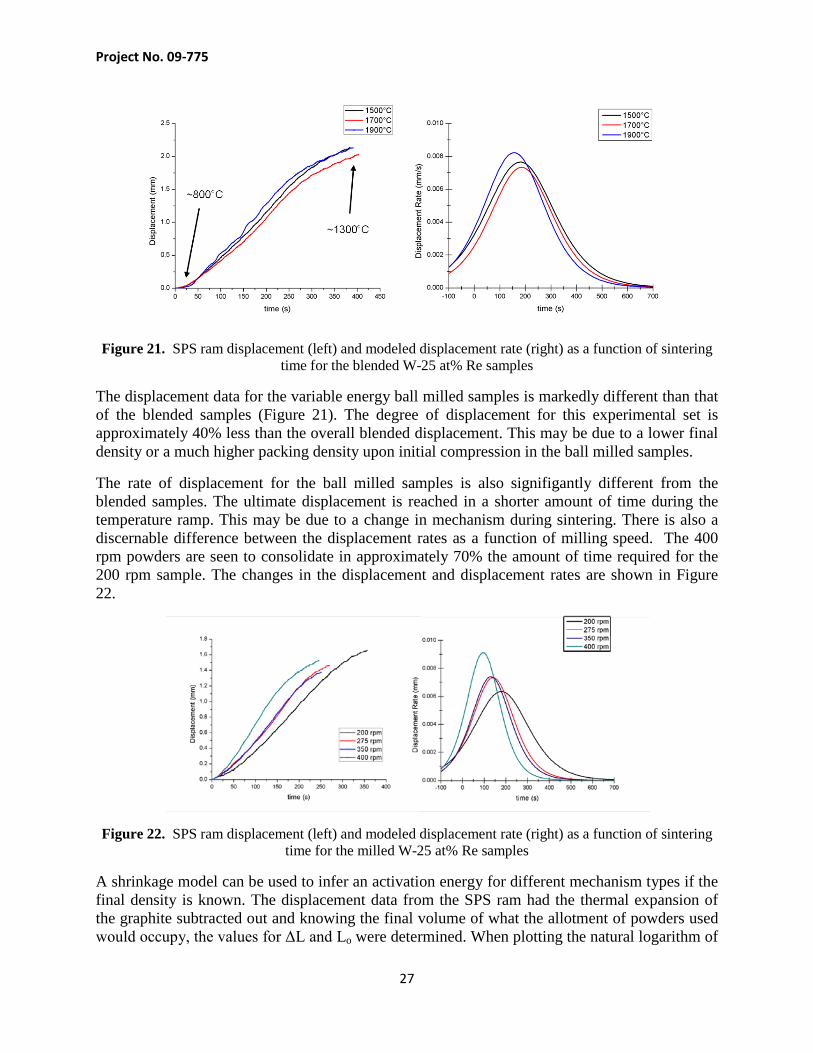
The majority of the displacement of the SPS rams occurred between 800°C to 1300°C during the temperature ramp. There is little difference between the 1500°C, 1700°C, and 1900°C curves, suggesting similar mechanisms occurring during the consolidation. The amount of displacement for each sample is also comparable suggesting analogous densities (provided similar packing efficiencies during initial powder compression).
Project No. 09-775
27
Figure 21. SPS ram displacement (left) and modeled displacement rate (right) as a function of sintering time for the blended W-25 at% Re samples
The displacement data for the variable energy ball milled samples is markedly different than that of the blended samples (Figure 21). The degree of displacement for this experimental set is approximately 40% less than the overall blended displacement. This may be due to a lower final density or a much higher packing density upon initial compression in the ball milled samples.
The rate of displacement for the ball milled samples is also signifigantly different from the blended samples. The ultimate displacement is reached in a shorter amount of time during the temperature ramp. This may be due to a change in mechanism during sintering. There is also a discernable difference between the displacement rates as a function of milling speed. The 400 rpm powders are seen to consolidate in approximately 70% the amount of time required for the 200 rpm sample. The changes in the displacement and displacement rates are shown in Figure 22.
Figure 22. SPS ram displacement (left) and modeled displacement rate (right) as a function of sintering time for the milled W-25 at% Re samples
A shrinkage model can be used to infer an activation energy for different mechanism types if the final density is known. The displacement data from the SPS ram had the thermal expansion of the graphite subtracted out and knowing the final volume of what the allotment of powders used would occupy, the values for ΔL and Lo were determined. When plotting the natural logarithm of

Project No. 09-775
28
the ratio of these two values versus inverse temperature during heating (seen in Figure 23), a slope can be determined that equals 2Q/nR. One can then vary the value of the materials constant n for values for surface, grain boundary, and volume diffusion values.
Figure 23. Logarithmic shrinkage as a function of inverse temperature for the W-25 at% Re blended samples
The slopes and resulting activation energy values for the blended samples are shown in Table 4. There is a slight increase for each mechanism type correlating with an increase in SPS temperature. This could signify the inclusion of higher energy mechanisms of the mass-transport class with higher temperatures. As for determining the dominant mechanism, the only activation energy value that could be found in the literature that had been processed using comparable methods and temperatures was 180 kJ/mol for grain boundary diffusion. While this value is close to those calculated for grain boundary diffusion in Table 5, the shrinkage data used here extends through the intermediary and final regions of sintering were there are multiple mechanisms occurring. Hence, these values are more useful as a comparison to processing changes within this study.
Table 5. Potential activation energies and mechanisms from shrinkage data for the blended W-25 at% Re samples
(Vol. Diff.) (GB Diff.) (Surface diff.) n = 5 (kJ/mol) n = 6 (kJ/mol) n = 7 (kJ/mol)
1500°C 160 190 220 1700°C 180 210 250 1900°C 190 230 270

Project No. 09-775
29
The milled W-25 at% Re samples shrinkage data is shown in Figure 24 and it can be seen that the slopes are steeper than those seen for the blended samples. This higher slope yields average activation energies that are roughly 60% higher than those found for the blended samples. These values can be seen in Table 5. And while all milled values are higher than the blended samples, there does not appear to be a trend with regards to milling speed and energy. This increase in overall energy between the blended and milled results could be due to the change in powder structure during processing. Ball milling the powders will introduce dislocations, vacancies, and a higher number of grain boundaries from the layering effect. This in turn would yield a larger contribution of mechanisms from the higher energy mass transport class when compared to the blended samples. However, this would result in an increase in calculated activation energy as a function of milling energy and that is not seen in Table 6. This discrepancy may be a result of the accuracy of using the shrinkage model in that there is a clear distinction between the blended and milled but not between the different milled samples.
Figure 24. Logarithmic shrinkage as a function of inverse temperature for the W-25 at% Re milled samples
Table 6. Potential activation energies and mechanisms from shrinkage data for the milled W-25 at% Re samples
(Vol. Diff.) (GB Diff.) (Surface diff.)
n = 5 (kJ/mol) n = 6 (kJ/mol) n = 7 (kJ/mol)
200 rpm
300 360 430 275 rpm
270 330 390
350 rpm
310 370 440 400 rpm
240 290 330
Project No. 09-775
30
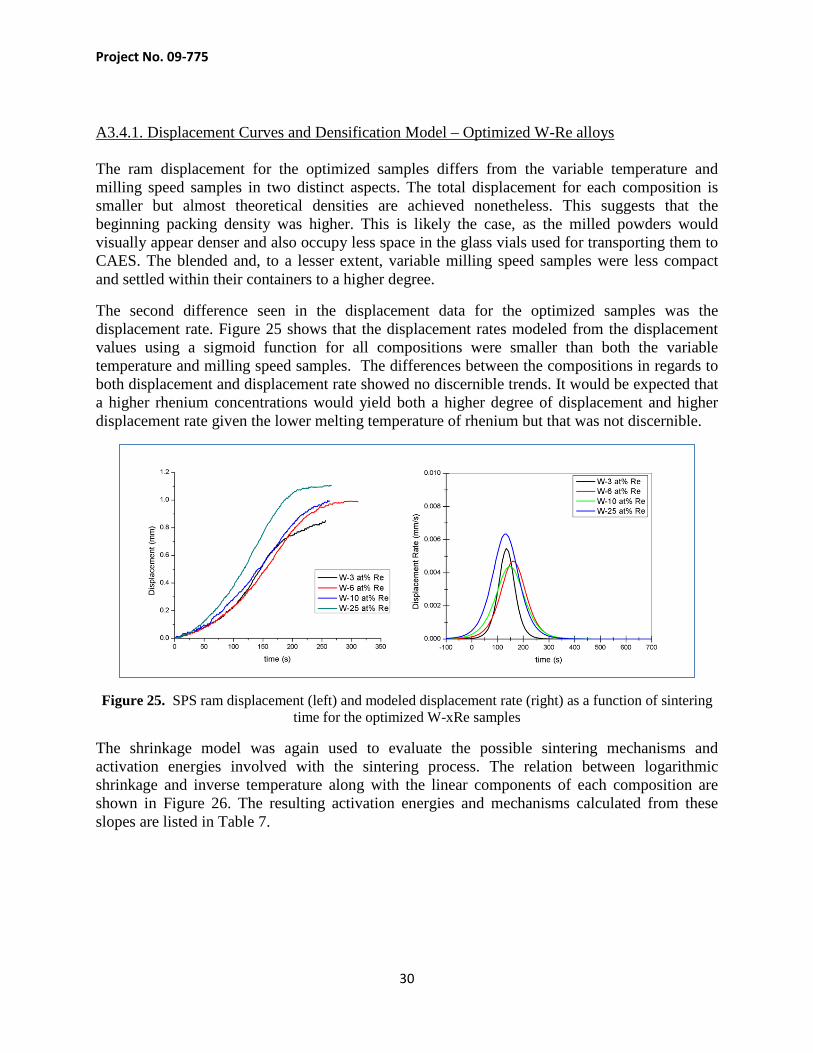
A3.4.1. Displacement Curves and Densification Model – Optimized W-Re alloys The ram displacement for the optimized samples differs from the variable temperature and milling speed samples in two distinct aspects. The total displacement for each composition is smaller but almost theoretical densities are achieved nonetheless. This suggests that the beginning packing density was higher. This is likely the case, as the milled powders would visually appear denser and also occupy less space in the glass vials used for transporting them to CAES. The blended and, to a lesser extent, variable milling speed samples were less compact and settled within their containers to a higher degree.
The second difference seen in the displacement data for the optimized samples was the displacement rate. Figure 25 shows that the displacement rates modeled from the displacement values using a sigmoid function for all compositions were smaller than both the variable temperature and milling speed samples. The differences between the compositions in regards to both displacement and displacement rate showed no discernible trends. It would be expected that a higher rhenium concentrations would yield both a higher degree of displacement and higher displacement rate given the lower melting temperature of rhenium but that was not discernible.
Figure 25. SPS ram displacement (left) and modeled displacement rate (right) as a function of sintering time for the optimized W-xRe samples
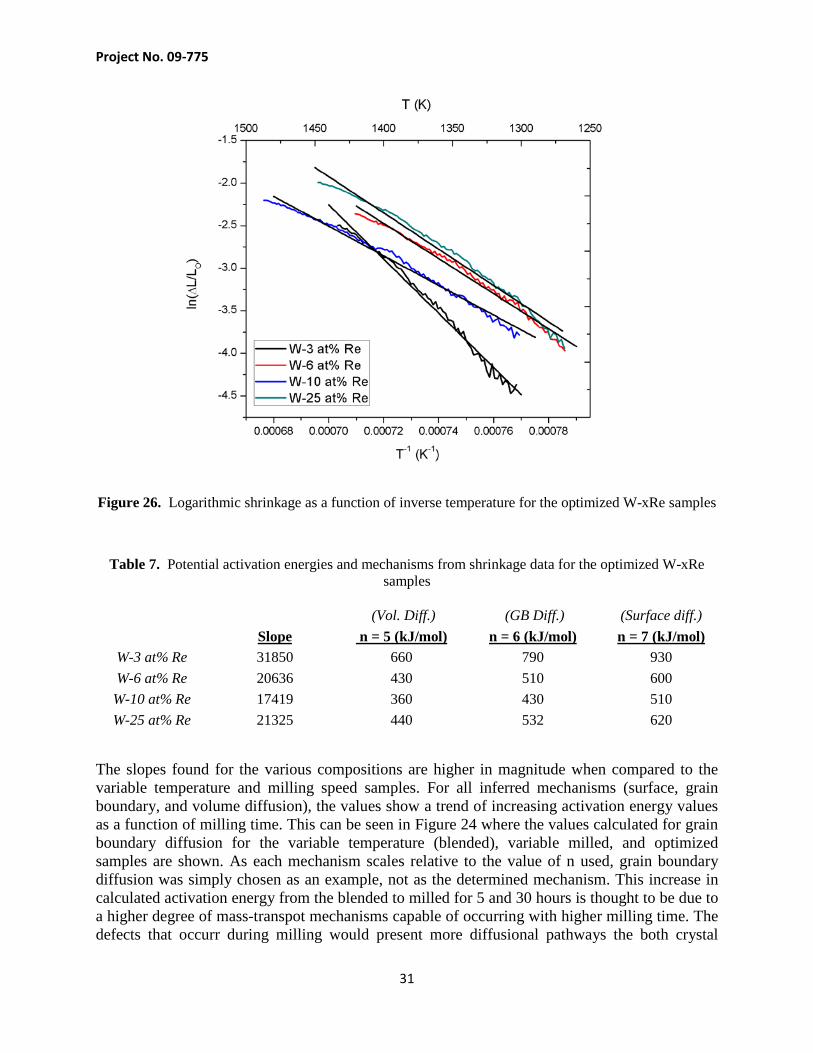
The shrinkage model was again used to evaluate the possible sintering mechanisms and activation energies involved with the sintering process. The relation between logarithmic shrinkage and inverse temperature along with the linear components of each composition are shown in Figure 26. The resulting activation energies and mechanisms calculated from these slopes are listed in Table 7.
Project No. 09-775
31
Figure 26. Logarithmic shrinkage as a function of inverse temperature for the optimized W-xRe samples
Table 7. Potential activation energies and mechanisms from shrinkage data for the optimized W-xRe samples
(Vol. Diff.) (GB Diff.) (Surface diff.)
Slope n = 5 (kJ/mol) n = 6 (kJ/mol) n = 7 (kJ/mol)
W-3 at% Re 31850 660 790 930 W-6 at% Re 20636 430 510 600
W-10 at% Re 17419 360 430 510 W-25 at% Re 21325 440 532 620
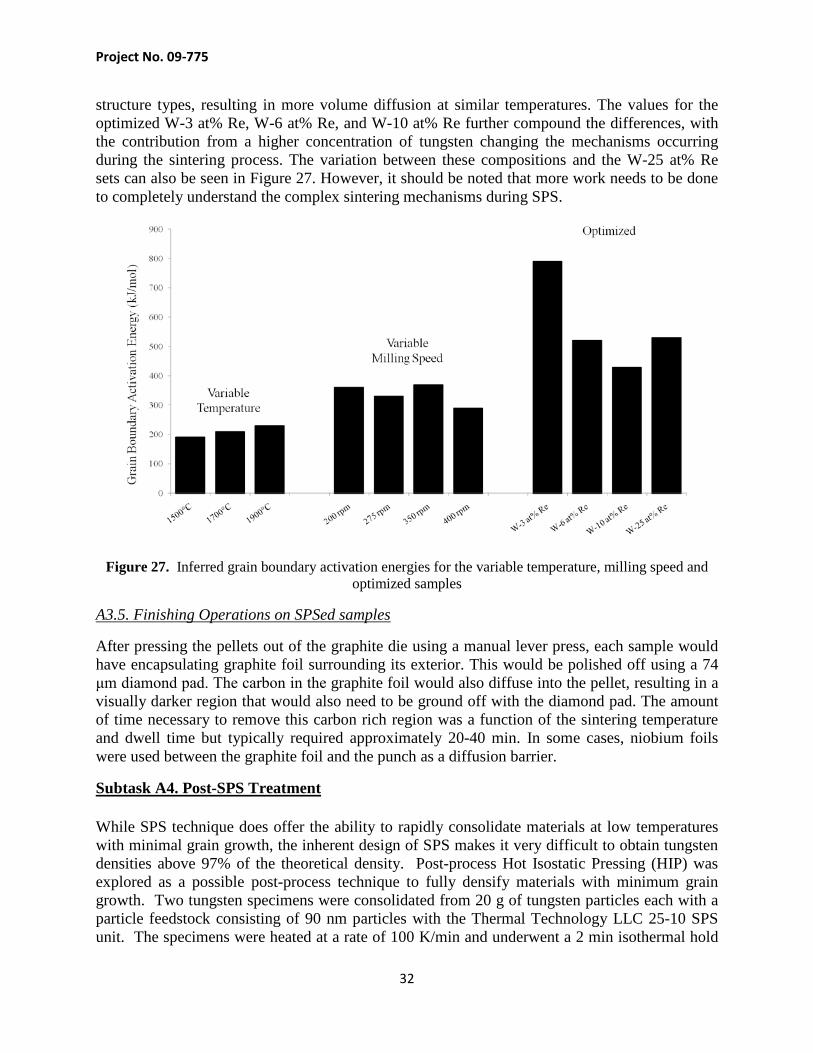
The slopes found for the various compositions are higher in magnitude when compared to the variable temperature and milling speed samples. For all inferred mechanisms (surface, grain boundary, and volume diffusion), the values show a trend of increasing activation energy values as a function of milling time. This can be seen in Figure 24 where the values calculated for grain boundary diffusion for the variable temperature (blended), variable milled, and optimized samples are shown. As each mechanism scales relative to the value of n used, grain boundary diffusion was simply chosen as an example, not as the determined mechanism. This increase in calculated activation energy from the blended to milled for 5 and 30 hours is thought to be due to a higher degree of mass-transpot mechanisms capable of occurring with higher milling time. The defects that occurr during milling would present more diffusional pathways the both crystal
Project No. 09-775
32
structure types, resulting in more volume diffusion at similar temperatures. The values for the optimized W-3 at% Re, W-6 at% Re, and W-10 at% Re further compound the differences, with the contribution from a higher concentration of tungsten changing the mechanisms occurring during the sintering process. The variation between these compositions and the W-25 at% Re sets can also be seen in Figure 27. However, it should be noted that more work needs to be done to completely understand the complex sintering mechanisms during SPS.
Figure 27. Inferred grain boundary activation energies for the variable temperature, milling speed and optimized samples
A3.5. Finishing Operations on SPSed samples
After pressing the pellets out of the graphite die using a manual lever press, each sample would have encapsulating graphite foil surrounding its exterior. This would be polished off using a 74 μm diamond pad. The carbon in the graphite foil would also diffuse into the pellet, resulting in a visually darker region that would also need to be ground off with the diamond pad. The amount of time necessary to remove this carbon rich region was a function of the sintering temperature and dwell time but typically required approximately 20-40 min. In some cases, niobium foils were used between the graphite foil and the punch as a diffusion barrier.
Subtask A4. Post-SPS Treatment
While SPS technique does offer the ability to rapidly consolidate materials at low temperatures with minimal grain growth, the inherent design of SPS makes it very difficult to obtain tungsten densities above 97% of the theoretical density. Post-process Hot Isostatic Pressing (HIP) was explored as a possible post-process technique to fully densify materials with minimum grain growth. Two tungsten specimens were consolidated from 20 g of tungsten particles each with a particle feedstock consisting of 90 nm particles with the Thermal Technology LLC 25-10 SPS unit. The specimens were heated at a rate of 100 K/min and underwent a 2 min isothermal hold
Project No. 09-775
33
every 100 K starting at a temperature of 1073 K, until they reached a peak temperature of 2000 K, where the specimens were soaked for 20 min. Once the specimens were consolidated, they were removed from the graphite dies and polished for density measurements and initial microscopy analysis. SEM/EBSD methods were used to ensure that the pores had completely collapsed and migrated into the grain structures. Each specimen was sectioned into 5 pie shaped wedges which were then further consolidated in an American Isostatic Presses HIP unit; no canning was used since the pore structures had already fully collapsed. The specimens were heated to temperatures of 1473 K, 1673 K, 1873 K and 1973 at a rate of 20 K/min in an argon atmosphere. The specimens were held at peak temperature for 10, 30 and 60 min at an applied isotropic stress of 310 MPa. Following consolidation the specimens were removed, polished once again and analyzed for density and average grain size. Prior to sintering, the average grain size of the particles was 2.57 µm with an average relative density of ~96%. It was found that the specimens HIPed at 1873 K and 1973 K were able to achieve full density; however, the specimens sintered at 1973 K had excessive grain growth. The optimum HIP post-processing temperature that achieved full density with the minimum grain growth was found to be 1873 K with a 60 min isothermal hold.
Task B. Microstructural and Properties Characterization
Subtask B1. Density Measurement After sintering runs, the graphite paper encapsulating each sample was ground off and the densities measured using Archimedes principle. An analytical scale (Mettler Toledo, AB54-S) and associated density kit were used for all density measurements. A thermometer was inserted into the water in the suspension beaker and the temperature allowed to stabilize before taking measurements. Each sample was measured five times in air and five times suspended in water. The samples were dried off with paper towels between suspension measurements.
B1.1. Density of Tungsten Sample
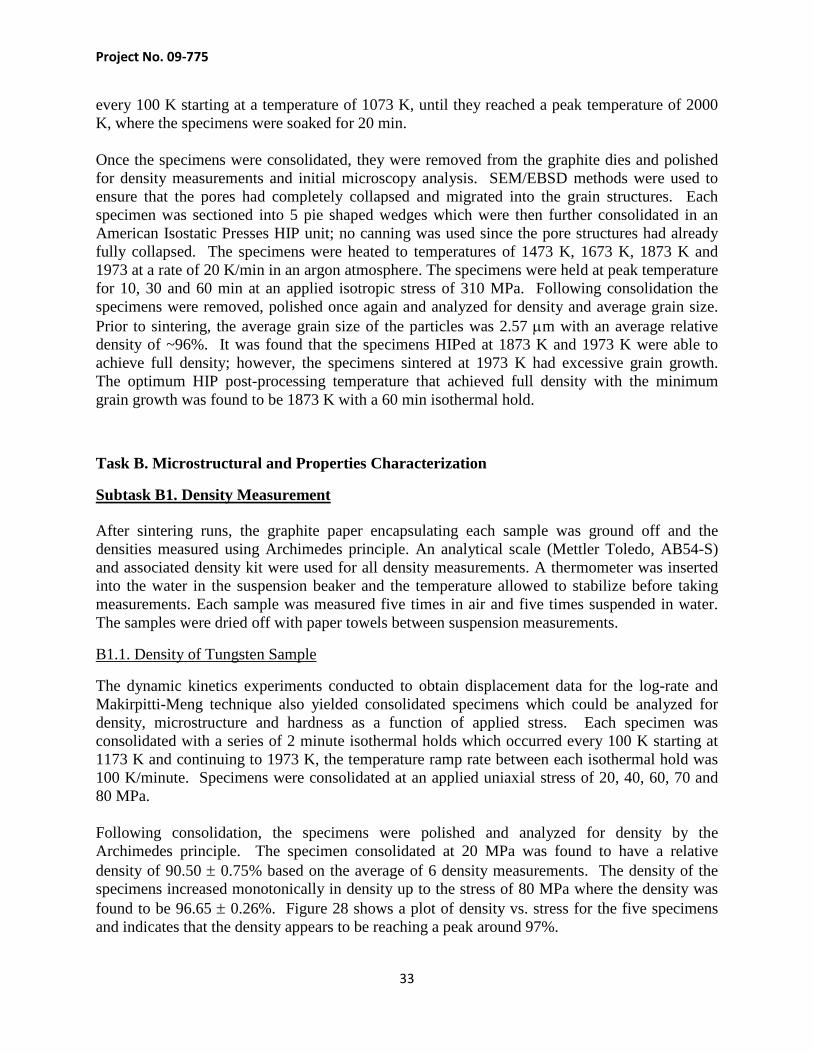
The dynamic kinetics experiments conducted to obtain displacement data for the log-rate and Makirpitti-Meng technique also yielded consolidated specimens which could be analyzed for density, microstructure and hardness as a function of applied stress. Each specimen was consolidated with a series of 2 minute isothermal holds which occurred every 100 K starting at 1173 K and continuing to 1973 K, the temperature ramp rate between each isothermal hold was 100 K/minute. Specimens were consolidated at an applied uniaxial stress of 20, 40, 60, 70 and 80 MPa. Following consolidation, the specimens were polished and analyzed for density by the Archimedes principle. The specimen consolidated at 20 MPa was found to have a relative density of 90.50 ± 0.75% based on the average of 6 density measurements. The density of the specimens increased monotonically in density up to the stress of 80 MPa where the density was found to be 96.65 ± 0.26%. Figure 28 shows a plot of density vs. stress for the five specimens and indicates that the density appears to be reaching a peak around 97%.
Project No. 09-775
34
Figure 28. Sintered density of tungsten vs. uniaxial stress following SPS
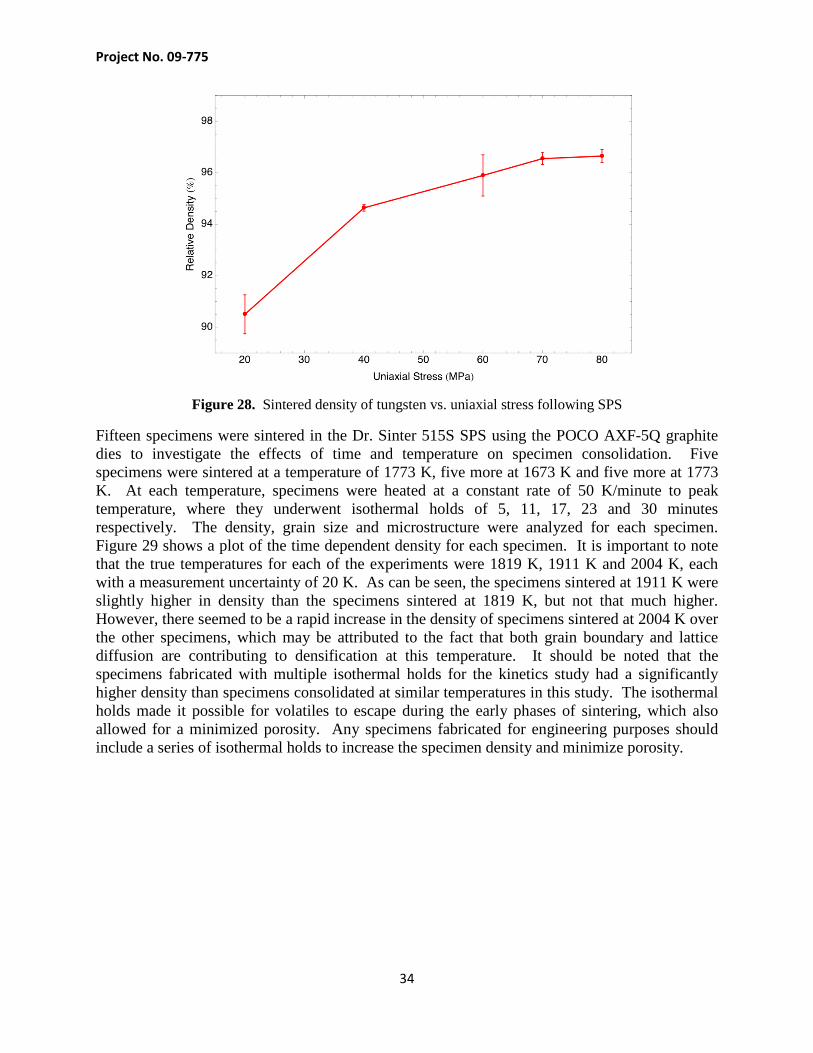
Fifteen specimens were sintered in the Dr. Sinter 515S SPS using the POCO AXF-5Q graphite dies to investigate the effects of time and temperature on specimen consolidation. Five specimens were sintered at a temperature of 1773 K, five more at 1673 K and five more at 1773 K. At each temperature, specimens were heated at a constant rate of 50 K/minute to peak temperature, where they underwent isothermal holds of 5, 11, 17, 23 and 30 minutes respectively. The density, grain size and microstructure were analyzed for each specimen. Figure 29 shows a plot of the time dependent density for each specimen. It is important to note that the true temperatures for each of the experiments were 1819 K, 1911 K and 2004 K, each with a measurement uncertainty of 20 K. As can be seen, the specimens sintered at 1911 K were slightly higher in density than the specimens sintered at 1819 K, but not that much higher. However, there seemed to be a rapid increase in the density of specimens sintered at 2004 K over the other specimens, which may be attributed to the fact that both grain boundary and lattice diffusion are contributing to densification at this temperature. It should be noted that the specimens fabricated with multiple isothermal holds for the kinetics study had a significantly higher density than specimens consolidated at similar temperatures in this study. The isothermal holds made it possible for volatiles to escape during the early phases of sintering, which also allowed for a minimized porosity. Any specimens fabricated for engineering purposes should include a series of isothermal holds to increase the specimen density and minimize porosity.
Project No. 09-775
35
Figure 29. Time dependent density of specimens sintered at temperatures ranging from 1819 K (1546 oC) to 2004 K (1731 oC) at 40 MPa.
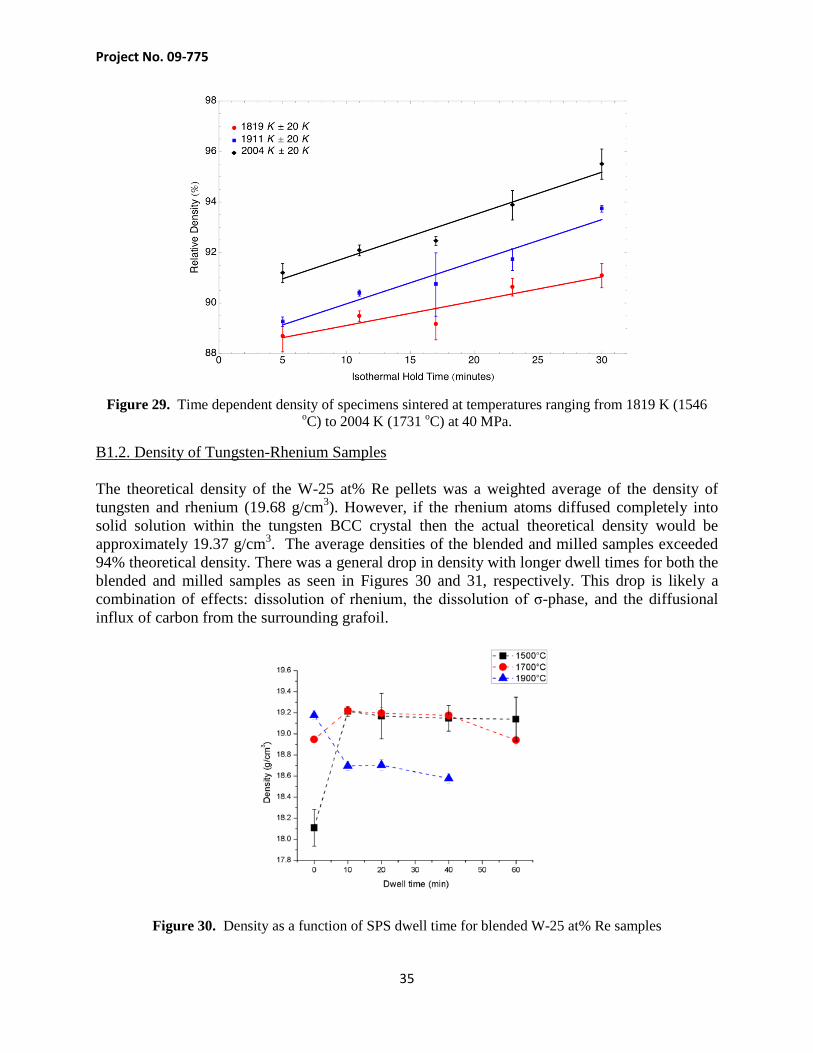
B1.2. Density of Tungsten-Rhenium Samples The theoretical density of the W-25 at% Re pellets was a weighted average of the density of tungsten and rhenium (19.68 g/cm3). However, if the rhenium atoms diffused completely into solid solution within the tungsten BCC crystal then the actual theoretical density would be approximately 19.37 g/cm3. The average densities of the blended and milled samples exceeded 94% theoretical density. There was a general drop in density with longer dwell times for both the blended and milled samples as seen in Figures 30 and 31, respectively. This drop is likely a combination of effects: dissolution of rhenium, the dissolution of σ-phase, and the diffusional influx of carbon from the surrounding grafoil.
Figure 30. Density as a function of SPS dwell time for blended W-25 at% Re samples

Project No. 09-775
36
Figure 31. Density as a function of SPS dwell time for milled W-25 at% Re samples
The density measurements indicate that values close to theoretical density at the beginning of the hold time but will drop during the remainder of the dwell due to the incorporation of carbon diffusing in from the surrounding graphite paper. This contamination and resulting higher porosity at the edges of a sample is undesirable for a number of reasons. This problem can be avoided if a different type of high-temperature material can be used to separate the W-Re powders from the graphite die. Samples were fabricated using niobium foils to insulate and there was little contamination found. This is due to the much smaller diffusivity of niobium in tungsten and shorter penetration depth. Comparison cross-sections of samples sintered at the same temperature and hold times are shown in Figure 32. White and Jurkowitz characterized the carbide layer that formed while hot pressing 2.0 μm tungsten in a graphite die at 1800°C for 30 min [34]. The layer extended between 101 to 203 μm and this influx was inversely related to the pressure applied. White’s results are comparable to what was found in this study.
Figure 32. SEM images of W-25 at% Re sample sintered with no dwell (left) and 30 minute dwell (right)
The density of the optimized samples showed a definite trend of lower densities with lower concentrations of rhenium (Figure 33). This density drop as a function of composition is due to both the greater difficulty in sintering powders with higher concentrations of tungsten (with its higher Tm) and also the lower theoretical densities relative to lower rhenium concentrations.

Project No. 09-775
37
There was also a similar trend of decreasing density with longer dwell times as was seen with the variable temperature and milling speed samples from the first experimental set. Again, this is attributed to influx of carbon from the graphite paper causing a higher degree of porosity at each sample’s edges.
Figure 33. Density of optimized W-xRe samples as a function of SPS dwell time
There were no discernible trends with the porosity results of each compositional set. The variation seen in Figure 31 is very likely simply due to statistical variations for each compositional set. Regardless, these porosity values found in the bulk of the optimized samples do not correlate with the decrease in density measured as a function of SPS dwell time.
Figure 34. Porosity in optimized W-xRe samples as a function of SPS dwell time

Project No. 09-775
38
Ignoring crystal defects such as vacancies and dislocations, these porosity values can be thought of as complementary to density resulting in calculated density values ranging from 97.7 to 99.5% theoretically dense for all optimized compositions. The difference between the inferred density from porosity measurements in the center of each sample and the densities measured with Archimedes is shown in Figure 35. It can be seen that each compositional set maintains its density with longer dwell and this value is near theoretical densities for each compositional set.
Figure 35. Measured density (left) and density inferred from porosity measurements (right) for optimized W-xRe samples
Subtask B2. Microstructural Characterization of SPSed Samples B2.1. Microstructural Characterization of SPSed Tungsten
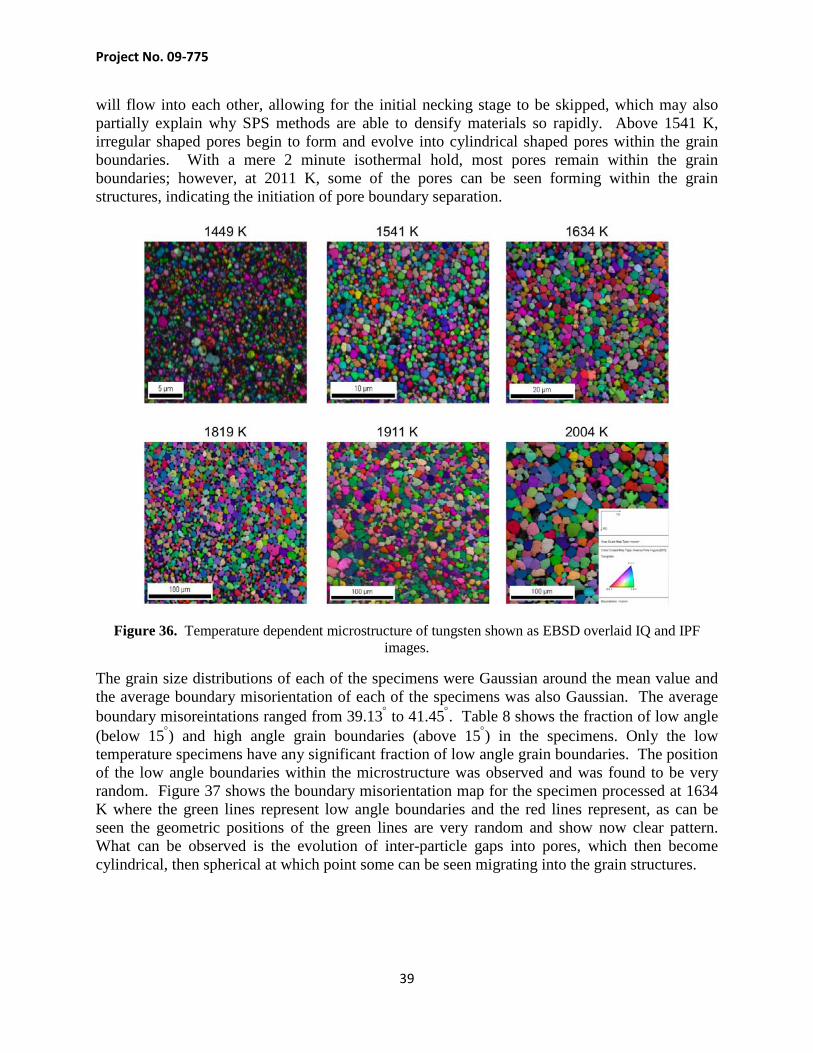
Here we describe the effect of time and temperature on the microstructure of the SPSed tungsten samples. Two different sintering experiments were performed to evaluate the temperature and time dependent microstructure of tungsten specimens manufactured by SPS methods. The following section outlines the two experiments as well as their results. Specimens were also imaged by an EBSD camera so that the IQ and IPF images could be overlaid to show the pore and grain morphology. Figure 36 shows a picture of the microstructure starting at 1449 K going through 2011 K, unfortunately the 1726 K images were too fuzzy to discern the microstructure and were omitted. The images seem to indicate that up to 1541 K, the particles seem to be undergoing particle coalescence (boundary migration), and above that temperature, evolved grains begin to appear and grow. However, it is interesting that no necking joints seem to be present, indicating that the sintering process seems to skip the surface diffusion stage. The lack of necking joints leads one to believe that the high current density which proceeds through the inter-particle contact points during the early stages of sintering, may induce very high localized temperatures at the inter-particle contact points. The increased temperature may allow for the effective stress at the inter-particle contact point to exceed the yield stress and allow for plastic flow. If plastic flow is present at the inter-particle necking joint, the particles
Project No. 09-775
39
will flow into each other, allowing for the initial necking stage to be skipped, which may also partially explain why SPS methods are able to densify materials so rapidly. Above 1541 K, irregular shaped pores begin to form and evolve into cylindrical shaped pores within the grain boundaries. With a mere 2 minute isothermal hold, most pores remain within the grain boundaries; however, at 2011 K, some of the pores can be seen forming within the grain structures, indicating the initiation of pore boundary separation.
Figure 36. Temperature dependent microstructure of tungsten shown as EBSD overlaid IQ and IPF images.
The grain size distributions of each of the specimens were Gaussian around the mean value and the average boundary misorientation of each of the specimens was also Gaussian. The average boundary misoreintations ranged from 39.13° to 41.45°. Table 8 shows the fraction of low angle (below 15°) and high angle grain boundaries (above 15°) in the specimens. Only the low temperature specimens have any significant fraction of low angle grain boundaries. The position of the low angle boundaries within the microstructure was observed and was found to be very random. Figure 37 shows the boundary misorientation map for the specimen processed at 1634 K where the green lines represent low angle boundaries and the red lines represent, as can be seen the geometric positions of the green lines are very random and show now clear pattern. What can be observed is the evolution of inter-particle gaps into pores, which then become cylindrical, then spherical at which point some can be seen migrating into the grain structures.

Project No. 09-775
40
Table 8. Number fraction of low angle grain boundaries (below 15°) and high angle grain boundaries (above 15°) for SPS processed tungsten at fabrication temperatures ranging from 1449 K to 2004 K at 40 MPa and a hold time of 2 minutes.
Temperature (K) Low Angle High Angle 1449 7.35 ± 0.55 92.65 ± 0.55 1541 4.25 ± 0.25 95.75 ± 0.25 1634 3.70 ± 0.40 96.70 ± 0.40 1726 4.00 ± 0.30 96.00 ± 0.30 1819 2.90 ± 0.10 97.10 ± 0.10 1911 3.35 ± 0.35 96.65 ± 0.35 2004 3.00 ± 0.20 96.75 ± 0.45
Figure 37. Misorientation map for tungsten specimen processed by SPS at 1634 K for 2 minutes at 40 MPa
Figure 38. Time and temperature dependent evolution of the tungsten microstructure fabricated by the SPS method

Project No. 09-775
41
Figure 38 shows the average grain size of the tungsten specimens as a function of isothermal hold time at each temperature. The average grain size for the specimens consolidated at 1819 and 1911 K seems to increase in a parallel fashion. The grain size for the specimens consolidated at 2004 K increases at a much faster rate than the specimens consolidated at lower temperatures, which is likely due to the onset of pore-boundary separation, which allows for the acceleration of grain growth due to the fact that the pores are no longer acting as pinning agents. Figure 39 also contains grain size data collected by Perkins [35] at an isothermal temperature of 2096 K. The average grain size of Jeff Perkin’s data set starts of smaller because his feedstock powders had a much smaller crystallite size, which was measured at 260 nm, compared to the ~500 nm crystallite size of the powder used in this project.
Figure 39. Average grain size for tungsten specimens consolidated at 1819 K, 1911 K, 2004 and 2096 K.
B2.2. Microstructural Characterization of SPSed Tungsten-Rhenium Alloys
B2.2.1. Microstructural Characterization of Variable Milling and Temperature Samples
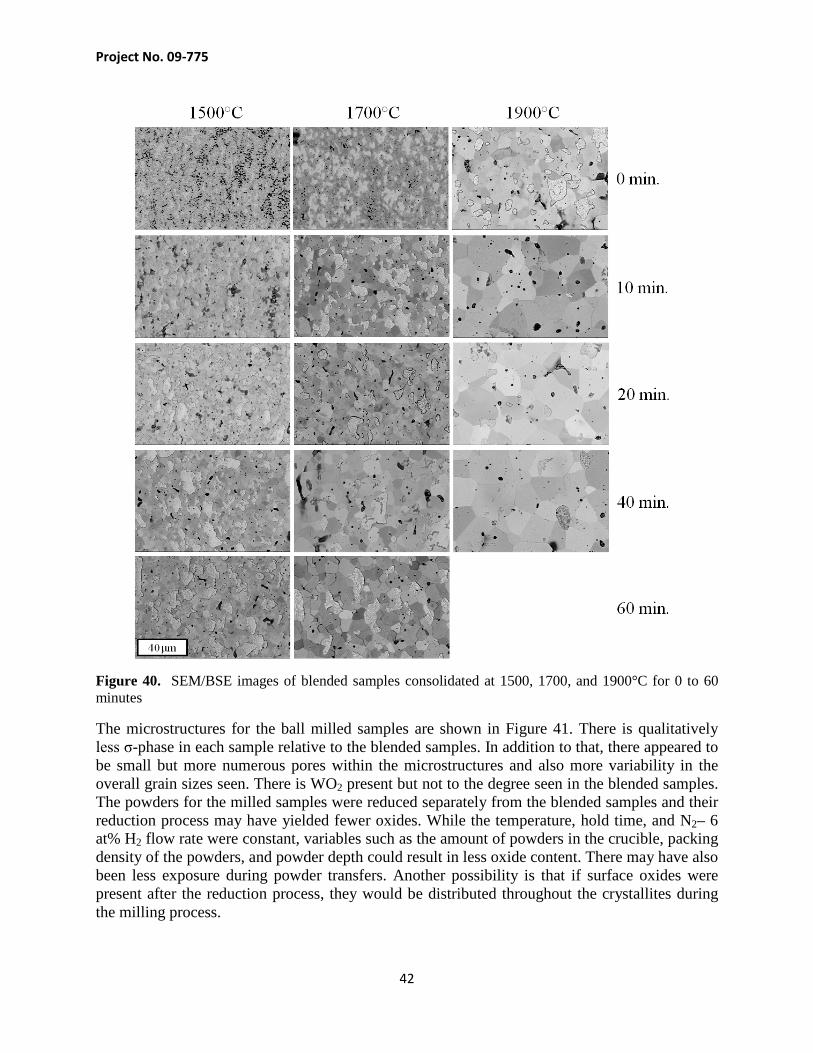
The SEM/BSE image results are shown in Figure 40. The σ-phase can be seen to be brighter than the surrounding tungsten matrix. There was variability in the effectiveness of the etching process which may be due to the time between polishing and etching and/or the length of time the Murakami reagent was applied. There were samples that were not immediately etched after being removed from the vibratory polisher and it is possible that the alloy may have slightly oxidized during the interim. The etching time was 5 to 7 s which could also yield a wide degree of variability in the degree of grain relief. There are pores that can be seen in the microstructures especially in the 1500°C sintered with no dwell, correlating with the Archimedes density results. For the remaining samples, the porosity is much smaller also agreeing with the density measurements. There were many dark regions which contain orthogonal-like structures. These were later determined to likely be WO2 using EDS. These regions also appeared to increase in number with longer SPS dwell time. This may be due to an issue with the seal of the SPS chamber but this would likely yield much more WO2 near the edge of the samples which was not seen.
Project No. 09-775
42
Figure 40. SEM/BSE images of blended samples consolidated at 1500, 1700, and 1900°C for 0 to 60 minutes
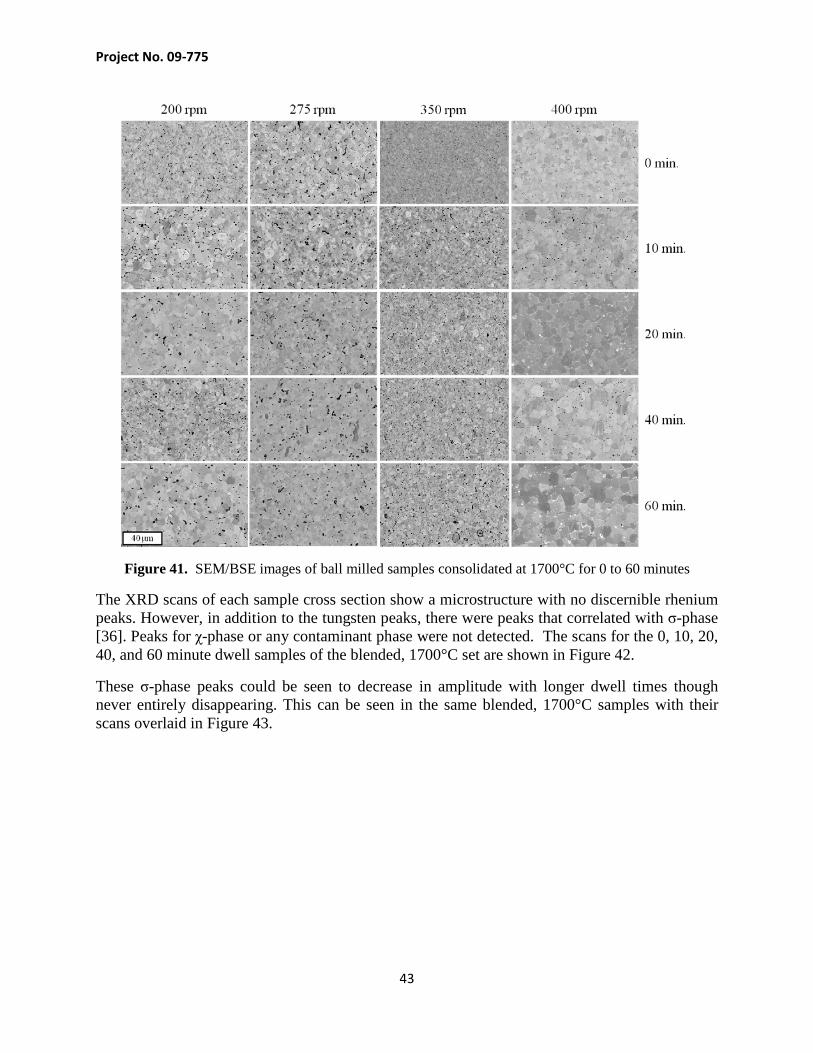
The microstructures for the ball milled samples are shown in Figure 41. There is qualitatively less σ-phase in each sample relative to the blended samples. In addition to that, there appeared to be small but more numerous pores within the microstructures and also more variability in the overall grain sizes seen. There is WO2 present but not to the degree seen in the blended samples. The powders for the milled samples were reduced separately from the blended samples and their reduction process may have yielded fewer oxides. While the temperature, hold time, and N2– 6 at% H2 flow rate were constant, variables such as the amount of powders in the crucible, packing density of the powders, and powder depth could result in less oxide content. There may have also been less exposure during powder transfers. Another possibility is that if surface oxides were present after the reduction process, they would be distributed throughout the crystallites during the milling process.
Project No. 09-775
43
Figure 41. SEM/BSE images of ball milled samples consolidated at 1700°C for 0 to 60 minutes
The XRD scans of each sample cross section show a microstructure with no discernible rhenium peaks. However, in addition to the tungsten peaks, there were peaks that correlated with σ-phase [36]. Peaks for χ-phase or any contaminant phase were not detected. The scans for the 0, 10, 20, 40, and 60 minute dwell samples of the blended, 1700°C set are shown in Figure 42.
These σ-phase peaks could be seen to decrease in amplitude with longer dwell times though never entirely disappearing. This can be seen in the same blended, 1700°C samples with their scans overlaid in Figure 43.

Project No. 09-775
44
Figure 42. XRD scans for the W-25 at% Re blended (1700°C) showing the 0-60 minute dwells; vertical lines indicate σ-phase
Figure 43. Overlaid XRD scans for blended (1700°C) W-25 at% Re samples; vertical lines are σ-phase reference peaks.
Not only did the σ-phase peaks decrease with longer dwell times (as shown in Figure 44) but also with higher rotational energies from ball milling. An attempt at quantifying the amount of σ-phase and rate of dissolution using Rietvelt refinement; however, the results were unsatisfactory. To use this method, the atomic positions of each atom with the σ crystal structure must be known to accurately quantify the concentration within the microstructure. Research has shown that these positions shift with changing tungsten and rhenium content and this is due to the interdiffusion occurring during SPS [37].
Project No. 09-775
45
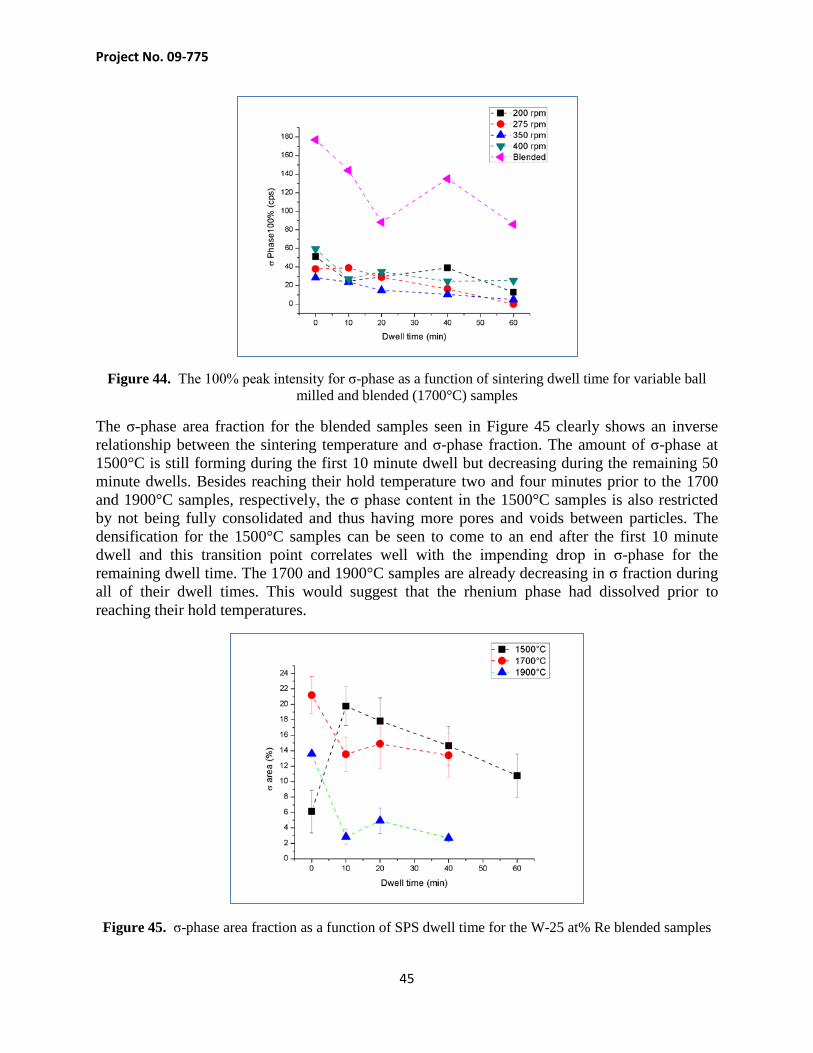
Figure 44. The 100% peak intensity for σ-phase as a function of sintering dwell time for variable ball milled and blended (1700°C) samples
The σ-phase area fraction for the blended samples seen in Figure 45 clearly shows an inverse relationship between the sintering temperature and σ-phase fraction. The amount of σ-phase at 1500°C is still forming during the first 10 minute dwell but decreasing during the remaining 50 minute dwells. Besides reaching their hold temperature two and four minutes prior to the 1700 and 1900°C samples, respectively, the σ phase content in the 1500°C samples is also restricted by not being fully consolidated and thus having more pores and voids between particles. The densification for the 1500°C samples can be seen to come to an end after the first 10 minute dwell and this transition point correlates well with the impending drop in σ-phase for the remaining dwell time. The 1700 and 1900°C samples are already decreasing in σ fraction during all of their dwell times. This would suggest that the rhenium phase had dissolved prior to reaching their hold temperatures.
Figure 45. σ-phase area fraction as a function of SPS dwell time for the W-25 at% Re blended samples
Project No. 09-775
46
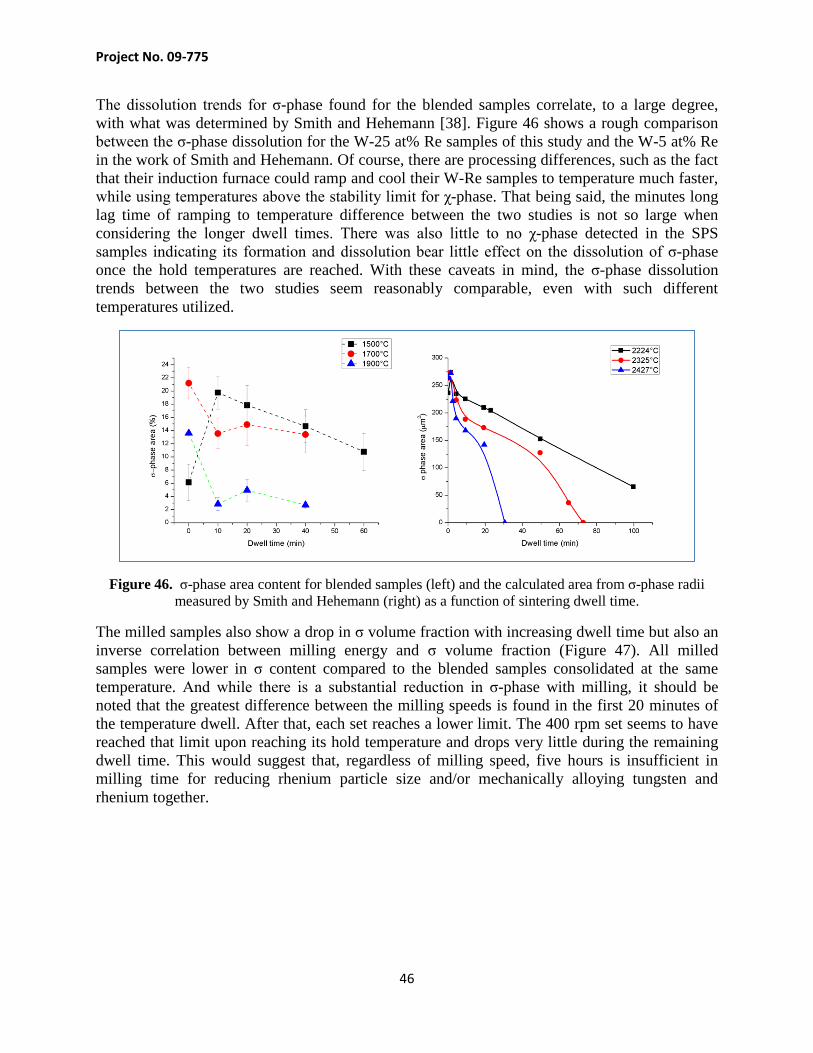
The dissolution trends for σ-phase found for the blended samples correlate, to a large degree, with what was determined by Smith and Hehemann [38]. Figure 46 shows a rough comparison between the σ-phase dissolution for the W-25 at% Re samples of this study and the W-5 at% Re in the work of Smith and Hehemann. Of course, there are processing differences, such as the fact that their induction furnace could ramp and cool their W-Re samples to temperature much faster, while using temperatures above the stability limit for χ-phase. That being said, the minutes long lag time of ramping to temperature difference between the two studies is not so large when considering the longer dwell times. There was also little to no χ-phase detected in the SPS samples indicating its formation and dissolution bear little effect on the dissolution of σ-phase once the hold temperatures are reached. With these caveats in mind, the σ-phase dissolution trends between the two studies seem reasonably comparable, even with such different temperatures utilized.
Figure 46. σ-phase area content for blended samples (left) and the calculated area from σ-phase radii measured by Smith and Hehemann (right) as a function of sintering dwell time.
The milled samples also show a drop in σ volume fraction with increasing dwell time but also an inverse correlation between milling energy and σ volume fraction (Figure 47). All milled samples were lower in σ content compared to the blended samples consolidated at the same temperature. And while there is a substantial reduction in σ-phase with milling, it should be noted that the greatest difference between the milling speeds is found in the first 20 minutes of the temperature dwell. After that, each set reaches a lower limit. The 400 rpm set seems to have reached that limit upon reaching its hold temperature and drops very little during the remaining dwell time. This would suggest that, regardless of milling speed, five hours is insufficient in milling time for reducing rhenium particle size and/or mechanically alloying tungsten and rhenium together.

Project No. 09-775
47
Figure 47. The σ-phase area content as a function of SPS dwell time for the W-25 at% Re milled samples
The grain sizes for the blended samples show a definite relationship between the sintering temperatures and grain diameter, shown in Figure 48. While there was little difference between the 1500 and 1700°C samples, there was a substantial increase in grain growth between the 1700 and 1900°C sets. The 1500, 1700, and 1900°C samples appeared to reach a plateau grain size of approximately 3.9, 4.9, and 13.5 μm, respectively.
Figure 48. Grain size as a function of SPS dwell time for the W-25 at% Re blended samples. The measurement error bars were obscured by the symbols so were not included.
There were no discernible trends for the milled samples as shown in Figure 49. The 275 rpm and 350 rpm samples reach a plateau a little over 2 μm while the 200 rpm and 400 rpm samples

Project No. 09-775
48
reached ~5 μm. This is not likely to be due to the error in measurement for the EBSD linear intercept measurements as multiple scans showed an error of approximately 0.13 μm for 3 scans of different areas. The variation seen is likely due to error within the fabrication process.
Figure 49. Grain size as a function of SPS dwell time for the W-25 at% Re milled samples. The measurement error bars were obscured by the symbols so were not included.
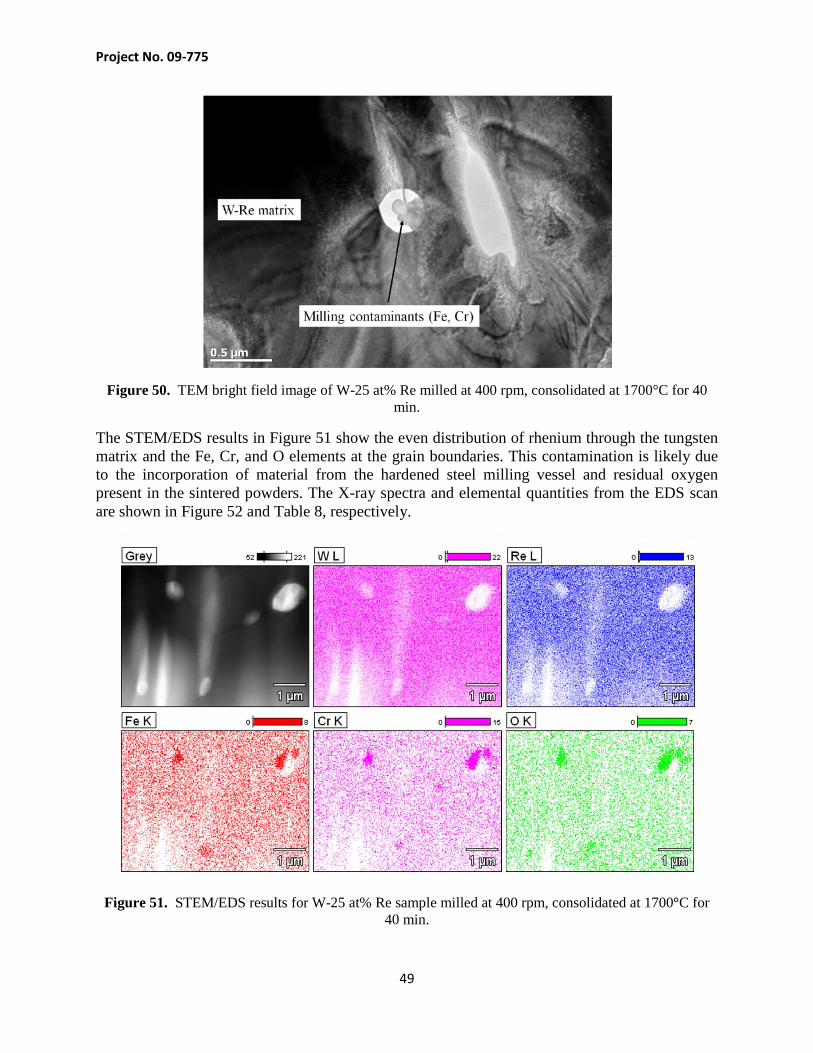
Transmission electron microscopy was carried out on some targeted samples. TEM bright field images showed different phases apart from the tungsten grains. The morphology of these structures differed from what was predominately seen with the SEM images, i.e. the periodic oxides at grain boundaries. One of these structures can be seen in the TEM bright field image in the center of Figure 50 which is a W-25 at% Re sample milled at 400 rpm and consolidated for 40 minutes. STEM/EDS results in Figure 48 show predominantly tungsten with rhenium distributed uniformly throughout each grain. The measurement also showed copper (from the TEM grid support) along with iron, chromium, and oxygen sparsely distributed, but also localized at the different phase region.
Project No. 09-775
49
Figure 50. TEM bright field image of W-25 at% Re milled at 400 rpm, consolidated at 1700°C for 40 min.
The STEM/EDS results in Figure 51 show the even distribution of rhenium through the tungsten matrix and the Fe, Cr, and O elements at the grain boundaries. This contamination is likely due to the incorporation of material from the hardened steel milling vessel and residual oxygen present in the sintered powders. The X-ray spectra and elemental quantities from the EDS scan are shown in Figure 52 and Table 8, respectively.
Figure 51. STEM/EDS results for W-25 at% Re sample milled at 400 rpm, consolidated at 1700°C for 40 min.
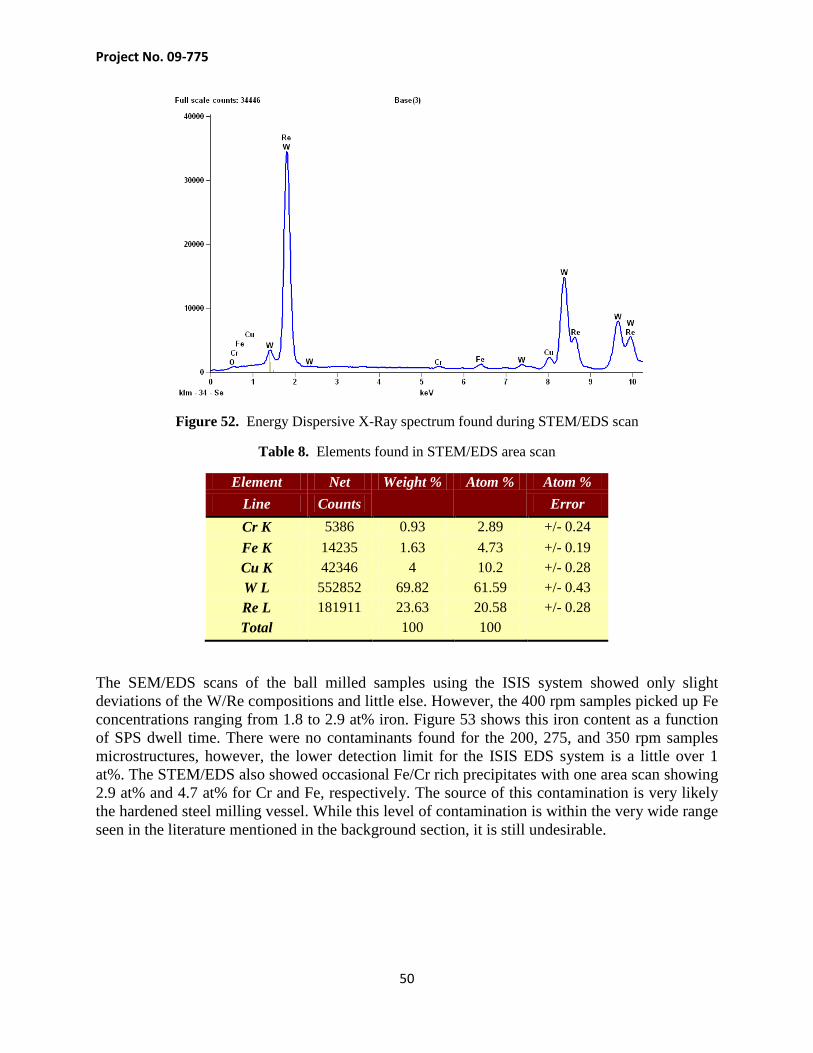
Project No. 09-775
50
Figure 52. Energy Dispersive X-Ray spectrum found during STEM/EDS scan
Table 8. Elements found in STEM/EDS area scan
Element Net Weight % Atom % Atom % Line Counts Error Cr K 5386 0.93 2.89 +/- 0.24 Fe K 14235 1.63 4.73 +/- 0.19 Cu K 42346 4 10.2 +/- 0.28 W L 552852 69.82 61.59 +/- 0.43 Re L 181911 23.63 20.58 +/- 0.28 Total 100 100
The SEM/EDS scans of the ball milled samples using the ISIS system showed only slight deviations of the W/Re compositions and little else. However, the 400 rpm samples picked up Fe concentrations ranging from 1.8 to 2.9 at% iron. Figure 53 shows this iron content as a function of SPS dwell time. There were no contaminants found for the 200, 275, and 350 rpm samples microstructures, however, the lower detection limit for the ISIS EDS system is a little over 1 at%. The STEM/EDS also showed occasional Fe/Cr rich precipitates with one area scan showing 2.9 at% and 4.7 at% for Cr and Fe, respectively. The source of this contamination is very likely the hardened steel milling vessel. While this level of contamination is within the very wide range seen in the literature mentioned in the background section, it is still undesirable.
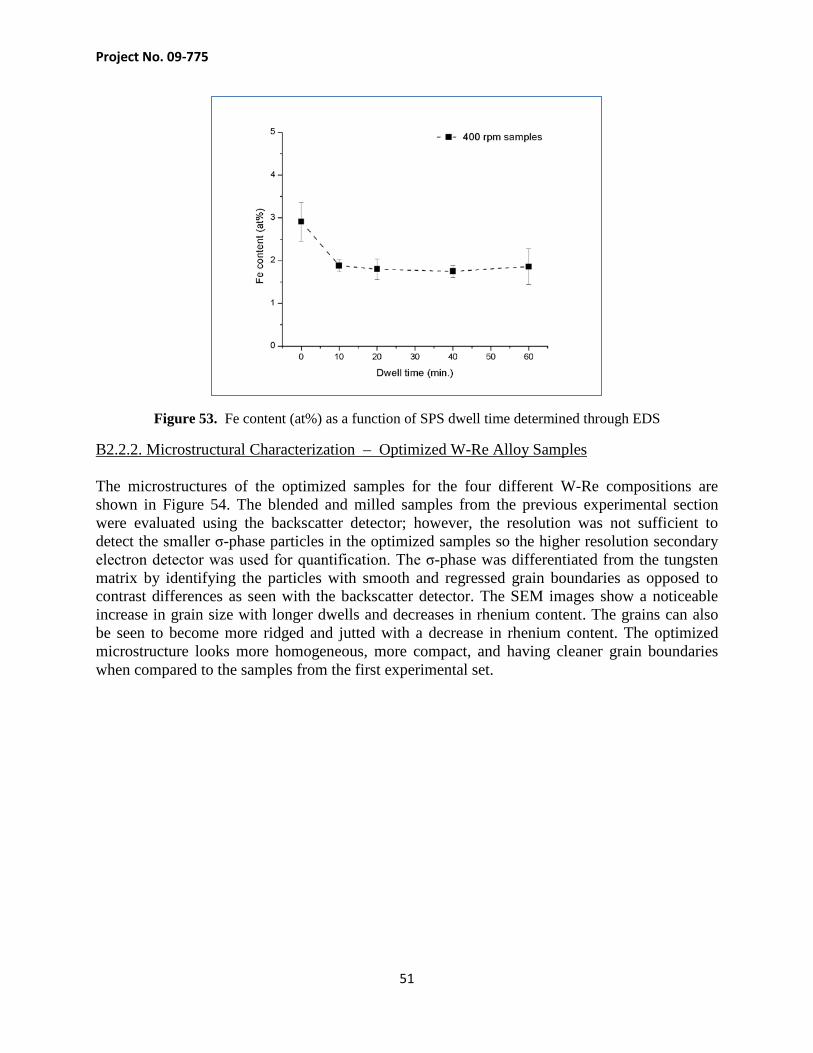
Project No. 09-775
51
Figure 53. Fe content (at%) as a function of SPS dwell time determined through EDS
B2.2.2. Microstructural Characterization – Optimized W-Re Alloy Samples The microstructures of the optimized samples for the four different W-Re compositions are shown in Figure 54. The blended and milled samples from the previous experimental section were evaluated using the backscatter detector; however, the resolution was not sufficient to detect the smaller σ-phase particles in the optimized samples so the higher resolution secondary electron detector was used for quantification. The σ-phase was differentiated from the tungsten matrix by identifying the particles with smooth and regressed grain boundaries as opposed to contrast differences as seen with the backscatter detector. The SEM images show a noticeable increase in grain size with longer dwells and decreases in rhenium content. The grains can also be seen to become more ridged and jutted with a decrease in rhenium content. The optimized microstructure looks more homogeneous, more compact, and having cleaner grain boundaries when compared to the samples from the first experimental set.

Project No. 09-775
52
Figure 54. SEM images of optimized samples consolidated at 1800°C for 0 to 30 minutes
The EBSD scans for the optimized samples were of a much better quality than the blended and milled samples from the first experimental section. The optimized samples were single phase, resulting in cross sections that polished and etched more uniformly which is critical to producing quality Kikuchi bands. The inverse pole figure maps for the W-3 at% Re and W-25 at% Re samples are shown in Figure 55.

Project No. 09-775
53
Figure 55. EBSD inverse pole figure maps of W-3 at% Re and W-25 at% Re samples consolidated at 1800°C for 0 to 30 min.
The scans on these samples showed that there is no preferred orientation to the W-Re grains, that the samples are single phase (tungsten BCC), and shows an increase in grain growth with lower rhenium concentrations. There was a slight aspect ratio of 0.57 to the grains, being more elongated normal to the current and pressure from the punches. The grain orientation and aspect ratio for a scan of a W-25 at% Re sample is shown in Figure 56.
Figure 56. Inverse pole figures (left) and grain shape aspect ratio (right) for W-25 at% Re sample
The XRD characterization of the optimized, consolidated samples detected neither the σ, χ, or rhenium phases (as shown in Figure 57). There were also no contaminant phases to be found; only the tungsten BCC phase (and mounting material peaks) can be seen. The tungsten peaks also do not shift in position as opposed to what was seen with the blended samples in the first
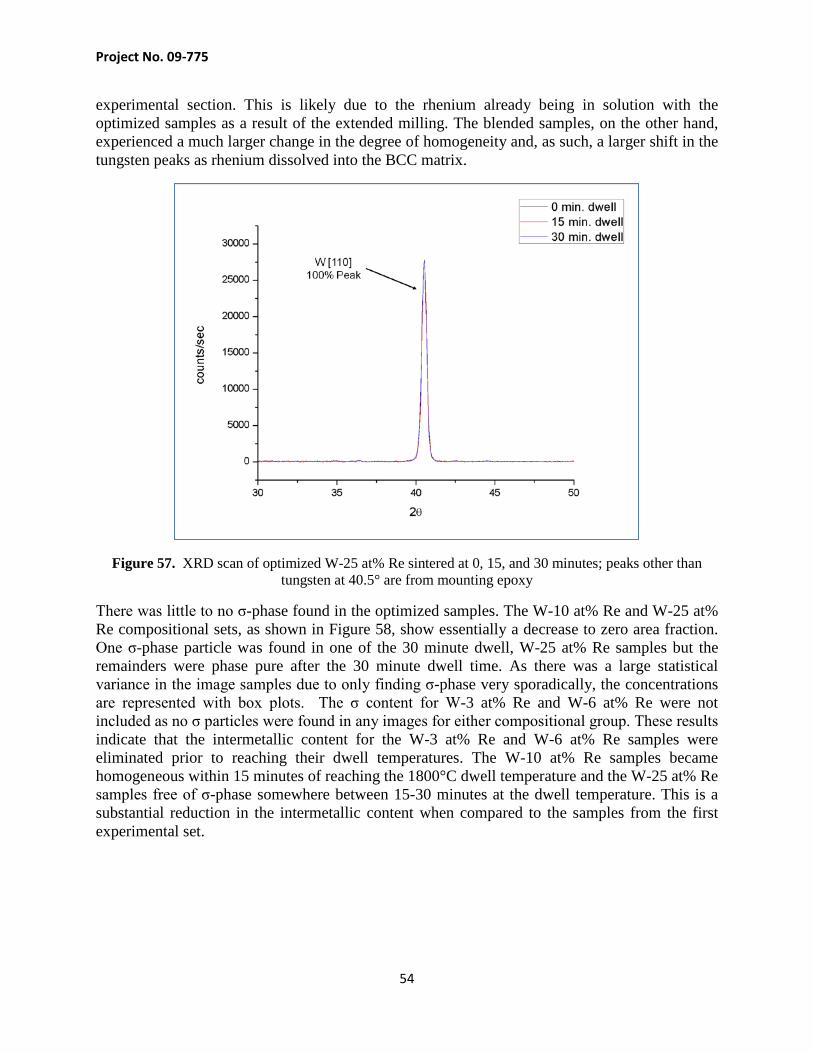
Project No. 09-775
54
experimental section. This is likely due to the rhenium already being in solution with the optimized samples as a result of the extended milling. The blended samples, on the other hand, experienced a much larger change in the degree of homogeneity and, as such, a larger shift in the tungsten peaks as rhenium dissolved into the BCC matrix.
Figure 57. XRD scan of optimized W-25 at% Re sintered at 0, 15, and 30 minutes; peaks other than tungsten at 40.5° are from mounting epoxy
There was little to no σ-phase found in the optimized samples. The W-10 at% Re and W-25 at% Re compositional sets, as shown in Figure 58, show essentially a decrease to zero area fraction. One σ-phase particle was found in one of the 30 minute dwell, W-25 at% Re samples but the remainders were phase pure after the 30 minute dwell time. As there was a large statistical variance in the image samples due to only finding σ-phase very sporadically, the concentrations are represented with box plots. The σ content for W-3 at% Re and W-6 at% Re were not included as no σ particles were found in any images for either compositional group. These results indicate that the intermetallic content for the W-3 at% Re and W-6 at% Re samples were eliminated prior to reaching their dwell temperatures. The W-10 at% Re samples became homogeneous within 15 minutes of reaching the 1800°C dwell temperature and the W-25 at% Re samples free of σ-phase somewhere between 15-30 minutes at the dwell temperature. This is a substantial reduction in the intermetallic content when compared to the samples from the first experimental set.
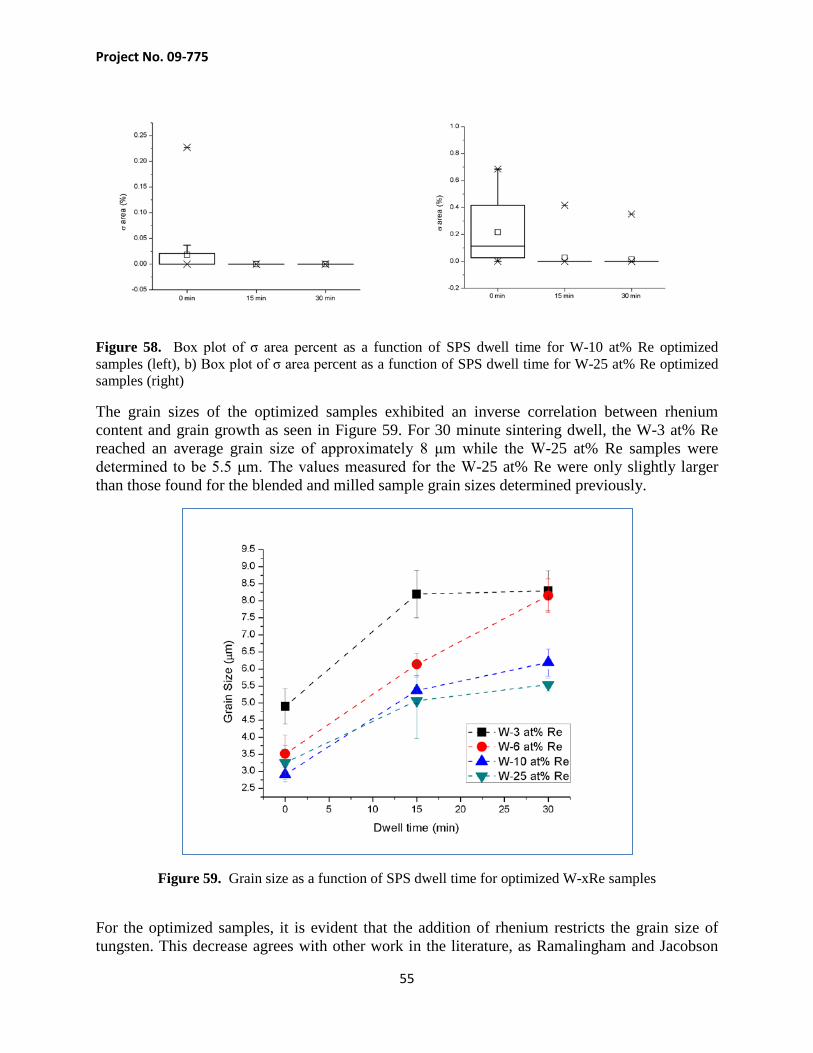
Project No. 09-775
55
Figure 58. Box plot of σ area percent as a function of SPS dwell time for W-10 at% Re optimized samples (left), b) Box plot of σ area percent as a function of SPS dwell time for W-25 at% Re optimized samples (right)
The grain sizes of the optimized samples exhibited an inverse correlation between rhenium content and grain growth as seen in Figure 59. For 30 minute sintering dwell, the W-3 at% Re reached an average grain size of approximately 8 μm while the W-25 at% Re samples were determined to be 5.5 μm. The values measured for the W-25 at% Re were only slightly larger than those found for the blended and milled sample grain sizes determined previously.
Figure 59. Grain size as a function of SPS dwell time for optimized W-xRe samples
For the optimized samples, it is evident that the addition of rhenium restricts the grain size of tungsten. This decrease agrees with other work in the literature, as Ramalingham and Jacobson
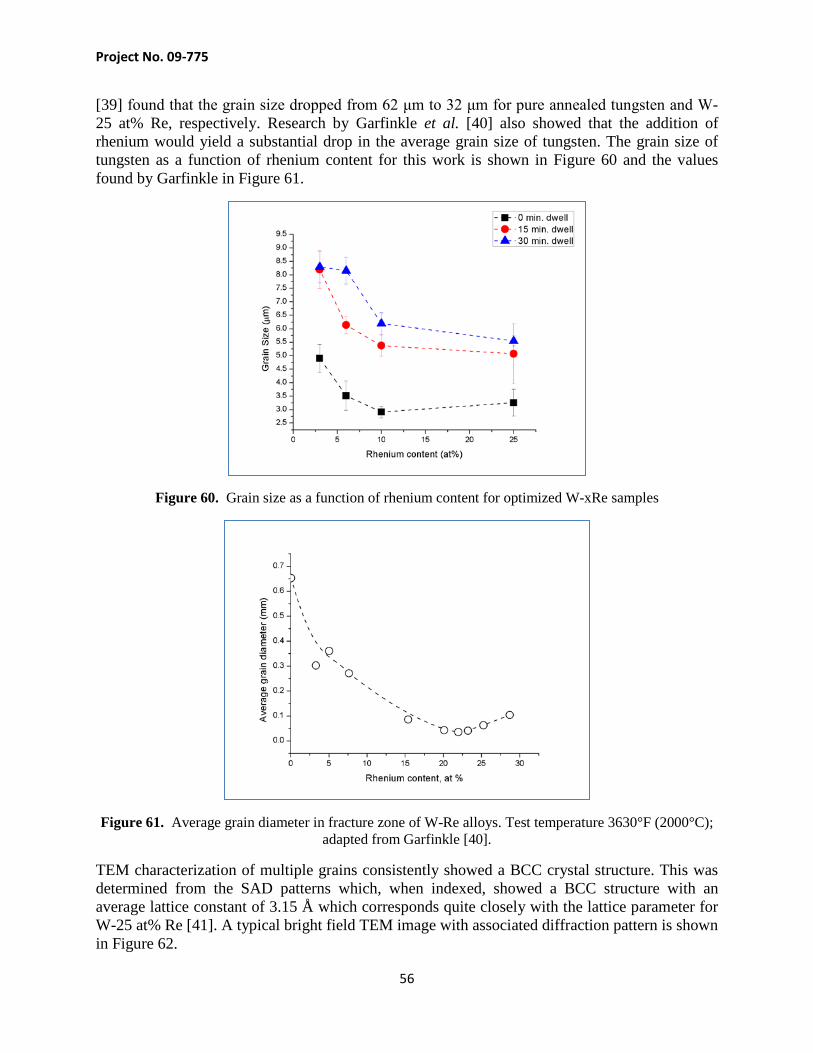
Project No. 09-775
56
[39] found that the grain size dropped from 62 μm to 32 μm for pure annealed tungsten and W-25 at% Re, respectively. Research by Garfinkle et al. [40] also showed that the addition of rhenium would yield a substantial drop in the average grain size of tungsten. The grain size of tungsten as a function of rhenium content for this work is shown in Figure 60 and the values found by Garfinkle in Figure 61.
Figure 60. Grain size as a function of rhenium content for optimized W-xRe samples
Figure 61. Average grain diameter in fracture zone of W-Re alloys. Test temperature 3630°F (2000°C); adapted from Garfinkle [40].
TEM characterization of multiple grains consistently showed a BCC crystal structure. This was determined from the SAD patterns which, when indexed, showed a BCC structure with an average lattice constant of 3.15 Å which corresponds quite closely with the lattice parameter for W-25 at% Re [41]. A typical bright field TEM image with associated diffraction pattern is shown in Figure 62.

Project No. 09-775
57
Figure 62. Bright field TEM image with SAD insert of optimized W-25 at% Re sample (zone axis = [010])
The σ-phase characterization using SEM/BSE characterization suggested that the alloys were homogeneous within a 15 to 30 minute dwell time. For a higher magnification analysis, the grain boundaries of a W-25 at% Re sample consolidated for 30 minutes was examined for intermetallic precipitates using TEM imaging. Across the area prepared by the FIB, there were no noticeable precipitates. Figure 63 shows two typical grain boundaries similar to those seen in the prepared membrane.
Figure 63. TEM bright field images of optimized W-25 at% Re sample consolidated with 30 minute dwell time
STEM/EDS results showed a uniform rhenium distribution across each indexed grain (Figure 64). The elemental analysis indicated that the rhenium concentration was 16.6 at%. The analysis also showed a Zn concentration of 8.4 at%, and, after viewing the x-ray spectrum from the scan, it was determined that it is likely the software confused the Re and Zn peaks which share a degree of overlap. The combination of the concentrations is 25.0 at% which lends further credence to that theory. The elemental concentrations and x-ray spectrum can be seen in Table 9 and Figure 65, respectively.

Project No. 09-775
58
Figure 64. STEM/EDS area scans showing image, tungsten, and rhenium distributions (left to right)
Table 9. Elements found in STEM/EDS area scan
Element Net Weight % Atom % Atom %
Line Counts Error
Co K 344 0.31 0.92 +/- 0.23
Zn K 3649 3.18 8.42 +/- 1.50
W L 65878 78.69 74.1 +/- 1.14
Re L 14499 17.81 16.56 +/- 1.27
Total 100 100
Figure 65. Energy Dispersive X-Ray spectrum found during STEM/EDS area scan

Project No. 09-775
59
The scan also showed trace amounts of Co which was also uniformly distributed throughout each grain. This contamination was initially believed to be from the binder phase in the WC-6Co milling media and vessel. However, area scans were performed on the same sample using a higher resolution EDS system than the ISIS system used to scan the optimized samples. The 191 μm x 255 μm area scan showed no Co or Zn contamination so the values measured in the TEM /EDS are likely erroneous.
Subtask B3. Mechanical Testing
B3.1. Hardness of Tungsten Samples
The specimens were measured for microhardness using a 500 gram load, which was also plotted as a function of applied stress in Figure 66. Each specimen underwent between 25 and 30 microhardness tests as a function of radial position, starting at the specimen center and protruding outwards. The average microhardness was determined and is used for this study. It is important to note that the specimens were polished to a 1200 grit level using SiC grinding paper and then further polished for 48 hours in a colloidial silica solution prior to microhardness measurements to ensure that surface morphology did not affect the measured hardness. The hardness ranged from ~392 kg/mm2 at a stress of 20 MPa to 428.5 kg/mm2 at 70 MPa, followed by a small drop to 421.7 kg/mm2 at 80 MPa. As with the grain size, it is likely that the microhardness is responding to the relative density and not the applied stress.
Figure 66. Microhardness vs. applied stress in SPSed samples
Figure 67 shows the microhardness for specimens fabricated at each temperature and hold time. The hardness of the specimens consolidated at 1819 K, seem to increase in a monotonic fashion; however, the specimens consolidated at 1911 K have a lower hardness than those fabricated at 1819 K. This decrease in hardness is likely due to the increase in grain size. The specimens consolidated at 2004 K display a behavior like that of the 1819 K specimens and have the highest hardness of the specimens fabricated during the time-temp study.
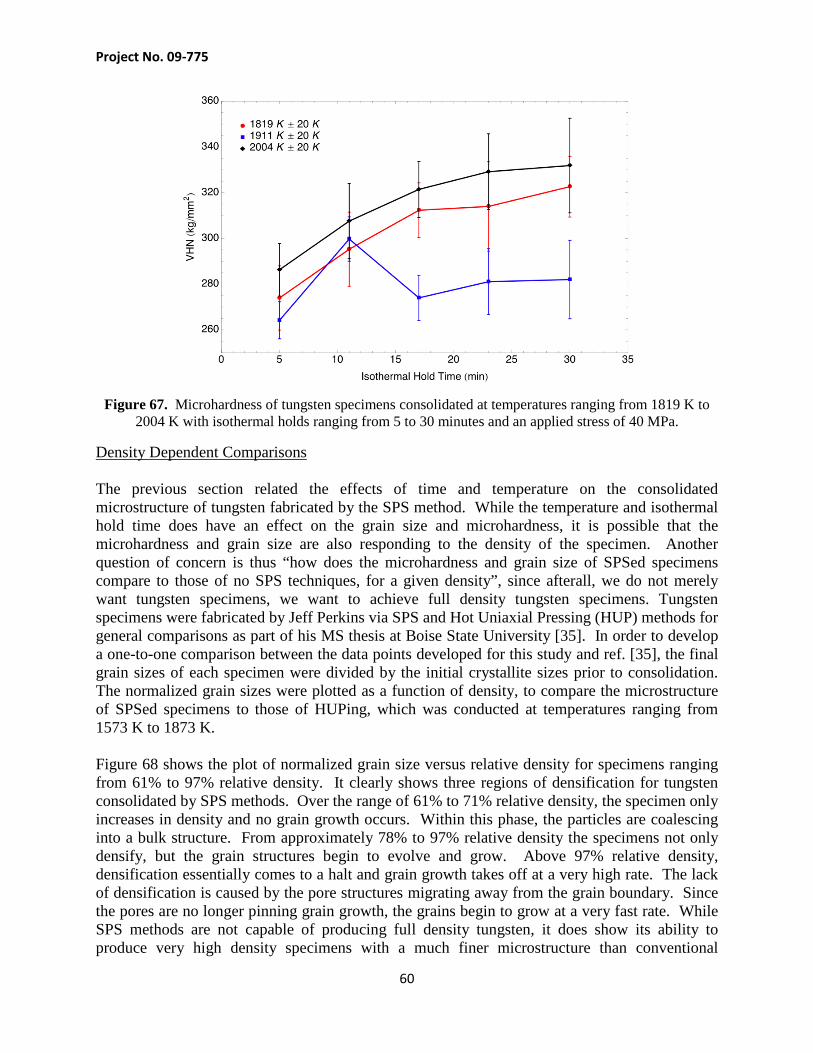
Project No. 09-775
60
Figure 67. Microhardness of tungsten specimens consolidated at temperatures ranging from 1819 K to 2004 K with isothermal holds ranging from 5 to 30 minutes and an applied stress of 40 MPa.
Density Dependent Comparisons The previous section related the effects of time and temperature on the consolidated microstructure of tungsten fabricated by the SPS method. While the temperature and isothermal hold time does have an effect on the grain size and microhardness, it is possible that the microhardness and grain size are also responding to the density of the specimen. Another question of concern is thus “how does the microhardness and grain size of SPSed specimens compare to those of no SPS techniques, for a given density”, since afterall, we do not merely want tungsten specimens, we want to achieve full density tungsten specimens. Tungsten specimens were fabricated by Jeff Perkins via SPS and Hot Uniaxial Pressing (HUP) methods for general comparisons as part of his MS thesis at Boise State University [35]. In order to develop a one-to-one comparison between the data points developed for this study and ref. [35], the final grain sizes of each specimen were divided by the initial crystallite sizes prior to consolidation. The normalized grain sizes were plotted as a function of density, to compare the microstructure of SPSed specimens to those of HUPing, which was conducted at temperatures ranging from 1573 K to 1873 K. Figure 68 shows the plot of normalized grain size versus relative density for specimens ranging from 61% to 97% relative density. It clearly shows three regions of densification for tungsten consolidated by SPS methods. Over the range of 61% to 71% relative density, the specimen only increases in density and no grain growth occurs. Within this phase, the particles are coalescing into a bulk structure. From approximately 78% to 97% relative density the specimens not only densify, but the grain structures begin to evolve and grow. Above 97% relative density, densification essentially comes to a halt and grain growth takes off at a very high rate. The lack of densification is caused by the pore structures migrating away from the grain boundary. Since the pores are no longer pinning grain growth, the grains begin to grow at a very fast rate. While SPS methods are not capable of producing full density tungsten, it does show its ability to produce very high density specimens with a much finer microstructure than conventional

Project No. 09-775
61
processing techniques such as Hot Uniaxial Pressing (HUPing). The normalized grain size of tungsten fabricated by HUP methods is significantly larger than that of tungsten fabricated by SPS methods, making SPS very attractive for the fabrication of nuclear fuels such as W-UO2 fuel types where a fine microstructure is required. While the SPS method will not be able to achieve full density tungsten or W-UO2 structures, it is likely that post processing techniques may be able to complete the densification while minimizing grain growth. Even though crystallite size may not have much influence during the early stage of sintering, nonetheless it gives a compelling trend. More work need to be done to ascertain whether this understand the effect.
Figure 68. Normalized grain size versus relative density for tungsten specimens fabricated by SPS (or SPS) and HUP methods.
The specimen hardness was also investigated as a function of density and grain size. Figure 69 shows a plot of hardness vs. relative density, which indicates a linear relationship between the two parameters. However, some data has indicated that the grain size also has an effect on the hardness. The data was fitted to a three-dimensional plot to investigate the relationship between density, grain size and hardness. The data indicates that there is a slight correlation between grain size and hardness; however, the effect of density is far more pronounced. Figure 70 shows the plot of hardness vs. density vs. grain size, which seems to indicate that prior to pore-boundary separation, the specimen hardness is dominantly a function of density, but above the saturation density (where pore-boundary separation occurs) the hardness is a function of grain size.
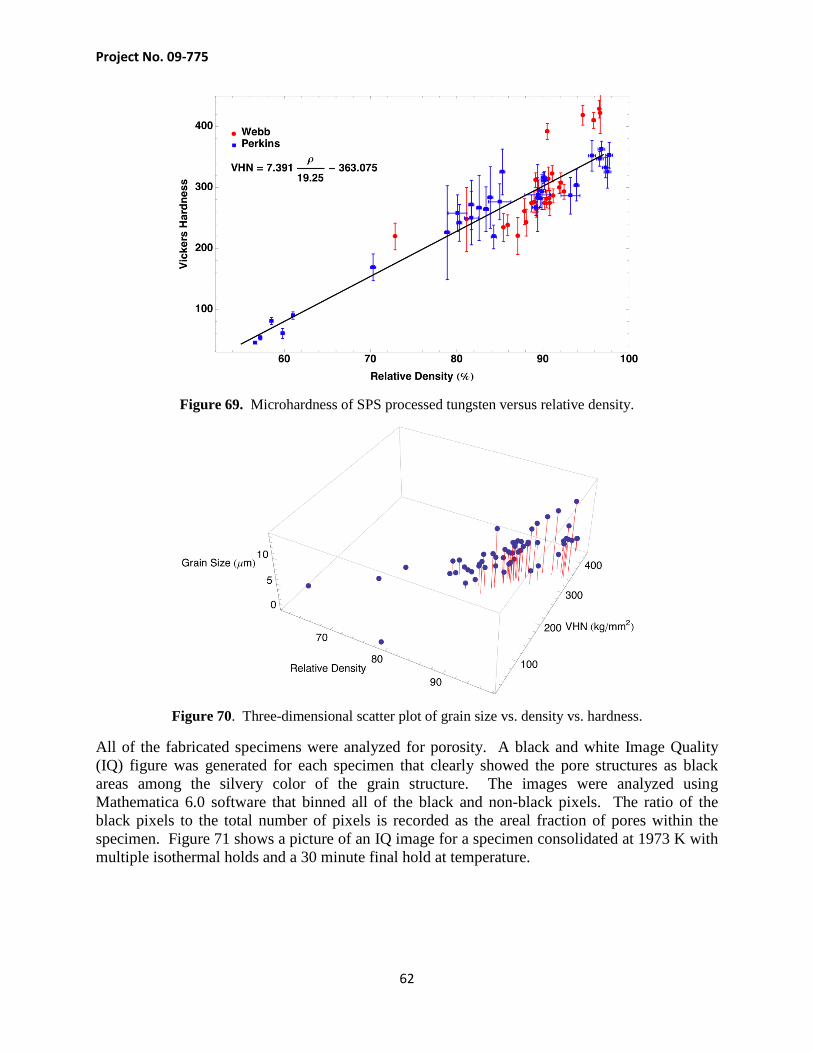
Project No. 09-775
62
Figure 69. Microhardness of SPS processed tungsten versus relative density.
Figure 70. Three-dimensional scatter plot of grain size vs. density vs. hardness.
All of the fabricated specimens were analyzed for porosity. A black and white Image Quality (IQ) figure was generated for each specimen that clearly showed the pore structures as black areas among the silvery color of the grain structure. The images were analyzed using Mathematica 6.0 software that binned all of the black and non-black pixels. The ratio of the black pixels to the total number of pixels is recorded as the areal fraction of pores within the specimen. Figure 71 shows a picture of an IQ image for a specimen consolidated at 1973 K with multiple isothermal holds and a 30 minute final hold at temperature.
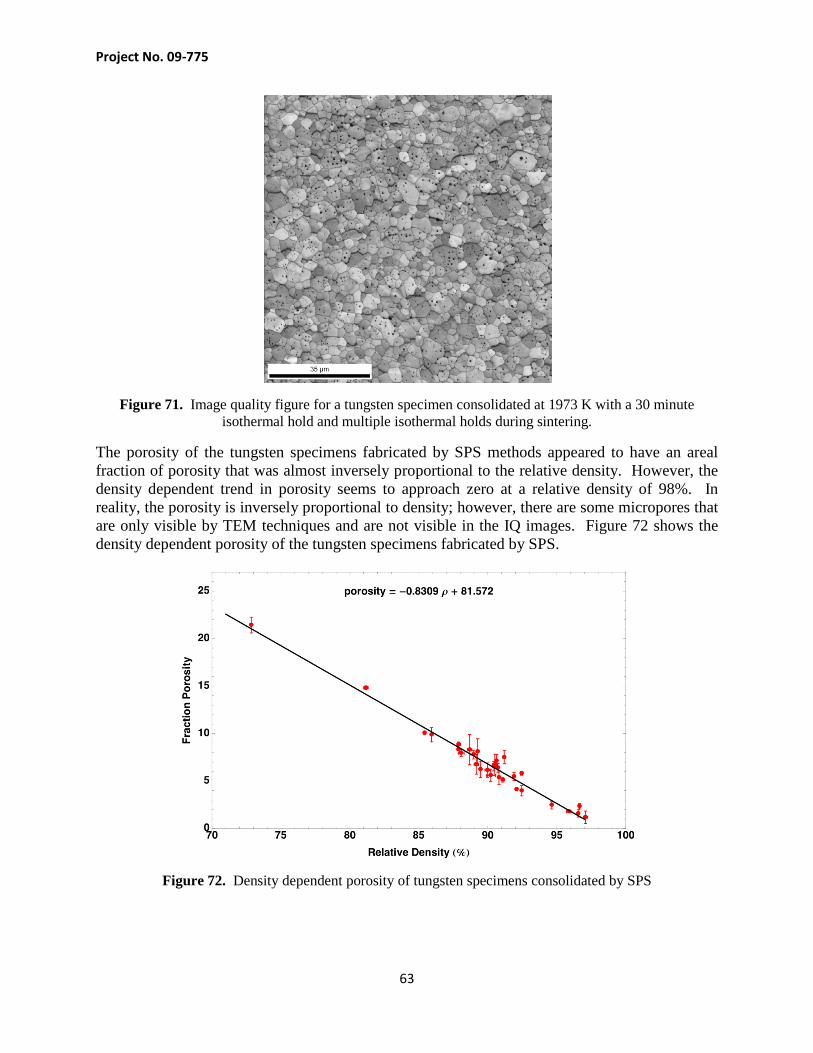
Project No. 09-775
63
Figure 71. Image quality figure for a tungsten specimen consolidated at 1973 K with a 30 minute isothermal hold and multiple isothermal holds during sintering.
The porosity of the tungsten specimens fabricated by SPS methods appeared to have an areal fraction of porosity that was almost inversely proportional to the relative density. However, the density dependent trend in porosity seems to approach zero at a relative density of 98%. In reality, the porosity is inversely proportional to density; however, there are some micropores that are only visible by TEM techniques and are not visible in the IQ images. Figure 72 shows the density dependent porosity of the tungsten specimens fabricated by SPS.
Figure 72. Density dependent porosity of tungsten specimens consolidated by SPS
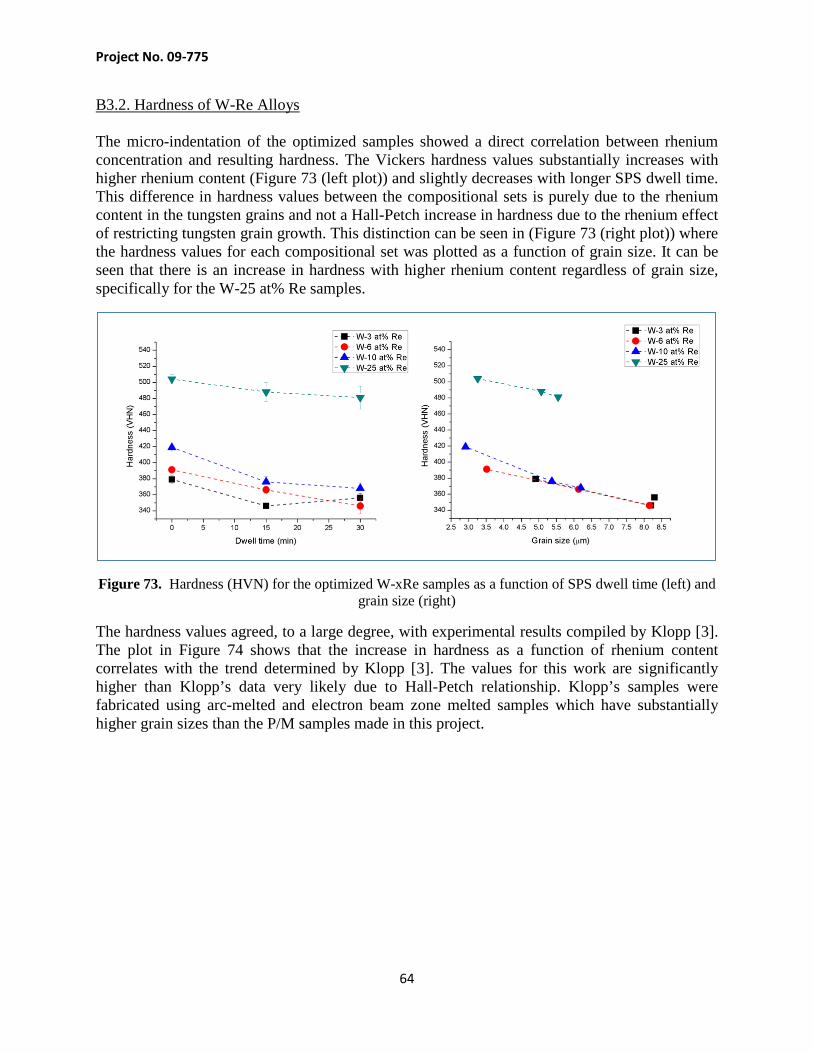
Project No. 09-775
64
B3.2. Hardness of W-Re Alloys The micro-indentation of the optimized samples showed a direct correlation between rhenium concentration and resulting hardness. The Vickers hardness values substantially increases with higher rhenium content (Figure 73 (left plot)) and slightly decreases with longer SPS dwell time. This difference in hardness values between the compositional sets is purely due to the rhenium content in the tungsten grains and not a Hall-Petch increase in hardness due to the rhenium effect of restricting tungsten grain growth. This distinction can be seen in (Figure 73 (right plot)) where the hardness values for each compositional set was plotted as a function of grain size. It can be seen that there is an increase in hardness with higher rhenium content regardless of grain size, specifically for the W-25 at% Re samples.
Figure 73. Hardness (HVN) for the optimized W-xRe samples as a function of SPS dwell time (left) and grain size (right)
The hardness values agreed, to a large degree, with experimental results compiled by Klopp [3]. The plot in Figure 74 shows that the increase in hardness as a function of rhenium content correlates with the trend determined by Klopp [3]. The values for this work are significantly higher than Klopp’s data very likely due to Hall-Petch relationship. Klopp’s samples were fabricated using arc-melted and electron beam zone melted samples which have substantially higher grain sizes than the P/M samples made in this project.
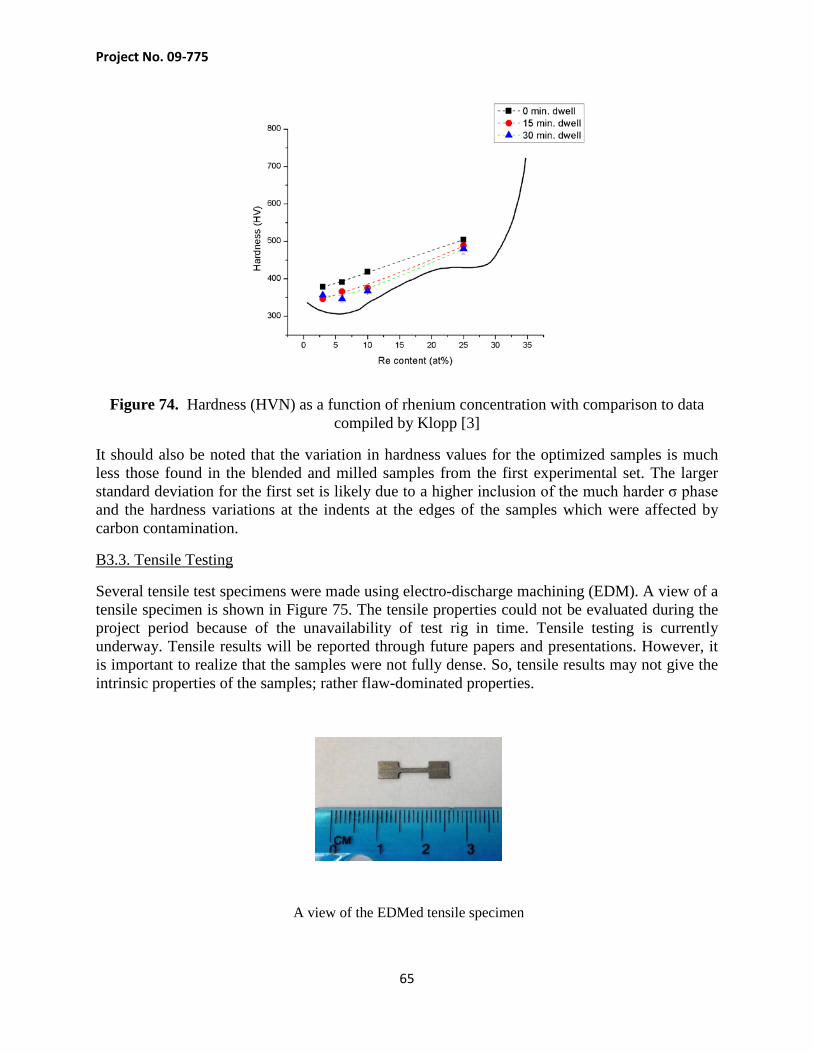
Project No. 09-775
65
Figure 74. Hardness (HVN) as a function of rhenium concentration with comparison to data compiled by Klopp [3]
It should also be noted that the variation in hardness values for the optimized samples is much less those found in the blended and milled samples from the first experimental set. The larger standard deviation for the first set is likely due to a higher inclusion of the much harder σ phase and the hardness variations at the indents at the edges of the samples which were affected by carbon contamination.
B3.3. Tensile Testing
Several tensile test specimens were made using electro-discharge machining (EDM). A view of a tensile specimen is shown in Figure 75. The tensile properties could not be evaluated during the project period because of the unavailability of test rig in time. Tensile testing is currently underway. Tensile results will be reported through future papers and presentations. However, it is important to realize that the samples were not fully dense. So, tensile results may not give the intrinsic properties of the samples; rather flaw-dominated properties.
A view of the EDMed tensile specimen
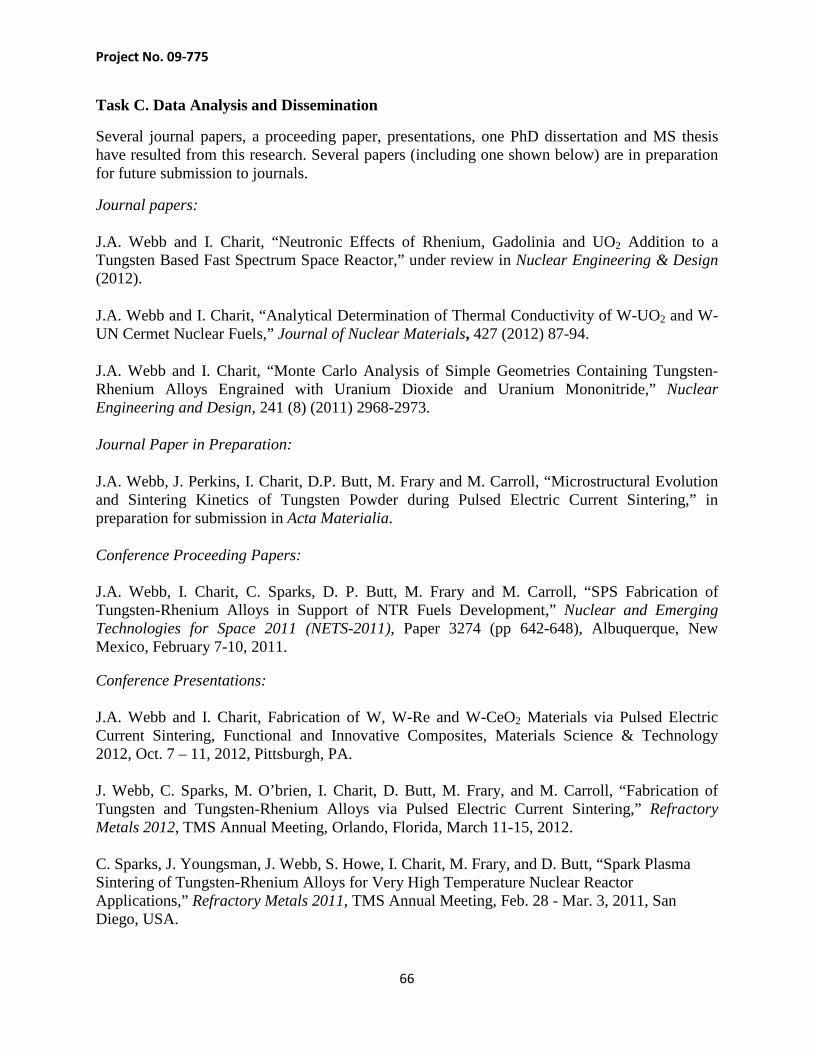
Project No. 09-775
66
Task C. Data Analysis and Dissemination
Several journal papers, a proceeding paper, presentations, one PhD dissertation and MS thesis have resulted from this research. Several papers (including one shown below) are in preparation for future submission to journals.
Journal papers:
J.A. Webb and I. Charit, “Neutronic Effects of Rhenium, Gadolinia and UO2 Addition to a Tungsten Based Fast Spectrum Space Reactor,” under review in Nuclear Engineering & Design (2012).
J.A. Webb and I. Charit, “Analytical Determination of Thermal Conductivity of W-UO2 and W-UN Cermet Nuclear Fuels,” Journal of Nuclear Materials, 427 (2012) 87-94.
J.A. Webb and I. Charit, “Monte Carlo Analysis of Simple Geometries Containing Tungsten-Rhenium Alloys Engrained with Uranium Dioxide and Uranium Mononitride,” Nuclear Engineering and Design, 241 (8) (2011) 2968-2973.
Journal Paper in Preparation:
J.A. Webb, J. Perkins, I. Charit, D.P. Butt, M. Frary and M. Carroll, “Microstructural Evolution and Sintering Kinetics of Tungsten Powder during Pulsed Electric Current Sintering,” in preparation for submission in Acta Materialia.
Conference Proceeding Papers: J.A. Webb, I. Charit, C. Sparks, D. P. Butt, M. Frary and M. Carroll, “SPS Fabrication of Tungsten-Rhenium Alloys in Support of NTR Fuels Development,” Nuclear and Emerging Technologies for Space 2011 (NETS-2011), Paper 3274 (pp 642-648), Albuquerque, New Mexico, February 7-10, 2011. Conference Presentations: J.A. Webb and I. Charit, Fabrication of W, W-Re and W-CeO2 Materials via Pulsed Electric Current Sintering, Functional and Innovative Composites, Materials Science & Technology 2012, Oct. 7 – 11, 2012, Pittsburgh, PA. J. Webb, C. Sparks, M. O’brien, I. Charit, D. Butt, M. Frary, and M. Carroll, “Fabrication of Tungsten and Tungsten-Rhenium Alloys via Pulsed Electric Current Sintering,” Refractory Metals 2012, TMS Annual Meeting, Orlando, Florida, March 11-15, 2012. C. Sparks, J. Youngsman, J. Webb, S. Howe, I. Charit, M. Frary, and D. Butt, “Spark Plasma Sintering of Tungsten-Rhenium Alloys for Very High Temperature Nuclear Reactor Applications,” Refractory Metals 2011, TMS Annual Meeting, Feb. 28 - Mar. 3, 2011, San Diego, USA.

Project No. 09-775
67
J. Webb, I. Charit, C. Sparks, D. Butt, M. Frary, and M. Carroll, “Physical and Mechanical Properties of Tungsten-Rhenium Produced via Spark Plasma Sintering,” Refractory Metals 2011, TMS Annual Meeting, Feb. 28 - Mar. 3, 2011, San Diego, USA.
I. Charit and J. Webb, “Tungsten-Rhenium Super Alloy Development for Ultra High Temperature Space Fission and Fusion Reactors,” Advanced Materials and Fuels Enabling Future Fusion, Fission and Hybrid Reactor Systems, TMS Annual Meeting, Seattle, Feb. 14-18, 2010. MS Thesis Cory C. Sparks, “Fabrication of Sold Solution Tungsten-Rhenium Alloys by High Energy Ball Milling and Spark Plasma Sintering,” MS Thesis, Boise State University, Boise, ID, August 2012.
PhD Dissertation Jonathan A. Webb, “Analysis and Fabrication of Tungsten Cermet Materials for Ultra-High Temperature Reactor Applications via Pulsed Electric Current Sintering,” PhD Dissertation, University of Idaho, Idaho Falls, June 2012.
3. Technical Summary
Tungsten-rhenium alloys were successfully milled and consolidated using spark plasma sintering (SPS) with little to no intermetallic content (σ-phase), minimal grain growth, and close to theoretical densities. Previous work has demonstrated that σ-phase in tungsten-rhenium alloys leads to undesirable mechanical properties. This work established the relative effects of milling energy, SPS consolidation temperatures and dwell times on the percentage of σ-phase and microstructure in alloys with rhenium contents varying from 3 to 25 at%. Processing parameters were optimized in order to yield aforementioned ideal microstructural characteristics. Detailed microstructural characterization of the powders and the sintered products led to the following conclusions:
1. It was demonstrated that SPS can rapidly fabricate W-Re alloys with high densities and desirable microstructural features. The W-Re alloys were consolidated to near theoretical density during the ramps to the hold temperatures and consequently minimal dwell times were required to achieve full density. During the hold, the density drops and this is believed to be predominately due to the diffusional influx of carbon from the graphite paper surrounding the test coupons. This contamination can be avoided by using a refractory metal foil such as molybdenum, tantalum or niobium, which have much smaller diffusivities in tungsten. Some samples using niobium foil needed less removale of surface layers through grinding.
2. The relative effects of SPS temperature and ball milling energy on alloy characteristics, specifically σ-phase content, were determined. Both milling at higher energies and sintering at higher temperatures were found to be effective means to reduce the percentage of σ-phase content. Parameters ideal to removing σ-phase while keeping other alloy characteristics acceptable were found to be milling at 400 rpm for 30 hrs and
Project No. 09-775
68
sintering at 1800°C for 0 to 30 minutes. The optimized parameters for both milling and sintering were determined by balancing the target of having no σ-phase and minimizing grain growth, and minimizing contamination associated with milling and reactions with dies and punches. An additional consideration is maximizing the life of the SPS sintering system, which includes the graphite punches and dies, consequently low temperatures are desirable.
3. Under optimized milling and SPS conditions, tungsten-rhenium alloys were produced with no σ-phase, for all compositions investigated. In addition, all samples were produced at near theoretical density, with relatively small grain size (approximately 3-8 μm) and correspondingly with high values of hardness, yielding a superior tungsten-rhenium alloy.
4. It is suggested that heterogeneities, namely regions of high rhenium content, lead to the formation of the undesirable σ-phase. Microstructural characterization of the morphology of the tungsten-rhenium powders used in this study by SEM/BSE demonstrated that during high-energy planetary ball milling individual tungsten and rhenium crystallites both reduce the particle size and deformed and embedded crystallites into one another, often producing a fine-grained, layered powder microstructure. This powder morphology helped to lower the diffusional pathway distance for rhenium atoms, which assisted in both sintering and homogenization of the alloys, thus enabling the ability to fabricate σ-phase free alloys. In addition, the uniquely rapid thermal ramp rates achievable in SPS restricted grain growth while high densities were achieved, leading to superior mechanical properties.
This project focused on the development of a fabrication process for tungsten and tungsten-rhenium alloys via spark plasma sintering process. The optimum high energy ball milling parameters along with SPS parameters were determined to produce the best combination of density and grain size while minimizing or eliminating the formation of deleterious sigma/chi phases. It is noted that that high density samples can be produced following this new processing route. But the current SPS dies and punches (made of graphite) cannot sustain higher temperature and higher pressure that would be needed to produce fully dense samples. Improvement in the die and punch materials cannot definitely improve the density of the samples. Presence of rhenium in tungsten helps to maintain a fine grain microstructure. Even though neutronic calculations and predictive capabilities of some thermophysical properties have been developed for cermet materials, their development was not the focus of this project. The journal papers listed in Task C have more information in this area.
4. Future Work
Future work involves further mechanical and thermophysical testing of the tungsten and tungsten-rhenium samples produced during the course of the project. Eventually, the efficacy of tungsten and tungsten-rhenium alloy cladding and fuel matrix materials need to be tested by encapsulating uranium dioxide or uranium mononitride pellets using SPS. Even though some work on tungsten-ceria (surrogate fuels) have been accomplished and some predictive

Project No. 09-775
69
capabilities of physical properties of these materials have been developed, there will be host of issues that need to be addressed including irradiation testing as part of the future work.
5. Training/Educational Components
Two graduate students received graduate degrees working on the project – Jonathan A. Webb obtained his PhD in Nuclear Engineering from the University of Idaho and Cory C. Sparks got his MS degree in Materials Science & Engineering from the Boise State University. One MS student (Nathan Jerred) was partially supported by the project in the initial period. Another graduate student (Somayeh Pasebani) worked half-time during the summer 2012 to do some additional fabrication done given the completion of studies by the graduate students. The students were trained on various instruments such as Spark Plasma Sintering machine and various microstructural/mechanical characterization instruments. Several undergraduate students (Mary O’brien, Sweta Khanal, Robert Meine, Amey Shigrekar and more) worked on the project from time to time providing valuable assistance.
6. Acknowledgment
We would like to acknowledge help of all starting from the personnel at DOE and Idaho National Laboratory. We also acknowledge the assistance provided a number of people (too many to name here) at different institutions during the course of this project. This research was performed using the funding received from the DOE Office of Nuclear Energy’s Nuclear Energy University Programs.
7. References
[1] T.G. Nieh and J. Wadsworth, Materials Research Society, Boston, MA, USA, Nov. 29-Dec. 1, 1993.
[2] W.E. Sanders and I.L. Drell, “Compatibility of Molten Uranium Dioxide with Refractory Metals,” NASA Technical Note D-4955, p. 9-10, NASA, Washington D.C. (1968).
[3] W. D. Klopp, “Review of Ductilizing of Group VIA Elements by Rhenium and Other solutes,” Lewis Research Center report NASA TN D-4955 (1968).
[4] K. Inoue, US Patent # 3241956 (1966).
[5] K. Inoue, US Patent # 3250892 (1966).
[6] M. Omori, Materials Science and Engineering, A287 (2000) 183.
[7] Cory C. Sparks, “Fabrication of Sold Solution Tungsten-Rhenium Alloys by High Energy Ball Milling and Spark Plasma Sintering,” MS Thesis, Boise State University, August 2012.
[8] Z.A. Munir, U. Anselmi-Tamburini and M. Ohyanagi, Journal of Materials Science, 41 (2006) 763.
Project No. 09-775
70
[9] K. Ozaki, K. Kobyashi, T. Nishino, A. Matsumoto, and A. Sugiyama, J. Japan Soc. Powder Metallurgy, 47 (2000) 293.
[10] H. Tomino, H. Watanabe and Y. Kondo, J. Japan Soc. Powder Metallurgy, 44 (1997) 974.
[11] M. Tokita, New Ceramics, 7 (1994) 63.
[12] O. Yanagisawa, H. Kuramoto, K. Matsugi and M. Komatsu, Mater. Sci. Eng., A350 (2003) 184.
[13] E. Olevsky and L. Froyen, Scripta Materialia, 55 (2006) 1175.
[14] Z. Qiaoxin, S. Xialiang, Y. Hua and D. Xinglong, Journal of Wuhan University of Technology, 23 (2008) 399.
[15] S. Qiang, Z. Liameng, T. Hua and J. Fugian, Journal of University of Science and Technology, Beijing: Mineral, Metallurgy Materials, 10 (2003) 35.
[16] E. Oda, F. Horoshi, A. Kei and Y. Satoshi, Journal of the Japan Institute of Metals, 69 (2005) 967.
[17] E. Oda, T. Ohtaki, A. Koruda, H. Fujiwara, K. Ameyama, K. Yoshida, Advanced Materials Research, 15-17 (2007) 564.
[18] B. C. Allen, D. J. Maykuth, and R. I. Jaffee, “The Recrystallization and Ductile-Brittle Transition Behaviour of Tungsten,” J. Inst. Metals, 90 [4] (1961) 120.
[19] K. R. Anderson, J. R. Groza, M. Fendorf, and C. J. Echer, “Surface oxide debonding in field assisted powder sintering,” Materials Science and Engineering: A, 270 [2] (1999) 278.
[20] E. Lassner and W. D. Schubert, "Tungsten: Properties, Chemistry, Technology of the Element, Alloys and Chemical Compounds." Kluwer Academic/Plenum Publishers: New York, 1999.
[21] R. Yan, F. Chu, Q. Ma, X. Liu and G. Meng, “Sintering Kinetics of Samarium Doped Ceria with Addition of Cobalt Oxide”, Materials Letters 60 (2006) 3605.
[31] E.A. Olevsky and L. Froyen, “Impact of Thermal Diffusion on Densification during SPS,” J. Am. Ceram. Soc., 92[S1] (2009) S122.
[33] E. Olevsky, S. Kandukuri and L. Froyen, “Consolidation Enhancement in Spark Plasma Sintering: Impact of High Heating Rates,” J. App. Phys 102 (2007) 114913.
[34] J. E. White and M. M. Jurkowitz, “Hot pressing of tungsten powder,” Met. Soc. Conf.,Vol. 30: pp: 291-4, 1966.

Project No. 09-775
71
[35] J.B. Perkins, “Spark Plasma Sintering of Tungsten and Tungsten-Ceria: Microstructures and Kinetics, MS Thesis, Boise State University, Boise, ID, Aug. 2011.
[36] C. Wilson, "Order in binary sigma-phases," Acta Crystallographica, 16 [8] (1963) 724.
[37] C. Berne, M. Sluiter, Y. Kawazoe, T. Hansen, and A. Pasturel, "Site occupancy in the Re-W sigma phase," Physical Review B, 64 [14] (2001) 144103.
[38] D. W. Smith and R. F. Hehemann, "Kinetics of alloy formation in sintered tungsten-rhenium powder compacts," Transactions of the Metallurgical Society of AIME, Vol: 236, (1966) 506.
[39] M. L. Ramalingam and D. L. Jacobson, "Elevated temperature softening of progressively annealed and sintered W-Re alloys," Journal of the Less Common Metals, 123 [1-2] (1986) 153.
[40] M. Garfinkle, W. R. Witzke, and W. D. Klopp, "Superplasticity in tungsten-rhenium alloys," Transactions of the Metallurgical Society of AIME Vol. 245 (1969) 303.
[41] S. S. Budagovskiy, V. N. Bykov, M. I. Gavrilyuk, andV. N. Pod"yachev, "Some electron structure characteristics of W-Re solid solutions,” NASA technical translation report NASA TT F-15, 214 (1973).

Project No. 09-775
72
8. Appendix
Table A1. Sintered parameters for tungsten powder heated in the SPS at 50 K/minute.
Temp. (K) Pressure
(MPa)
Hold Time (min) Density (%)
Hardness (VHN)
Grain Size (µm)
1449 ± 15 42 2 72.85 ± 0.50 216.67 ± 31.85 0.47 ± 0.05 1541 ± 15 42 2 81.16 ± 0.40 247.44 ± 52.71 0.64 ± 0.04 1634 ± 15 42 2 85.41 ± 0.50 234.17 ± 22.85 1.65 ± 0.24 1726 ± 15 42 2 85.92 ± 0.40 238.20 ± 16.99 4.72 ± 0.22 1819 ± 20 42 2 87.09 ± 0.17 220.55 ± 30.27 6.74 ± 0.98 1911 ± 20 42 2 88.07 ± 0.40 242.44 ± 22.02 7.32 ± 0.33 2004 ± 20 42 2 87.87 ± 1.40 260.44 ± 21.27 11.07 ± 0.42 1819 ± 20 42 5 88.68 ±0.61 273.96 ± 14.06 4.87 ± 0.57 1819 ± 20 42 11 89.47 ± 0.21 295.26 ± 16.23 4.83 ± 0.38 1819 ± 20 42 17 89.16 ± 0.61 312.31 ± 11.98 5.09 ± 0.47 1819 ± 20 42 23 90.63 ± 0.35 314.00 ± 19.54 5.47 ± 0.27 1819 ± 20 42 30 91.08 ± 0.48 322.63 ± 13.29 5.63 ± 0.39 1911 ± 20 42 5 89.26 ± 0.19 264.17 ± 12.82 7.30 ± 0.89 1911 ± 20 42 11 90.40 ± 0.12 299.73 ± 19.67 7.57 ± 0.93 1911 ± 20 42 17 90.73 ± 1.25 274.00 ± 19.91 8.42 ± 0.79 1911 ± 20 42 23 91.72 ± 0.43 281.07 ± 14.42 8.14 ± 1.03 1911 ± 20 42 30 93.73 ± 0.13 282.00 ± 17.17 8.46 ± 0.56 2004 ± 20 42 5 91.19 ± 0.38 286.31 ± 11.48 8.22 ± 0.46 2004 ± 20 42 11 92.09 ± 0.21 307.67 ± 16.43 9.78 ± 0.64 2004 ± 20 42 17 92.46 ± 0.17 293.07 ± 12.24 10.23 ± 0.74 2004 ± 20 42 23 93.88 ± 0.59 272.48 ± 16.57 11.54 ± 0.18 2004 ± 20 42 30 95.50 ± 0.60 274.60 ± 20.68 13.03 ± 0.02
Table A2. Sintered parameters for tungsten powder sintered by SPS at various pressures and 100 K/minute with 2 minute isothermal holds every 100 K starting at 1173 K.
Temp. (K) Pressure
(MPa)
Hold Time (min) Density (%)
Hardness (VHN)
Grain Size (µm)
2004 ± 20 20 2 90.51 ± 0.19 391.87 ± 13.31 1.76 ± 0.99 2004 ± 20 40 2 94.64 ± 0.04 410.10 ± 13.10 2.43 ± 1.32 2004 ± 20 60 2 95.90 ± 0.21 418.37 ± 16.10 2.53 ± 1.41 2004 ± 20 70 2 96.55 ± 0.06 428.53 ± 14.57 2.56 ± 1.38 2004 ± 20 80 2 96.65 ± 0.06 421.72 ± 32.82 2.98 ± 1.73
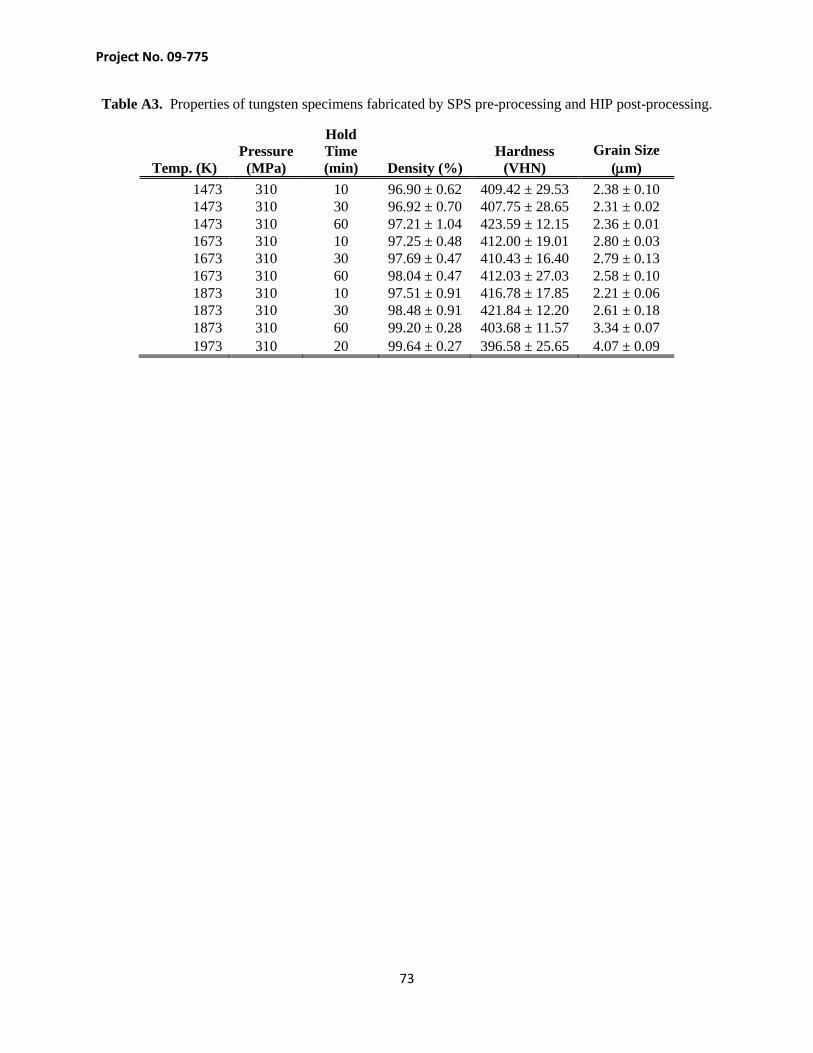
Project No. 09-775
73
Table A3. Properties of tungsten specimens fabricated by SPS pre-processing and HIP post-processing.
Temp. (K) Pressure
(MPa)
Hold Time (min) Density (%)
Hardness (VHN)
Grain Size (µm)
1473 310 10 96.90 ± 0.62 409.42 ± 29.53 2.38 ± 0.10 1473 310 30 96.92 ± 0.70 407.75 ± 28.65 2.31 ± 0.02 1473 310 60 97.21 ± 1.04 423.59 ± 12.15 2.36 ± 0.01 1673 310 10 97.25 ± 0.48 412.00 ± 19.01 2.80 ± 0.03 1673 310 30 97.69 ± 0.47 410.43 ± 16.40 2.79 ± 0.13 1673 310 60 98.04 ± 0.47 412.03 ± 27.03 2.58 ± 0.10 1873 310 10 97.51 ± 0.91 416.78 ± 17.85 2.21 ± 0.06 1873 310 30 98.48 ± 0.91 421.84 ± 12.20 2.61 ± 0.18 1873 310 60 99.20 ± 0.28 403.68 ± 11.57 3.34 ± 0.07 1973 310 20 99.64 ± 0.27 396.58 ± 25.65 4.07 ± 0.09