Embed Size (px)
Citation preview

Available online at www.sciencedirect.com
www.elsevier.com/locate/jmbbm
j o u r n a l o f t h e m e c h a n i c a l b e h a v i o r o f b i o m e d i c a l m a t e r i a l s ] ( ] ] ] ] ) ] ] ] – ] ] ]
1751-6161/$ - see frohttp://dx.doi.org/10
nCorresponding autE-mail address:
Please cite thisnanotube arrayj.jmbbm.2013.01.
Research Paper
Fabrication and deformation behaviour of multilayer Al2O3/Ti/TiO2 nanotube arrays
S. Baradarana,n, W.J. Basirunb,d, E. Zalnezhada, M. Hamdic, Ahmed A.D. Sarhanc, Y. Aliasb
aDepartment of Engineering Design and Manufacture, Faculty of Engineering University of Malaya, 50603 Kuala Lumpur, MalaysiabDepartment of Chemistry, Faculty of Science, University of Malaya, Kuala Lumpur 50603, MalaysiacCenter of Advanced Manufacturing and Material Processing, University of Malaya, 50603 Kuala Lumpur, MalaysiadNanotechnology & Catalysis Research Centre (NanoCat), Institute of Postgraduate Studies, University Malaya, 50603 Kuala Lumpur,
Malaysia
a r t i c l e i n f o
Article history:
Received 24 September 2012
Received in revised form
24 January 2013
Accepted 26 January 2013
Keywords:
Magnetron sputtering
Adhesion
TiO2 nanotube
Anodizing
Nanoindentation
nt matter & 2013 Elsevie.1016/j.jmbbm.2013.01.02
hor. Tel.: þ601 7283 8175;saeid_baradaran@yahoo
article as: Baradarans. Journal of the M020
a b s t r a c t
In this study, titanium thin films were deposited on alumina substrates by radio frequency
(RF) magnetron sputtering. The mechanical properties of the Ti coatings were evaluated in
terms of adhesion strength at various RF powers, temperatures, and substrate bias
voltages. The coating conditions of 400 W of RF power, 250 1C, and a 75 V substrate bias
voltage produced the strongest coating adhesion, as obtained by the Taguchi optimisation
method. TiO2 nanotube arrays were grown as a second layer on the Ti substrates using
electrochemical anodisation at a constant potential of 20 V and anodisation times of
15 min, 45 min, and 75 min in a NH4F electrolyte solution (75 ethylene glycol: 25 water). The
anodised titanium was annealed at 450 1C and 650 1C in a N2 gas furnace to obtain different
phases of titania, anatase and rutile, respectively. The mechanical properties of the
anodised layer were investigated by nanoindentation. The results indicate that Young’s
modulus and hardness increased with annealing temperature to 650 1C.
& 2013 Elsevier Ltd. All rights reserved.
1. Introduction
Bioceramics have recently become one of the most important
biomaterials used for implants. They are the type of material
most compatible with the human body due to chemical
similarities that facilitate their direct bonding to bone.
According to their level of interaction with living tissue,
bioceramics can be divided into inert and active types.
Alumina (Al2O3) is a type of inert bioceramic utilised in
orthopaedic implantation because of its good mechanical
properties (high strength, high fracture toughness) and good
compatibility. In addition, it is employed in the fabrication of
r Ltd. All rights reserved.0
fax: þ603 7967 5330..com (S. Baradaran).
, S., et al., Fabricationechanical Behavior o
bone plates, screws, and femoral heads and widely applied in
total hip joint and knee replacement (Liu, 2007; Velmurugan
et al., 2010; Youn et al., 2011).
Over the last few decades, implant coating has found a
wide array of applications. The thin-film coating of implant
surfaces can be performed by various methods, including
plasma spraying, electrophoresis, dipping, electrochemical
deposition, pulsed laser deposition, ion beam dynamic mix-
ing, and ion beam deposition (Oh et al., 2005; Raja et al., 2005;
Kar et al., 2006; Best et al., 2008; Wang et al., 2008; Kodama
et al., 2009; Roy et al., 2010; Wang and Luo, 2011). Some of
these methods have severe limitations such as poor
and deformation behaviour of multilayer Al2O3/Ti/TiO2
f Biomedical Materials (2013), http://dx.doi.org/10.1016/

Table 1 – Factors and levels used in the experiment.
Exp. Factors
RF power
(W)
Temperature
(1C)
Substrate biases
voltage (V)
1 300 150 25
2 300 200 50
3 300 250 75
4 400 150 50
5 400 200 75
6 400 250 25
7 500 150 75
8 500 200 25
9 500 250 50
j o u r n a l o f t h e m e c h a n i c a l b e h a v i o r o f b i o m e d i c a l m a t e r i a l s ] ( ] ] ] ] ) ] ] ] – ] ] ]2
adhesion, micro-crack formation, phase changes at high
temperatures, non-uniformity, and improper microstructural
control, all of which make them inadequate for implant
systems (Raja et al., 2005; Kar et al., 2006). More recently,
physical vapour deposition (PVD) magnetron sputtering has
been suggested by many researchers as a versatile deposition
technique that offers many advantages including high
deposition rates, ease of sputtering any metal, alloy or
compound, the formation of high-purity films, extremely
high adhesion to films, and the ability to form dense coatings
(Swann, 1988; Ding et al., 1999; Kelly and Arnell, 2000; Nelea
et al., 2003; Shi et al., 2008; Toque et al., 2010).
Throughout the last decades, pure titanium has been the
most widely applied biomaterial among metals due to its
fine biocompatibility, favourable mechanical properties, high
corrosion resistance, and adequately strong load-bearing
applications. Moreover, research on the nanostructured
morphology of titanium is becoming increasingly important
(Santos et al., 2008). The properties of nanostructured tita-
nium are mainly dependent on the material’s morphology
(Li et al., 2010). Nanostructured titanium layers can be
fabricated to have different surface areas and uniform size
distributions tailored for specific implant applications (Oh
et al., 2006; Zhu et al., 2007; Macak et al., 2008). Titanium
oxide (TiO2) nanotubes can be fabricated by various methods
such as hydrothermal deposition, electrodeposition, and
anodisation (Li et al., 2010; Zhang et al., 2010). Anodisation
is the most preferred process among these methods due to
the strong surface adhesion and mechanical integrity of the
resulting implants.
Moreover, to improve the strength of adhesion to sub-
strates, the coating parameter conditions should be opti-
mised (Camargo and Voorwald, 2007; Rajasekaran et al.,
2008). The conventional method is to use the ‘‘trial and error’’
approach, which is actually very time-consuming due to the
large number of experiments required. Therefore, a reliable
systematic approach for optimising coating parameters is
required (Ghani et al., 2004). The Taguchi optimisation
method is an efficient and effective approach through which
the response parameters affecting adhesion strength can be
optimised to identify the most significant response variables
with the minimum number of experiments (Farooq and Lee,
2002).
In addition, one of the most important attributes of
biomaterials used in medical and dental applications is their
mechanical properties. The consideration of such properties
becomes particularly important when these materials are
applied in bone implants, for which long-term in vivo struc-
tural stability is crucial. Typically, bone resorption occurs
when there is no compatibility between the mechanical
properties, such as the elastic moduli, of an implant material
and bone, leading to the loss of the implant and ultimately
failure (Huiskes et al., 1992). Therefore, characterising the
mechanical behaviour of implant materials is important. In
recent years, the mechanical characterisation of thin coat-
ings has been challenging because of the small length scales
involved. In this regard, the nanoindentation technique is
appropriate for testing biomaterials because of its low load
(mN) and small displacement (nm) resolution. Furthermore,
due to the small probe it employs, nanoindentation is an
Please cite this article as: Baradaran, S., et al., Fabricationnanotube arrays. Journal of the Mechanical Behavior oj.jmbbm.2013.01.020
effective technique for measuring the mechanical properties
of thin (10 mm) coated systems, including soft coatings on soft
substrates, hard coatings on soft substrates and multilayered
systems (Bahr et al., 2003; Deng et al., 2005a, 2005b; Ebenstein
and Pruitt, 2006).
To our knowledge, there is a lack of information regarding
the coating of metals on ceramics using customary methods,
which are mainly used to coat ceramics on metals and other
ceramics; thus, a comprehensive study in this line of research
is needed. In this work, alumina substrates were coated with
pure titanium metal by PVD magnetron sputtering. An
optimisation study on the conditions of magnetron sputter
coating (RF power, temperature and DC bias voltage) was
carried out using the Taguchi method to obtain the appro-
priate adhesion strength. TiO2 nanotubes were grown by
anodisation with ammonium fluoride (NH4F) salt dissolved
in a water and ethylene glycol (EG) solvent mixture at 20 V for
different time periods. FESEM and XRD were used to probe
the titanium nanotube coating structure. The adhesion
strength between the ceramic (alumina) substrates and Ti
coatings was evaluated using a micro scratch tester under
different conditions. The hardness and elastic modulus of
each coating were measured by performing a nanoindenta-
tion test on the nanotube layer at various annealing tem-
peratures and indentation depth.
2. Materials and experimental procedure
2.1. Experimental design
The most important stage in experimental design using the
Taguchi approach lies in the selection of the control para-
meters and identifying the orthogonal array (OA) (Ghani
et al., 2004). This experiment comprised three parameters
with three levels each; thus, the fractional factors design
used was a standard L9 (33) orthogonal array, which was
chosen due to its capability to verify the interactions among
parameters. The nine experiments performed and the details
regarding all combinations of the experimental conditions for
each control parameter are shown in Table 1.
and deformation behaviour of multilayer Al2O3/Ti/TiO2
f Biomedical Materials (2013), http://dx.doi.org/10.1016/
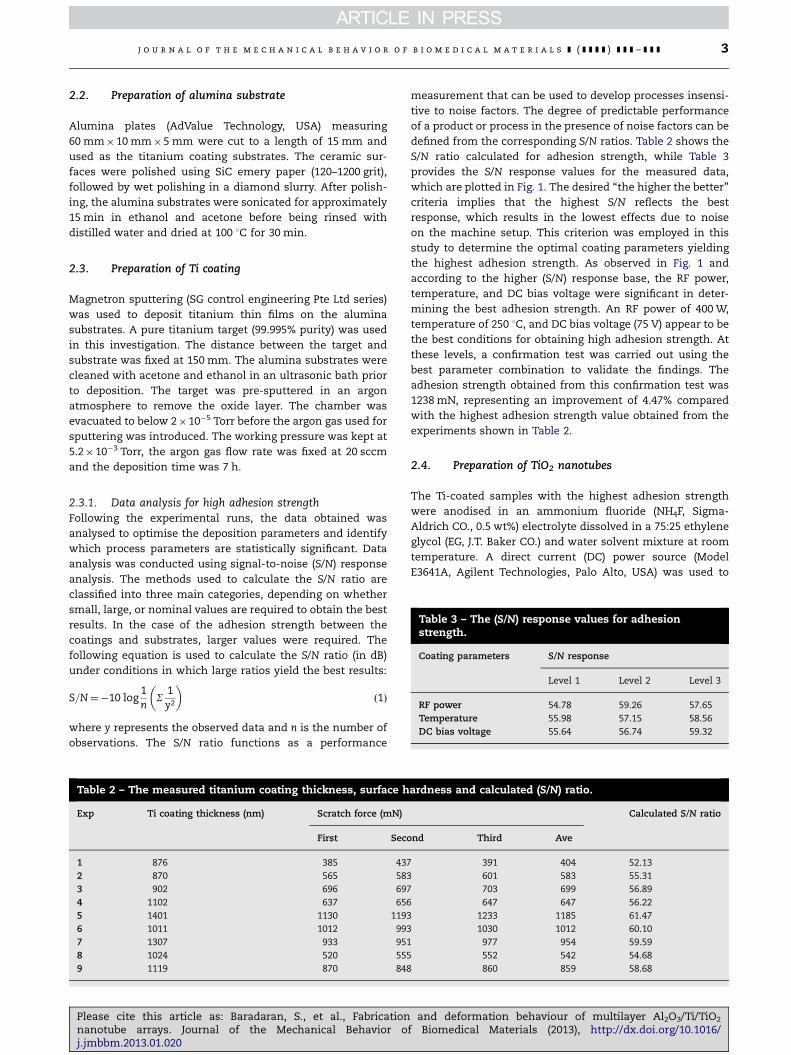
Table 3 – The (S/N) response values for adhesionstrength.
Coating parameters S/N response
Level 1 Level 2 Level 3
RF power 54.78 59.26 57.65
Temperature 55.98 57.15 58.56
DC bias voltage 55.64 56.74 59.32
j o u r n a l o f t h e m e c h a n i c a l b e h a v i o r o f b i o m e d i c a l m a t e r i a l s ] ( ] ] ] ] ) ] ] ] – ] ] ] 3
2.2. Preparation of alumina substrate
Alumina plates (AdValue Technology, USA) measuring
60 mm�10 mm�5 mm were cut to a length of 15 mm and
used as the titanium coating substrates. The ceramic sur-
faces were polished using SiC emery paper (120–1200 grit),
followed by wet polishing in a diamond slurry. After polish-
ing, the alumina substrates were sonicated for approximately
15 min in ethanol and acetone before being rinsed with
distilled water and dried at 100 1C for 30 min.
2.3. Preparation of Ti coating
Magnetron sputtering (SG control engineering Pte Ltd series)
was used to deposit titanium thin films on the alumina
substrates. A pure titanium target (99.995% purity) was used
in this investigation. The distance between the target and
substrate was fixed at 150 mm. The alumina substrates were
cleaned with acetone and ethanol in an ultrasonic bath prior
to deposition. The target was pre-sputtered in an argon
atmosphere to remove the oxide layer. The chamber was
evacuated to below 2�10�5 Torr before the argon gas used for
sputtering was introduced. The working pressure was kept at
5.2�10�3 Torr, the argon gas flow rate was fixed at 20 sccm
and the deposition time was 7 h.
2.3.1. Data analysis for high adhesion strengthFollowing the experimental runs, the data obtained was
analysed to optimise the deposition parameters and identify
which process parameters are statistically significant. Data
analysis was conducted using signal-to-noise (S/N) response
analysis. The methods used to calculate the S/N ratio are
classified into three main categories, depending on whether
small, large, or nominal values are required to obtain the best
results. In the case of the adhesion strength between the
coatings and substrates, larger values were required. The
following equation is used to calculate the S/N ratio (in dB)
under conditions in which large ratios yield the best results:
S=N¼�10 log1n
S1y2
� �ð1Þ
where y represents the observed data and n is the number of
observations. The S/N ratio functions as a performance
Table 2 – The measured titanium coating thickness, surface h
Exp Ti coating thickness (nm) Scratch force (mN)
First Seco
1 876 385 437
2 870 565 583
3 902 696 697
4 1102 637 656
5 1401 1130 1193
6 1011 1012 993
7 1307 933 951
8 1024 520 555
9 1119 870 848
Please cite this article as: Baradaran, S., et al., Fabricationnanotube arrays. Journal of the Mechanical Behavior oj.jmbbm.2013.01.020
measurement that can be used to develop processes insensi-
tive to noise factors. The degree of predictable performance
of a product or process in the presence of noise factors can be
defined from the corresponding S/N ratios. Table 2 shows the
S/N ratio calculated for adhesion strength, while Table 3
provides the S/N response values for the measured data,
which are plotted in Fig. 1. The desired ‘‘the higher the better’’
criteria implies that the highest S/N reflects the best
response, which results in the lowest effects due to noise
on the machine setup. This criterion was employed in this
study to determine the optimal coating parameters yielding
the highest adhesion strength. As observed in Fig. 1 and
according to the higher (S/N) response base, the RF power,
temperature, and DC bias voltage were significant in deter-
mining the best adhesion strength. An RF power of 400 W,
temperature of 250 1C, and DC bias voltage (75 V) appear to be
the best conditions for obtaining high adhesion strength. At
these levels, a confirmation test was carried out using the
best parameter combination to validate the findings. The
adhesion strength obtained from this confirmation test was
1238 mN, representing an improvement of 4.47% compared
with the highest adhesion strength value obtained from the
experiments shown in Table 2.
2.4. Preparation of TiO2 nanotubes
The Ti-coated samples with the highest adhesion strength
were anodised in an ammonium fluoride (NH4F, Sigma-
Aldrich CO., 0.5 wt%) electrolyte dissolved in a 75:25 ethylene
glycol (EG, J.T. Baker CO.) and water solvent mixture at room
temperature. A direct current (DC) power source (Model
E3641A, Agilent Technologies, Palo Alto, USA) was used to
ardness and calculated (S/N) ratio.
Calculated S/N ratio
nd Third Ave
391 404 52.13
601 583 55.31
703 699 56.89
647 647 56.22
1233 1185 61.47
1030 1012 60.10
977 954 59.59
552 542 54.68
860 859 58.68
and deformation behaviour of multilayer Al2O3/Ti/TiO2
f Biomedical Materials (2013), http://dx.doi.org/10.1016/

52
53
54
55
56
57
58
59
60
300 400 500 150 200 250 25 50 75
S/N
resp
onse
val
ues
Coating parameters level
RF power (W)
Temperature (°C)
DC bias voltage (V)
Fig. 1 – The S/N response graph for adhesion strength.
j o u r n a l o f t h e m e c h a n i c a l b e h a v i o r o f b i o m e d i c a l m a t e r i a l s ] ( ] ] ] ] ) ] ] ] – ] ] ]4
perform the anodisation. Each coated sample was connected
to the positive terminal (anode), and a graphite rod (D¼5 mm)
was connected to the negative terminal (cathode) of the
power source. The distance between the cathode and anode
was fixed at roughly 20 mm. The anodisation of the Ti surface
was carried out at a constant potential of 20 V for different
anodisation times, namely 15 min, 45 min, and 75 min. Dur-
ing anodisation, the surface colour changed from purple to
blue to light green and finally to light yellow. Thermal
annealing was performed in an argon gas furnace at 450 1C
and 650 1C for 2 h at heating and cooling rates of 5 1C/min.
2.4.1. TiO2 growth mechanismThe growth of TiO2 nanotube arrays is considered to occur in two
steps: (i) chemical dissolution, followed by (ii) electrochemical
oxidation (Chang et al., 2011). The structure and geometric size
of Ti nanotubes are controlled by the chemical dissolution step.
The electrochemical oxidation stage can be adjusted by three
critical factors: (i) anodisation voltage, (ii) anodisation time, and
(iii) acid concentration. It is notable that the formation of TiO2
nanotubes depends mainly on the ammonium fluoride concen-
tration in the electrolyte (Crawford et al., 2007). In this study, the
titanium coating anodes were dissolved by water electrolysis.
Titanium ions migrated through the oxide layer by electric-field-
assisted processes and accumulated at the entrances of nano-
pores in the coatings. F�, O2� and OH� ions from the electrolyte
migrated through the oxide layer to the Ti metal/oxide interface
and react with the Ti metal. Pitting corrosion due to F� led to the
initial formation of bowl-like pores on the substrate surfaces. At
the same time, Ti4þ ions moved toward the electrolyte and
Ti(OH)4 precipitates formed via the instantaneous hydrolysis
reaction at the entrance of the nanopores. The chemical reac-
tions governing these processes are as follows:
(i)
Plenaj.jm
Ti-Ti4þþ4e�
(ii)
Ti4þþ4H2O-Ti(OH)4þ4Hþ(iii)
Ti(OH)4-TiO2þ2H2OReaction (iv) is the total reaction that results in the TiO2
product:
(iv)
Tiþ2H2O-TiO2þ2H2The reaction between F� and TiO2 forms the TiF62�
complex, which can dissolve into the electrolyte. The
oxidation rate is limited by the barrier layer’s thickness at
ase cite this article as: Baradaran, S., et al., Fabrication annotube arrays. Journal of the Mechanical Behavior of Bi
bbm.2013.01.020
the Ti metal/oxide interface and is kept active by the
chemical dissolution process at the oxide/electrolyte
interface. The corresponding reaction is as follows:
(v)
TiO2þ4Hþþ6F�-TiF62�þ2H2O2.5. Characterisation
The coating morphology was observed using a high-
resolution FEI Quanta 200 F field emission scanning electron
microscope (FESEM). The statistical analysis of each tube
dimension (i.e., inner diameter, outer diameter, tube length)
was performed using the SPSS statistical software package
version 19 (SPSS Institute, Chicago, IL), with the assistance of
image analysis software before annealing. The source of
mentioned variations in Fig. 5 (f–h) is within the limit for
each sample. The measurements were directly extracted
from the FESEM images. Three samples were measured for
each processing condition. The adhesion strength was mea-
sured quantitatively using a Micro Materials NanoTest (Wrex-
ham, U.K.) with a diamond indenter; the sliding velocity was
5 mm/s, and the load was gradually increased to 9.2 mN/s.
Three scratches were performed for each sample. An Al2O3/
Ti/TiO2 cross-section was prepared by a relatively destructive
method using a diamond cutting tool machine. Sample X-ray
diffraction (XRD) patterns (as prepared and annealed sam-
ples) were recorded on an Empyrean X-ray diffractometer
with Cu Ka radiation (l¼1.54178 A) operating at 45 kV and
30 mA with a step size of 0.0261, scanning rate of 0.11/s and 2yrange from 101 to 801. The coatings’ mechanical properties
were investigated by nanoindentation using a commercial
nanoindenter (Micro materials Ltd. Wrexham, U.K.) with a
continuous stiffness measurement capability. The nanoin-
dentation experiments were performed using a Berkovich
diamond tip with a radius of 20 nm and constant depths of
550 nm and 800 nm. Calibration for load and hardness was
performed on a reference sample of fused silica. The inden-
tation velocity was 3–6 nm/s; once the maximum prescribed
depth was reached, loading was stopped and the load was
held constant for 10 s. The source of variations gathered from
five test sites is within the limit for each sample. Indentation
experiments were conducted for three samples per proces-
sing condition.
3. Results and discussion
3.1. Adhesion strength
The most essential properties of implant tissue materials are
their stability and durability because of the long-term pre-
sence required in the living body (Tomsia et al., 2005; Zhang
et al., 2007). Regarding applications, it is important to char-
acterise and thereby improve the adhesion strength between
coating layers and implant materials. The adhesion of a
coating to a substrate and the integrity of the substrate/
coating interface are always connected to the performance
and reliability of any coated device. In this study, a total of
nine experiments were carried out to achieve high adhesion
strength and consistency. Table 2 presents a summary of the
titanium coating thickness and adhesion test results at
d deformation behaviour of multilayer Al2O3/Ti/TiO2
omedical Materials (2013), http://dx.doi.org/10.1016/

j o u r n a l o f t h e m e c h a n i c a l b e h a v i o r o f b i o m e d i c a l m a t e r i a l s ] ( ] ] ] ] ) ] ] ] – ] ] ] 5
different parameters. As observed, Coating’s thickness is
increased with increasing RF power and substrate bias vol-
tage from 300 W to 400 W and 25 V to 75 V, respectively
(Fig. 1). When the RF power increased up to 400 W, the
sputtering rate increased because the ionised and sputtered
particles became more energetic, reducing the distance
between the energised atoms and subsequently making the
surface more adhesive. On the other hand when it increases
more to 500 W, collisions of sputtered particles with chamber
particles (argon gas and ions) increased. Hence, a drastic fall
in the sputtering rate for high power sputtering occurs.
Furthermore, with increasing substrate bias voltage, the
coating became more compact and denser which this event
is more effective in improving the adhesion of the coatings.
This improvement can be attributed to the additional energy
available for film growth. In this case, high-energy atoms
with greater mobility settled into lower-energy surface sites,
leading to higher coating adhesion and density (Gangopadhyay
et al., 2010; Singh et al., 2012). Finally, the combination of an RF
power of 400 W, temperature of 250 1C and substrate bias voltage
of 75 V provided suitable conditions for the strong adhesion of Ti
to alumina.
Fig. 2(a) and (b) illustrates the scratch length and failure
point as well as a graph of depth and load versus distance
during the scratch force test. It can be observed from the
graphs that coating (a) has the best adhesion strength. This
coated specimen had a scratch length of 1090.36 mm and a
failure point and load of approximately 995.33 mm and
1238 mN, respectively. Moreover, the failure point and scratch
length of the specimen exhibiting the lowest adhesion
strength were 388.27 mm and 1102.63 mN, respectively, while
Fig. 2 – Scratch force (adhesion) test results for a coated samp
critical load: (a) 400 W RF power, 250 1C and 75 V bias voltage; (
Please cite this article as: Baradaran, S., et al., Fabricationnanotube arrays. Journal of the Mechanical Behavior oj.jmbbm.2013.01.020
the graph of load versus distance shows a critical load of
437 mN.
Moreover, the critical loads were defined based on the
scratch profile of the load- displacement graph. The scratch
direction was from left to right for all of the scratch images
obtained in this study. Three critical loads Lc1, Lc2, and Lc3
were defined for the failure of the coatings. Lc1 is the first
critical load, corresponding to cohesive failure characterised
by trackside cracking. Lc2 is the second critical load, corre-
sponding to a mixture of adhesive and cohesive failure
characterised by delamination on the trackside and mild
tensile cracking. Lc3 is the load at which the coatings are
delaminated along the scratch path. Fig. 3(a and b) indicates
that several types of failure mode were observed during the
scratching of the titanium coatings on the alumina sub-
strates. The as-deposited coating began to fail when it
showed some cracking on the track side; the load at which
this was observed was recorded as Lc1. This was followed by
mild tensile cracking along the scratch path. As the load was
gradually increased, delamination occurred on the trackside,
and the load was recorded as Lc2. Prior to this mode of failure,
no coating delamination was observed along the scratch
path, but some cracking of the coating’s trackside was
evident. As the load continued to increase, the trackside
cracking and delamination became more severe and the
spacing between tensile cracks became smaller. Finally, the
coating was delaminated from the substrate along the
scratch path; the corresponding load was recorded as Lc3.
As this continued, the spallation on the trackside replaced
the trackside delamination and the scratch width became
le and force and depth versus depth graphs indicating the
b) 300 W RF power, 150 1C and 25 V bias voltage.
and deformation behaviour of multilayer Al2O3/Ti/TiO2
f Biomedical Materials (2013), http://dx.doi.org/10.1016/

Fig. 3 – Failure modes observed during scratch testing of as-deposited titanium coating at different stages.
Fig. 4 – Cross-section of sample (a) alumina, (b) titanium and
(c) titanium dioxide.
j o u r n a l o f t h e m e c h a n i c a l b e h a v i o r o f b i o m e d i c a l m a t e r i a l s ] ( ] ] ] ] ) ] ] ] – ] ] ]6
constant. This phenomenon is illustrated in Fig. 3b (Beake
and Lau, 2005; Toque et al., 2010; Singh et al., 2012).
3.2. Microstructure characterisation (Ti coating and TiO2
nanotube arrays)
Fig. 4(a–c) illustrates the cross-section of a sample prepared
by RF magnetron sputtering (PVD) and the anodised surface
on which TiO2 nanotube arrays were grown as a second layer.
Clearly, the thickness of the titanium coating is approxi-
mately 1.4 mm, where the first and second layers measure
approximately 620 nm and 745 nm in thickness, respectively
(Fig. 4(b and c)). A matte surface was observed on the bottom
of the TiO2 coating, as shown in Fig. 4b. The concave dimples
formed at the interface caused an increase in mechanical
interlocking and thereby enhanced the adhesion strength at
the interface (Crawford et al., 2007).
Fig. 5(a–c) shows the samples’ morphology at various
anodisation times. As shown in Fig. 4a, during the first stage
of anodisation, pore nucleation occurs on the Ti surface due
to the pitting corrosion induced by fluoride ions at an
anodisation time of 15 min. In Fig. 5a, it is evident that
nanopore formation occurred on top of the nanotubes, which
were non-homogenous and showed poor organisation on the
surface with no remnant TiO2 layer during the first 15 min. At
an anodisation time of 45 min (Fig. 5b), the porous structure
is converted to the tubular structure of the TiO2 nanotubes.
Fig. 5(c–e) shows the top, bottom view and cross-section of
the fractured TiO2 coating at 75 min of anodisation. The
bottom of the TiO2 nanotube coating shows a series of evenly
spaced ‘‘bumps’’ (Fig. 5d) that represent the pore tips of each
individual nanotube. It is clear that the nanotubes are well
defined with an average inner diameter, outer diameter and
Please cite this article as: Baradaran, S., et al., Fabricationnanotube arrays. Journal of the Mechanical Behavior oj.jmbbm.2013.01.020
tube length of approximately 58.3711.2 nm, 64.878.1 nm,
and 620.4734.7 nm, respectively (Fig.5(f–h)). The cross-
section of the TiO2 nanotubes shows a bamboo-shaped
structure with good density, which could result in enhanced
chemical activity and stronger interactions. It is noteworthy
that the coating density is an important factor contributing to
good mechanical properties, as will be discussed in the next
section (Zhang et al., 2007).
3.3. Crystal properties
Fig. 6 shows the diffuse diffraction pattern obtained by thin-
film X-ray diffraction analysis, where the oxide layer of
nanotube arrays formed by electrochemical anodisation is
crystallised at various annealing temperatures. As is known,
the performance of titanium dioxide depends highly on the
phase of the material. In recent years, the anatase and rutile
phases have attracted great attention, especially in medical
and electronics applications. The anatase phase is much
more efficient for the nucleation and growth of osteal cells
due to the superior bioactive properties. The crystal lattice of
the anatase phase complements the hydroxyapatite phase
well, but the rutile phase is more suitable in providing
enhanced mechanical properties (Chang et al., 2011). There-
fore, the anodised samples were annealed at different tem-
peratures at a heating and cooling rate of 5 1C/min to obtain
rutile-phase TiO2 nanostructures. Fig. 6(a–d) shows the XRD
patterns of alumina (a), alumina coated with titanium (b) and
the oxide layer of nanotube arrays prepared on a titanium
surface annealed at 450 1C and 650 1C for 2 h in a furnace with
N2 gas (c and d). The peaks for alumina, as the main
substrate, are clearly detected in Fig. 6(b–d). The temperature
of the phase transition from anatase to rutile is approxi-
mately 550 1C–600 1C, as previously reported (Lee and Park,
2003; Fan et al., 2007; Sadeghzadeh Attar et al., 2008; Sun
et al., 2011). Without taking the substrate peaks (Fig. 6(a and
b)) into account, all of the coatings’ XRD peaks can be
ascribed to the highly crystalline TiO2 anatase phase
(Fig. 6c) and rutile phase (Fig. 6d); no other phases were
detected.
3.4. Nanomechanical characteristics
In commercial nanoindenters, the load and displacement are
typically recorded continuously during the indentation pro-
cess, resulting in a load-displacement curve describing the
interaction between the tip and sample during the indenta-
tion process, as shown in (Fig. 7(a and b)). In recent years,
numerous studies on material properties have focused on the
measurement of Young’s modulus (E) and indentation hard-
ness (H) from indentation data (VanLandingham, 2003; Oliver
and Pharr, 2004; Ebenstein and Pruitt, 2006). Hardness and
and deformation behaviour of multilayer Al2O3/Ti/TiO2
f Biomedical Materials (2013), http://dx.doi.org/10.1016/

p
Fig. 5 – FESEM images of nanotube array samples: (a) 15 min of anodisation; (b) 45 min of anodisation; (c) top of surface after
75 min of anodisation; (d) bottom of nanotube; (e) cross-sectional view; and (f) outer dimensions of nanotube.
j o u r n a l o f t h e m e c h a n i c a l b e h a v i o r o f b i o m e d i c a l m a t e r i a l s ] ( ] ] ] ] ) ] ] ] – ] ] ] 7
Young’s modulus are parameters that are independent of one
another. The experimental hardness values obtained in this
study were described earlier in Table 4; these results include
the unloading data, from which Young’s modulus for the TiO2
nanophase can be calculated. The equations used to calculate
Young’s modulus are as follows:
Please cite this article as: Baradaran, S., et al., Fabricationnanotube arrays. Journal of the Mechanical Behavior oj.jmbbm.2013.01.020
1�W2s
ES¼
1ER�
1�W2D
EDð2Þ
ER ¼1
2h
ffiffiffiffiffiffiffiffiffiffip
24:5
rdLDh
� �ð3Þ
and deformation behaviour of multilayer Al2O3/Ti/TiO2
f Biomedical Materials (2013), http://dx.doi.org/10.1016/

Fig. 6 – XRD profiles for (a) alumina, (b) alumina coated with
titanium and (c) alumina/titanium/TiO2 nanotube arrays
sintered at 650 1C for 2 h (T: titanium, A: anatase, R: rutile).
Fig. 7 – Schematic of (a) a typical load versus indenter
displacement data and (b) the indentation process.
Pmax¼maximum load applied; hmax¼penetration depth;
hc¼contact depth (the height of contact between the tip and
the sample); hf¼final depth of contact impression after
unloading; S¼initial unloading stiffness.
j o u r n a l o f t h e m e c h a n i c a l b e h a v i o r o f b i o m e d i c a l m a t e r i a l s ] ( ] ] ] ] ) ] ] ] – ] ] ]8
ES ¼Kffiffiffipp
2ffiffiffiffiffiffiffiffiffiffiffiffiffiffiffi24:56hp �
dpmax
dhmaxð4Þ
In these equations Es and Ws are the Young’s modulus and
Poisson’s ratio of the samples, respectively, and E0 and W0 are
the indenter’s (composed of diamond) corresponding proper-
ties. The composite modulus (ER) can be obtained from the
unloading slope (dL/dh) and requires determining the plastic
depth when unloading begins (hp) (Eq. 3). The plastic depth
differs from the total depth due to elastic contraction; it can
be obtained by extrapolating the unloading line from its
initial load and depth when the load is zero (Fig. 8). A value
of W¼0.28 was chosen because this is Poisson’s ratio for
commercial TiO2 (Mayo et al., 1990). dPmax/dhmax is the
contact stiffness Eq. (4) determined from the maximum load
and maximum depth at the initial unloading slope. K is the
shape constant of an indenter and is 1.034 for a Berkovich tip
Please cite this article as: Baradaran, S., et al., Fabricationnanotube arrays. Journal of the Mechanical Behavior oj.jmbbm.2013.01.020
(Chen and Duh, 2001). In this section, we describe the
nanomechanical characterisation of the titanium nanotube
structures on alumina coated with a titanium layer measur-
ing 1.4 mm in thickness. Fig. 8(a and b) shows the representa-
tive load versus displacement curves for the annealed
samples at 450 1C and 650 1C, respectively. The load forces
were applied at the different indentation depths of 550 nm
and 800 nm. In general, material properties such as strength
and hardness can change as a result of heat treatment at
different annealing temperatures. Table 4 shows the Young’s
modulus and hardness obtained from the continuous stiff-
ness measurement system. It is important to note that
Young’s modulus and hardness can be determined instanta-
neously as a function of depth. Some researchers refer to
them as the apparent hardness and Young’s modulus
because of the effect of the substrate on the coatings. More-
over, the measurement of Young’s modulus and hardness is
reliable when the indenter depth is less than 10% of the film
thickness: otherwise the substrate effect should be taken into
account. (Crawford et al., 2007; Soares et al., 2008; Toque
et al., 2010). Therefore, in this study, we fixed the depth at
550 nm and 800 nm to show the effect of substrate on the
obtained values when the displacement of the surface go
beyond the limit of 10% of the film thickness. According to
the results, the films’ Young’s modulus and hardness
increased with the increase of penetration indenter tip into
the surface with depth of 800 nm. The cause of this phenom-
enon is that during the indentation process, the densification
of the nanotube layer and the wear of the dense surface were
the two main deformation processes that occurred under the
and deformation behaviour of multilayer Al2O3/Ti/TiO2
f Biomedical Materials (2013), http://dx.doi.org/10.1016/
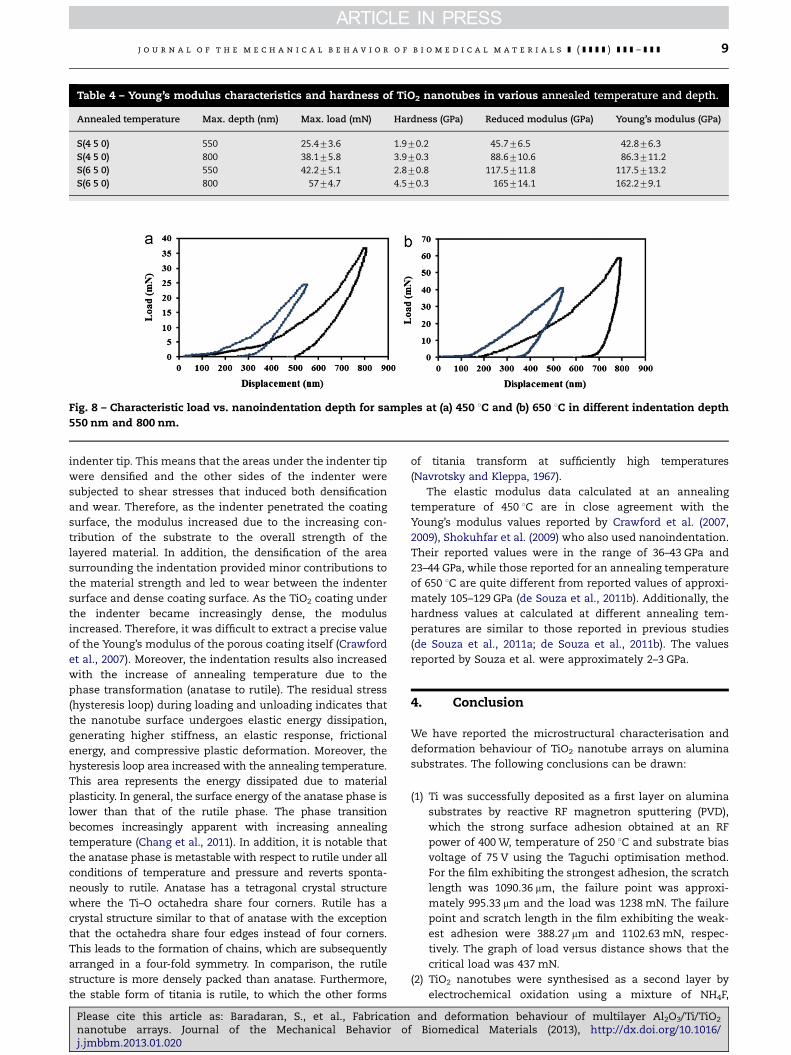
Table 4 – Young’s modulus characteristics and hardness of TiO2 nanotubes in various annealed temperature and depth.
Annealed temperature Max. depth (nm) Max. load (mN) Hardness (GPa) Reduced modulus (GPa) Young’s modulus (GPa)
S(4 5 0) 550 25.473.6 1.970.2 45.776.5 42.876.3
S(4 5 0) 800 38.175.8 3.970.3 88.6710.6 86.3711.2
S(6 5 0) 550 42.275.1 2.870.8 117.5711.8 117.5713.2
S(6 5 0) 800 5774.7 4.570.3 165714.1 162.279.1
Fig. 8 – Characteristic load vs. nanoindentation depth for samples at (a) 450 1C and (b) 650 1C in different indentation depth
550 nm and 800 nm.
j o u r n a l o f t h e m e c h a n i c a l b e h a v i o r o f b i o m e d i c a l m a t e r i a l s ] ( ] ] ] ] ) ] ] ] – ] ] ] 9
indenter tip. This means that the areas under the indenter tip
were densified and the other sides of the indenter were
subjected to shear stresses that induced both densification
and wear. Therefore, as the indenter penetrated the coating
surface, the modulus increased due to the increasing con-
tribution of the substrate to the overall strength of the
layered material. In addition, the densification of the area
surrounding the indentation provided minor contributions to
the material strength and led to wear between the indenter
surface and dense coating surface. As the TiO2 coating under
the indenter became increasingly dense, the modulus
increased. Therefore, it was difficult to extract a precise value
of the Young’s modulus of the porous coating itself (Crawford
et al., 2007). Moreover, the indentation results also increased
with the increase of annealing temperature due to the
phase transformation (anatase to rutile). The residual stress
(hysteresis loop) during loading and unloading indicates that
the nanotube surface undergoes elastic energy dissipation,
generating higher stiffness, an elastic response, frictional
energy, and compressive plastic deformation. Moreover, the
hysteresis loop area increased with the annealing temperature.
This area represents the energy dissipated due to material
plasticity. In general, the surface energy of the anatase phase is
lower than that of the rutile phase. The phase transition
becomes increasingly apparent with increasing annealing
temperature (Chang et al., 2011). In addition, it is notable that
the anatase phase is metastable with respect to rutile under all
conditions of temperature and pressure and reverts sponta-
neously to rutile. Anatase has a tetragonal crystal structure
where the Ti–O octahedra share four corners. Rutile has a
crystal structure similar to that of anatase with the exception
that the octahedra share four edges instead of four corners.
This leads to the formation of chains, which are subsequently
arranged in a four-fold symmetry. In comparison, the rutile
structure is more densely packed than anatase. Furthermore,
the stable form of titania is rutile, to which the other forms
Please cite this article as: Baradaran, S., et al., Fabricationnanotube arrays. Journal of the Mechanical Behavior oj.jmbbm.2013.01.020
of titania transform at sufficiently high temperatures
(Navrotsky and Kleppa, 1967).
The elastic modulus data calculated at an annealing
temperature of 450 1C are in close agreement with the
Young’s modulus values reported by Crawford et al. (2007,
2009), Shokuhfar et al. (2009) who also used nanoindentation.
Their reported values were in the range of 36–43 GPa and
23–44 GPa, while those reported for an annealing temperature
of 650 1C are quite different from reported values of approxi-
mately 105–129 GPa (de Souza et al., 2011b). Additionally, the
hardness values at calculated at different annealing tem-
peratures are similar to those reported in previous studies
(de Souza et al., 2011a; de Souza et al., 2011b). The values
reported by Souza et al. were approximately 2–3 GPa.
4. Conclusion
We have reported the microstructural characterisation and
deformation behaviour of TiO2 nanotube arrays on alumina
substrates. The following conclusions can be drawn:
(1)
anf B
Ti was successfully deposited as a first layer on alumina
substrates by reactive RF magnetron sputtering (PVD),
which the strong surface adhesion obtained at an RF
power of 400 W, temperature of 250 1C and substrate bias
voltage of 75 V using the Taguchi optimisation method.
For the film exhibiting the strongest adhesion, the scratch
length was 1090.36 mm, the failure point was approxi-
mately 995.33 mm and the load was 1238 mN. The failure
point and scratch length in the film exhibiting the weak-
est adhesion were 388.27 mm and 1102.63 mN, respec-
tively. The graph of load versus distance shows that the
critical load was 437 mN.
(2)
TiO2 nanotubes were synthesised as a second layer byelectrochemical oxidation using a mixture of NH4F,
d deformation behaviour of multilayer Al2O3/Ti/TiO2
iomedical Materials (2013), http://dx.doi.org/10.1016/
j o u r n a l o f t h e m e c h a n i c a l b e h a v i o r o f b i o m e d i c a l m a t e r i a l s ] ( ] ] ] ] ) ] ] ] – ] ] ]10
Plnj.j
ethylene glycol and water as an electrolyte. The FESEM
results indicate that the best anodisation time, i.e., that
allowing for the most suitable nanotube formation, was
75 min.
(3)
The phase transition temperature for the transformationof the anatase phase to the rutile phase ranged from
450 1C to 650 1C.
(4)
The results of mechanical indentation tests indicate thatYoung’s modulus and hardness increased with annealing
temperature.
Acknowledgment
The authors wish to thank Pardis Moslemzadeh Tehrani for
valuable discussions. This work has been supported by the
University of Malaya, grant No: (HIR F0004-21001), FRGS grant
number FP039 2010B and RG 181 12SUS.
r e f e r e n c e s
Bahr, D., Woodcock, C., Pang, M., Weaver, K., Moody, N., 2003.Indentation induced film fracture in hard film–soft substratesystems. International Journal of Fracture 119, 339–349.
Beake, B.D., Lau, S., 2005. Nanotribological and nanomechanical
properties of 5–80 nm tetrahedral amorphous carbon films onsilicon. Diamond and Related Materials 14, 1535–1542.
Best, S., Porter, A., Thian, E., Huang, J., 2008. Bioceramics: past,present and for the future. Journal of the European Ceramic
Society 28, 1319–1327.Camargo, A., Voorwald, H., 2007. Influence of anodization on the
fatigue strength of 7050-T7451 aluminium alloy. Fatigue and
Fracture of Engineering Materials and Structures 30, 993–1007.Chang, W.Y., Fang, T.H., Chiu, Z.W., Hsiao, Y.J., Ji, L.W., 2011.
Nanomechanical properties of array TiO2 nanotubes.Microporous and Mesoporous Materials 145, 87–92.
Chen, J.S., Duh, J.G., 2001. Indentation behavior and young’smodulus evaluation in electroless Ni modified CrN coatingof mild steel. Surface and Coatings Technology 139, 6–13.
Crawford, G., Chawla, N., Das, K., Bose, S., Bandyopadhyay, A.,2007. Microstructure and deformation behavior ofbiocompatible TiO2 nanotubes on titanium substrate. ActaBiomaterialia 3, 359–367.
Crawford, G., Chawla, N., Houston, J., 2009. Nanomechanics ofbiocompatible TiO2 nanotubes by Interfacial Force Microscopy(IFM). Journal of the Mechanical Behavior of BiomedicalMaterials 2, 580–587.
de Souza, G.B., de Lima, G.G., Kuromoto, N.K., Soares, P.,Lepienski, C.M., Foerster, C.E., Mikowski, A., 2011a. Tribo-mechanical characterization of rough, porous and bioactive Tianodic layers. Journal of the Mechanical Behavior of
Biomedical Materials 4, 796–806.de Souza, G.B., Lepienski, C.M., Foerster, C.E., Kuromoto, N.K.,
Soares, P., Ponte, H.A., 2011b. Nanomechanical andnanotribological properties of bioactive titanium surfaces
prepared by alkali treatment. Journal of the MechanicalBehavior of Biomedical Materials 4, 756–765.
Deng, X., Chawla, N., Chawla, K.K., Koopman, M., Chu, J.P., 2005a.
Mechanical behavior of multilayered nanoscale metalceramiccomposites. Advanced Engineering Materials 7, 1099–1108.
Deng, X., Cleveland, C., Chawla, N., Karcher, T., Koopman, M.,Chawla, K., 2005b. Nanoindentation behavior of nanolayered
metal-ceramic composites. Journal of Materials Engineeringand Performance 14, 417–423.
ease cite this article as: Baradaran, S., et al., Fabricationanotube arrays. Journal of the Mechanical Behavior ombbm.2013.01.020
Ding, S.J., Ju, C.P., Lin, J.H.C., 1999. Immersion behavior of RFmagnetronassisted sputtered hydroxyapatite/titaniumcoatings in simulated body fluid. Journal of BiomedialMaterials Research Part A 47, 551–563.
Ebenstein, D.M., Pruitt, L.A., 2006. Nanoindentation of biologicalmaterials. Nano Today 1, 26–33.
Fan, X., Zhang, Y., Xiao, P., Hu, F., Zhang, H., 2007. Preparation of high-orderly TiO2 nanotubes in organic solution and characterizationof C-doped TiO2. Journal of Chemical Physics 20, 753.
Farooq, M., Lee, Z.H., 2002. Optimization of the sputtering processfor depositing composite thin films. Journal of the KoreanPhysical Society 40, 511–515.
Gangopadhyay, S., Acharya, R., Chattopadhyay, A.K., Paul, S.,2010. Effect of substrate bias voltage on structural andmechanical properties of pulsed DC magnetron sputteredTiN–MoSx composite coatings. Vacuum 84, 843–850.
Ghani, J.A., Choudhury, I.A., Hassan, H.H., 2004. Application ofTaguchi method in the optimization of end milling parameters.Journal of Materials Processing Technology 145, 84–92.
Huiskes, R., Weinans, H., Rietbergen, B., 1992. The relationshipbetween stress shielding and bone resorption around total hipstems and the effects of flexible materials. ClinicalOrthopaedics and Related Research, 124–134.
Kar, A., Raja, K., Misra, M., 2006. Electrodeposition ofhydroxyapatite onto nanotubular TiO2 for implantapplications. Surface and Coatings Technology 201, 3723–3731.
Kelly, P., Arnell, R., 2000. Magnetron sputtering: a review of recentdevelopments and applications. Vacuum 56, 159–172.
Kodama, A., Bauer, S., Komatsu, A., Asoh, H., Ono, S., Schmuki, P.,2009. Bioactivation of titanium surfaces using coatings of TiO2
nanotubes rapidly pre-loaded with synthetic hydroxyapatite.Acta Biomaterialia 5, 2322–2330.
Lee, K.-S., Park, I.-S., 2003. Anatase-phase titanium oxide by lowtemperature oxidation of metallic Ti thin film. ScriptaMaterialia 48, 659–663.
Li, S., Yin, J., Zhang, G., 2010. Fabrication of multi-sectional TiO2
nanotube arrays by anodization. Science China Chemistry 53,1068–1073.
Liu, S.Q., 2007. Bioregenerative Engineering: Principles andApplications. John Wiley and Sons, Hoboken, New Jersey.
Macak, J., Hildebrand, H., Marten-Jahns, U., Schmuki, P., 2008.Mechanistic aspects and growth of large diameter self-organized TiO2 nanotubes. Journal of ElectroanalyticalChemistry 621, 254–266.
Mayo, M., Siegel, R., Narayanasamy, A., Nix, W., 1990. Mechanicalproperties of nanophase TiO2 as determined bynanoindentation. Journal of Materials Research 5, 1073–1082.
Navrotsky, A., Kleppa, O., 1967. Enthalpy of the Anatase–RutileTransformation. Journal of the American Ceramic Society 50626–626.
Nelea, V., Morosanu, C., Iliescu, M., Mihailescu, I., 2003.Microstructure and mechanical properties of hydroxyapatitethin films grown by RF magnetron sputtering. Surface andCoatings Technology 173, 315–322.
Oh, S., Daraio, C., Chen, L.H., Pisanic, T.R., Finones, R.R., Jin, S.,2006. Significantly accelerated osteoblast cell growth onaligned TiO2 nanotubes. Journal of Biomedial MaterialsResearch Part A 78, 97–103.
Oh, S.H., Fin ~ones, R.R., Daraio, C., Chen, L.H., Jin, S., 2005. Growthof nano-scale hydroxyapatite using chemically treatedtitanium oxide nanotubes. Biomaterials 26, 4938–4943.
Oliver, W.C., Pharr, G.M., 2004. Measurement of hardness andelastic modulus by instrumented indentation: advances inunderstanding and refinements to methodology. Journal ofMaterials Research 19, 3–20.
Raja, K., Misra, M., Paramguru, K., 2005. Deposition of calciumphosphate coating on nanotubular anodized titanium.Materials Letters 59, 2137–2141.
and deformation behaviour of multilayer Al2O3/Ti/TiO2
f Biomedical Materials (2013), http://dx.doi.org/10.1016/
j o u r n a l o f t h e m e c h a n i c a l b e h a v i o r o f b i o m e d i c a l m a t e r i a l s ] ( ] ] ] ] ) ] ] ] – ] ] ] 11
Rajasekaran, B., Raman, Ganesh Sundara, Rama Krishna, S., Joshi,L., Sundararajan, G., S.V., 2008. Influence of microarc oxidationand hard anodizing on plain fatigue and fretting fatiguebehaviour of Al–Mg–Si alloy. Surface and Coatings Technology202, 1462–1469.
Roy, M., Balla, V.K., Bose, S., Bandyopadhyay, A., 2010. Comparisonof tantalum and hydroxyapatite coatings on titanium forapplications in load bearing implants. Advanced EngineeringMaterials 12, B637–B641.
Sadeghzadeh Attar, A., Sasani Ghamsari, M., Hajiesmaeilbaigi, F.,Mirdamadi, S., Katagiri, K., Koumoto, K., 2008. Synthesis andcharacterization of anatase and rutile TiO2 nanorods bytemplate-assisted method. Journal of Materials Science 43,5924–5929.
Santos, E., Kuromoto, N.K., Campos, D.M., Mazzaro, I., de AlmeidaSoares, G.D., 2008. In vitro behavior of two distinct titaniumsurfaces obtained by anodic oxidation. Key EngineeringMaterials 361, 669–672.
Shi, J., Chen, C., Yu, H., Zhang, S., 2008. Application of magnetronsputtering for producing bioactive ceramic coatings onimplant materials. Bulletin of Materials Science 31, 877–884.
Shokuhfar, T., Arumugam, G.K., Heiden, P.A., Yassar, R.S.,Friedrich, C., 2009. Direct Compressive Measurements ofIndividual Titanium Dioxide Nanotubes. ACS nano 3,3098–3102.
Singh, K., Krishnamurthy, N., Suri, A.K., 2012. Adhesion and wearstudies of magnetron sputtered NbN films. TribologyInternational 50, 16–25.
Soares, P., Mikowski, A., Lepienski, C.M., Santos Jr, E., Soares, G.A.,Kuromoto, N.K., 2008. Hardness and elastic modulus of TiO2
anodic films measured by instrumented indentation. Journalof Biomedial Materials Research Part B Applied Biomaterials84, 524–530.
Sun, Y., Yan, K., Wang, G., Guo, W., Ma, T., 2011. Effect ofannealing temperature on the hydrogen production of TiO2
nanotube arrays in a two-compartment photoelectrochemicalcell. Journal of Physical Chemistry C 115, 12844–12849.
Swann, S., 1988. Magnetron sputtering. Physics in Technology 19,67–75.
Please cite this article as: Baradaran, S., et al., Fabricationnanotube arrays. Journal of the Mechanical Behavior oj.jmbbm.2013.01.020
Tomsia, A.P., Saiz, E., Song, J., Bertozzi, C.R., 2005. Biomimeticbonelike composites and novel bioactive glass coatings.Advanced Engineering Materials 7, 999–1004.
Toque, J.A., Herliansyah, M.K., Hamdi, M., Ide-Ektessabi, A.,Sopyan, I., 2010. Adhesion failure behavior of sputteredcalcium phosphate thin film coatings evaluated usingmicroscratch testing. Journal of the Mechanical Behavior ofBiomedical Materials 3, 324–330.
VanLandingham, M.R., 2003. Review of instrumented indentation.Journal of Research of the National Institute of Standards andTechnology 108, 249–265.
Velmurugan, R., Kanagesan, S., Jesurani, S., Kalaivani, T., 2010.Surface bioactivity of sol gel derived 3Y-TZP bioinert ceramicthrough hydroxylation technique using 5M NaOH. EuropeanJournal of Scientific Research 41, 430–436.
Wang, L.N., Luo, J.L., 2011. Formation of hydroxyapatite coatingon anodic titanium dioxide nanotubes via an efficient dippingtreatment. Metallurgical and Materials Transactions A:Physical Metallurgy and Materials Science 42, 3255–3264.
Wang, Y.q., Tao, J., Wang, L., He, P.t., Wang, T., 2008. HA coating ontitanium with nanotubular anodized TiO2 intermediate layervia electrochemical deposition. Trans. A-Phys.Metall. Mater.Sci. (English Edition) 18, 631–635.
Youn, H.S., Jyoti, M.A., Kwak, K.A., Seo, H.S., Lee, B.T., Song, H.Y.,2011. Enhanced osteoconduction and angiogenesis of a threedimensional continuously porous Al2O3 implant. MaterialsScience and Engineering C 31, 1458–1465.
Zhang, F., Chen, S., Yin, Y., Lin, C., Xue, C., 2010. Anodic formationof ordered and bamboo-type TiO2 anotubes arrays withdifferent electrolytes. Journal of Alloys and Compounds 490,247–252.
Zhang, W., Li, G.Z., Li, Y.N., Yu, Z.T., Xi, Z.P., 2007. Fabrication ofTiO2 nanotube arrays on biologic titanium alloy andproperties. Transactions of the Nonferrous Metals Society ofChina 17, 692–695.
Zhu, L., Ye, X., Tang, G., Zhao, N., Gong, Y., Zhao, Y., Zhao, J.,Zhang, X., 2007. Biomimetic coating of compound titania andhydroxyapatite on titanium. Journal of Biomedial MaterialsResearch Part A 83, 1165–1175.
and deformation behaviour of multilayer Al2O3/Ti/TiO2
f Biomedical Materials (2013), http://dx.doi.org/10.1016/