Embed Size (px)
Citation preview

F5 NetworksEl Nino Investments

Overview
F5 Networks (FFIV)
Application Software Industry
Headquarters: Seattle, WA
Market Cap: 6.86 B
PE: 19x Earnings
PEG: 1.07
Gross Margin: 83%
Net Margin: 19%

History & Acquisitions
1996 - F5 emerged (BIG-IP)
1999 - IPO (NASDAQ)
2003 - uRoam ($25M)
2004 - Magnifire WebSystems ($29M)
2005 - Swan Labs ($43M)
2007 - Acopia Networks ($210M)
2011 - Crescendo Networks’ DPI Intellectual Property
2012 - Traffix Systems
2013 - LineRate Systems & Versafe
2014 - Defense.Net
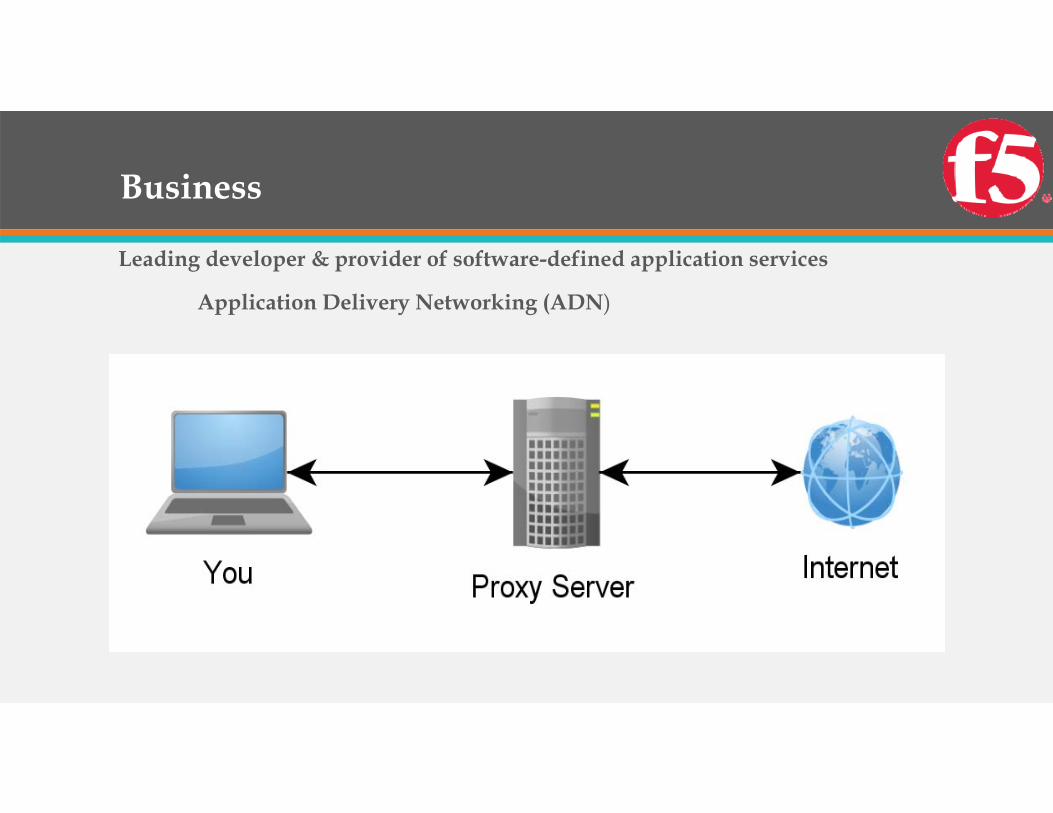
Business
Leading developer & provider of software-defined application services
Application Delivery Networking (ADN)
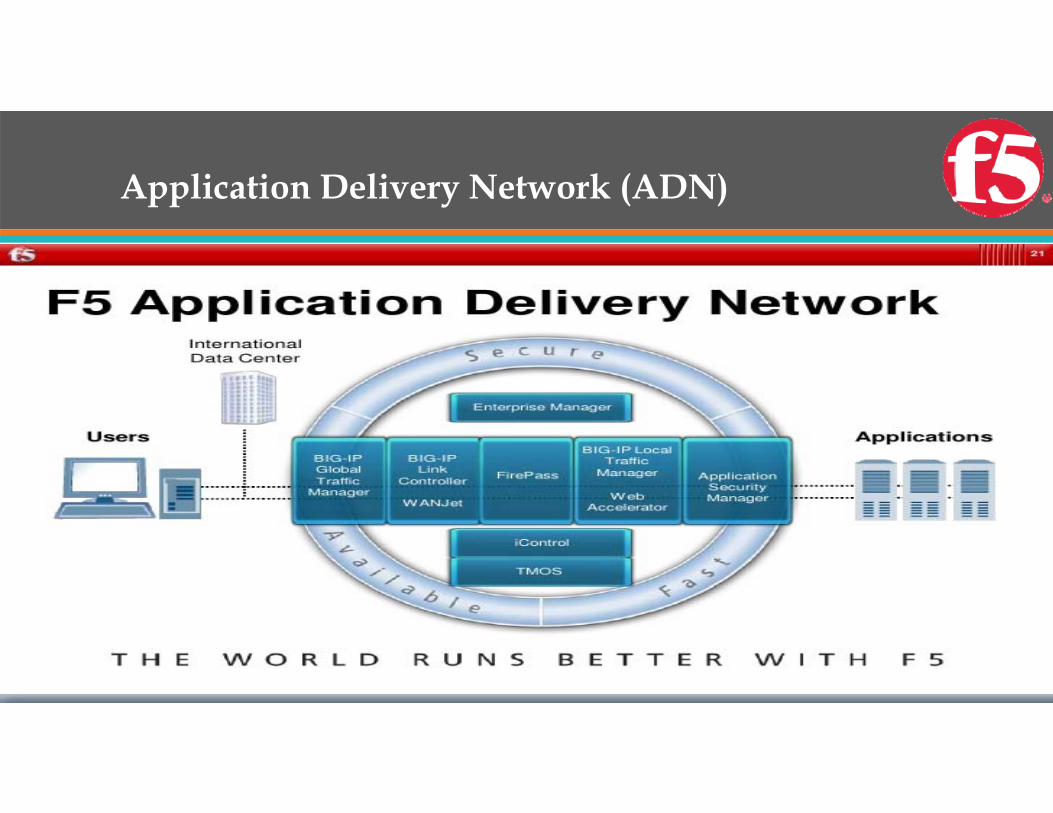
Application Delivery Network (ADN)

TMOS
Full proxy software platform that supports industry’s broadest array of application services
Inspect and modify content of IP flows between users & apps
iControl – “the translator”
iRules – “the principal”
iCall – “the scientist”

Suite of Application Services (Modules)
Legacy ProductsLocal Traffic ManagerBIG-IP DNS & Link Controller
New ProductsAdvanced Firewall ManagerCarrier Grade Network Address TranslationPolicy Enforcement Manager
Products through AcquisitionsApplication Security ManagerApplication Acceleration ManagerAccess Policy Manager
End-User Protection ProductsWebSafeMobileSafe

Integrated Solutions (Hardware)
Purpose-built hardware servers designed to optimize performance of modules
BIG-IP appliances
VIPRION products
Massive performance and scalability to allow consolidation
*Cost efficient*

Virtual Editions (Software)
Software-only editions of modules
Industry’s largest mix of software-only offerings
Greater flexibility to deploy a mix of integrated app services
Tend to have lower performance than hardware

Common Attributes between H & S
Deployed in Hybrid Infrastructures
Data Center and Private
Multiple Data Centers
Data Center and Public
Modules can be sold individually in both forms
Support all modules

Subscription Services
‘14 Cloud-Based (Silverline) – SaaS platform
DDoS protection
Web Application Firewall
Very Customizable
End-User Protection Modules
WebSafe
MobileSafe
Diameter Signaling and Routing
Acquired Traffix in 2012
Consolidates signals for service providers from legacy infrastructures to 4G/LTE
“Helps upgrade signals” more efficiently with little lag time
CGNAT module
PEM module

Services for our Services
Consulting
Training
Installation
Maintenance
Other technical support

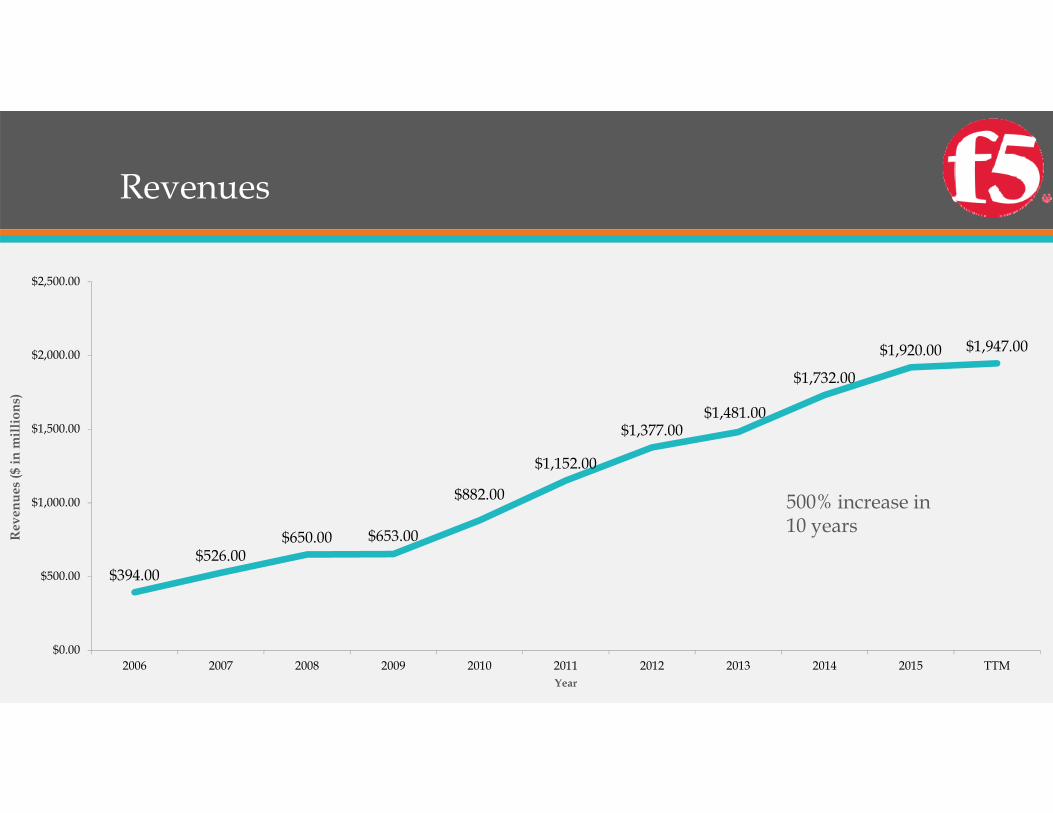
Revenues
52%48%
Products Services
Total Revenues increased10.8% in 2015
52%
5%
23%
5%
15%
US Other Americas EMEA Japan Asia Pacific

Sales by Distributors
18%
16%
14%10%
42%
Westcon Group Ingram Micro Avnet Tech Solutions Arrow ECS Others

Employees
108726%
158238%
107826%
43110%
Product Development Sales Professional Services & Tech Support Adminstration

Partners

Customers
• 49 of the Fortune 50 companies
• 20 of the top 20 U.S. commercial banks
• 15 of the 15 executive departments of the U.S. cabinet
• 10 of the top 10 largest global insurance companies
• 10 of the top 10 U.S. telecommunications companies
• 10 of the top 10 "best" U.S. retail companies
• 10 of the top 10 "best" global brands
• 10 of the top 10 global Telecom operators
• 10 of the top 10 global automotive companies
• 10 of the top 10 world's "most admired" companies
• 9 of the Fortune 10 companies
• 7 of the top 10 global oil and gas companies
• 10 of the 10 largest mobile operators
• 6 of the top 6 U.S. securities companies

Risks
Growing competition
Failure to precisely research & develop
Continuing innovation
Reliant on Supplier & Distributor relationships for products and sales

Competitive Advantage
Network Effect
Switching Costs
Brand Recognition
Product Mix

Buffettology

Qualitative Review

Interpretation of Financial Statements
Revenues
$394.00$526.00
$650.00 $653.00
$882.00
$1,152.00
$1,377.00$1,481.00
$1,732.00
$1,920.00 $1,947.00
$0.00
$500.00
$1,000.00
$1,500.00
$2,000.00
$2,500.00
2006 2007 2008 2009 2010 2011 2012 2013 2014 2015 TTM
Rev
enue
s ($
in m
illio
ns)
Year
500% increase in 10 years

Gross Profit Margin
77.66%77.38%
77.08%
78.10%
80.50%
81.94%
82.86% 82.92%
82.10%82.71% 82.59%
75.00%
76.00%
77.00%
78.00%
79.00%
80.00%
81.00%
82.00%
83.00%
84.00%
85.00%
2006 2007 2008 2009 2010 2011 2012 2013 2014 2015 TTM
Gro
ss P
rofi
t Mar
gin
(%)
Year

Net Profit Margin
16.75%
14.64%
11.38%
14.09%
17.12%
20.92%19.97%
18.70%
17.96%
19.01% 18.80%
10.00%
12.00%
14.00%
16.00%
18.00%
20.00%
22.00%
2006 2007 2008 2009 2010 2011 2012 2013 2014 2015 TTM
Net
Pro
fit M
argi
n (%
)
Year

Return on Equity
10.71% 9.99% 10.31%11.51%
15.04%
21.81%20.69%
18.00%
22.72%
27.71%28.98%
0.00%
5.00%
10.00%
15.00%
20.00%
25.00%
30.00%
35.00%
2006 2007 2008 2009 2010 2011 2012 2013 2014 2015 TTM
Ret
urn
on E
quity
(%)
Year

Return on Capital
10.71% 9.99% 10.31%11.51%
15.04%
21.81%20.69%
18.00%
22.72%
27.71%28.98%
0.00%
5.00%
10.00%
15.00%
20.00%
25.00%
30.00%
35.00%
2006 2007 2008 2009 2010 2011 2012 2013 2014 2015 TTM
Ret
urn
on C
apita
l (%
)
Year

Working Capital
$363.00
$234.00
$136.00
$245.00
$319.00
$392.00
$310.00
$265.00
$362.00
$433.00$405.00
$0.00
$50.00
$100.00
$150.00
$200.00
$250.00
$300.00
$350.00
$400.00
$450.00
$500.00
2006 2007 2008 2009 2010 2011 2012 2013 2014 2015 TTM
Wor
king
Cap
ital (
$ in
mill
ions
)
Year

Total Shares Outstanding
83.00
85.1083.40
80.1081.00 81.50
79.80 79.10
76.10
72.50
69.90
65.00
70.00
75.00
80.00
85.00
90.00
2006 2007 2008 2009 2010 2011 2012 2013 2014 2015 TTM
Tota
l Sha
res
Out
stan
ding
Year
Bought back 16% of shares at an average price of $82.41 per share

Quantitative Review

Value Bands

Price/Sales
1.0
3.0
5.0
7.0
9.0
11.0
13.0
2016-03-072015-03-312014-03-312013-03-312012-03-312011-03-312010-03-312009-03-312008-03-312007-03-312006-03-31
P/S 3.71
Rank 11%

Price/Earnings
5.0
15.0
25.0
35.0
45.0
55.0
65.0
75.0
2016-03-072015-03-312014-03-312013-03-312012-03-312011-03-312010-03-312009-03-312008-03-312007-03-312006-03-312005-03-31
P/E 19.75
Rank 2%

Price/Earnings Less Cash
5.00
15.00
25.00
35.00
45.00
55.00
65.00
75.00
2016-03-072015-03-312014-03-312013-03-312012-03-312011-03-312010-03-312009-03-312008-03-312007-03-312006-03-312005-03-31
PE Less Cash 17.27
Rank 2%

Price/Book
0.5
2.5
4.5
6.5
8.5
10.5
12.5
2016-03-072015-03-312014-03-312013-03-312012-03-312011-03-312010-03-312009-03-312008-03-312007-03-312006-03-312005-03-31
P/B 5.49
Rank 58%
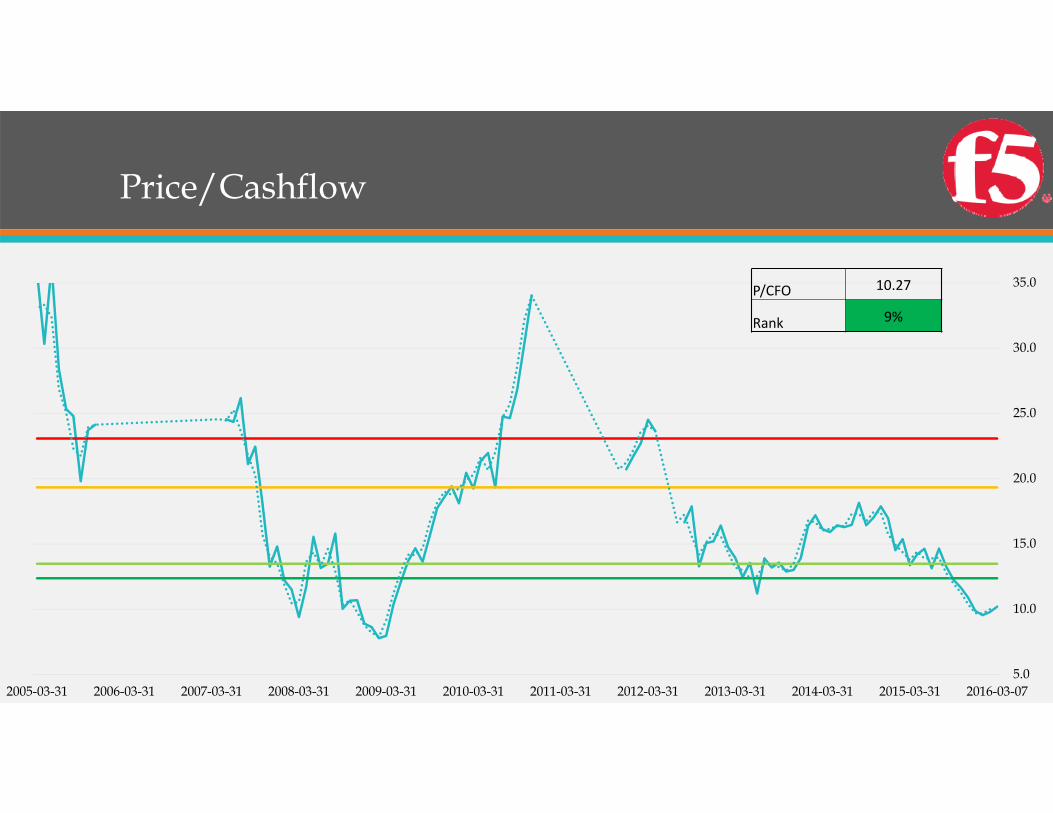
Price/Cashflow
5.0
10.0
15.0
20.0
25.0
30.0
35.0
2016-03-072015-03-312014-03-312013-03-312012-03-312011-03-312010-03-312009-03-312008-03-312007-03-312006-03-312005-03-31
P/CFO 10.27
Rank 9%

Price/Free Cashflow
5.0
10.0
15.0
20.0
25.0
30.0
35.0
2016-03-072015-03-312014-03-312013-03-312012-03-312011-03-312010-03-31
P/FCF 11.45
Rank 6%

Enterprise Value/Revenue
1.0
3.0
5.0
7.0
9.0
11.0
2016-03-072015-03-312014-03-312013-03-312012-03-312011-03-312010-03-312009-03-312008-03-312007-03-312006-03-312005-03-31
EV/Rev 3.12
Rank 11%

Enterprise Value/EBITDA
7.0
12.0
17.0
22.0
27.0
32.0
37.0
2016-03-072015-03-312014-03-312013-03-312012-03-312011-03-312010-03-312009-03-312008-03-312007-03-312006-03-312005-03-31
EV/EBITDA 10.03
Rank 2%

Enterprise Value/EBIT
0.0
5.0
10.0
15.0
20.0
25.0
30.0
35.0
40.0
45.0
2016-03-072015-03-312014-03-312013-03-312012-03-312011-03-312010-03-312009-03-312008-03-312007-03-312006-03-312005-03-31
EV/EBIT 11.00
Rank 2%

Intra-Portfolio Evaluations

Intra-Portfolio Evaluations – Current

Intra-Portfolio Evaluations – 5 Year Historical

Industry Breakdown

Industry Overview

Industry Breakdown
Information from FFIV 10-K
F5 Networks Juniper Cisco* Checkpoint Imperva Citrix Allot Riverbed Oracle* IBM* AkamaiBlue Coat
Network Firewall Y Y Y YWeb Application
Firewall Y Y Y YCarrier Grade NAT Y Y Y
Deep Packet Inspection Y Y
Wide Area Network Y YDiameter Signaling Y Y
End-User Protection Y YCloud-Based
Protection Y YMalware Protection Y Y

Industry Breakdown
TTM F5 Juniper Checkpoint Brocade Citrix Riverbed
Market Cap 6.86 B 9.66 B 15.40 B 4.16 B 11.56 B 3.31 B
Gross Profit Margin 83% 63% 88% 68% 81% 74%
Net Profit Margin 19% 13% 42% 15% 10% 7%
Obligation Ratio 0 0 0 0 1.03 N/A
Return on Equity 28% 14% 19% 14% 15% 9%
Return on Capital 28% 10% 19% 11% 10% 4%
Return on Assets 16% 7% 14% 9% 6% 4%
Patents 231 2,480 39 56 N/A 195
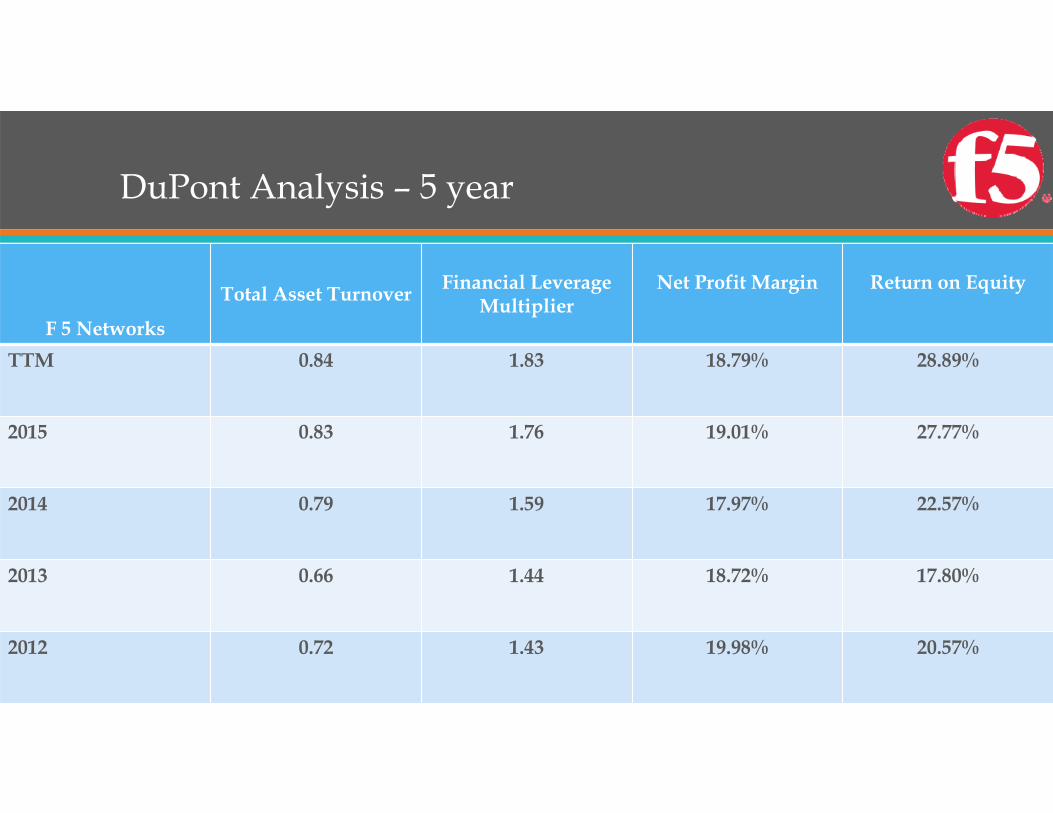
DuPont Analysis – 5 year
F 5 Networks
Total Asset Turnover Financial LeverageMultiplier
Net Profit Margin Return on Equity
TTM 0.84 1.83 18.79% 28.89%
2015 0.83 1.76 19.01% 27.77%
2014 0.79 1.59 17.97% 22.57%
2013 0.66 1.44 18.72% 17.80%
2012 0.72 1.43 19.98% 20.57%

Competitor DuPont Analysis
Using TTM Data
Total Asset Turnover
Financial LeverageMultiplier
Net Profit Margin Return on Equity
F5 Networks 0.84 1.83 18.79% 28.89%
Juniper Networks 0.56 1.88 13.05% 13.72%
CheckpointSoftware
0.32 1.44 42.08% 19.39%
Brocade 0.57 1.56 15.33% 13.63%
Citrix 0.59 2.77 9.75% 15.94%
Riverbed 0.56 2.29 6.54% 8.38%

Total Returns since Inception

Discounted Cash Flows

Discounted Cash Flows – Default

Discounted Cash Flows – Kill it
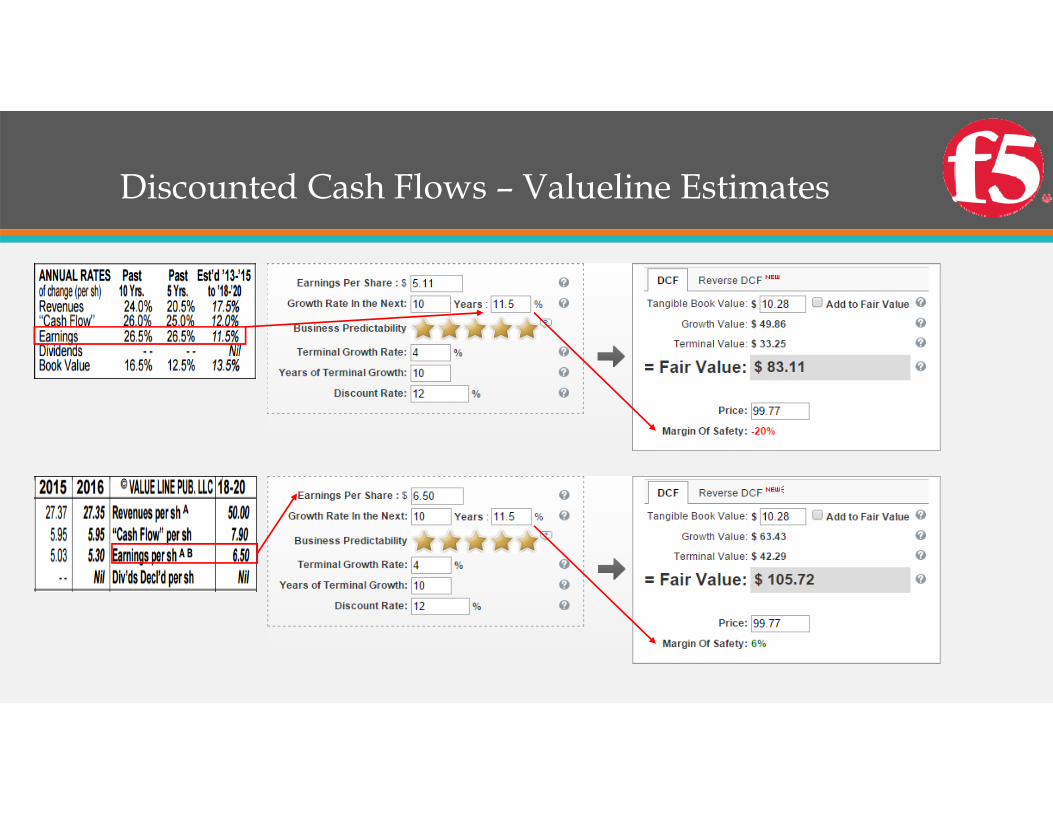
Discounted Cash Flows – Valueline Estimates

Conscious Investor

Conscious Investor – 3 years
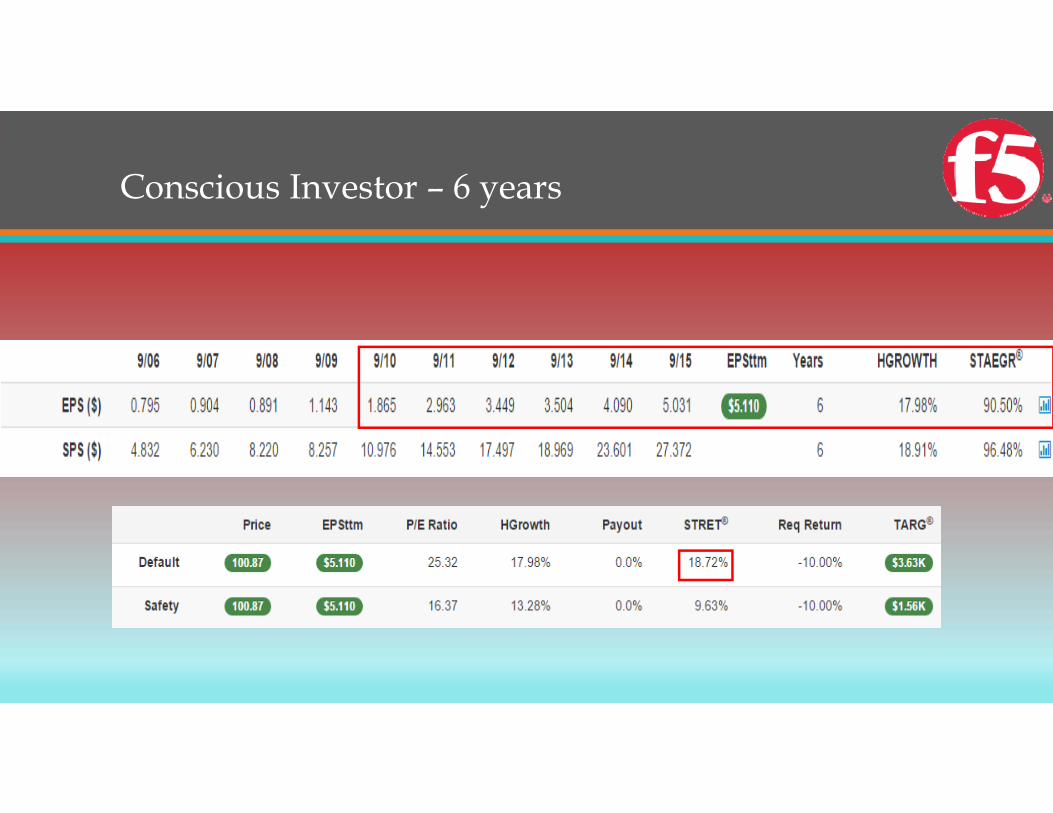
Conscious Investor – 6 years

Conscious Investor – 10 years

Conscious Investor – Safety & Kill It
Cut growth rate by 21.82%
Cut P/E by 17.5% Cut growth rate by 32%

Conscious Investor – Kill It Again
Cut P/E by 39%Cut growth rate by 52.4%

Conclusion
Strong Financials
No Long-Term Debt
High Margins
Moaty-Business
Product Mix
Customers & Partners
Undervalued & Predictable
Comfortable Margin of Safety

Recommendation
Limit Order at $95.50