Embed Size (px)
Citation preview

1
F1/5/2 Umar Banda (358 8110) MAYORAL COMMITTEE: TO: CITY MANAGER
EXECUTIVE MAYOR SUBMISSION GROUP FINANCIAL SERVICES DEPARTMENT: MUNICIPAL FINANCE MANAGEMENT ACT (MFMA): IN-YEAR FINANCIAL REPORT ((MONTHLY BUDGET STATEMENT) FOR THE PERIOD ENDING 31 OCTOBER 2015 1. PURPOSE
The purpose of this report is to provide progress on the actual financial performance of the CoT against the budget in compliance with the Section 71 of the MFMA.
2. STRATEGIC OBJECTIVE
(Unaltered) “To improve financial sustainability”
3. BACKGROUND
Section 71 of the MFMA and the Government Notice 32141 dated 17 April 2009, regarding the “Local Government: Municipal Finance Management Act 2003 Municipal Budget and Reporting Regulations” stipulates that specific financial particulars on the implementation of the budget be reported on and in the format prescribed, hence this report to meet legislative compliance.
(Unaltered) “The monthly budget statement of a municipality must be in the format specified in the “C Schedule” and include all the required tables, charts and explanatory information, taking into account any guidelines issued by the Minister in terms of section 168(1) of the Act.” Further, Section 71 of the MFMA requires that, “the accounting officer of a municipality must by no later than 10 working days after the end of each month submit to the mayor of the municipality, and the relevant national and provincial treasury, a statement in the prescribed format on the state of the municipality's budget reflecting certain particulars for that month and for the financial year up to the end of that month.” For the reporting period ending 31 October 2015, the ten working day reporting limit expires on 13 November 2015.

2
4. DISCUSSION
On 28 May 2015 Council approved the 2015/16 Medium-term Revenue and Expenditure Framework.
The attached report provides a high level analysis as at 31 October 2015 in the format legislated as set out in the “In-year” report (Annexure A) herewith attached. Material variances will be briefly referred to in this report. The detailed will be included in the monthly “Corporate Financial” report.
4.1 Executive Summary
The total consolidated Operating Revenue Budget of the CoT amounts to R26 296m and the Operating Expenditure Budget equates to R25 711m for the 2015/16 financial year. A surplus of R585m is planned. The summary table below indicates the financial performance for the period from 1 July 2015 to 31 October 2015. The actual operating revenue realised (excluding Capital Transfers) amounts to R8 827m, a variance of R40m or 0,5% against YTD Budget. The operating expenditure amounts to R8 578m, a variance of R106m or 1,3%) against YTD Budget. An unfavourable variance of R66m is reflected when YTD Actual is compared against the YTD Budgeted surplus.
DescriptionOctober YTD
Budget
October YTD
ActualVariance Variance
R'000 R'000 R'000 %
Total Revenue By Source (Excluding
Capital Transfers) 8,787,369 8,827,090 39,721 0.5%
Total Operating Expenditure 8,472,295 8,578,412 106,117 1.3%
SURPLUS/DEFICIT 315,074 248,678 (66,396)
Summary Statement of Financial Performance:
The revenue variance is explained by:
• Transfers recognised – operational (R153m favourable) – The non-alignment of projections to the National Treasury payment schedule which is only available after the approval of the MTREF resulted in this variance. Some of transfer allocations, amongst others, received as published in the National and Provincial Treasury payment schedule, are: o Local Government Equitable Share transfer of R689m received on
6 July 2015; and
o Emergency Medical Services grant of R24m received on 24 July 2015.
• Interest earned – outstanding debtors (R62m favourable) – An increase in arrear debtors resulting in higher interest earned on the line-item “Interest on Amounts in Arrear”.

3
• Service charges – electricity revenue (R18m favourable)
• Fines (R63m unfavourable) – The information regarding AARTO transactions, as received from the Road Traffic Infringement Agency, is not configured in-line with GRAP 9 and National Treasury guidelines for capturing within the CoT statements. Administrative processes as well as reporting formats are being re-examined in order to correctly capture the information. An amount of R20 million reflects on Suspense account AARTO Infringement Fees.
• Service charges – water revenue (R60m unfavourable) – “Water Fees” and “Cross-Border Bulk Water” contribute to the variance. This is attributed to the impact of the ICT technical problem on the meter track system. Hence the billing cycle affecting all rates and services could not be fully completed. The figures has been captured in the November 2015 cycle and accounts invoiced.
The expenditure variance is explained by:
• Bulk Purchases (R550m unfavourable) - The line-item “Bulk: Electricity” is the main contributor to this variance. The problem comes from the periodic planning of the electricity bulk purchases for 2015/16. Comparing the actual expenditure for the past two years and current year’s expenditure it shows that the actual is in-line with the budget. The periodic planning will be adjusted during the Adjustments Budget Process.
• Contracted services (R294m unfavourable) – The main line-items contributing to the variance are:
o Prepaid Commission (R328m unfavourable) – A report has to be
submitted to Council for approval of this expenditure. o Household Refuse Removal: Private Sector (R27m unfavourable) –
The Service Delivery and Transformation Management Department has indicated that the service was under-funded and a request for additional funding will be submitted.
• Other expenditure (R268m favourable) – Some of the line-items that contribute to the variance are: o Vehicles (R40m favourable) – The delay in the approval of contract
CB54, resulting in vehicle maintenance projects still being in their planning stages.

4
o Post-Employment Medical Expense (R36m favourable) – Provision on this line-item can only be effected during the year-end process.
o Rental: Plant And Equipment (R32m favourable)
o Post-Employment Pension Expense (R31m favourable) – Provision on this line-items can only be processed at year-end. Re-aga-Tshwane
o Re-aga-Tshwane (R25 million) – The Office of the City Manager has indicated that the under expenditure is as a result of delays in the creation of purchase orders.
o Urban Management (R24 million) – Delays in procurement. The Service Delivery and Transformation Management Department have indicated that procurement would be finalised by the end of November 2015.
• Debt impairment (R250m favourable)
o Bad Debt Written Off (R267m favourable) - Actual expenditure can only be effected on obtaining Council approval upon submission of a report.

5
Below is the table reflecting the Cash Flow position as contained in the regulated C Schedule submitted to National Treasury.
2014/15 Budget Year 2015/16
Unaudited
Outcome
Original
Budget
Monthly
actual
YearTD
actual
YearTD
budget
YTD
variance
YTD
variance
Full Year
Forecast
R thousands 1 %
CASH FLOW FROM OPERATING ACTIVITIES
Receipts
Property rates, penalties & collection charges 4,883,326 4,817,476 408,378 1,695,672 1,605,825 89,847 6% 4,817,476
Serv ice charges 13,293,833 14,588,169 1,315,950 5,285,288 4,862,723 422,566 9% 14,588,169
Other rev enue 1,436,034 1,178,291 55,288 311,026 394,695 (83,669) -21% 1,178,291
Gov ernment - operating 3,081,485 3,666,857 36,678 1,515,177 1,244,685 270,492 22% 3,666,857
Gov ernment - capital 2,596,235 2,453,160 232,902 566,161 584,234 (18,073) -3% 2,453,160
Interest 412,573 193,141 39,286 147,457 63,779 83,678 131% 193,141
Payments
Suppliers and employ ees (21,719,690) (21,907,225) (1,858,490) (9,709,846) (7,320,328) 2,389,518 -33% (21,907,225)
Finance charges (997,465) (1,029,556) (72,122) (321,769) (343,191) (21,423) 6% (1,029,556)
Transfers and Grants (25,600) (259,298) (23,851) (40,241) (86,433) (46,191) 53% (259,298)
NET CASH FROM/(USED) OPERATING ACTIVITIES 2,960,731 3,701,015 134,020 (551,075) 1,005,988 1,557,063 155% 3,701,015
CASH FLOWS FROM INVESTING ACTIVITIES
Receipts
Proceeds on disposal of PPE 197,706 – 6,342 25,257 – 25,257 #DIV/0! –
Decrease (Increase) in non-current debtors 70,512 – (195,697) 424,925 – 424,925 #DIV/0! –
Decrease (increase) other non-current receiv ables (269,436) 48,553 290,283 363,526 16,184 347,342 2146% 48,553
Decrease (increase) in non-current inv estments (156,583) 56,007 (3,402) (17,924) 18,669 (36,593) -196% 56,007
Payments
Capital assets (4,114,918) (3,783,366) (281,690) (667,877) (901,830) (233,954) 26% (3,783,366)
NET CASH FROM/(USED) INVESTING ACTIVITIES (4,272,719) (3,678,806) (184,163) 127,908 (866,977) (994,884) 115% (3,678,806)
CASH FLOWS FROM FINANCING ACTIVITIES
Receipts
Short term loans – – 1,250,000 1,515,000 – 1,515,000 #DIV/0! –
Borrow ing long term/refinancing 1,500,000 1,200,000 (330,000) – – – 1,200,000
Increase (decrease) in consumer deposits 55,733 8,565 2,778 7,352 2,856 4,497 157% 8,565
Payments
Repayment of borrow ing (491,042) (560,350) (793,611) (1,072,634) (186,783) 885,851 -474% (560,350)
NET CASH FROM/(USED) FINANCING ACTIVITIES 1,064,691 648,215 129,167 449,718 (183,928) (633,645) 345% 648,215
NET INCREASE/ (DECREASE) IN CASH HELD (247,298) 670,424 79,024 26,550 (44,917) 670,424
Cash/cash equiv alents at beginning: 847,816 1,203,476 600,518 1,203,476 600,518
Cash/cash equiv alents at month/y ear end: 600,518 1,873,900 627,069 1,158,559 1,270,943
Description Ref
TSH City Of Tshwane - Table C7 Consolidated Monthly Budget Statement - Cash Flow - M04 October
The Cash Flow report above for 31 October 2015 indicates that:
• The cash and cash equivalents closing balance as at the end of October 2015 is R627m.
• Cash flow from operating activities is (R551m) compared to the target of R1 006m.
• Cash flow from investing activities amounts to R128m, compared to a target of (R867m).
• Cash flow from financing activities equates to R450m compared to a target of (R184m).

6
Capital expenditure The summary table hereafter indicates actual year-to-date spending of R668m and a variance of R359m or 35,0% against YTD Budget.
DescriptionOctober YTD
Budget
October YTD
ActualVariance Variance
R'000 R'000 R'000 %
TOTAL Capital Expenditure 1,027,449 667,877 (359,573) -35.0%
TOTAL Capital Financing 1,027,449 667,877 (359,573) -35.0%
Summary statement of Capital Expenditure:
The main departments contributing to the variance of the year-to-date capital expenditure, compared to the departmental Service Delivery Budget Implementation Plan (SDBIP) targets for the municipal vote as indicated in Table C5 are:
• Housing and Human Settlement (R97m) - "Roads and Stormwater - Low Cost Housing - Project Linked Housing" project is the main contributor.
• Transport (R89m) – The "CBD and Surrounding Areas (2010SWC) HOV / BRT Lanes on Corridors to North and Hatfield" project due to the delays in the appointment of a consultant.
• Water and Sanitation (R80m) – The "Reservoir Extensions" project attributed to special specification requirements. The Water and Sanitation Department has indicated that the Supply Chain Management Division will finalise the appointment by 13 November 2015 for the outstanding work.
• Office of the City Manager (R42m) – The delay in the implementation of “Tsosoloso Programme”.
The reasons for variances per Department (Vote) are captured in Table SC1 of this report. Table SC12 provides an analysis of actual capital expenditure compared to the budget targets, on a monthly and year-to-date basis. Expenditure for the period ending 31 October 2015 amounts to R668m against the projection of R1 027m, a variance of R359m or 35,0% is reflected. The total percentage spent against the total original budget amounts to 17,3%. Charts C1 and C2 below illustrate the trend of the capital expenditure against budget per month and the YTD actual against the YTD target.

7
Chart C1: 2015/16 Capital Expenditure
–
200 000
400 000
600 000
800 000
1 000 000
1 200 000
Jul Aug Sep Oct Nov Dec Jan Feb Mar Apr May Jun
2014/15 11 590 389 256 387 683 282 387 280 581 430 030 75 204 220 185 285 899 270 658 336 845 1 146 19
Original Budget 160 072 271 874 322 036 273 468 289 420 316 820 229 815 275 360 326 287 421 008 387 370 583 036
Adjusted Budget – – – – – – – – – – – –
Monthly actual 55 244 114 501 216 442 281 690 – – – – – – – –
R'000
Chart C1 2015/16 Capital Expenditure Monthly Trend: actual v target
Chart C2: 2015/16 Capital Expenditure
–
500 000
1 000 000
1 500 000
2 000 000
2 500 000
3 000 000
3 500 000
4 000 000
Jul Aug Sep Oct Nov Dec Jan Feb Mar Apr May Jun
YearTD actual 55 244 169 745 386 187 667 877 – – – – – – – –
YearTD budget 160 072 431 946 753 982 1 027 44 1 316 86 1 633 69 1 863 50 2 138 86 2 465 15 2 886 16 3 273 53 3 856 56
R'000
Chart C2 2015/16 Capital Expenditure: YTD actual v YTD target
5. INTERDEPARTMENTAL AND CLUSTER IMPACT
None.

8
6. COMMENTS OF THE GROUP LEGAL COUNSEL
The abovementioned report as such does not call for legal clarification. 7. IMPLICATIONS
• Human Resources
Not applicable.
• Finances (budget and value for money)
This report incorporates the financial status for the period ended 31 October 2015. Upon receipt of the statement or report submitted by the Accounting Officer to the Executive Mayor in terms of Section 71 of the MFMA, the Executive Mayor is obliged to take certain steps with regard to “budgetary control and early identification of financial problems” as determined in Section 54 of the MFMA. Furthermore, the Accounting Officer of the Municipality must report in writing to the Municipal Council with regard to impending shortfalls, overspending, and overdrafts in terms of Section 70 of the MFMA.
• Constitution and legal factors
The implication of approval of this report is compliance to legislative requirements (Sections 52(d) and 71 of the MFMA) and NT regulations GG 32141 of 17 April 2009.
• Communication
In compliance to legislative requirements (Section 71 of the MFMA) this document is provided to all stakeholders by placing it on the Tshwane Public website.
• Previous Mayoral Committee Resolutions
Not applicable. CONCLUSION This report meets the MFMA requirement for the Executive Mayor to receive a Section 71 “monthly budget statement” within 10 working days of the end of the month. ANNEXURES: Annexure A – “In-year” report in terms of GG 32141 of 17 April 2009.

9
RECOMMENDED That, in compliance with Section 71 of the MFMA and in terms of Government Notice 32141 dated 17 April 2009, regarding the “Local Government: Municipal Finance Management Act 2003 Municipal Budget and Reporting Regulations”:
1. The Accounting Officer provides the Executive Mayor with the “In-year” report for October 2015;
2. That this statement be submitted to National Treasury and the Provincial Treasury, in
both a signed document format and in electronic format.
3. Mayoral Committee take note of the financial performance of the City as at 31 October 2015.

10
REPORT – FLOW COMPLIANCE CHECK FILE: F1/5/2 INITIATOR: Umar Banda (358-8110) / NM Mokete (358-3625) HEADING (INCLUSIVE OF NAME OF DIVISION/DEPARTMENT): GROUP FINANCIAL SERVICES DEPARTMENT MUNICIPAL FINANCE MANAGEMENT ACT (MFMA): IN-YEAR FINANCIAL REPORT (MONTHLY BUDGET STATEMENT) FOR THE PERIOD ENDING 31 OCTOBER 2015 REPORT CHECKED AND PASSED FOR SUBMISSION TO:
COMPREHENSIVENESS (FACTS, COMMENTS, RECOMMENDATIONS ANNEXURES) (√)
CORRECTNESS (√)
QUALITY (√)
EXECUTIVE DIRECTOR: BUDGET OFFICE NM MOKETE WARD-SPECIFIC : YES NO WARD COUNCILLOR COMMENTS: YES NO SIGNATURE: ……………………………………….….. DATE: …………………………………………………...
ACTING EXECUTIVE DIRECTOR: FINANCIAL REPORTING & ASSETS T NGWENYA WARD-SPECIFIC : YES NO WARD COUNCILLOR COMMENTS: YES NO SIGNATURE: ……………………………………….….. DATE: …………………………………………………...
ACTING EXECUTIVE DIRECTOR: TREASURY OFFICE DL MASIMINI WARD-SPECIFIC : YES NO WARD COUNCILLOR COMMENTS: YES NO SIGNATURE: ……………………………………….….. DATE: …………………………………………………...
ACTING EXECUTIVE DIRECTOR: REVENUE MANAGEMENT: KC THIPE WARD-SPECIFIC : YES NO WARD COUNCILLOR COMMENTS: YES NO SIGNATURE: ……………………………………….….. DATE: ………………………………….………………...
HEAD OF DEPARTMENT: ACTING CHIEF FINANCIAL OFFICER – U BANDA REPORT ALSO BEARS APPROVAL OF : CM SIGNATURE: …………………………………………... DATE: …………………………………….…………..….
MMC: FINANCE DOROTHY MABILETSA REPORT ALSO BEARS APPROVAL FOR LATE SUBMISSION: YES NO SIGNATURE: ………………………………………..…. DATE: ……………………………………………….…...

11
ANNEXURE A
IN-YEAR REPORT
BUDGET YEAR: 2015/16
REPORTING PERIOD: M04 OCTOBER 2015

12
Table of Contents PART 1 – IN-YEAR REPORT ........................................................................................................................ 13 1.1 MAYOR’S REPORT ................................................................................................................ 13 1.2 RESOLUTIONS ....................................................................................................................... 13 1.3 EXECUTIVE SUMMARY ......................................................................................................... 13 1.4 IN-YEAR BUDGET STATEMENT TABLES ............................................................................ 16
(a) Table C1: Consolidated Monthly Budget Statement – Summary ............................................ 17 (b) Table C2: Consolidated Monthly Budget Statement – Financial Performance (standard
Classification) .......................................................................................................................... 18 (c) Table C3: Consolidated Monthly Budget Statement – Financial Performance (Revenue and
Expenditure by Municipal vote) ............................................................................................... 19 (d) Table C4: Consolidated Monthly Budget Statement – Financial Performance (Revenue and
Expenditure) ............................................................................................................................ 20 (e) Table C5: Consolidated Monthly Budget Statement – Capital Expenditure by vote, standard
classification and funding ........................................................................................................ 21 (f) Table C6: Consolidated Monthly Budget Statement – Financial Position ............................... 22 (g) Table C7: Consolidated Monthly Budget Statement – Cash Flow .......................................... 23
PART 2 – SUPPORTING DOCUMENTATION .............................................................................................. 24 (a) Table SC1: Material variance explanations ............................................................................. 24 (b) Table SC2: Monthly Budget Statement – Performance Indicators ......................................... 26 (c) Table SC3: Monthly Budget Statement – Aged Debtors ......................................................... 27 (d) Table SC4: Monthly Budget Statement – Aged Creditors ....................................................... 29 (e) Table SC5: Monthly Budget Statement – Investment Portfolio ............................................... 30 (f) Table SC6: Monthly Budget Statement – Transfers and grant receipts.................................. 31 (g) Table SC7(1): Monthly Budget Statement – Transfers and grant expenditures ..................... 32 (h) Table SC7(2): Monthly Budget Statement – Expenditure against approved rollovers ............ 33 (i) Table SC8: Monthly Budget Statement – Councillor and Staff Benefits ................................. 34 (j) Table SC9: Monthly Budget Statement – Actual and Revised targets for cash receipts ........ 35 (k) Table SC10: Monthly Budget Statement – Parent Municipality Financial Performance (Revenue
and Expenditure) ..................................................................................................................... 36 (l) Table SC11: Monthly Budget Statement – Summary of Municipal Entities ............................ 37 (m) Table SC12: Consolidated Monthly Budget Statement – Capital Expenditure Trend ............. 38 (n) Table SC13a: Consolidated Monthly Budget Statement – Capital expenditure on new assets by
asset class ............................................................................................................................... 39 (o) Table SC13b: Consolidated Monthly Budget Statement – Capital expenditure on renewal of
existing assets by asset class ................................................................................................. 40 (p) Table SC13c: Consolidated Monthly Budget Statement – Capital expenditure on repairs and
maintenance by asset class .................................................................................................... 41 (q) Table SC13d: Consolidated Monthly Budget Statement - Depreciation by asset class ......... 42 (r) Municipal manager’s quality certification ................................................................................. 43

13
PART 1 – IN-YEAR REPORT
1.1 MAYOR’S REPORT
On 28 May 2015 Council approved the MTREF for the 2015/16 financial year which gives effect to the financial plan of the City of Tshwane (CoT). The budget has been uploaded onto SAP (Accounting System utilised by the municipality) and locked as required by regulation. The CoT advocates the efforts of National Treasury by adhering to the Municipal Budget and Reporting Regulations that is designed to achieve a range of objectives, including improving the local government sphere’s ability to deliver services by facilitating improved financial sustainability and better medium term planning. The CoT ultimately aims to act in accordance with the principles of good governance, transparency and stewardship of public resources.
1.2 RESOLUTIONS That, in compliance with Section 71 of the MFMA and in terms of Government Notice 32141 dated 17 April 2009, regarding the “Local Government: Municipal Finance Management Act 2003 Municipal Budget and Reporting Regulations”:
a. The Accounting Officer provides the Executive Mayor with the “In-year” report for October 2015;
b. That this statement be submitted to National Treasury and the Provincial Treasury, in
both a signed document format and in electronic format. c. Mayoral Committee take note of the financial performance of the City as at 31 October
2015.
1.3 EXECUTIVE SUMMARY
The total consolidated Operating Revenue Budget of the CoT amounts to R26 296m and the Operating Expenditure Budget equates to R25 711m for the 2015/16 financial year. A surplus of R585m is planned. The Statement of Financial Performance shown in Table C1 of this report is prepared on a basis of the prescribed budget format by National Treasury, detailing revenue by source type and expenditure by input type. The summary table below indicates the financial performance for the period from 1 July 2015 to 31 October 2015. The actual operating revenue realised (excluding Capital Transfers) amounts to R8 827m, a variance of R40m or 0,5% against YTD Budget. The operating expenditure amounts to R8 578m, a variance of R106m or 1,3% against YTD Budget. An unfavourable variance of R66m is reflected when YTD Actual is compared against the YTD Budget.

14
DescriptionOctober YTD
Budget
October YTD
ActualVariance Variance
R'000 R'000 R'000 %
Total Revenue By Source (Excluding
Capital Transfers) 8,787,369 8,827,090 39,721 0.5%
Total Operating Expenditure 8,472,295 8,578,412 106,117 1.3%
SURPLUS/DEFICIT 315,074 248,678 (66,396)
Summary Statement of Financial Performance:
The revenue variance is explained by:
• Transfers recognised – operational (R153m favourable)
• Interest earned – outstanding debtors (R62m favourable)
• Service charges – electricity revenue (R18m favourable)
• Service charges – water revenue (R60m unfavourable)
• Fines (R63m unfavourable) The expenditure variance is explained by:
• Bulk purchases (R550m unfavourable)
• Contracted services (R294m unfavourable)
• Other expenditure (R268m favourable)
• Debt impairment (R250m favourable)
The reasons for variances per source/type group are captured in Table SC1 of this report. The Capital expenditure report shown in Table C5 of this report has been prepared on the basis of the format required to be lodged electronically with National Treasury, and is categorised by municipal vote. The summary table hereafter indicates actual year-to-date spending of R668m and a variance of R359m or 35,0% against YTD Budget.
DescriptionOctober YTD
Budget
October YTD
ActualVariance Variance
R'000 R'000 R'000 %
TOTAL Capital Expenditure 1,027,449 667,877 (359,573) -35.0%
TOTAL Capital Financing 1,027,449 667,877 (359,573) -35.0%
Summary statement of Capital Expenditure:
The main departments contributing to the variance of the year-to-date capital expenditure, compared to the departmental Service Delivery Budget Implementation Plan (SDBIP) targets for the municipal vote as indicated in Table C5 are:
• Housing and Human Settlement (R97m)
• Transport (R89m)
• Water and Sanitation (R80m)
• Office of the City Manager (R42m)
The reasons for variances per Department (Vote) are captured in Table SC1 of this report.

15
Table SC12 provides an analysis of actual capital expenditure compared to the budget targets, on a monthly and year-to-date basis. Expenditure for the period ending 31 October 2015 amounts to R668m against the projection of R1 027m, a variance of R359m or 35,0% is reflected. The total percentage spent against the total original budget amounts to 17,3%.
Charts C1 and C2 below illustrate the trend of the capital expenditure against budget per month and the YTD actual against the YTD target. Chart C1: 2015/16 Capital Expenditure
–
200 000
400 000
600 000
800 000
1 000 000
1 200 000
Jul Aug Sep Oct Nov Dec Jan Feb Mar Apr May Jun
2014/15 11 590 389 256 387 683 282 387 280 581 430 030 75 204 220 185 285 899 270 658 336 845 1 146 19
Original Budget 160 072 271 874 322 036 273 468 289 420 316 820 229 815 275 360 326 287 421 008 387 370 583 036
Adjusted Budget – – – – – – – – – – – –
Monthly actual 55 244 114 501 216 442 281 690 – – – – – – – –
R'000
Chart C1 2015/16 Capital Expenditure Monthly Trend: actual v target

16
Chart C2: 2015/16 Capital Expenditure
–
500 000
1 000 000
1 500 000
2 000 000
2 500 000
3 000 000
3 500 000
4 000 000
Jul Aug Sep Oct Nov Dec Jan Feb Mar Apr May Jun
YearTD actual 55 244 169 745 386 187 667 877 – – – – – – – –
YearTD budget 160 072 431 946 753 982 1 027 44 1 316 86 1 633 69 1 863 50 2 138 86 2 465 15 2 886 16 3 273 53 3 856 56
R'000
Chart C2 2015/16 Capital Expenditure: YTD actual v YTD target
1.4 IN-YEAR BUDGET STATEMENT TABLES
The financial results for the period ended 31 October 2015 are reflected in Tables C1 to C7 hereafter:

17
(a) Table C1: Consolidated Monthly Budget Statement – Summary
TSH City Of Tshwane - Table C1 Consolidated Monthly Budget Statement Summary - M04 October
2014/15
Unaudited
Outcome
Original
Budget
Monthly
actual
YearTD
actual
YearTD
budget
YTD
variance
YTD
variance
Full Year
Forecast
R thousands %
Financial Performance
Property rates 4 906 267 5 236 387 408 378 1 695 672 1 745 510 (49 838) -3% 5 236 387
Serv ice charges 14 013 954 15 913 703 1 315 950 5 285 265 5 315 086 (29 822) -1% 15 913 703
Investment rev enue 38 023 70 600 3 362 13 517 23 570 (10 053) -43% 70 600
Transfers recognised - operational 3 353 002 3 670 241 84 129 1 387 071 1 234 187 152 884 12% 3 670 241
Other own rev enue 2 121 509 1 404 899 91 812 445 565 469 015 (23 450) -5% 1 404 899
Total Revenue (excluding capital transfers
and contributions)
24 432 755 26 295 831 1 903 631 8 827 090 8 787 369 39 721 0% 26 295 831
Employee costs 6 665 636 7 058 527 637 147 2 192 152 2 240 772 (48 621) -2% 7 058 527
Remuneration of Councillors 107 840 116 298 9 964 37 641 38 649 (1 008) -3% 116 298
Depreciation & asset impairment 1 302 240 1 188 780 99 654 360 446 396 232 (35 786) -9% 1 188 780
Finance charges 996 967 1 029 556 72 122 321 769 343 191 (21 423) -6% 1 029 556
Materials and bulk purchases 7 464 155 9 164 376 1 392 468 3 524 215 3 041 931 482 284 16% 9 164 376
Transfers and grants 218 658 259 298 23 851 40 241 86 099 (45 858) -53% 259 298
Other ex penditure 8 052 834 6 894 081 609 239 2 101 948 2 325 420 (223 472) -10% 6 894 081
Total Expenditure 24 808 330 25 710 916 2 844 444 8 578 412 8 472 295 106 117 1% 25 710 916
Surplus/(Deficit) (375 575) 584 915 (940 813) 248 678 315 074 (66 396) -21% 584 915
Transfers recognised - capital 2 502 013 2 453 160 186 723 384 533 716 364 (331 831) -46% 2 453 160
Surplus/(Deficit) after capital transfers &
contributions
2 126 438 3 038 075 (754 090) 633 210 1 031 438 (398 227) -39% 3 038 075
Surplus/ (Deficit) for the year 2 126 438 3 038 075 (754 090) 633 210 1 031 438 (398 227) -39% 3 038 075
Capital expenditure & funds sources
Capital expenditure 3 979 945 3 856 566 281 690 667 877 1 027 449 (359 573) -35% 3 856 566
Capital transfers recognised 2 523 466 2 453 160 189 301 387 388 624 643 (237 255) -38% 2 453 160
Public contributions & donations 47 847 168 407 11 229 37 133 45 986 (8 853) -19% 168 407
Borrow ing 1 319 656 1 200 000 80 661 242 851 349 987 (107 136) -31% 1 200 000
Internally generated funds 88 975 35 000 499 504 6 833 (6 329) -93% 35 000
Total sources of capital funds 3 979 945 3 856 566 281 690 667 877 1 027 449 (359 573) -35% 3 856 566
Financial position
Total current assets 5 078 600 6 193 667 4 525 926 6 193 667
Total non current assets 33 534 361 34 914 830 33 851 173 34 914 830
Total current liabilities 7 173 588 6 064 125 6 076 645 6 064 125
Total non current liabilities 12 663 701 14 316 237 13 075 281 14 316 237
Community wealth/Equity 18 775 672 20 728 135 19 225 172 20 728 135
Cash flows
Net cash from (used) operating 2 960 731 3 701 015 (1 065 980) (1 751 075) 1 005 988 2 757 063 274% 3 701 015
Net cash from (used) investing (4 272 719) (3 678 806) (184 163) 127 908 (866 977) (994 884) 115% (3 678 806)
Net cash from (used) financing 1 064 691 648 215 1 329 167 1 649 718 (183 928) (1 833 645) 997% 648 215
Cash/cash equivalents at the month/year end 600 518 1 873 900 – 627 069 1 158 559 531 491 46% 1 270 943
Debtors & creditors analysis 0-30 Days 31-60 Days 91-120 Days 121-150 Dys 151-180 Dys181 Dys-1
YrOver 1Yr Total
Debtors Age Analysis
Total By Income Source 1 444 105 166 859 181 007 173 514 334 194 949 865 3 821 488 7 301 358
Creditors Age Analysis
Total Creditors 3 848 096 – – – – – – 3 848 096
Description
Budget Year 2015/16

18
(b) Table C2: Consolidated Monthly Budget Statement – Financial Performance (standard Classification)
2014/15 Budget Year 2015/16
Unaudited
Outcome
Original
Budget
Monthly
actual
YearTD
actual
YearTD
budget
YTD
variance
YTD
variance
Full Year
Forecast
R thousands 1 %
Revenue - Standard
Governance and administration 8 610 655 8 801 188 435 563 3 043 776 2 927 093 116 683 4% 8 801 188
Executiv e and council 181 695 115 176 6 851 8 458 31 708 (23 250) -73% 115 176
Budget and treasury office 8 241 114 8 373 584 421 547 2 925 886 2 791 242 134 643 5% 8 373 584
Corporate serv ices 187 846 312 427 7 165 109 432 104 142 5 290 5% 312 427
Community and public safety 1 408 260 1 131 882 50 600 135 170 345 565 (210 395) -61% 1 131 882
Community and social serv ices 64 383 53 546 1 542 5 993 15 099 (9 106) -60% 53 546
Sport and recreation 28 834 19 994 1 192 4 388 6 665 (2 276) -34% 19 994
Public safety 307 726 204 695 2 032 5 009 68 232 (63 222) -93% 204 695
Housing 889 108 731 636 25 382 53 707 214 900 (161 193) -75% 731 636
Health 118 207 122 011 20 452 66 072 40 670 25 402 62% 122 011
Economic and environmental services 1 583 212 1 863 543 121 096 341 430 578 635 (237 204) -41% 1 863 543
Planning and development 273 104 262 857 22 171 66 473 98 576 (32 104) -33% 262 857
Road transport 1 309 124 1 600 410 98 924 274 761 479 966 (205 206) -43% 1 600 410
Env ironmental protection 984 276 1 197 92 105 114% 276
Trading services 15 141 032 16 765 118 1 462 910 5 629 965 5 590 019 39 946 1% 16 765 118
Electricity 9 697 389 10 991 099 905 256 3 693 140 3 661 436 31 704 1% 10 991 099
Water 3 418 070 3 711 560 352 607 1 230 976 1 244 350 (13 374) -1% 3 711 560
Waste w ater management 1 004 037 887 831 107 048 321 368 292 680 28 688 10% 887 831
Waste management 1 021 537 1 174 628 98 000 384 480 391 553 (7 073) -2% 1 174 628
Other 4 191 610 187 260 20 185 61 281 62 420 (1 139) -2% 187 260
Total Revenue - Standard 2 26 934 768 28 748 991 2 090 354 9 211 622 9 503 733 (292 110) -3% 28 748 991
Expenditure - Standard
Governance and administration 5 303 721 5 130 232 276 521 1 307 968 1 700 954 (392 986) -23% 5 130 232
Executiv e and council 1 568 461 1 417 378 123 674 413 900 463 381 (49 481) -11% 1 417 378
Budget and treasury office 578 452 691 049 16 670 58 262 230 044 (171 782) -75% 691 049
Corporate serv ices 3 156 808 3 021 805 136 177 835 806 1 007 529 (171 723) -17% 3 021 805
Community and public safety 3 526 319 3 733 359 343 907 1 067 288 1 212 046 (144 759) -12% 3 733 359
Community and social serv ices 561 611 650 470 45 705 151 477 208 376 (56 899) -27% 650 470
Sport and recreation 364 428 444 000 52 024 151 133 147 130 4 003 3% 444 000
Public safety 1 665 436 1 738 320 142 547 472 756 564 174 (91 419) -16% 1 738 320
Housing 484 774 438 177 57 503 138 340 143 966 (5 625) -4% 438 177
Health 450 072 462 391 46 127 153 581 148 400 5 181 3% 462 391
Economic and environmental services 2 407 406 2 272 994 259 320 767 948 745 058 22 891 3% 2 272 994
Planning and development 723 602 741 132 66 566 209 572 241 455 (31 883) -13% 741 132
Road transport 1 627 203 1 505 049 190 288 549 545 492 992 56 553 11% 1 505 049
Env ironmental protection 56 601 26 813 2 465 8 832 10 611 (1 779) -17% 26 813
Trading services 13 380 306 14 381 827 1 945 584 5 376 249 4 751 267 624 982 13% 14 381 827
Electricity 8 717 099 9 536 368 1 488 113 3 856 112 3 162 688 693 424 22% 9 536 368
Water 3 024 369 3 291 217 309 712 1 059 454 1 076 256 (16 802) -2% 3 291 217
Waste w ater management 589 261 553 715 53 447 150 740 189 442 (38 702) -20% 553 715
Waste management 1 049 577 1 000 526 94 312 309 942 322 881 (12 939) -4% 1 000 526
Other 190 578 192 505 19 112 58 959 62 970 (4 011) -6% 192 505
Total Expenditure - Standard 3 24 808 330 25 710 916 2 844 444 8 578 412 8 472 295 106 117 1% 25 710 916
Surplus/ (Deficit) for the year 2 126 438 3 038 075 (754 090) 633 210 1 031 438 (398 227) -39% 3 038 075
RefDescription
TSH City Of Tshwane - Table C2 Consolidated Monthly Budget Statement - Financial Performance (standard classification) - M04
Note: The variance in for the Total Revenue in Table C1 differs to that in Table C2 because in Table C1 the Capital Transfers has been excluded, whereas in Table C2 it has been included.

19
(c) Table C3: Consolidated Monthly Budget Statement – Financial Performance (Revenue and Expenditure by Municipal vote)
Vote Description 2014/15
Unaudited
Outcome
Original
Budget
Monthly
actual
YearTD
actual
YearTD
budget
YTD
variance
YTD
variance
Full Year
Forecast
R thousands %
Revenue by Vote 1
Vote 1 - City Planning & Dev elopment 122 830 129 674 5 940 20 126 43 225 (23 099) -53,4% 129 674
Vote 2 - Corporate & Shared Serv ices 102 397 102 508 735 85 931 34 169 51 762 151,5% 102 508
Vote 3 - Economic Dev elopment 94 626 90 390 15 538 41 968 41 087 880 2,1% 90 390
Vote 4 - Emergency Serv ices 73 757 70 689 19 915 45 653 23 563 22 090 93,7% 70 689
Vote 5 - Env ironmental Management 1 187 220 139 983 9 824 54 135 46 671 7 464 16,0% 139 983
Vote 6 - Group Financial Serv ices 8 285 642 8 449 183 427 517 2 943 136 2 816 442 126 694 4,5% 8 449 183
Vote 7 - Housing & Human Settlement 866 317 711 662 25 380 47 969 208 242 (160 273) -77,0% 711 662
Vote 8 - Group Information & Communication Technology 43 1 790 3 388 597 (209) -35,1% 1 790
Vote 9 - Metro Police Serv ices 424 868 202 349 1 064 2 736 67 450 (64 714) -95,9% 202 349
Vote 10 - Office of the City Manager 178 223 250 000 30 257 48 923 79 167 (30 244) -38,2% 250 000
Vote 11 - Serv ice Deliv ery & Transformation Management 120 511 1 441 046 116 368 454 552 480 348 (25 796) -5,4% 1 441 046
Vote 12 - Water & Sanitation Department 4 422 102 4 597 964 459 654 1 552 343 1 536 555 15 788 1,0% 4 597 964
Vote 13 - Energy & Electricity Department 9 684 534 10 840 643 881 065 3 648 883 3 611 284 37 599 1,0% 10 840 643
Vote 14 - Transport 1 208 488 1 485 608 94 026 246 246 441 699 (195 453) -44,3% 1 485 608
Vote 15 - Other Votes 163 209 235 503 3 069 18 634 73 234 (54 600) -74,6% 235 503
Total Revenue by Vote 2 26 934 768 28 748 991 2 090 354 9 211 622 9 503 733 (292 110) -3,1% 28 748 991
Expenditure by Vote 1
Vote 1 - City Planning & Dev elopment 293 172 304 449 25 044 81 139 97 836 (16 697) -17,1% 304 449
Vote 2 - Corporate & Shared Serv ices 1 484 700 1 308 669 104 450 353 090 431 180 (78 090) -18,1% 1 308 669
Vote 3 - Economic Dev elopment 381 125 391 472 37 790 118 345 129 609 (11 264) -8,7% 391 472
Vote 4 - Emergency Serv ices 556 702 576 004 56 167 183 683 184 236 (553) -0,3% 576 004
Vote 5 - Env ironmental Management 680 942 358 187 33 667 99 862 118 856 (18 994) -16,0% 358 187
Vote 6 - Group Financial Serv ices 1 200 707 1 465 401 (99 014) 102 242 480 691 (378 449) -78,7% 1 465 401
Vote 7 - Housing & Human Settlement 368 934 366 826 54 387 123 441 121 497 1 944 1,6% 366 826
Vote 8 - Group Information & Communication Technology 602 792 533 650 57 385 261 798 194 670 67 128 34,5% 533 650
Vote 9 - Metro Police Serv ices 1 853 553 1 789 763 143 752 482 349 580 930 (98 581) -17,0% 1 789 763
Vote 10 - Office of the City Manager 504 762 264 063 16 817 74 841 86 868 (12 026) -13,8% 264 063
Vote 11 - Serv ice Deliv ery & Transformation Management 3 270 228 4 432 871 423 467 1 365 938 1 430 262 (64 324) -4,5% 4 432 871
Vote 12 - Water & Sanitation Department 3 390 463 3 400 902 320 951 1 083 120 1 125 725 (42 606) -3,8% 3 400 902
Vote 13 - Energy & Electricity Department 7 396 027 8 136 834 1 351 710 3 398 815 2 710 158 688 657 25,4% 8 136 834
Vote 14 - Transport 1 304 559 978 004 138 514 373 512 322 033 51 479 16,0% 978 004
Vote 15 - Other Votes 1 519 661 1 403 824 179 355 476 236 457 743 18 493 4,0% 1 403 824
Total Expenditure by Vote 2 24 808 330 25 710 916 2 844 444 8 578 412 8 472 295 106 117 1,3% 25 710 916
Surplus/ (Deficit) for the year 2 2 126 438 3 038 075 (754 090) 633 210 1 031 438 (398 227) -38,6% 3 038 075
TSH City Of Tshwane - Table C3 Consolidated Monthly Budget Statement - Financial Performance (revenue and expenditure by municipal
vote) - M04 October
Ref
Budget Year 2015/16
20
(d) Table C4: Consolidated Monthly Budget Statement – Financial Performance (Revenue and Expenditure)
2014/15
Unaudited
Outcome
Original
Budget
Monthly
actual
YearTD
actual
YearTD
budget
YTD
variance
YTD
variance
Full Year
Forecast
R thousands %
Revenue By Source
Property rates 4 906 267 5 236 387 408 378 1 695 672 1 745 510 (49 838) -3% 5 236 387
Serv ice charges - electricity rev enue 9 088 425 10 471 749 828 920 3 513 272 3 494 861 18 411 1% 10 471 749
Serv ice charges - water rev enue 2 986 755 3 386 947 306 438 1 074 663 1 134 263 (59 601) -5% 3 386 947
Serv ice charges - sanitation rev enue 753 068 806 647 72 269 262 798 269 832 (7 034) -3% 806 647
Serv ice charges - refuse rev enue 968 073 1 095 779 93 426 366 024 365 270 754 0% 1 095 779
Serv ice charges - other 217 632 152 581 14 897 68 508 50 860 17 648 35% 152 581
Rental of facilities and equipment 117 710 112 907 4 368 31 890 37 622 (5 733) -15% 112 907
Interest earned - ex ternal inv estments 38 023 70 600 3 362 13 517 23 570 (10 053) -43% 70 600
Interest earned - outstanding debtors 374 463 216 338 35 925 133 940 72 263 61 677 85% 216 338
Fines 294 458 196 691 844 2 690 65 564 (62 874) -96% 196 691
Licences and permits 53 244 57 680 4 153 12 933 19 227 (6 294) -33% 57 680
Transfers recognised - operational 3 353 002 3 670 241 84 129 1 387 071 1 234 187 152 884 12% 3 670 241
Other rev enue 1 261 195 821 284 45 923 263 513 274 339 (10 826) -4% 821 284
Gains on disposal of PPE 20 440 – 600 600 – 600 #DIV/0! –
Total Revenue (excluding capital transfers and
contributions)
24 432 755 26 295 831 1 903 631 8 827 090 8 787 369 39 721 0% 26 295 831
Expenditure By Type
Employ ee related costs 6 665 636 7 058 527 637 147 2 192 152 2 240 772 (48 621) -2% 7 058 527
Remuneration of councillors 107 840 116 298 9 964 37 641 38 649 (1 008) -3% 116 298
Debt impairment 1 033 778 1 063 228 21 579 104 348 354 408 (250 061) -71% 1 063 228
Depreciation & asset impairment 1 302 240 1 188 780 99 654 360 446 396 232 (35 786) -9% 1 188 780
Finance charges 996 967 1 029 556 72 122 321 769 343 191 (21 423) -6% 1 029 556
Bulk purchases 7 197 334 8 795 118 1 382 526 3 468 101 2 917 845 550 256 19% 8 795 118
Other materials 266 821 369 258 9 942 56 114 124 086 (67 972) -55% 369 258
Contracted serv ices 3 078 495 1 975 982 247 101 945 115 650 855 294 261 45% 1 975 982
Transfers and grants 218 658 259 298 23 851 40 241 86 099 (45 858) -53% 259 298
Other ex penditure 3 831 775 3 854 871 339 937 1 051 863 1 320 157 (268 294) -20% 3 854 871
Loss on disposal of PPE 108 786 – 622 622 0 622 186553% –
Total Expenditure 24 808 330 25 710 916 2 844 444 8 578 412 8 472 295 106 117 1% 25 710 916
Surplus/(Deficit) (375 575) 584 915 (940 813) 248 678 315 074 (66 396) (0) 584 915
Transfers recognised - capital 2 502 013 2 453 160 186 723 384 533 716 364 (331 831) (0) 2 453 160
Surplus/(Deficit) after capital transfers &
contributions
2 126 438 3 038 075 (754 090) 633 210 1 031 438 3 038 075
Taxation – – – – – – –
Surplus/(Deficit) after taxation 2 126 438 3 038 075 (754 090) 633 210 1 031 438 3 038 075
Attributable to minorities – – – – – –
Surplus/(Deficit) attributable to municipality 2 126 438 3 038 075 (754 090) 633 210 1 031 438 3 038 075
Share of surplus/ (deficit) of associate – – – – – –
Surplus/ (Deficit) for the year 2 126 438 3 038 075 (754 090) 633 210 1 031 438 3 038 075
Description Ref
Budget Year 2015/16
TSH City Of Tshwane - Table C4 Consolidated Monthly Budget Statement - Financial Performance (revenue and expenditure) - M04 October
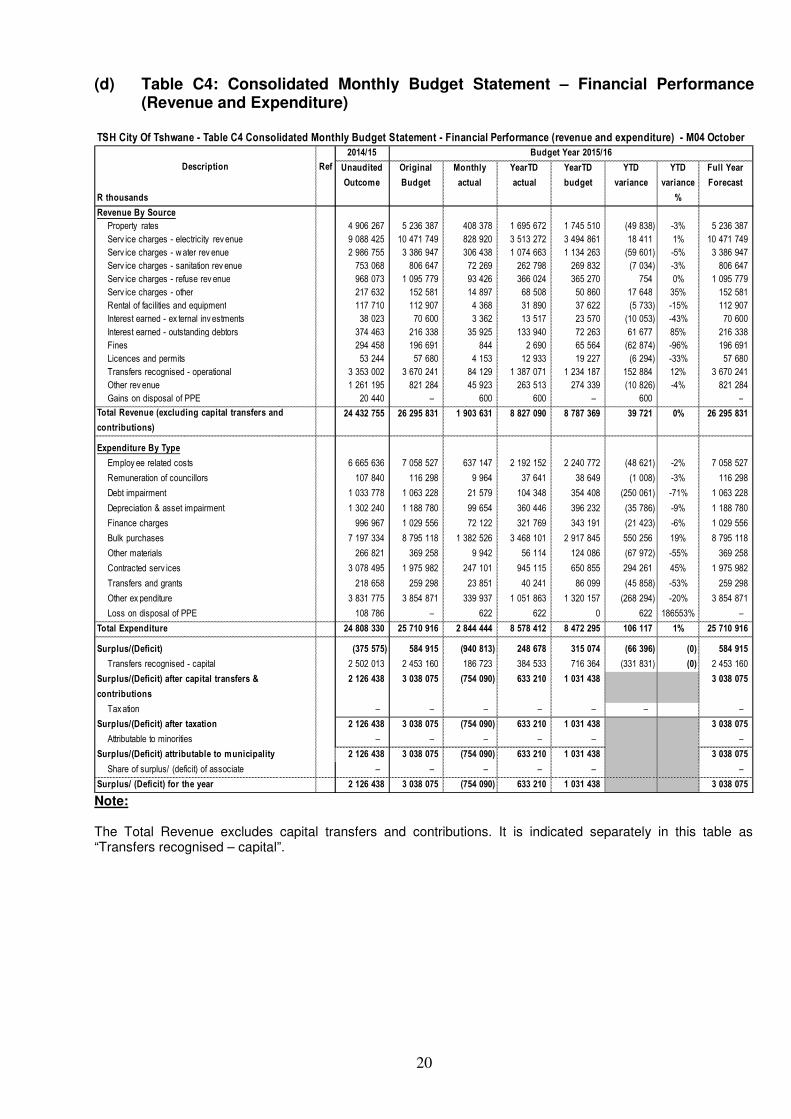
Note: The Total Revenue excludes capital transfers and contributions. It is indicated separately in this table as “Transfers recognised – capital”.

21
(e) Table C5: Consolidated Monthly Budget Statement – Capital Expenditure by vote, standard classification and funding
2014/15 Budget Year 2015/16
Unaudited
Outcome
Original
Budget
Monthly
actual
YearTD
actual
YearTD
budget
YTD
variance
YTD
variance
Full Year
Forecast
R thousands 1 %
Multi-Year expenditure appropriation 2
Vote 1 - City Planning & Dev elopment 462 30 000 – – 3 000 (3 000) -100% 30 000
Vote 2 - Corporate & Shared Serv ices 17 693 23 407 – – 7 802 (7 802) -100% 23 407
Vote 3 - Economic Dev elopment 2 472 67 100 – – 9 500 (9 500) -100% 67 100
Vote 4 - Emergency Serv ices 22 649 6 000 734 1 855 400 1 455 364% 6 000
Vote 5 - Env ironmental Management 72 155 98 000 1 047 5 472 21 300 (15 828) -74% 98 000
Vote 6 - Group Financial Serv ices 736 35 250 7 802 7 807 11 050 (3 243) -29% 35 250
Vote 7 - Housing & Human Settlement 838 242 670 500 23 582 40 738 137 460 (96 722) -70% 670 500
Vote 8 - Group Information & Communication Technology 72 488 96 500 13 496 14 231 40 000 (25 769) -64% 96 500
Vote 9 - Metro Police Serv ices 8 368 10 000 – – 1 000 (1 000) -100% 10 000
Vote 10 - Office of the City Manager 345 180 280 000 33 112 51 770 93 333 (41 563) -45% 280 000
Vote 11 - Serv ice Deliv ery & Transformation Management – – – – – – –
Vote 12 - Water & Sanitation Department 417 245 355 000 59 042 122 144 202 171 (80 026) -40% 355 000
Vote 13 - Energy & Electricity Department 514 694 447 500 67 372 123 626 92 050 31 576 34% 447 500
Vote 14 - Transport 1 498 723 1 473 085 67 691 200 984 290 050 (89 066) -31% 1 473 085
Vote 15 - Other Votes 158 432 163 551 7 813 24 080 41 150 (17 070) -41% 163 551
Total Capital Multi-year expenditure 4,7 3 969 540 3 755 893 281 690 592 708 950 266 (357 558) -38% 3 755 893
Single Year expenditure appropriation 2
Vote 3 - Economic Dev elopment – 10 900 – – – – 10 900
Vote 5 - Env ironmental Management 10 405 5 000 – 790 2 000 (1 210) -60% 5 000
Vote 8 - Group Information & Communication Technology – 75 773 – 74 378 74 883 (505) -1% 75 773
Vote 15 - Other Votes – 9 000 – – 300 (300) -100% 9 000
Total Capital single-year expenditure 4 10 405 100 673 – 75 169 77 183 (2 014) -3% 100 673
Total Capital Expenditure 3 979 945 3 856 566 281 690 667 877 1 027 449 (359 573) -35% 3 856 566
Capital Expenditure - Standard Classification
Governance and administration 394 253 381 481 30 985 106 104 183 919 (77 815) -42% 381 481
Executiv e and council 249 249 112 801 10 203 10 208 36 900 (26 693) -72% 112 801
Budget and treasury office – 30 000 7 284 7 284 10 000 (2 716) -27% 30 000
Corporate serv ices 145 004 238 680 13 499 88 612 137 019 (48 406) -35% 238 680
Community and public safety 1 062 547 941 500 32 126 66 701 189 160 (122 459) -65% 941 500
Community and social serv ices 49 891 34 000 – – 2 900 (2 900) -100% 34 000
Sport and recreation 105 235 136 000 2 145 2 702 22 900 (20 198) -88% 136 000
Public safety 31 017 16 000 734 1 855 1 400 455 32% 16 000
Housing 838 242 670 500 23 582 40 738 137 460 (96 722) -70% 670 500
Health 38 163 85 000 5 665 21 406 24 500 (3 094) -13% 85 000
Economic and environmental services 1 502 888 1 554 085 67 691 200 984 300 050 (99 066) -33% 1 554 085
Planning and dev elopment 2 707 78 000 – – 9 500 (9 500) -100% 78 000
Road transport 1 498 723 1 473 085 67 691 200 984 290 050 (89 066) -31% 1 473 085
Env ironmental protection 1 457 3 000 – – 500 (500) -100% 3 000
Trading services 1 008 340 969 500 150 163 292 968 351 221 (58 252) -17% 969 500
Electricity 514 694 447 500 67 372 123 626 92 050 31 576 34% 447 500
Water 113 391 149 929 12 146 28 356 62 753 (34 397) -55% 149 929
Waste water management 367 850 355 071 70 324 135 874 189 418 (53 543) -28% 355 071
Waste management 12 405 17 000 322 5 112 7 000 (1 888) -27% 17 000
Other 11 917 10 000 725 1 119 3 100 (1 981) -64% 10 000
Total Capital Expenditure - Standard Classification 3 3 979 945 3 856 566 281 690 667 877 1 027 449 (359 573) -35% 3 856 566
Funded by:
National Gov ernment 2 512 450 2 408 542 189 301 387 010 617 103 (230 093) -37% 2 408 542
Prov incial Gov ernment 6 562 40 551 – – 6 117 (6 117) -100% 40 551
Other transfers and grants 4 454 4 067 – 378 1 423 (1 045) -73% 4 067
Transfers recognised - capital 2 523 466 2 453 160 189 301 387 388 624 643 (237 255) -38% 2 453 160
Public contributions & donations 5 47 847 168 407 11 229 37 133 45 986 (8 853) -19% 168 407
Borrowing 6 1 319 656 1 200 000 80 661 242 851 349 987 (107 136) -31% 1 200 000
Internally generated funds 88 975 35 000 499 504 6 833 (6 329) -93% 35 000
Total Capital Funding 3 979 945 3 856 566 281 690 667 877 1 027 449 (359 573) -35% 3 856 566
TSH City Of Tshwane - Table C5 Consolidated Monthly Budget Statement - Capital Expenditure (municipal vote, standard classification
and funding - M04 October
Vote Description Ref

22
(f) Table C6: Consolidated Monthly Budget Statement – Financial Position
2014/15 Budget Year 2015/16
Unaudited
Outcome
Original
Budget
YearTD
actual
Full Year
Forecast
R thousands 1
ASSETS
Current assets
Cash 97 559 241 124 228 687 241 124
Call inv estment deposits 502 960 1 632 776 398 381 1 632 776
Consumer debtors 2 489 954 2 857 768 2 159 726 2 857 768
Other debtors 1 399 819 720 978 1 029 506 720 978
Current portion of long-term receiv ables 102 166 267 418 123 970 267 418
Inv entory 486 143 473 603 585 655 473 603
Total current assets 5 078 600 6 193 667 4 525 926 6 193 667
Non current assets
Long-term receiv ables 58 405 161 230 18 676 161 230
Inv estments 711 44 110 711 44 110
Inv estment property 859 753 957 381 854 759 957 381
Property , plant and equipment 28 437 461 33 427 936 28 830 044 33 427 936
Intangible assets 250 696 324 173 250 296 324 173
Other non-current assets 3 927 336 – 3 896 687 –
Total non current assets 33 534 361 34 914 830 33 851 173 34 914 830
TOTAL ASSETS 38 612 961 41 108 496 38 377 099 41 108 496
LIABILITIES
Current liabilities
Bank overdraft – – – –
Borrow ing 598 970 587 251 685 521 587 251
Consumer deposits 355 016 430 766 358 790 430 766
Trade and other pay ables 6 219 602 5 041 703 5 032 334 5 041 703
Prov isions – 4 405 – 4 405
Total current liabilities 7 173 588 6 064 125 6 076 645 6 064 125
Non current liabilities
Borrow ing 9 871 867 11 468 241 10 283 447 11 468 241
Prov isions 2 791 834 2 847 996 2 791 834 2 847 996
Total non current liabilities 12 663 701 14 316 237 13 075 281 14 316 237
TOTAL LIABILITIES 19 837 289 20 380 362 19 151 926 20 380 362
NET ASSETS 2 18 775 672 20 728 135 19 225 172 20 728 135
COMMUNITY WEALTH/EQUITY
Accumulated Surplus/(Deficit) 18 522 252 20 463 076 18 971 752 20 463 076
Reserv es 253 420 265 059 253 420 265 059
TOTAL COMMUNITY WEALTH/EQUITY 2 18 775 672 20 728 135 19 225 172 20 728 135
Description Ref
TSH City Of Tshwane - Table C6 Consolidated Monthly Budget Statement - Financial Position -
M04 October

23
(g) Table C7: Consolidated Monthly Budget Statement – Cash Flow
2014/15 Budget Year 2015/16
Unaudited
Outcome
Original
Budget
Monthly
actual
YearTD
actual
YearTD
budget
YTD
variance
YTD
variance
Full Year
Forecast
R thousands 1 %
CASH FLOW FROM OPERATING ACTIVITIES
Receipts
Property rates, penalties & collection charges 4,883,326 4,817,476 408,378 1,695,672 1,605,825 89,847 6% 4,817,476
Serv ice charges 13,293,833 14,588,169 1,315,950 5,285,288 4,862,723 422,566 9% 14,588,169
Other rev enue 1,436,034 1,178,291 55,288 311,026 394,695 (83,669) -21% 1,178,291
Government - operating 3,081,485 3,666,857 36,678 1,515,177 1,244,685 270,492 22% 3,666,857
Government - capital 2,596,235 2,453,160 232,902 566,161 584,234 (18,073) -3% 2,453,160
Interest 412,573 193,141 39,286 147,457 63,779 83,678 131% 193,141
Payments
Suppliers and employ ees (21,719,690) (21,907,225) (1,858,490) (9,709,846) (7,320,328) 2,389,518 -33% (21,907,225)
Finance charges (997,465) (1,029,556) (72,122) (321,769) (343,191) (21,423) 6% (1,029,556)
Transfers and Grants (25,600) (259,298) (23,851) (40,241) (86,433) (46,191) 53% (259,298)
NET CASH FROM/(USED) OPERATING ACTIVITIES 2,960,731 3,701,015 134,020 (551,075) 1,005,988 1,557,063 155% 3,701,015
CASH FLOWS FROM INVESTING ACTIVITIES
Receipts
Proceeds on disposal of PPE 197,706 – 6,342 25,257 – 25,257 #DIV/0! –
Decrease (Increase) in non-current debtors 70,512 – (195,697) 424,925 – 424,925 #DIV/0! –
Decrease (increase) other non-current receiv ables (269,436) 48,553 290,283 363,526 16,184 347,342 2146% 48,553
Decrease (increase) in non-current inv estments (156,583) 56,007 (3,402) (17,924) 18,669 (36,593) -196% 56,007
Payments
Capital assets (4,114,918) (3,783,366) (281,690) (667,877) (901,830) (233,954) 26% (3,783,366)
NET CASH FROM/(USED) INVESTING ACTIVITIES (4,272,719) (3,678,806) (184,163) 127,908 (866,977) (994,884) 115% (3,678,806)
CASH FLOWS FROM FINANCING ACTIVITIES
Receipts
Short term loans – – 1,250,000 1,515,000 – 1,515,000 #DIV/0! –
Borrow ing long term/refinancing 1,500,000 1,200,000 (330,000) – – – 1,200,000
Increase (decrease) in consumer deposits 55,733 8,565 2,778 7,352 2,856 4,497 157% 8,565
Payments
Repayment of borrow ing (491,042) (560,350) (793,611) (1,072,634) (186,783) 885,851 -474% (560,350)
NET CASH FROM/(USED) FINANCING ACTIVITIES 1,064,691 648,215 129,167 449,718 (183,928) (633,645) 345% 648,215
NET INCREASE/ (DECREASE) IN CASH HELD (247,298) 670,424 79,024 26,550 (44,917) 670,424
Cash/cash equiv alents at beginning: 847,816 1,203,476 600,518 1,203,476 600,518
Cash/cash equiv alents at month/y ear end: 600,518 1,873,900 627,069 1,158,559 1,270,943
Description Ref
TSH City Of Tshwane - Table C7 Consolidated Monthly Budget Statement - Cash Flow - M04 October

24
PART 2 – SUPPORTING DOCUMENTATION
(a) Table SC1: Material variance explanations
Variance Reasons for material deviations Remedial or corrective steps/remarks
R thousands
1 Revenue By Source
Property rates (49,838) A 3% v ariance is reflected due to changes by
Supplementary that result from re-v aluation, as well as the
billing cy cle not being completed due to a technical
problem.
Continuous reconciliation processes to identify possible
mismatches and correction thereof. Affected billings has
been captured and w ill reflect in Nov ember 2015.
Serv ice charges - electricity rev enue 18,411 A 1% fav ourable v ariance is reflected. Continuous monitoring.
Serv ice charges - w ater rev enue (59,601) "Water Fees" is the main contributor. Billing cy cle could not
be completed due to IT problem.
Continuous monitoring.
Serv ice charges - sanitation rev enue (7,034) Demand lower than projected. Continuous monitoring.
Serv ice charges - refuse revenue 754 0% v ariance Continuous monitoring.
Serv ice charges - other 17,648 Demand ex ceeded projection on "Reconnection Fees". Continuous monitoring.
Rental of facilities and equipment (5,733) "Rental: Businesses" is the main contributor due to a delay
in capturing rev enue.
In the process of being captured.
Interest earned - ex ternal inv estments (10,053) "Interest Receiv ed On Long Term Inv estment" is the main
contributor due to a decline in investments.
Actual capitalisation of Interest Earned is done semi-
annually , in 31 December and 30 June.
Interest earned - outstanding debtors 61,677 "Interest On Amounts In Arrear" is the main contributor. An
increase in debtors has resulted in higher interest earned.
Rev iew during Adjustments budget process.
Fines (62,874) "AARTO" is the main contributor. Information regarding
AARTO transactions, as receiv ed from the Road Traffic
Infringement Agency , is not configured in-line w ith GRAP 9
and National Treasury guidelines for capturing w ithin the
CoT statements.
Administrativ e processes as well as reporting formats are
being re-examined in order to correctly capture information.
Licences and permits (6,294) "Driv ers Licences" is the main contributor. Delay in
processing receipts.
Ensure outstanding receipts are captured.
Transfers recognised - operational 152,884 Due to non-alignment of projections for "Equitable Shares
and Fuel Lev y ". First tranches receiv ed as per NT
payment schedule.
None.
Other rev enue (10,826) "Capital Income Receiv ed From Insurer Organisation" is the
main contributor and it is not a pro-rata revenue line-item.
None.
Gains on disposal of PPE 600 Due to "Profit on Asset Sale". None.
2 Expenditure By Type
Employ ee related costs (48,621) A 2% v ariance mainly due to the ex istence of v acancies. Implement remedial action for "Ov ertime-Salaries" and line-
items reflecting an unfavourable v ariance.
Remuneration of councillors (1,008) Payment in terms of the Public Office Bearers Act. None.
Debt impairment (250,061) "Bad Debt Written Off" is the main contributor. Currently
there is no amounts being w ritten-off that is not prov ided for.
Council approv al is required for any Bad Debts to be
w ritten-off that is not prov ided for.
Depreciation & asset impairment (35,786) "Leased Assets: Depreciation" is the main contributor due to
actual less than projected.
Depreciation is calculated in-line w ith the asset v erification
and purification process.
Finance charges (21,423) "Interest: Rehabilitation Prov isions" is the main contributor. None.
Bulk purchases 550,256 "Bulk: Electricity " is the main contributor due to projections
div ided by 12 instead of based on trends.
Continuous monitoring to ensure line-items do not ex ceed
budget allocation.
Other materials (67,972) "Petrol And Diesel Fuel" is the main contributor due to a
delay in processing of inv oices.
Request made to Finance Department: Supply Chain
Management who manage this line-item.
Contracted serv ices 294,261 "Prepaid Commission" is the main contributor. Department to implement correctiv e measures in terms of
Budget Policy .
Transfers and grants (45,858) "Municipal Entities" is the main contributor due to a
decrease in the claim amount submitted.
Not a pro-rata expenditure group.
Other ex penditure (268,294) "Vehicles" is the main contributor. Corporate Fleet indicated
that v ehicle maintenance projects are still in their planning
stages.
Accelerate the planning phase.
Loss on disposal of PPE 622
3 Capital Expenditure
Vote 1 - City Planning & Development (3,000) "Redev elopment of Caledonian " project due to delay in
processes.
Awaiting BEC and BAC finalisation.
Vote 2 - Corporate & Shared Serv ices (7,802) "Tshwane Leadership and Management Academy " project
is the main contributor due to delay in adv ertisement and
appointment of serv ice prov iders.
Communicate w ith SCM to speed up their processes.
Vote 3 - Economic Dev elopment (9,500) "Business Process Outsourcing Park in Hammanskraal"
project due to delay s in tender processes.
A site briefing meeting was held on 21 October 2015, as
requested during the compulsory briefing session.
Vote 4 - Emergency Serv ices 1,455 "Disaster Risk Management Tools and Equipment" is the
main contributor due to the urgent need for "fire suits".
Ensure allocated budget is not ex ceeded.
Vote 5 - Env ironmental Management (17,038) "Development of Parks and Traffic Islands (Backlog &
New )" project is the main contributor. Delay s w ith creation
of WBS's.
Project Sy stems to accelerate the creation of WBS
numbers.
Ref Description
TSH City Of Tshwane - Supporting Table SC1 Material variance explanations - M04 October

25
(a) Table SC1: Material variance explanations (cont.)
Variance Reasons for material deviations Remedial or corrective steps/remarks
R thousands
3 Capital Expenditure
Vote 6 - Group Financial Serv ices (3 243) "Automation of Supply Chain" is the main contributor. Delay
in implementation due to changes in plan.
Fast-track implementation.
Vote 7 - Housing & Human Settlement (96 722) "Roads and Stormwater - Low Cost Housing - Project
Linked Housing " project is the main contributor.
Vote 8 - Group Information &
Communication Technology
(26 273) "Credit Control Solution" project is the main contributor due
to delay in the receipt of inv oices.
Obtain relev ant inv oices for processing.
Vote 9 - Metro Police Serv ices (1 000) Implementation of re-prioritized Procurement Plan. Discussions to be held w ith TMPD Executiv e Management
on way forward.
Vote 10 - Office of the City Manager (41 563) "Implementation of Tsosoloso Programme" project is the
main contributor due to a delay in implementation.
Contractor on site. Busy w ith site establishment.
Vote 11 - Serv ice Deliv ery & – None. None.
Vote 12 - Water & Sanitation Department (80 026) "Reserv oir Ex tensions" project is the main contributor due
to specification requirements.
SCM w ill finalise the appointment by 13 November 2015
for the outstanding work.
Vote 13 - Energy & Electricity Department 31 576 "New Bulk Electricity Infrastructure " project is the main
contributor due to progress ex ceeding ex pectation.
Closely monitor spending patterns.
Vote 14 - Transport (89 066) "CBD and Surrounding Areas (2010SWC) HOV / BRT
Lanes on Corridors to North and Hatfield" project is the main
contributor due to delay s in appointment of consultant.
As & When Required Consultant tender has now been
awarded.
Vote 15 - Other Votes (17 370) "Capital Funded from Operating" project is the main
contributor due to delay in Book selection.
Procurement of IT equipment and library books.
4 Financial Position
Current assets (1 667 741) A decrease in current assets against projection w ith the
ex ception of "Other Debtors" and "Inv entory ".
Non current assets (1 063 657) Decrease in non-current assets ex cept "Other non-current
assets" against projections.
Current liabilities 12 520 An increase in current liabilities against projections an
specifically "Borrow ings".
Non current liabilities (1 240 956) A decrease in non current liabilities items against
projections.
5 Cash Flow
Transfer receipts - capital 58 108 Actual higher than projected.
Contributions & Contributed assets 6 365 No budget projection for the month.
Proceeds on disposal of PPE (23) No budget projection for the month.
Short term loans 1 250 000 Actual greater than projected.
Borrow ing long term/refinancing 870 000 Actual greater than projected.
Increase in consumer deposits 2 064 An increase in consumer deposits against projection.
Receipt of non-current debtors (195 697) No budget projection for the month.
Receipt of non-current receiv ables 286 237 Actual higher than projected.
Change in non-current inv estments (8 069) Actual higher than projected.
Capital assets 12 225 Actual better than projected.
Repayment of borrow ing 746 915 Actual higher than projected.
7 Municipal Entities
Revenue
Housing Company Tshwane (2 434) "Transfers recognised - operational" is the main contributor.
Grant claim is low due to delay in the appointment of
consultants for Townlands project.
The appointment of consultants w as finalised on 6
November 2015 and supplier w ill commence w ith
engineering design.
Sandspruit Works Association 26 215 "Transfers recognised - operational" is the main contributor.
Operational Grant billed above the budgeted amount. This
is mainly attributed to the declining collection rates.
Debt collection strategy is being dev eloped and further
credit control process are currently undertaken to improv e
collection rate. Increase in collection rates w ill result in a
decrease in grant transfers.
Tshwane Economic Development Agency (970) "Other rev enue" is the main contributor. Revenue generated
less than projected.
"Other rev enue" w ill be generated in the nex t few months.
Expenditure
Housing Company Tshwane (4 165) "Contracted Serv ices" is the main contributor due to the
delay in the appointment of consultants.
Contractors hav e been appointed and w ill commence w ith
engineering design in November 2015.
Sandspruit Works Association 42 805 "Debt impairment" is the main contributor attributed to the
collection which is below the budgeted amount.
Debt collection strategy is being dev eloped and further
credit control process to be undertaken to improv e
collection rate.
Tshwane Economic Development Agency (2 020) "Employ ee Related Costs" is the main contributor.
Ex penditure less than planned.
Expenditure w ill improv e.
Ref Description
TSH City Of Tshwane - Supporting Table SC1 Material variance explanations - M04 October

26
(b) Table SC2: Monthly Budget Statement – Performance Indicators
2014/15 Budget Year 2015/16
Unaudited
Outcome
Original
Budget
YearTD
actual
Full Year
Forecast
Borrowing Management
Capital Charges to Operating Ex penditure Interest & principal paid/Operating Ex penditure 2.0% 6.2% 16.3% 6.2%
Borrowed funding of 'ow n' capital ex penditure Borrow ings/Capital ex penditure ex cl. transfers and
grants
33.2% 97.2% 52.0% 97.2%
Safety of Capital
Debt to Equity Loans, Accounts Pay able, Ov erdraft & Tax
Prov ision/ Funds & Reserv es
88.9% 82.5% 83.2% 82.5%
Gearing Long Term Borrow ing/ Funds & Reserv es 3895.5% 4403.3% 4057.9% 4403.3%
Liquidity
Current Ratio Current assets/current liabilities 1 70.8% 1.0 0.7 1.0
Liquidity Ratio Monetary Assets/Current Liabilities 8.4% 0.3 0.1 0.3
Revenue Management
Annual Debtors Collection Rate
(Payment Lev el %)
Last 12 Mths Receipts/ Last 12 Mths Billing 85.2% 105.6% 107.8% 105.6%
Outstanding Debtors to Revenue Total Outstanding Debtors to Annual Rev enue 16.6% 15.2% 37.7% 15.2%
Longstanding Debtors Recov ered Debtors > 12 Mths Recov ered/Total Debtors >
12 Months Old
0.0% 0.0% 0.0% 0.0%
Creditors Management
Creditors Sy stem Efficiency % of Creditors Paid Within Terms (w ithin MFMA s
65(e))
100.0% 100.0% 100.0% 100.0%
Funding of Provisions
Percentage Of Prov isions Not Funded Unfunded Prov isions/Total Prov isions
Other Indicators
Electricity Distribution Losses % Volume (units purchased and generated less
units sold)/units purchased and generated
2 17.3% 10.0% 10.0%
Water Distribution Losses % Volume (units purchased and own source less
units sold)/Total units purchased and own source
2 23.5% 23.1% 23.1%
Employ ee costs Employ ee costs/Total Rev enue - capital rev enue 27.3% 26.8% 24.8% 26.8%
Repairs & Maintenance R&M/Total Rev enue - capital revenue 0.0% 5.8% 4.4% 5.8%
Interest & Depreciation I&D/Total Rev enue - capital rev enue 9.4% 8.4% 3.6% 8.4%
IDP regulation financial viability indicators
i. Debt coverage (Total Operating Rev enue - Operating Grants)/Debt
serv ice payments due w ithin financial y ear)
14.4 14.2 4.7 14.2
ii. O/S Serv ice Debtors to Rev enue Total outstanding serv ice debtors/annual rev enue
receiv ed for serv ices
10.7% 14.6% 174.0% 14.6%
iii. Cost cov erage (Av ailable cash + Inv estments)/monthly fix ed
operational ex penditure
0.03 0.1 0.07 0.1
Description of financial indicator Basis of calculation Ref
TSH City Of Tshwane - Supporting Table SC2 Monthly Budget Statement - performance indicators - M04 October
The performance indicator table above reflects the financial impact of the performance of the CoT as at 31 October 2015. Percentages for Distribution Losses were unavailable at the time of preparing this report.

27
(c) Table SC3: Monthly Budget Statement – Aged Debtors
Description
R thousands
NT
Code0-30 Days
31-60
Days
61-90
Days
91-120
Days
121-150
Dys
151-180
Dys
181 Dys-1
YrOver 1Yr Total
Total
over 90
days
Actual Bad
Debts Written
Off against
Debtors
Impairment -
Bad Debts
i.t.o Council
Policy
Debtors Age Analysis By Income Source
Trade and Other Receiv ables from Ex change Transactions - Water 1200 357 987 38 385 83 434 48 924 34 974 56 677 221 618 611 555 1 453 555 973 749 1 756 –
Trade and Other Receiv ables from Ex change Transactions - Electricity 1300 281 271 13 980 14 705 15 014 12 009 15 081 105 193 558 089 1 015 342 705 386 574 –
Receiv ables from Non-ex change Transactions - Property Rates 1400 465 734 76 578 65 245 61 553 57 231 53 995 274 189 1 065 503 2 120 028 1 512 470 457 –
Receiv ables from Ex change Transactions - Waste Water Management 1500 67 666 8 787 10 085 6 840 6 068 4 372 36 885 117 124 257 828 171 290 471 –
Receiv ables from Ex change Transactions - Waste Management 1600 95 975 12 469 11 916 10 669 9 595 8 246 57 985 207 589 414 444 294 083 714 –
Receiv ables from Ex change Transactions - Property Rental Debtors 1700 65 29 55 28 28 1 187 2 475 2 869 2 720 – –
Interest on Arrear Debtor Accounts 1810 83 794 30 022 31 772 30 740 31 369 24 608 164 499 692 214 1 089 020 943 431 916 –
Other 1900 91 612 (13 392) 13 113 7 238 22 240 171 213 89 310 566 939 948 272 856 939 1 323 –
Total By Income Source 2000 1 444 105 166 859 230 326 181 007 173 514 334 194 949 865 3 821 488 7 301 358 5 460 068 6 210 –
2014/15 - totals only 1 522 063 174 828 221 933 148 351 131 796 293 466 836 470 3 169 873 6 498 781 4 579 956 7 711 0
Debtors Age Analysis By Customer Group
Organs of State 2200 – – – – – – – – – – – –
Commercial 2300 378 555 66 190 45 397 45 393 40 792 119 761 213 855 938 591 1 848 534 1 358 392 – –
Households 2400 798 780 88 512 120 152 120 615 103 171 84 724 628 330 2 223 480 4 167 763 3 160 320 5 309 –
Other 2500 266 771 12 157 64 777 14 999 29 551 129 709 107 680 659 417 1 285 061 941 356 901 –
Total By Customer Group 2600 1 444 105 166 859 230 326 181 007 173 514 334 194 949 865 3 821 488 7 301 358 5 460 068 6 210 –
TSH City Of Tshwane - Supporting Table SC3 Monthly Budget Statement - aged debtors - M04 October
Budget Year 2015/16
The above table provides an extended aged analysis, as well as an aged analysis by debtor type. It also compares this month’s results with the same period of the previous financial year. The summary report indicates that total debtors amount to R7 301m. The charts below illustrates that there is a collection challenge pertaining to the debtors in the over 1 year category and R3 821m is outstanding in this category, with R2 223m attributable to households. Figures for “Organs of State” were not available at the time of preparing this report.
Chart C3: Aged Consumer Debtors
–
500 000
1 000 000
1 500 000
2 000 000
2 500 000
3 000 000
3 500 000
4 000 000
0-30Days
31-60Days
61-90Days
91-120Days
121-150Dys
151-180Dys
181 Dys-1 Yr
Over 1Yr
Budget Year 2015/16 1 444 105 166 859 230 326 181 007 173 514 334 194 949 865 3 821 488
2014/15 1 522 063 174 828 221 933 148 351 131 796 293 466 836 470 3 169 873
R'000
Chart C3 Aged Consumer Debtors Analysis

28
Chart C4: Consumer Debtors
–
500 000
1 000 000
1 500 000
2 000 000
2 500 000
3 000 000
3 500 000
4 000 000
4 500 000
Organs of State Commercial Households Other
2014/15 – 1 793 078 4 042 730 1 246 509
Budget Year 2015/16 – 1 848 534 4 167 763 1 285 061
R'000
Chart C4 Consumer Debtors (total by Debtor Customer Category)

29
(d) Table SC4: Monthly Budget Statement – Aged Creditors
Budget Year 2015/16
R thousands
Creditors Age Analysis By Customer Type
Bulk Electricity 0100 567 318 567 318 483 657
Bulk Water 0200 180 008 180 008 164 598
PAYE deductions 0300 103 451 103 451 69 117
VAT (output less input) 0400 (111 094) (111 094) (145 372)
Pensions / Retirement deductions 0500 110 797 110 797 87 724
Loan repayments 0600 733 733 17
Trade Creditors 0700 617 738 617 738 314 141
Auditor General 0800 2 869 2 869 2 969
Other 0900 2 376 276 2 376 276 2 134 882
Total By Customer Type 1000 3 848 096 – – – – – – – 3 848 096 3 111 733
NT
Code0 -
30 Days
31 -
60 Days
Prior y ear
totals for chart
(same period)
TSH City Of Tshwane - Supporting Table SC4 Monthly Budget Statement - aged creditors - M04 October
181 Days -
1 Year
Over 1
Year
Total61 -
90 Days
91 -
120 Days
121 -
150 Days
151 -
180 Days
Description
The above table provides an extended aged analysis, as well as an aged analysis by creditor type. The summary report indicates that there are no long term outstanding creditors for the categories over 30 days. The majority of the CoT’s creditors are “Other” creditors and there does not appear to be any issues. The chart compares this month’s results with the previous financial year which indicates that all the Aged Creditors per category reflect an increase at the end of October 2015.
Chart C5: Aged Creditors
(500 000)
–
500 000
1 000 000
1 500 000
2 000 000
2 500 000
BulkElectricity
Bulk Water PAYEdeductions
VAT(outputless input)
Pensions /Retirementdeductions
Loanrepayment
s
TradeCreditors
AuditorGeneral
Other
2014/15 483 657 164 598 69 117 (145 372) 87 724 17 314 141 2 969 2 134 882
Budget Year 2015/16 567 318 180 008 103 451 (111 094) 110 797 733 617 738 2 869 2 376 276
R'000
Chart C5 Aged Creditors Analysis

30
(e) Table SC5: Monthly Budget Statement – Investment Portfolio
Investments by maturity
Name of institution & investment ID
Period of
Investment
R thousands Yrs/Months
Municipality
Call Inv estment deposits < 90 day s
Kny sna Stocks 24 15y Stock 31.12.2018 0 0,0% 715 – 715
Sanlam 26 14y Insurance policy 07.12.2015 0 3,0% 48 – 49
Sanlam 27 14y Insurance policy 01.01.2016 13 3,0% 4 968 – 4 981
Capital Allianze 28 8y Insurance policy On selling date 1 2,0% 622 – 623
Capital Allianze 29 9y Insurance policy On selling date 5 3,0% 1 969 – 1 974
ABSA 32 On Call Money Market On call 123 5,2% 27 820 – 27 943
ABSA 33 On Call Money Market On call 43 5,2% 9 749 – 9 792
ABSA 34 On Call Money Market On call 32 5,2% 7 302 – 7 335
ABSA 35 On Call Money Market On call 1 5,2% 161 – 162
Inv estec Bank 37 On Call Money Market On call 108 5,2% 24 431 – 24 539
Inv estec Bank 38 On Call Money Market On call 34 5,2% 7 809 – 7 844
Inv estec Bank 39 On Call Money Market On call 5 5,2% 1 046 – 1 051
Standard Bank 40 On Call Money Market On call 390 5,2% 88 361 – 88 751
Standard Bank 41 On Call Money Market On call 12 5,2% 2 743 – 2 755
Inv estec Bank 108 On Call Money Market On call 108 4,5% 28 291 – 28 400
RMB 237 On Call Money Market 31.10.2011 – 0,0% – – –
STANLIB 106 On Call Money Market On call – 0,4% 25 995 456 26 451
ABSA 338 On Call Short Term On call – 0,0% – 25 000 25 000
Nedbank 341 On Call Short Term On call – 0,0% 75 000 346 75 346
Standard Bank 340 On Call Short Term On call – 5,8% – – –
ABSA 243 On Call Short Term On call – 0,0% – – –
Nedbank 244 On Call Short Term On call – 0,0% – – –
ABSA 245 On Call Short Term On call – 0,0% – – –
Standard Bank 246 On Call Short Term On call – 0,0% – – –
Nedbank 247 On Call Short Term On call – 0,0% – – –
ABSA 248 On Call Short Term On call – 0,0% – – –
Standard Bank 260 On Call Short Term On call 276 5,0% 64 945 – 65 221
Municipality sub-total 1 151 371 977 25 801 398 930
TOTAL INVESTMENTS AND INTEREST 2 1 151 371 977 25 801 398 930
TSH City Of Tshwane - Supporting Table SC5 Monthly Budget Statement - investment portfolio - M04 October
Ref
Type of Investment Expiry date of
investment
Market
value at end
of the
month
Accrued
interest for
the month
Yield for the
month 1
(%)
Market
value at
beginning
of the
month
Change in
market
value
The information contained in the investment table above is consistent with the requirements of the Municipal Investment Regulation, 2005 issued by National Treasury.

31
(f) Table SC6: Monthly Budget Statement – Transfers and grant receipts
2014/15 Budget Year 2015/16
Unaudited
Outcome
Original
Budget
Monthly
actual
YearTD
actual
YearTD
budget
YTD
variance
YTD
variance
Full Year
Forecast
R thousands %
RECEIPTS: 1,2
Operating Transfers and Grants
National Government: 3 008 481 3 298 840 12 831 1 364 676 1 360 399 4 277 0,3% 3 298 840
EPWP Incentiv e 30 760 31 143 – 12 457 12 457 – 31 143
Finance Management 4 750 3 925 – 3 925 3 925 – 3 925
Fuel Lev y 1 352 410 1 395 849 – 465 283 465 283 – 1 395 849
Integrated City Development Grant 44 659 39 702 – 19 851 19 851 – 39 702
Local Government Equitable Share 1 375 518 1 654 390 – 689 329 689 329 – 1 654 390
Municipal Disaster Recovery Grant 3 14 878 – – – – – –
Municipal Human Settlement Capacity Grant 47 506 12 831 12 831 12 831 8 554 4 277 50,0% 12 831
Public Transport Network Operations Grant 138 000 161 000 – 161 000 161 000 – 161 000
Provincial Government: 110 355 120 866 23 847 77 081 89 260 (12 179) -13,6% 120 866
Emergency Medical Serv ices 56 683 59 687 17 906 41 781 41 781 0 0,0% 59 687
HIV and Aids Grant 10 923 11 501 5 047 11 948 11 501 447 3,9% 11 501
Primary Health Care 4 39 967 42 085 – 16 834 29 460 (12 626) -42,9% 42 085
Research & Technology Dev elopment Serv ices 893 893 893 893 893 – 893
Sport and Recreation: Community Libraries 1 889 6 700 – 5 625 5 625 – 6 700
Other grant providers: 256 551 250 535 44 491 117 911 104 783 13 128 12,5% 250 535
Housing Company Tshwane 15 849 23 445 1 342 4 972 20 061 (15 089) -75,2% 23 445
LG SETA Discretionary Grant 689 – – – – – –
Sandspruit 182 360 172 940 27 716 83 969 57 647 26 322 45,7% 172 940
TEDA 57 652 54 150 15 433 28 970 27 075 1 895 7,0% 54 150
Total Operating Transfers and Grants 5 3 375 387 3 670 241 81 168 1 559 667 1 554 441 5 226 0,3% 3 670 241
Capital Transfers and Grants
National Government: 2 547 271 2 408 542 232 902 548 232 548 232 – 2 408 542
Energy Efficiency & Demand Side Management 3 000 – – – – – –
Finance Management Grant 250 250 – 250 250 – 250
Integrated National Electrification Programme 32 000 37 000 – 11 249 11 249 – 37 000
Neighbourhood Development Partnership Grant 175 000 100 000 – 6 827 6 827 – 100 000
Public Transport and Sy stems Grant 867 571 770 609 232 902 304 804 304 804 – 770 609
Urban Settlement Dev elopment Grant 1 469 450 1 500 683 – 225 102 225 102 – 1 500 683
Provincial Government: 27 300 40 551 – 17 551 32 551 (15 000) -46,1% 40 551
Gautrans 12 000 – – – – – –
Social Infrastructure Grant 11 200 33 000 – 10 000 25 000 (15 000) -60,0% 33 000
Sport & Recreation: Community Libaries 4 100 7 551 – 7 551 7 551 – 7 551
Other grant providers: 4 698 1 773 – 378 505 (126) -25,0% 1 773
Housing Delft Grant – – – – – – –
LG SETA Discretionary Grant 4 698 – – – –
Smart Connect Grant – 1 773 – 378 505 (126) -25,0% 1 773
Total Capital Transfers and Grants 5 2 579 269 2 450 866 232 902 566 161 581 288 (15 126) -2,6% 2 450 866
TOTAL RECEIPTS OF TRANSFERS & GRANTS 5 5 954 657 6 121 107 314 070 2 125 829 2 135 729 (9 900) -0,5% 6 121 107
Description Ref
TSH City Of Tshwane - Supporting Table SC6 Monthly Budget Statement - transfers and grant receipts - M04 October
The disclosure on the transfer and grant receipts table above reflect the receipts from National, Provincial and Other grant providers. As at 31 October 2015 the total receipts amount to R2126m. The outstanding transfers to-date are:
• Primary Health Care – Delay in the submission of a memorandum to the Health Department. Transfer expected in November 2015.
• Social Infrastructure Grant – Delay in the appointment of contractors which affected the transfer to the Department.
• Smart Connect Grant – Delay in the submission performance documentation on first tranche. Transfer anticipated in November 2015.

32
(g) Table SC7(1): Monthly Budget Statement – Transfers and grant expenditures
2014/15 Budget Year 2015/16
Unaudited
Outcome
Original
Budget
Monthly
actual
YearTD
actual
YearTD
budget
YTD
variance
YTD
variance
Full Year
Forecast
R thousands %
EXPENDITURE
Operating expenditure of Transfers and Grants
National Government: 2 971 853 3 298 840 20 155 1 203 921 1 099 613 104 308 9,5% 3 298 840
EPWP Incentiv e 30 760 31 143 – 12 457 10 381 2 076 20,0% 31 143
Finance Management 4 540 3 925 340 602 1 308 (706) -54,0% 3 925
Fuel Lev y 1 352 410 1 395 849 – 465 283 465 283 0 0,0% 1 395 849
Integrated City Dev elopment Grant 38 352 39 702 805 1 156 13 234 (12 078) -91,3% 39 702
Local Gov ernment Equitable Share 1 375 518 1 654 390 – 689 329 551 463 137 866 25,0% 1 654 390
Municipal Disaster Recov ery Grant 992 – – – – – –
Municipal Human Settlement Capacity Grant 31 087 12 831 – 6 4 277 (4 271) -99,9% 12 831
Public Transport Netw ork Operations Grant 138 000 161 000 19 010 35 088 53 667 (18 578) -34,6% 161 000
Urban Settlement Dev elopment Grant 195 – – – – – –
Provincial Government: 109 632 120 866 19 483 65 240 40 289 24 951 61,9% 120 866
Emergency Medical Serv ices 56 683 59 687 17 906 41 781 19 896 21 885 110,0% 59 687
HIV and Aids Grant 10 923 11 501 1 427 5 367 3 834 1 534 40,0% 11 501
Primary Health Care 39 967 42 085 – 16 834 14 028 2 806 20,0% 42 085
Research & Technology Dev elopment Serv ices – 893 – 137 298 (161) -54,1% 893
Sport and Recreation: Community Libraries 1 837 6 700 150 1 121 2 233 (1 112) -49,8% 6 700
Other grant providers: 267 686 255 799 44 491 117 911 108 616 9 294 8,6% 255 799
Housing Company Tshwane 15 849 35 359 1 342 4 972 20 061 (15 089) -75,2% 35 359
LG SETA Discretionary Grant 609 – – – 3 834 (3 834) -100,0% –
Sandspruit 193 576 172 940 27 716 83 969 57 647 26 322 45,7% 172 940
TEDA 57 652 47 500 15 433 28 970 27 075 1 895 7,0% 47 500
Total operating expenditure of Transfers and Grants: 3 349 171 3 675 505 84 129 1 387 071 1 248 518 138 553 11,1% 3 675 505
Capital expenditure of Transfers and Grants
National Government: 2 551 806 2 408 542 189 301 387 010 617 103 (230 093) -37,3% 2 408 542
Finance Management Grant – 250 – – – – 250
Integrated National Electrification Programme 244 37 000 22 22 50 (28) -56,4% 37 000
Neighbourhood Dev elopment Partnership Grant 31 999 100 000 9 794 9 879 7 400 2 479 33,5% 100 000
Public Transport and Sy stems Grant 174 998 770 609 9 684 9 684 33 333 (23 649) -70,9% 770 609
Urban Settlement Dev elopment Grant 867 347 1 500 683 34 737 128 154 185 000 (56 846) -30,7% 1 500 683
Provincial Government: 8 721 40 551 – – 6 117 (6 117) -100,0% 40 551
Gautrans – – – – – – –
Social Infrastructure Grant 5 518 33 000 – – 3 600 (3 600) -100,0% 33 000
Sport & Recreation: Community Libaries 3 203 7 551 – – 2 517 (2 517) -100,0% 7 551
Other grant providers: 4 454 4 067 – 378 1 423 (1 045) -73,4% 4 067
Housing Delft Grant – 2 293 – – 540 (540) -100,0% 2 293
LG SETA Discretionary Grant 4 454 – – – – – –
Smart Connect Grant – 1 773 – 378 883 (505) -57,1% 1 773
Total capital expenditure of Transfers and Grants 2 564 982 2 453 160 189 301 387 388 624 643 (237 255) -38,0% 2 453 160
TOTAL EXPENDITURE OF TRANSFERS AND GRANTS 5 914 153 6 128 665 273 430 1 774 459 1 873 162 (98 702) -5,3% 6 128 665
Description Ref
TSH City Of Tshwane - Supporting Table SC7(1) Monthly Budget Statement - transfers and grant expenditure - M04 October
The disclosure on the transfer and grant expenditure table above reflect the recognition of expenditures as at 31 October 2015 amounts to R1 774m against the YTD budget of R1 873m.

33
(h) Table SC7(2): Monthly Budget Statement – Expenditure against approved rollovers
Approved
Rollover
2014/15
Monthly actual YearTD actual YTD variance YTD variance
R thousands %
EXPENDITURE
Operating expenditure of Approved Roll-overs
National Government: – – – –
EPWP Incentiv e –
Finance Management –
Fuel Levy –
Integrated City Development Grant –
Local Gov ernment Equitable Share –
Municipal Disaster Recovery Grant –
Other transfers and grants [insert description] –
Provincial Government: – – – –
Emergency Medical Serv ices –
HIV and Aids Grant –
Primary Health Care –
Sport and Recreation: Community Libraries –
Other transfers and grants [insert description] –
Total operating expenditure of Approved Roll-overs – – – –
Capital expenditure of Approved Roll-overs
National Government: – – – –
Energy Efficiency & Demand Side Management –
Finance Management Grant –
Integrated National Electrification Programme –
Neighbourhood Dev elopment Partnership Grant –
Public Transport and Sy stems Grant –
Urban Settlement Dev elopment Grant –
Provincial Government: – – – –
Gautrans –
–
Total capital expenditure of Approved Roll-overs – – – –
TOTAL EXPENDITURE OF APPROVED ROLL-OVERS – – – –
TSH City Of Tshwane - Supporting Table SC7(2) Monthly Budget Statement - Expenditure against approved rollovers - M04 October
Description Ref
Budget Year 2015/16
Note: No rollovers were approved during the approval of the MTREF for the 2015/16 financial year.

34
(i) Table SC8: Monthly Budget Statement – Councillor and Staff Benefits
2014/15 Budget Year 2015/16
Unaudited
Outcome
Original
Budget
Monthly
actual
YearTD
actual
YearTD
budget
YTD
variance
YTD
variance
Full Year
Forecast
R thousands %
1 A B D
Councillors (Political Office Bearers plus Other)
Basic Salaries and Wages 101 736 109 249 8 708 34 769 36 416 (1 647) -5% 109 249
Motor Vehicle Allowance 8 – – – – – –
Other benefits and allowances 2 449 – 588 1 128 833 295 35% –
Sub Total - Councillors 104 193 109 249 9 296 35 897 37 250 (1 352) -4% 109 249
% increase 4 4,9% 4,9%
Senior Managers of the Municipality 3
Basic Salaries and Wages 50 567 50 618 4 225 17 431 16 873 558 3% 50 618
Cellphone Allowance 597 784 51 209 261 (52) -20% 784
Sub Total - Senior Managers of Municipality 51 164 51 402 4 276 17 640 17 134 506 3% 51 402
% increase 4 0,5% 0,5%
Other Municipal Staff
Basic Salaries and Wages 4 138 846 4 555 383 399 066 1 343 092 1 402 148 (59 056) -4% 4 555 383
Pension and UIF Contributions 927 474 1 086 474 98 136 330 457 361 641 (31 184) -9% 1 086 474
Medical Aid Contributions 373 612 386 466 33 134 128 977 128 957 20 0% 386 466
Overtime 305 415 187 582 32 893 120 938 67 273 53 665 80% 187 582
Performance Bonus 356 169 12 98 140 (41) -30% 169
Motor Vehicle Allowance 298 928 308 762 25 972 101 249 103 305 (2 055) -2% 308 762
Cellphone Allowance 20 704 20 480 1 474 5 715 7 061 (1 346) -19% 20 480
Housing Allowances 25 046 23 914 5 038 11 485 8 034 3 451 43% 23 914
Other benefits and allowances 280 389 317 889 27 987 97 720 107 244 (9 524) -9% 317 889
Post-retirement benefit obligations 2 – 229 686 – – 75 212 (75 212) -100% 229 686
Sub Total - Other Municipal Staff 6 370 770 7 116 804 623 711 2 139 732 2 261 014 (121 282) -5% 7 116 804
% increase 4 11,7% 11,7%
Total Parent Municipality 6 526 126 7 277 455 637 283 2 193 269 2 315 398 (122 128) -5% 7 277 455
11,5% 11,5%Unpaid salary, allowances & benefits in arrears:
Board Members of Entities
Board Fees 3 647 4 549 667 1 744 1 399 345 25% 4 549
Sub Total - Board Members of Entities 2 3 647 4 549 667 1 744 1 399 345 25% 4 549
% increase 4 24,7% 24,7%
Senior Managers of Entities
Basic Salaries and Wages 21 115 28 889 2 222 7 940 9 429 (1 490) -16% 28 889
Pension and UIF Contributions 1 294 874 112 391 277 115 41% 874
Medical Aid Contributions 861 300 77 320 95 224 236% 300
Performance Bonus 17 437 – 115 138 (23) -17% 437
Motor Vehicle Allowance 2 468 1 236 220 879 391 488 125% 1 236
Cellphone Allowance 416 447 32 127 146 (19) -13% 447
Housing Allowances 207 208 22 95 66 29 44% 208
Other benefits and allowances 268 410 15 64 135 (72) -53% 410
Sub Total - Senior Managers of Entities 26 646 32 801 2 701 9 930 10 678 (748) -7% 32 801
% increase 4 23,1% 23,1%
Other Staff of Entities
Basic Salaries and Wages 58 962 68 454 5 251 20 084 21 809 (1 725) -8% 68 454
Pension and UIF Contributions 10 042 11 860 862 3 431 3 754 (323) -9% 11 860
Medical Aid Contributions 8 378 9 192 737 2 931 2 909 21 1% 9 192
Overtime 2 544 2 414 185 733 764 (31) -4% 2 414
Performance Bonus 364 4 486 – – 1 420 (1 420) -100% 4 486
Motor Vehicle Allowance 4 698 6 436 474 1 898 2 037 (139) -7% 6 436
Cellphone Allowance 441 696 37 148 224 (76) -34% 696
Housing Allowances 2 328 3 342 240 943 1 058 (115) -11% 3 342
Other benefits and allowances 2 428 1 589 198 600 506 94 19% 1 589
Sub Total - Other Staff of Entities 90 184 108 469 7 984 30 768 34 480 (3 712) -11% 108 469
% increase 4 20,3% 20,3%
Total Municipal Entities 120 477 145 819 11 351 42 442 46 557 (4 116) -9% 145 819
TOTAL SALARY, ALLOWANCES & BENEFITS 6 646 604 7 423 274 648 635 2 235 711 2 361 955 (126 244) -5% 7 423 274
% increase 4 11,7% 11,7%
TOTAL MANAGERS AND STAFF 6 538 764 7 309 476 638 671 2 198 070 2 323 306 (125 236) -5% 7 309 476
Summary of Employee and Councillor remuneration Ref
TSH City Of Tshwane - Supporting Table SC8 Monthly Budget Statement - councillor and staff benefits - M04 October

35
(j) Table SC9: Monthly Budget Statement – Actual and Revised targets for cash receipts
October October October
R thousands 1 Budget Outcome Variance
Cash Receipts By Source
Property rates 401,456 408,378 6,921 4,817,476 5,301,984 5,834,941
Property rates - penalties & collection charges – – – – – –
Serv ice charges - electricity rev enue 802,834 835,689 32,855 9,634,009 10,403,258 11,234,046
Serv ice charges - w ater rev enue 256,212 313,553 57,341 3,074,544 3,356,674 3,681,784
Serv ice charges - sanitation rev enue 60,927 68,928 8,001 731,125 799,064 877,781
Serv ice charges - refuse 84,010 97,779 13,770 1,008,117 1,108,928 1,219,820
Serv ice charges - other 11,698 – (11,698) 140,374 146,691 152,999
Rental of facilities and equipment 8,621 4,368 (4,253) 103,469 108,126 112,808
Interest earned - ex ternal inv estments 5,877 3,362 (2,515) 70,549 107,100 112,328
Interest earned - outstanding debtors 10,089 35,925 25,836 122,592 129,758 138,462
Div idends receiv ed – – – – – –
Fines 16,391 844 (15,546) 196,691 196,812 196,932
Licences and permits 4,807 4,153 (654) 57,680 60,185 62,687
Agency serv ices – – – – – –
Transfer receipts - operating 312,925 36,678 (276,247) 3,666,857 3,971,581 4,312,525
Other rev enue 68,128 45,923 (22,205) 820,451 826,440 846,490
Cash Receipts by Source 2,043,973 1,855,580 (188,393) 24,443,934 26,516,602 28,783,604
Other Cash Flows by Source –
Transfer receipts - capital 174,794 232,902 58,108 2,453,160 2,506,939 2,632,126
Contributions & Contributed assets – 6,365 6,365 – – –
Proceeds on disposal of PPE – (23) (23) – – –
Short term loans – 1,250,000 1,250,000 – – –
Borrow ing long term/refinancing – (330,000) (330,000) 1,200,000 1,200,000 1,500,000
Increase in consumer deposits 714 2,778 2,064 8,565 8,732 8,902
Receipt of non-current debtors – (195,697) (195,697) – – –
Receipt of non-current receiv ables 4,046 290,283 286,237 48,553 – –
Change in non-current inv estments 4,667 (3,402) (8,069) 56,007 (36,145) (4,783)
Total Cash Receipts by Source 2,228,194 3,108,787 880,592 28,210,219 30,196,128 32,919,850
Cash Payments by Type
Employ ee related costs 587,524 637,147 49,623 7,050,265 7,439,808 7,857,912
Remuneration of councillors 9,680 9,964 283 116,156 127,083 139,435
Interest paid 85,798 72,122 (13,676) 1,029,556 1,110,511 1,194,244
Bulk purchases - Electricity 567,081 878,219 311,138 6,804,972 7,349,370 7,937,320
Bulk purchases - Water & Sewer 164,755 186,181 21,426 1,977,064 2,153,721 2,355,004
Other materials 30,651 9,942 (20,709) 367,807 379,712 385,130
Contracted serv ices 154,784 97,101 (57,683) 1,857,366 1,909,948 1,930,860
Grants and subsidies paid - other 21,608 23,851 2,243 259,298 267,387 268,475
General ex penses 311,135 39,937 (271,198) 3,733,596 3,830,243 4,372,158
Cash Payments by Type 1,933,016 1,954,462 21,446 23,196,079 24,567,782 26,440,537
Other Cash Flows/Payments by Type
Capital assets 269,464 281,690 12,225 3,783,366 3,922,744 4,091,520
Repayment of borrow ing 46,696 793,611 746,915 560,350 674,945 817,929
Total Cash Payments by Type 2,249,176 3,029,763 780,587 27,539,795 29,165,472 31,349,985
NET INCREASE/(DECREASE) IN CASH HELD (20,981) 79,024 670,424 1,030,656 1,569,865
Cash/cash equiv alents at the month/y ear beginning: 1,179,541 548,045 1,203,476 1,873,900 2,904,557
Cash/cash equiv alents at the month/y ear end: 1,158,559 627,069 1,873,900 2,904,557 4,474,421
TSH City Of Tshwane - Supporting Table SC9 Monthly Budget Statement - actuals and revised targets for cash receipts -
M04 October
Budget Year
+1 2016/17
Budget Year
+2 2017/18
Description
Budget Year
2015/16
Ref
Budget
Year
2015/16 Medium Term Revenue &
Expenditure Framework

36
(k) Table SC10: Monthly Budget Statement – Parent Municipality Financial Performance (Revenue and Expenditure)
2014/15 Budget Year 2015/16
Unaudited
Outcome
Original
Budget
Monthly
actual
YearTD
actual
YearTD
budget
YTD
variance
YTD
variance
Full Year
Forecast
R thousands 1 %
Revenue By Source
Property rates 4 906 267 5 236 387 408 378 1 695 672 1 745 510 (49 838) -3% 5 236 387
Serv ice charges - electricity rev enue 9 088 425 10 471 749 828 920 3 513 272 3 494 861 18 411 1% 10 471 749
Serv ice charges - w ater rev enue 2 790 398 3 169 195 288 616 998 924 1 058 098 (59 174) -6% 3 169 195
Serv ice charges - sanitation rev enue 703 173 748 908 67 388 242 786 249 636 (6 850) -3% 748 908
Serv ice charges - refuse revenue 968 073 1 095 779 93 426 366 024 365 270 754 0% 1 095 779
Serv ice charges - other 176 705 152 581 14 897 68 508 50 860 17 648 35% 152 581
Rental of facilities and equipment 114 055 109 112 4 038 30 583 36 371 (5 788) -16% 109 112
Interest earned - ex ternal inv estments 36 874 69 774 3 257 13 201 23 258 (10 057) -43% 69 774
Interest earned - outstanding debtors 338 769 182 050 32 362 120 138 60 683 59 455 98% 182 050
Fines 294 458 196 691 844 2 690 65 564 (62 874) -96% 196 691
Licences and permits 53 244 57 680 4 153 12 933 19 227 (6 294) -33% 57 680
Transfers recognised - operational 3 082 064 3 419 706 39 638 1 269 160 1 139 902 129 259 11% 3 419 706
Other rev enue 1 252 409 815 250 45 893 263 416 271 757 (8 342) -3% 815 250
Gains on disposal of PPE 20 440 – 600 600 – 600 #DIV/0! –
Total Revenue (excluding capital transfers and contributions)23 825 353 25 724 863 1 832 407 8 597 906 8 580 997 16 909 0% 25 724 863
Expenditure By Type
Employ ee related costs 6 548 728 6 917 257 626 462 2 151 448 2 195 614 (44 166) -2% 6 917 257
Remuneration of councillors 104 193 111 749 9 296 35 897 37 250 (1 352) -4% 111 749
Debt impairment 907 731 1 018 116 10 218 56 210 339 372 (283 162) -83% 1 018 116
Depreciation & asset impairment 1 300 709 1 186 841 99 508 359 817 395 614 (35 797) -9% 1 186 841
Finance charges 996 546 1 029 202 72 090 321 641 343 067 (21 426) -6% 1 029 202
Bulk purchases 7 029 496 8 613 398 1 360 152 3 399 885 2 866 902 532 983 19% 8 613 398
Other materials 266 821 349 093 9 624 54 822 117 364 (62 542) -53% 349 093
Contracted serv ices 3 072 780 1 939 756 244 191 936 156 638 501 297 656 47% 1 939 756
Transfers and grants 218 658 259 298 23 851 40 241 86 099 (45 858) -53% 259 298
Other ex penditure 3 659 883 3 715 237 328 079 1 006 409 1 273 869 (267 460) -21% 3 715 237
Loss on disposal of PPE 108 786 – 622 622 0 622 186553% –
Total Expenditure 24 214 330 25 139 948 2 784 093 8 363 149 8 293 652 69 497 1% 25 139 948 –
Surplus/(Deficit) (388 977) 584 915 (951 685) 234 757 287 345 (52 588) -18% 584 915
Transfers recognised - capital 2 502 013 2 453 160 186 723 384 533 716 364 (331 831) -46% 2 453 160
Surplus/(Deficit) after capital transfers &
contributions 2 113 036 3 038 075 (764 962) 619 289 1 003 708 (384 419) -38% 3 038 075
Taxation – – – – –
Surplus/(Deficit) after taxation 2 113 036 3 038 075 (764 962) 619 289 1 003 708 (384 419) -38% 3 038 075
Description Ref
TSH City Of Tshwane - Supporting Table SC10 Monthly Budget Statement - Parent Municipality Financial Performance (revenue and
expenditure) - M04 October

37
(l) Table SC11: Monthly Budget Statement – Summary of Municipal Entities
2014/15
Unaudited
Outcome
Original
Budget
Monthly
actual
YearTD
actual
YearTD
budget
YTD
variance
YTD
variance
Full Year
Forecast
R thousands %
Revenue By Municipal Entity
Housing Company Tshwane 19 745 27 417 1 682 6 332 8 767 (2 434) -28% 27 417
Sandspruit Works Association 525 326 486 305 54 080 193 781 167 566 26 215 16% 486 305
Tshwane Economic Development Agency 62 330 57 247 15 461 29 070 30 040 (970) -3% 57 247
Total Operating Revenue 1 607 402 570 969 71 223 229 184 206 372 22 811 11% 570 969
Expenditure By Municipal Entity
Housing Company Tshwane 16 262 27 417 1 340 4 941 9 106 (4 165) -46% 27 417
Sandspruit Works Association 519 839 486 305 54 911 193 362 150 557 42 805 28% 486 305
Tshwane Economic Development Agency 57 899 57 247 4 100 16 960 18 980 (2 020) -11% 57 247
Total Operating Expenditure 2 594 000 570 969 60 351 215 262 178 643 36 620 20% 570 969
Surplus/ (Deficit) for the yr/period 13 402 (0) 10 872 13 921 27 730 59 431 214% (0)
Capital Expenditure By Municipal Entity
Housing Company Tshwane – – – – – – –
Sandspruit Works Association – – – – – – –
Tshwane Economic Development Agency – – – – – – –
Total Capital Expenditure 3 – – – – – – –
Description Ref
TSH City Of Tshwane - Supporting Table SC11 Monthly Budget Statement - summary of municipal entities - M04 October
Budget Year 2015/16

38
(m) Table SC12: Consolidated Monthly Budget Statement – Capital Expenditure Trend
2014/15
Unaudited
Outcome
Original
Budget
Monthly
actual
YearTD
actual
YearTD
budget
YTD
variance
YTD
variance
% spend of
Original
Budget
R thousands %
Monthly expenditure performance trend
July 11 590 160 072 55 244 55 244 160 072 104 828 65,5% 1,43%
August 389 256 271 874 114 501 169 745 431 946 262 201 60,7% 4%
September 387 683 322 036 216 442 386 187 753 982 367 795 48,8% 10%
October 282 387 273 468 281 690 667 877 1 027 449 359 573 35,0% 17%
November 280 581 289 420 1 316 869 –
December 430 030 316 820 1 633 690 –
January 75 204 229 815 1 863 505 –
February 220 185 275 360 2 138 865 –
March 285 899 326 287 2 465 152 –
April 270 658 421 008 2 886 160 –
May 336 845 387 370 3 273 530 –
June 1 146 193 583 036 3 856 566 –
Total Capital expenditure 4 116 511 3 856 566 667 877
Month
TSH City Of Tshwane - Supporting Table SC12 Consolidated Monthly Budget Statement - capital expenditure trend - M04 October
Budget Year 2015/16

39
(n) Table SC13a: Consolidated Monthly Budget Statement – Capital expenditure on new assets by asset class
2014/15 Budget Year 2015/16
Unaudited
Outcome
Original
Budget
Monthly
actual
YearTD
actual
YearTD
budget
YTD
variance
YTD
variance
Full Year
Forecast
R thousands 1 %
Capital expenditure on new assets by Asset Class/Sub-class
Infrastructure 1 707 459 1 770 442 113 967 285 340 386 605 101 265 26,2% 1 770 442
Infrastructure - Road transport 1 444 088 1 389 635 61 424 188 632 269 150 80 518 29,9% 1 389 635
Roads, Pavements & Bridges 1 287 003 882 293 35 444 137 688 189 250 51 562 27,2% 882 293
Storm water 157 085 507 342 25 980 50 944 79 900 28 956 36,2% 507 342
Infrastructure - Electricity 61 598 109 000 24 911 46 224 13 700 (32 524) -237,4% 109 000
Generation 54 438 108 000 24 911 46 224 13 500 (32 724) -242,4% 108 000
Transmission & Reticulation 7 160 1 000 – – 200 200 100,0% 1 000
Infrastructure - Water 48 336 57 500 4 204 7 608 35 453 27 845 78,5% 57 500
Dams & Reservoirs 48 336 57 500 4 204 7 608 35 453 27 845 78,5% 57 500
Infrastructure - Sanitation 1 500 – – – – – –
Reticulation 1 500 – – – – – –
Infrastructure - Other 151 936 214 307 23 428 42 876 68 302 25 426 37,2% 214 307
Waste Management 26 444 5 000 – 790 2 000 1 210 60,5% 5 000
Other 125 493 209 307 23 428 42 086 66 302 24 216 36,5% 209 307
Community 149 134 216 000 7 810 24 077 42 800 18 723 43,7% 216 000
Sportsfields & stadia 49 462 91 000 2 145 2 671 12 700 10 029 79,0% 91 000
Libraries 36 083 6 000 – – 400 400 100,0% 6 000
Recreational facilities – 10 000 – – 2 700 2 700 100,0% 10 000
Security and policing 1 934 10 000 – – 1 000 1 000 100,0% 10 000
Clinics 45 163 78 000 5 665 21 406 24 000 2 594 10,8% 78 000
Cemeteries 16 492 21 000 – – 2 000 2 000 100,0% 21 000 –
Investment properties – 57 100 – – 9 000 9 000 100,0% 57 100
Other – 57 100 – – 9 000 9 000 100,0% 57 100
Other assets 102 497 18 301 975 1 374 6 667 5 293 79,4% 18 301
Specialised v ehicles 120 – – – – – –
Furniture and other office equipment 35 062 12 801 518 524 3 567 3 043 85,3% 12 801
Markets 5 422 5 500 456 850 3 100 2 250 72,6% 5 500
Other Buildings 61 893 – – – – – –
Intangibles – 130 773 18 789 93 168 109 883 16 715 15,2% 130 773
Computers - softw are & programming – 130 773 18 789 93 168 109 883 16 715 15,2% 130 773
Total Capital Expenditure on new assets 1 1 959 090 2 192 616 141 541 403 959 554 955 150 997 27,2% 2 192 616
Specialised vehicles 120 – – – – – –
Fire 120 – – – – – –
Conserv ancy – – – – – – –
Ambulances – – – – – – –
Description Ref
TSH City Of Tshwane - Supporting Table SC13a Consolidated Monthly Budget Statement - capital expenditure on new assets by asset
class - M04 October

40
(o) Table SC13b: Consolidated Monthly Budget Statement – Capital expenditure on renewal of existing assets by asset class
2014/15 Budget Year 2015/16
Unaudited
Outcome
Original
Budget
Monthly
actual
YearTD
actual
YearTD
budget
YTD
variance
YTD
variance
Full Year
Forecast
R thousands 1 %
Capital expenditure on renewal of existing assets by Asset Class/Sub-class
Infrastructure 873 735 731 450 103 886 208 613 270 968 62 354 23,0% 731 450
Infrastructure - Road transport 31 808 28 450 703 1 366 5 900 4 534 76,9% 28 450
Roads, Pavements & Bridges 31 808 26 150 486 488 5 500 5 012 91,1% 26 150
Storm water – 2 300 218 878 400 (478) -119,5% 2 300
Infrastructure - Electricity 452 096 338 500 42 460 77 403 78 350 947 1,2% 338 500
Generation 304 116 225 000 34 484 43 103 49 200 6 097 12,4% 225 000
Transmission & Reticulation 94 563 43 500 6 397 18 355 12 650 (5 705) -45,1% 43 500
Street Lighting 53 417 70 000 1 579 15 944 16 500 556 3,4% 70 000
Infrastructure - Water 243 073 182 429 44 488 82 857 107 300 24 443 22,8% 182 429
Reticulation 243 073 182 429 44 488 82 857 107 300 24 443 22,8% 182 429
Infrastructure - Sanitation 124 336 115 071 10 349 31 680 59 418 27 738 46,7% 115 071
Reticulation 116 224 90 000 9 265 27 939 43 000 15 061 35,0% 90 000
Sewerage purification 8 112 25 071 1 084 3 741 16 418 12 677 77,2% 25 071
Infrastructure - Other 22 423 67 000 5 885 15 309 20 000 4 691 23,5% 67 000
Waste Management 2 000 12 000 322 4 322 5 000 678 13,6% 12 000
Transportation 20 423 55 000 5 563 10 987 15 000 4 013 26,8% 55 000
Community 196 594 151 000 9 684 10 781 41 833 31 052 74,2% 151 000
Parks & gardens 19 690 35 000 – 31 7 500 7 469 99,6% 35 000
Fire, safety & emergency – 2 000 – 1 066 – (1 066) #DIV/0! 2 000
Security and policing 1 906 – – – – – –
Clinics – 7 000 – – 500 500 100,0% 7 000
Cemeteries – 7 000 – – 500 500 100,0% 7 000
Other 174 998 100 000 9 684 9 684 33 333 23 649 70,9% 100 000 –
Investment properties 838 029 675 500 23 582 40 738 137 460 96 722 70,4% 675 500
Housing development 838 029 670 500 23 582 40 738 137 460 96 722 70,4% 670 500
Other – 5 000 – – – – 5 000
Other assets 112 497 106 000 2 996 3 786 22 233 18 447 83,0% 106 000
General v ehicles 3 981 – – – – – –
Specialised v ehicles – – – – – – –
Plant & equipment 983 3 000 – – 500 500 100,0% 3 000
Computers - hardware/equipment 14 022 15 000 – 468 – (468) #DIV/0! 15 000
Furniture and other office equipment 11 427 13 000 2 2 4 333 4 331 99,9% 13 000
Other Buildings 67 901 38 500 1 003 1 058 10 400 9 342 89,8% 38 500
Other 14 182 36 500 1 991 2 257 7 000 4 743 67,8% 36 500
Total Capital Expenditure on renewal of existing assets 1 2 020 855 1 663 950 140 148 263 918 472 494 208 576 44,1% 1 663 950
Specialised vehicles – – – – – – –
Fire – – – – – – –
Ambulances – – – – – – –
TSH City Of Tshwane - Supporting Table SC13b Consolidated Monthly Budget Statement - capital expenditure on renewal of existing
assets by asset class - M04 October
Description Ref

41
(p) Table SC13c: Consolidated Monthly Budget Statement – Capital expenditure on repairs and maintenance by asset class
2014/15 Budget Year 2015/16
Unaudited
Outcome
Original
Budget
Monthly
actual
YearTD
actual
YearTD
budget
YTD
variance
YTD
variance
Full Year
Forecast
R thousands 1 %
Repairs and maintenance expenditure by Asset Class/Sub-class
Infrastructure 796 775 801 393 79 207 242 865 264 100 21 235 8,0% 801 393
Infrastructure - Road transport 152 633 120 794 14 833 48 911 42 661 (6 250) -14,6% 120 794
Roads, Pavements & Bridges 123 480 101 028 13 375 44 742 36 073 (8 669) -24,0% 101 028
Storm water 29 153 19 766 1 459 4 169 6 589 2 419 36,7% 19 766
Infrastructure - Electricity 446 514 386 114 45 204 144 078 144 972 894 0,6% 386 114
Generation 60 427 74 019 4 326 12 719 24 673 11 953 48,4% 74 019
Transmission & Reticulation 329 090 289 193 33 665 107 039 101 465 (5 574) -5,5% 289 193
Street Lighting 56 997 22 903 7 213 24 320 18 834 (5 485) -29,1% 22 903
Infrastructure - Water 108 743 231 797 13 567 32 667 51 017 18 351 36,0% 231 797
Dams & Reservoirs 11 716 4 743 1 366 3 159 1 581 (1 578) -99,8% 4 743
Water purification 11 209 8 898 689 1 337 4 122 2 785 67,6% 8 898
Reticulation 85 818 218 157 11 512 28 170 45 314 17 144 37,8% 218 157
Infrastructure - Sanitation 56 122 49 337 4 224 12 702 19 813 7 112 35,9% 49 337
Reticulation 16 036 11 018 971 2 858 7 041 4 183 59,4% 11 018
Sewerage purification 40 085 38 318 3 253 9 844 12 773 2 929 22,9% 38 318
Infrastructure - Other 32 764 13 351 1 378 4 507 5 636 1 128 20,0% 13 351
Waste Management 32 764 13 351 1 378 4 507 5 636 1 128 20,0% 13 351
Community 214 308 202 263 14 516 34 258 69 319 35 061 50,6% 202 263
Parks & gardens 31 442 32 910 2 975 7 673 10 980 3 307 30,1% 32 910
Sportsfields & stadia 181 198 – – 66 66 100,0% 198
Recreational facilities 13 015 12 925 1 859 4 174 5 168 994 19,2% 12 925
Fire, safety & emergency 22 037 15 449 2 710 8 760 5 629 (3 132) -55,6% 15 449
Security and policing 41 000 32 520 806 2 079 11 356 9 278 81,7% 32 520
Buses 4 123 3 882 904 1 377 1 294 (83) -6,4% 3 882
Museums & Art Galleries 1 – – – – – –
Cemeteries 5 666 6 361 385 1 503 2 154 651 30,2% 6 361
Other 96 842 98 018 4 879 8 692 32 672 23 980 73,4% 98 018
Other assets 496 779 435 605 30 447 81 604 155 555 73 952 47,5% 435 605
General v ehicles 209 712 198 820 11 208 23 058 66 275 43 217 65,2% 198 820
Specialised v ehicles – – – – – – –
Plant & equipment 23 301 34 141 1 292 5 135 16 414 11 279 68,7% 34 141
Computers - hardware/equipment 5 695 3 309 (655) 381 1 116 735 65,8% 3 309
Furniture and other office equipment 14 414 14 388 592 2 615 5 537 2 922 52,8% 14 388
Civ ic Land and Buildings 1 646 1 491 56 227 497 269 54,2% 1 491
Other Buildings 133 303 102 851 11 395 31 071 36 904 5 833 15,8% 102 851
Other Land 80 342 76 018 5 506 17 237 27 131 9 894 36,5% 76 018
Other 28 367 4 587 1 052 1 879 1 682 (197) -11,7% 4 587
Intangibles 99 697 73 767 16 943 31 181 24 856 (6 325) -25,4% 73 767
Computers - softw are & programming 99 697 73 767 16 943 31 181 24 856 (6 325) -25,4% 73 767
Other – – – – – – –
Total Repairs and Maintenance Expenditure 1 607 560 1 513 028 141 114 389 908 513 830 123 922 24,1% 1 513 028
Specialised vehicles – – – – – – –
Fire – – – – – – –
Conserv ancy – – – – – – –
Ambulances – – – – – – –
TSH City Of Tshwane - Supporting Table SC13c Consolidated Monthly Budget Statement - expenditure on repairs and maintenance by
asset class - M04 October
Description Ref

42
(q) Table SC13d: Consolidated Monthly Budget Statement - Depreciation by asset class
2014/15 Budget Year 2015/16
Unaudited
Outcome
Original
Budget
Monthly
actual
YearTD
actual
YearTD
budget
YTD
variance
YTD
variance
Full Year
Forecast
R thousands 1 %
Depreciation by Asset Class/Sub-class
Infrastructure 844 568 771 204 77 071 266 581 253 590 (12 991) -5,1% 771 204
Infrastructure - Road transport 482 914 437 122 21 979 102 540 106 072 3 532 3,3% 437 122
Roads, Pavements & Bridges 431 515 280 026 12 711 74 572 75 105 533 0,7% 280 026
Storm water 51 398 157 096 9 268 27 968 30 967 3 000 9,7% 157 096
Infrastructure - Electricity 168 081 137 941 23 834 66 720 35 499 (31 221) -87,9% 137 941
Generation 117 319 102 647 21 013 48 209 24 180 (24 029) -99,4% 102 647
Transmission & Reticulation 33 284 13 717 2 263 9 906 4 956 (4 951) -99,9% 13 717
Street Lighting 17 478 21 577 559 8 605 6 363 (2 242) -35,2% 21 577
Infrastructure - Water 95 349 73 958 17 226 48 823 55 052 6 229 11,3% 73 958
Dams & Reservoirs 15 816 17 724 1 487 4 106 13 672 9 566 70,0% 17 724
Reticulation 79 533 56 233 15 739 44 717 41 380 (3 337) -8,1% 56 233
Infrastructure - Sanitation 41 174 35 471 3 661 17 097 22 914 5 817 25,4% 35 471
Reticulation 38 519 27 742 3 278 15 078 16 583 1 505 9,1% 27 742
Sewerage purification 2 654 7 728 384 2 019 6 331 4 312 68,1% 7 728
Infrastructure - Other 57 050 86 712 10 370 31 402 34 053 2 652 7,8% 86 712
Waste Management 9 307 5 240 114 2 759 2 700 (59) -2,2% 5 240
Transportation 6 682 16 954 1 968 5 930 5 785 (145) -2,5% 16 954
Other 41 061 64 518 8 288 22 713 25 569 2 856 11,2% 64 518
Community 113 122 113 127 6 189 18 813 32 639 13 826 42,4% 113 127
Parks & gardens 6 443 10 789 – 17 2 892 2 875 99,4% 10 789
Sportsfields & stadia 16 184 28 051 759 1 441 4 898 3 456 70,6% 28 051
Libraries 11 806 1 849 – – 154 154 100,0% 1 849
Recreational facilities – 3 082 – – 1 041 1 041 100,0% 3 082
Fire, safety & emergency – 616 – 575 – (575) #DIV/0! 616
Security and policing 1 256 3 082 – – 386 386 100,0% 3 082
Clinics 14 777 26 201 2 004 11 553 9 448 (2 104) -22,3% 26 201
Cemeteries 5 396 8 631 – – 964 964 100,0% 8 631
Other 57 260 30 825 3 426 5 226 12 855 7 628 59,3% 30 825 –
Investment properties 274 203 225 823 8 343 21 986 56 482 34 496 61,1% 225 823
Housing development 274 203 206 681 8 343 21 986 53 011 31 025 58,5% 206 681
Other – 19 142 – – 3 471 3 471 100,0% 19 142
Other assets 70 346 38 316 1 405 2 785 11 145 8 361 75,0% 38 316
General v ehicles 1 303 – – – – – –
Specialised v ehicles 39 – – – – – –
Plant & equipment 322 925 – – 193 193 100,0% 925
Computers - hardware/equipment 4 588 4 624 – 253 – (253) #DIV/0! 4 624
Furniture and other office equipment 15 211 7 953 184 284 3 047 2 763 90,7% 7 953
Markets 1 774 1 695 161 459 1 196 737 61,6% 1 695
Other Buildings 42 469 11 868 355 571 4 011 3 440 85,8% 11 868
Other 4 640 11 251 704 1 218 2 700 1 481 54,9% 11 251
Intangibles – 40 311 6 647 50 282 42 376 (7 906) -18,7% 40 311
Computers - softw are & programming – 40 311 6 647 50 282 42 376 (7 906) -18,7% 40 311
Total Depreciation 1 302 240 1 188 780 99 654 360 446 396 232 35 786 9,0% 1 188 780
Specialised vehicles 39 – – – – – –
Fire 39 – – – – – –
Conserv ancy – – – – – – –
Ambulances – – – – – – –
TSH City Of Tshwane - Supporting Table SC13d Consolidated Monthly Budget Statement - depreciation by asset class - M04 October
Description Ref

43
(r) Municipal manager’s quality certification.
QUALITY CERTIFICATE I, JASON NGOBENI, the City Manager of the City of Tshwane, hereby certify that -
□ the monthly budget statement
For the month of October 2015 has been prepared in accordance with the Municipal Finance
Management Act and regulations made under that Act.
Print name: JASON NGOBENI City Manager of the City of Tshwane (TSH) Signature: ______________________________________ Date: ______________________________________


