Embed Size (px)
Citation preview
Schedule• 6 Oct Computer Vision• 8 Oct Multispectral Image Analysis• 13 Oct Applications, Big Data, Morphology• 15 Oct Medical Image Analysis

How?
Segmentation
• 1 Clustering (se f07.pdf)• Segmentation using clustering
• 2. Graphs• A simple graph based clustering method
• 3. The Mumford-Shah functional• 4. Graph cuts

1. Pixels, clustering, segmentationAt each pixel one could define a feature vector
Intensity f(i,j)RGB colour channel (r,g,b)Multispectral channel (Guest lecture)Position (i,j)Response from a filter bank
Use machine learning to define a mapping from pixel feature vector to segment
Either supervised (using lots of old examples) …
… unsupervised (what do we mean by this?)
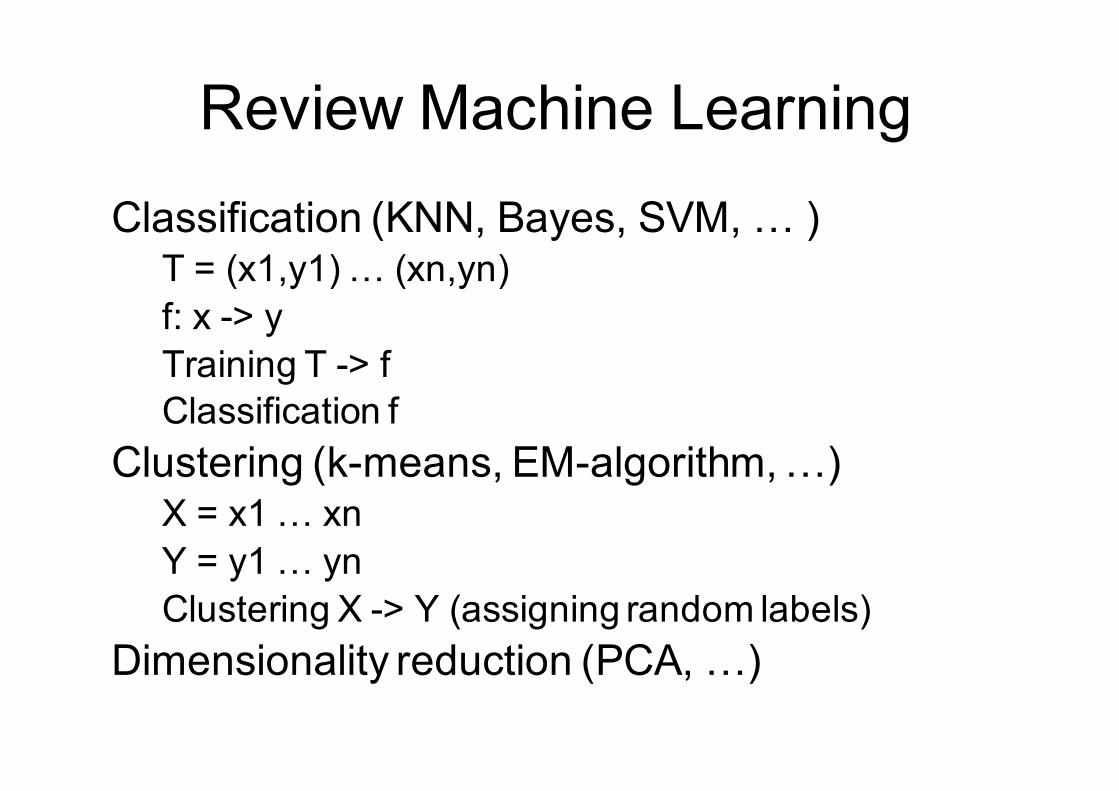
Review Machine LearningClassification (KNN, Bayes, SVM, … )
T = (x1,y1) … (xn,yn)f: x -> yTraining T -> fClassification f
Clustering (k-means, EM-algorithm, …)X = x1 … xnY = y1 … ynClustering X -> Y (assigning random labels)
Dimensionality reduction (PCA, …)
Texture Segmentation Clustering Review Segmentation Gestalt laws Split and Merge Applications
Segmentation using clustering
Using clustering:
! Segment an image into pieces
! Fit lines to a set of points
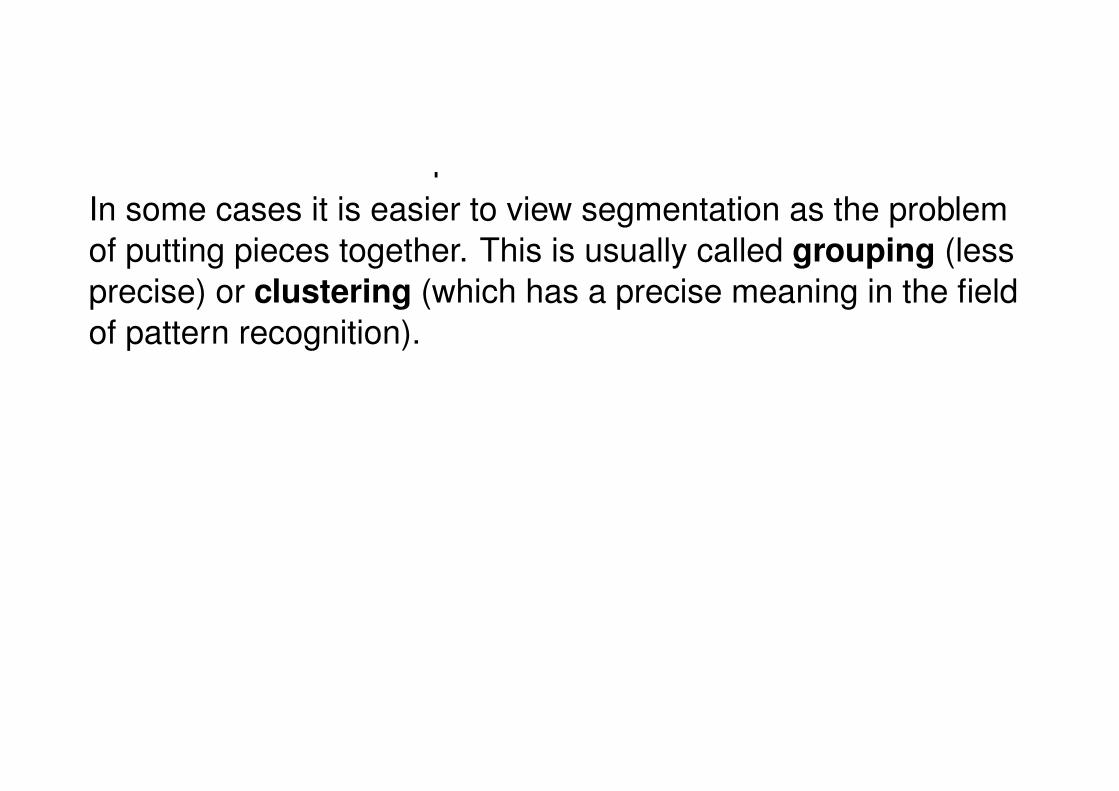
In some cases it is easier to view segmentation as the problemof putting pieces together. This is usually called grouping (lessprecise) or clustering (which has a precise meaning in the fieldof pattern recognition).
Fredrik Kahl Image Analysis - Lecture 5
Clustering vs segmentation

K-means clustering using intensity alone and color alone
Image Clusters on intensity Clusters on color

K-means using color alone, 11 segments
Image Clusters on color
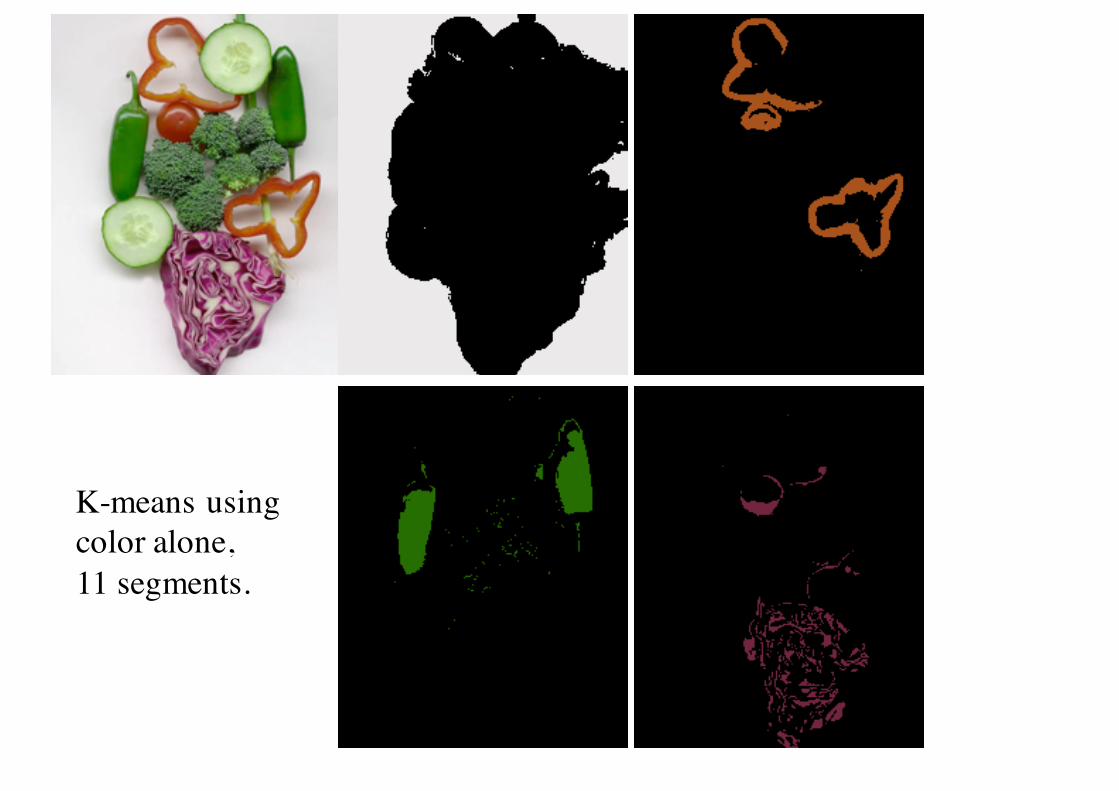
K-means usingcolor alone,11 segments.
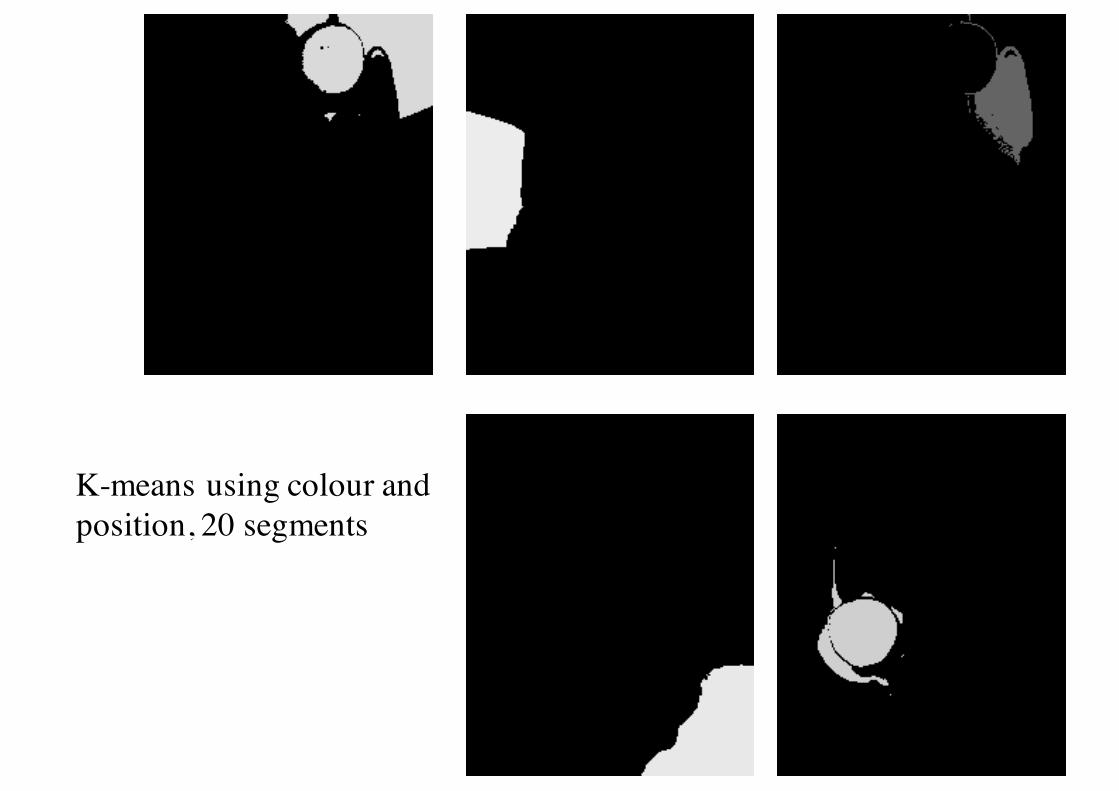
K-means using colour andposition, 20 segments

2. Graph theory

Graph theory

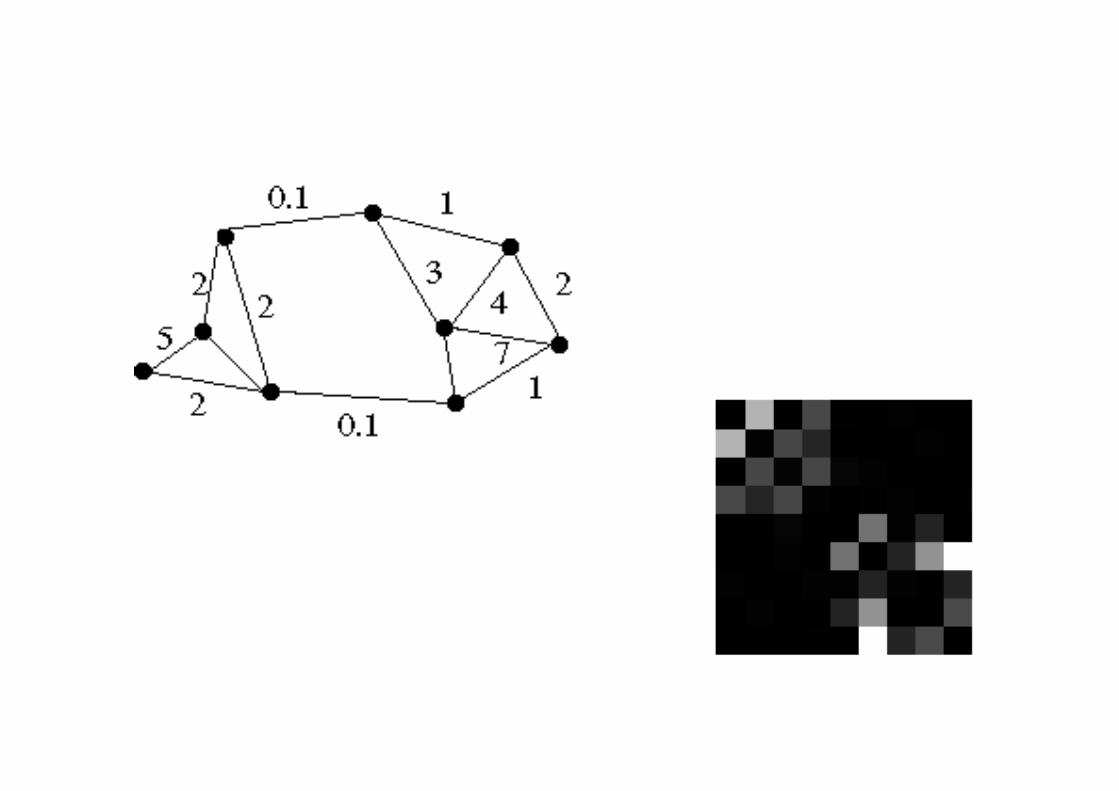
Graph theoretic clustering• Represent tokens
using a weighted graph.– affinity matrix
• Cut up this graph to get subgraphs with strong interior links

Graph theoretic clustering

Graph theoretic clustering

Graph theoretic clustering

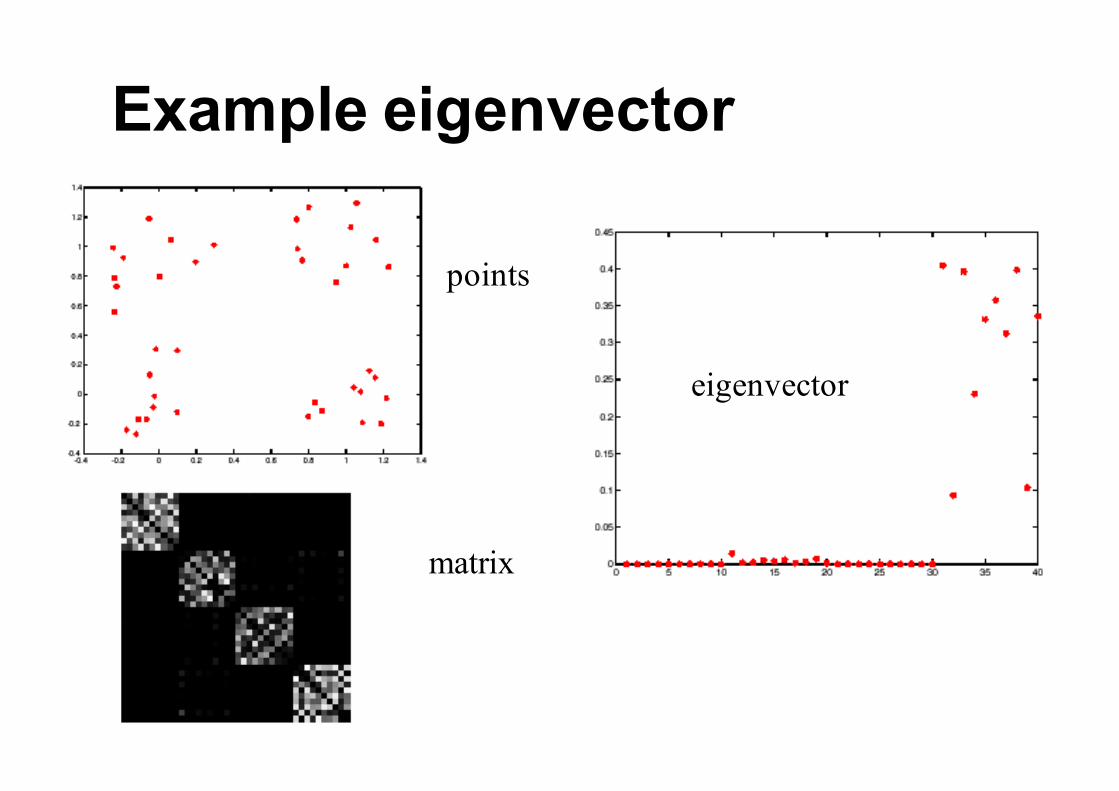
Example eigenvector
points
matrix
eigenvector
More than two segments
• Two options– Recursively split each side to get a tree,
continuing till the eigenvalues are too small– Use the other eigenvectors
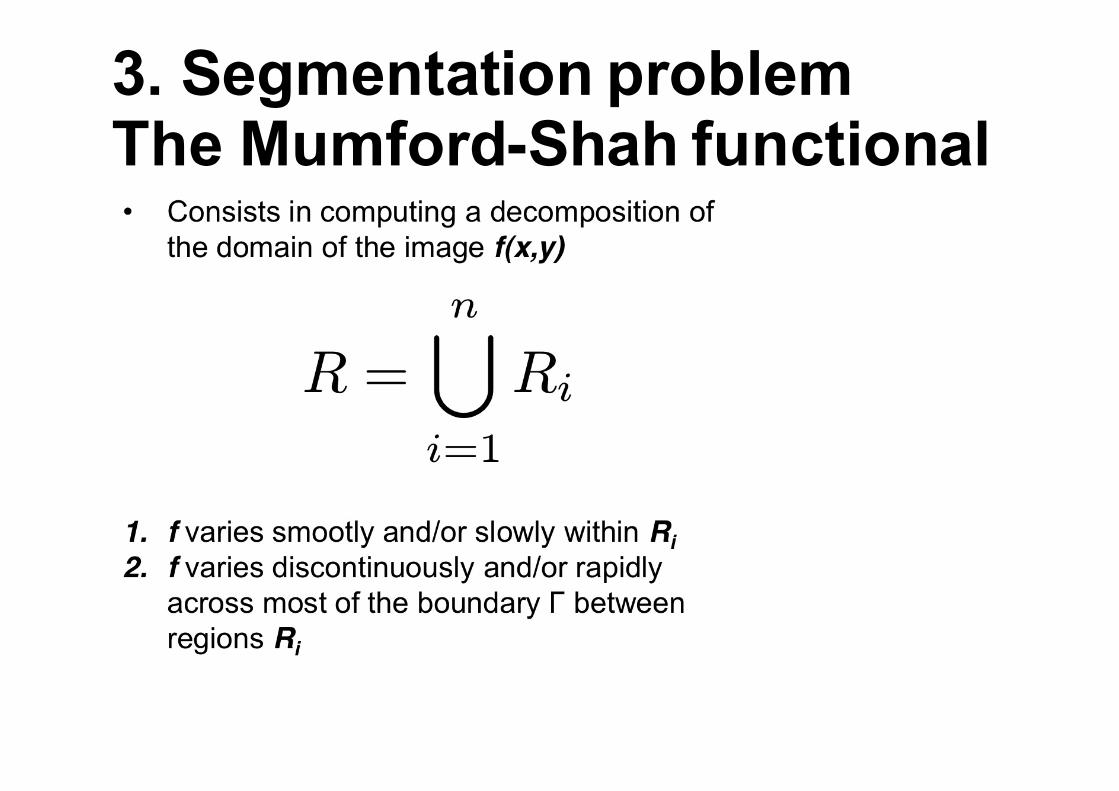
3. Segmentation problemThe Mumford-Shah functional
Segmentation problem
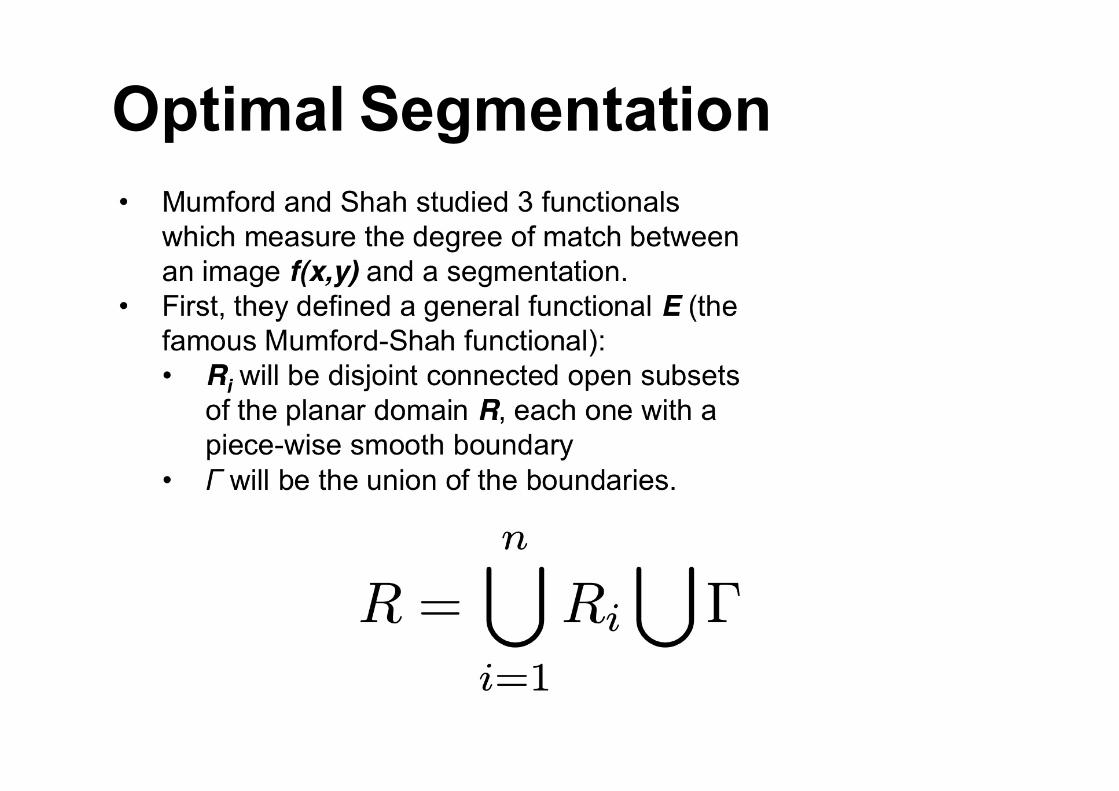
Optimal Segmentation
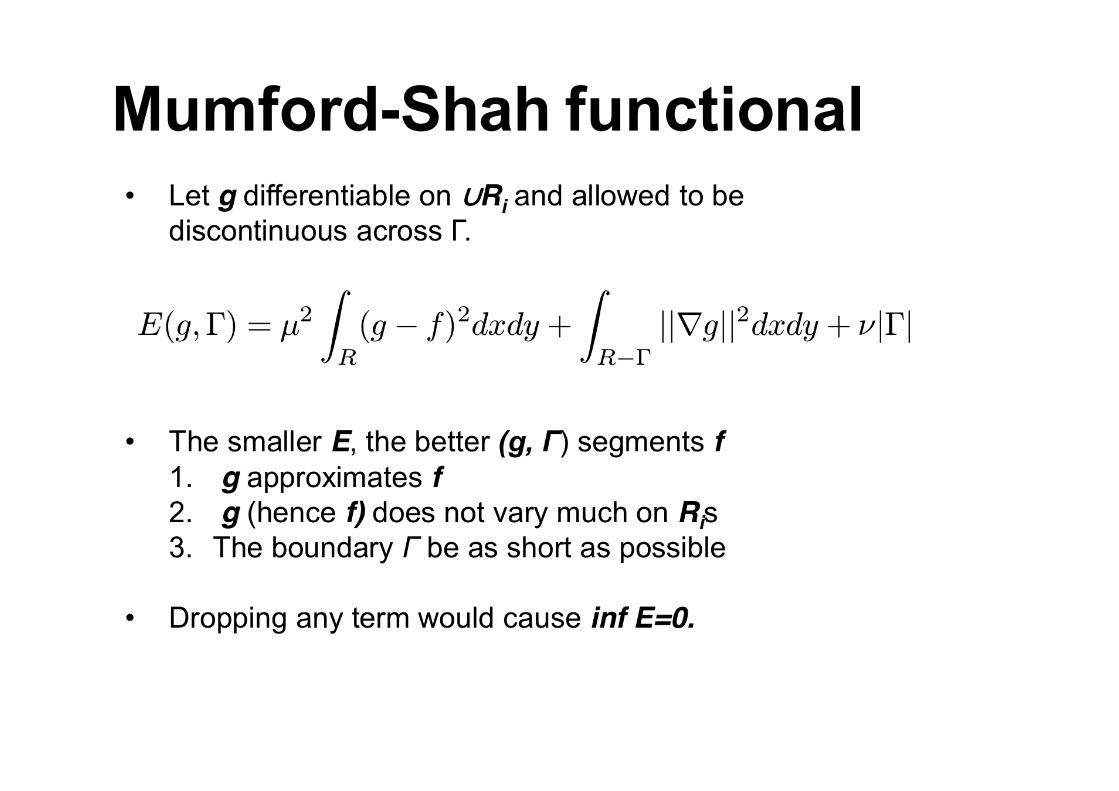
Mumford-Shah functional

Cartoon Image

Cartoon Image example

Piecewise constant approximation

Piecewise constant approximation
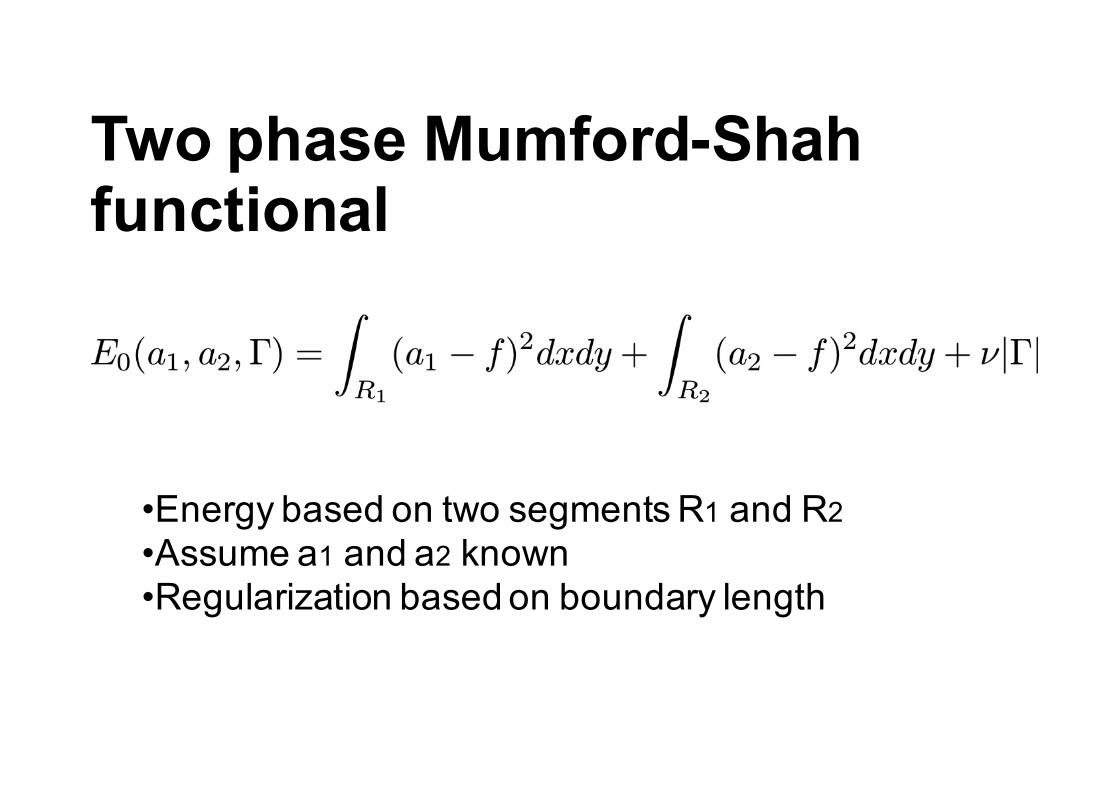
Two phase Mumford-Shah functional
•Energy based on two segments R1 and R2•Assume a1 and a2 known•Regularization based on boundary length
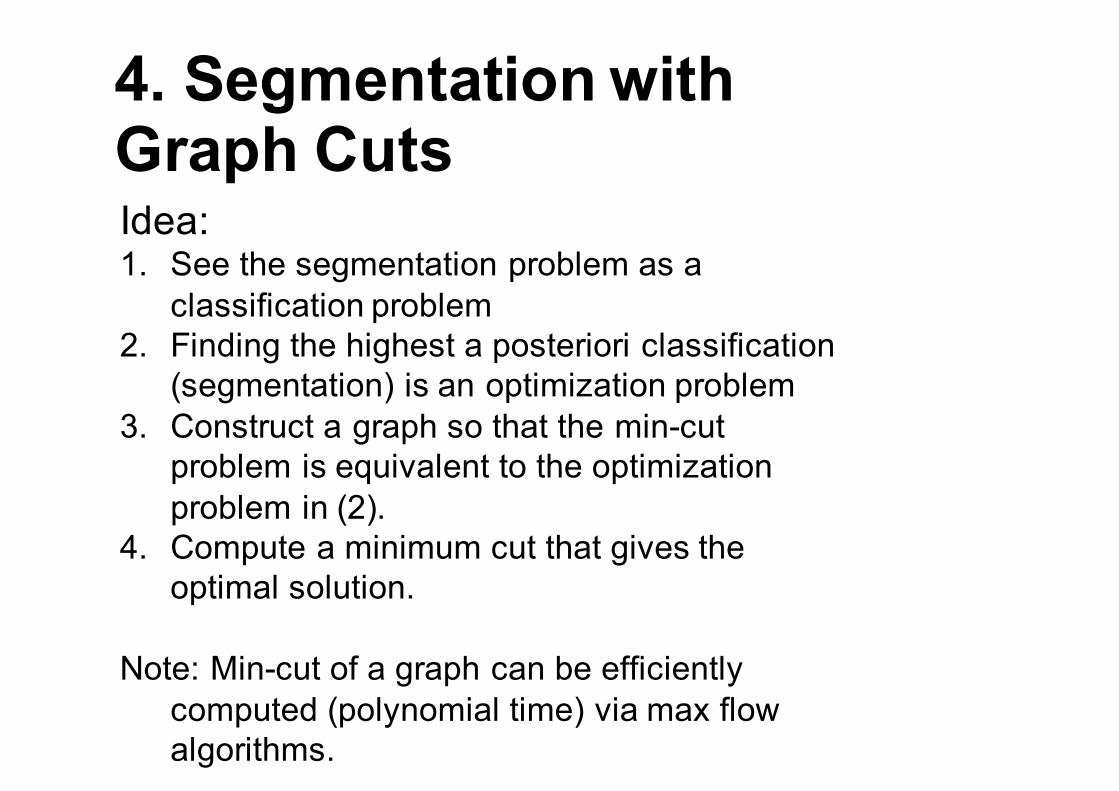
4. Segmentation withGraph CutsIdea:1. See the segmentation problem as a
classification problem2. Finding the highest a posteriori classification
(segmentation) is an optimization problem3. Construct a graph so that the min-cut
problem is equivalent to the optimizationproblem in (2).
4. Compute a minimum cut that gives the optimal solution.
Note: Min-cut of a graph can be efficientlycomputed (polynomial time) via max flowalgorithms.

A priori probabilities ofsegmentationsIdea:We are segmenting some pixels as foreground
(1) and some as background (0). It might be more probable with foreground pixels
or the inverse, e.g. P_i(g_i=1)=p1
Assume a priori probabilities that are
P(g) ~ _i p_i(g_i) + \sum_(i,j) \in E p_ij(g_i,g_j)
Note: Min-cut of a graph can be efficientlycomputed (polynomial time) via max flowalgorithms.
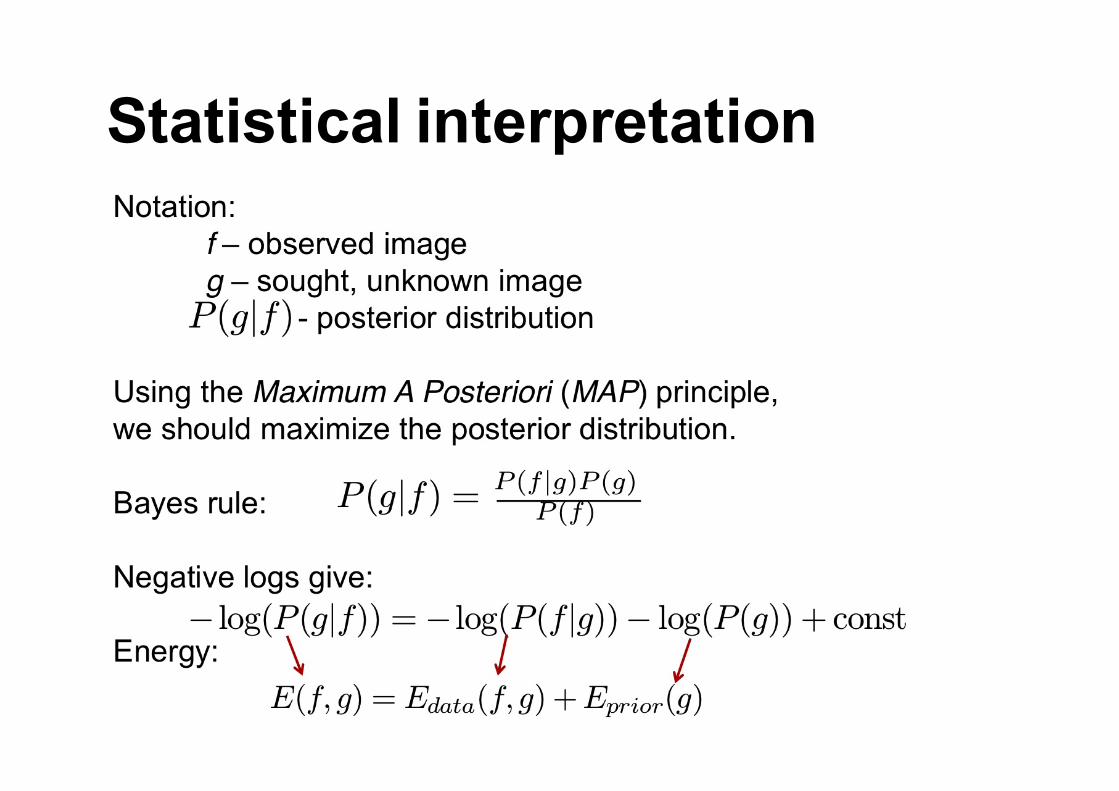
Statistical interpretation

Statistical two-phase Mumford-Shah
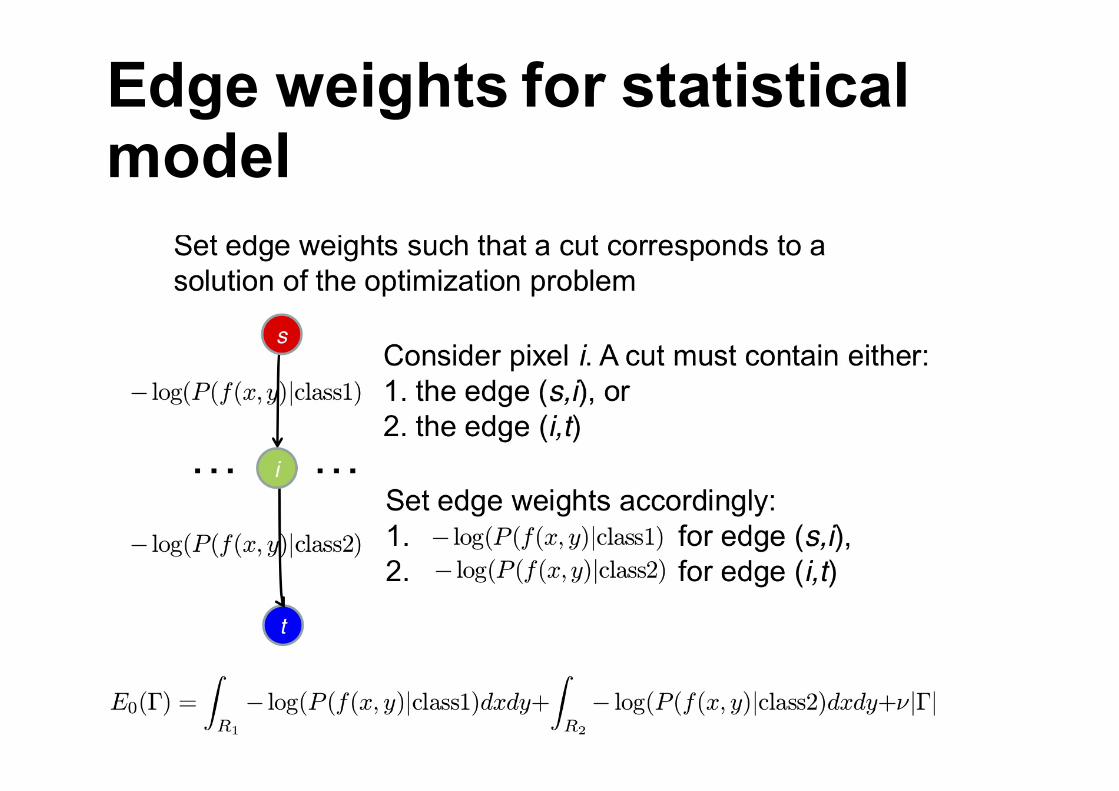
Edge weights for statistical model
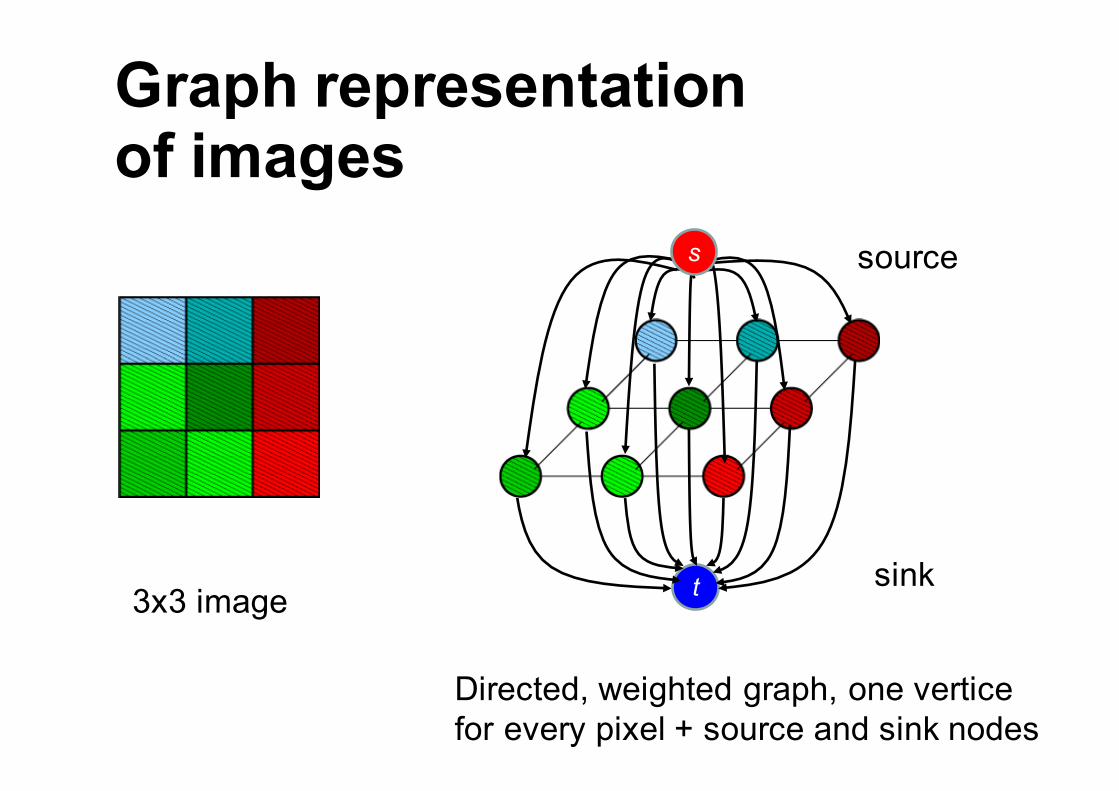
Graph representationof images
3x3 image t
source
sink
s
Directed, weighted graph, one verticefor every pixel + source and sink nodes

Graph Cuts
Definition: A cut (or s-t cut) in a graph G=(V,E) is a subset of edges Ec such that there is no path from s to twhen Ec is removed.
Definition: The cost of a cut is the sum of all edge weights for the edges in the cut.
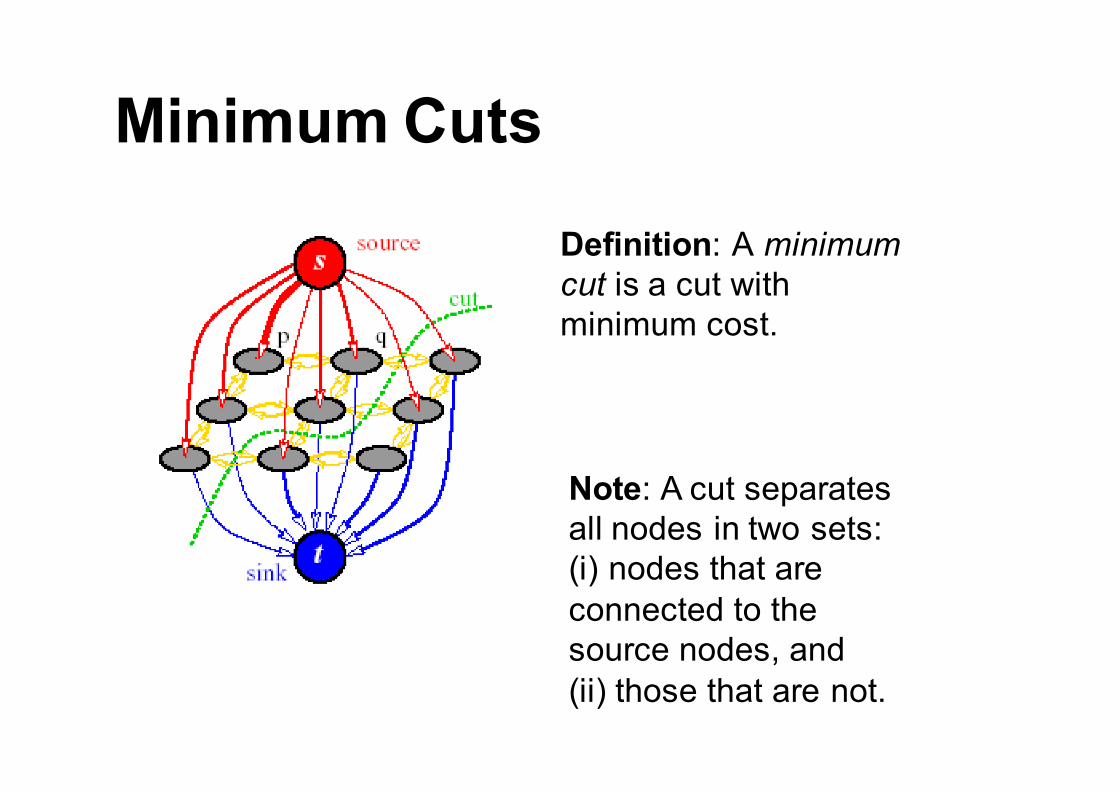
Minimum Cuts
Definition: A minimum cut is a cut with minimum cost.
Note: A cut separates all nodes in two sets: (i) nodes that are connected to the source nodes, and(ii) those that are not.
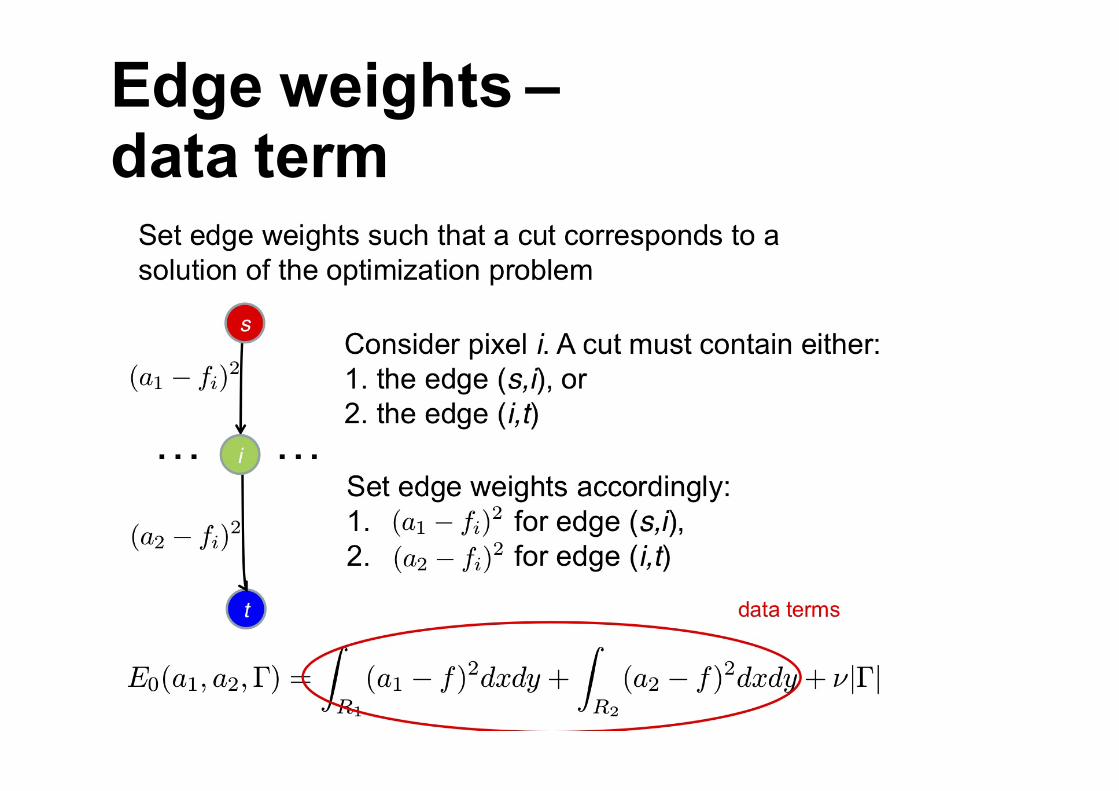
Edge weights –data term
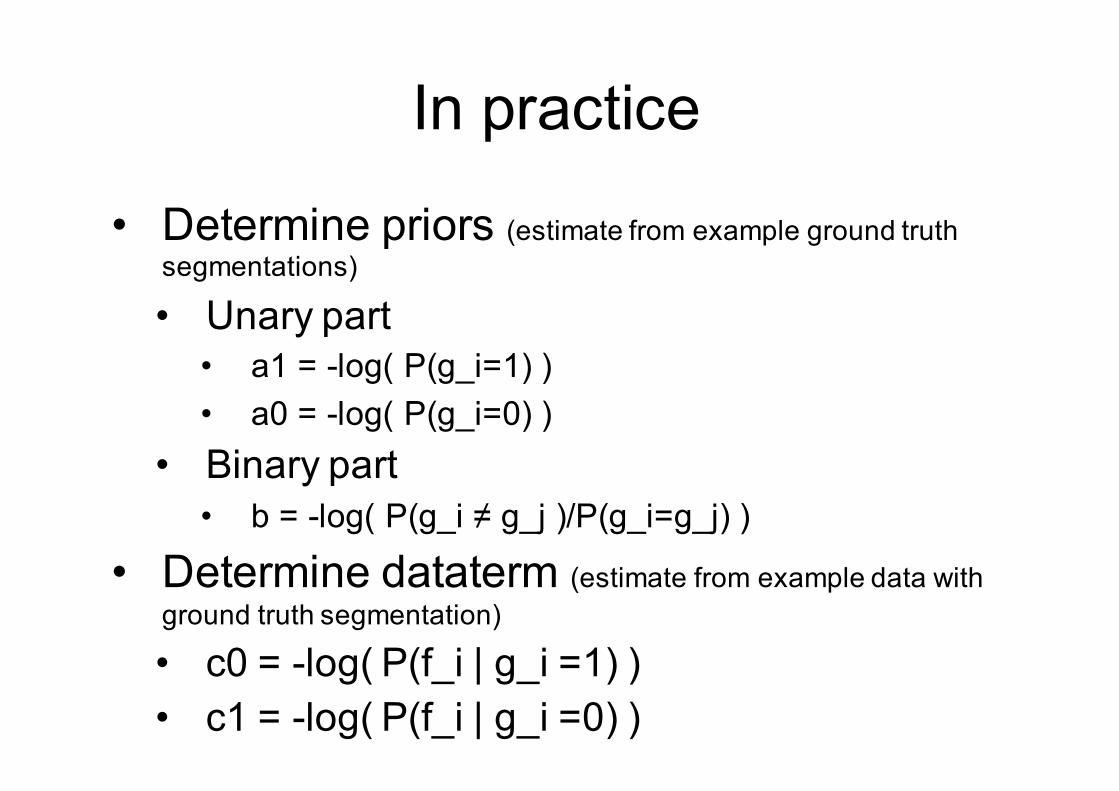
In practice
• Determine priors (estimate from example ground truthsegmentations)
• Unary part• a1 = -log( P(g_i=1) ) • a0 = -log( P(g_i=0) )
• Binary part• b = -log( P(g_i ≠ g_j )/P(g_i=g_j) )
• Determine dataterm (estimate from example data withground truth segmentation)
• c0 = -log( P(f_i | g_i =1) )• c1 = -log( P(f_i | g_i =0) )
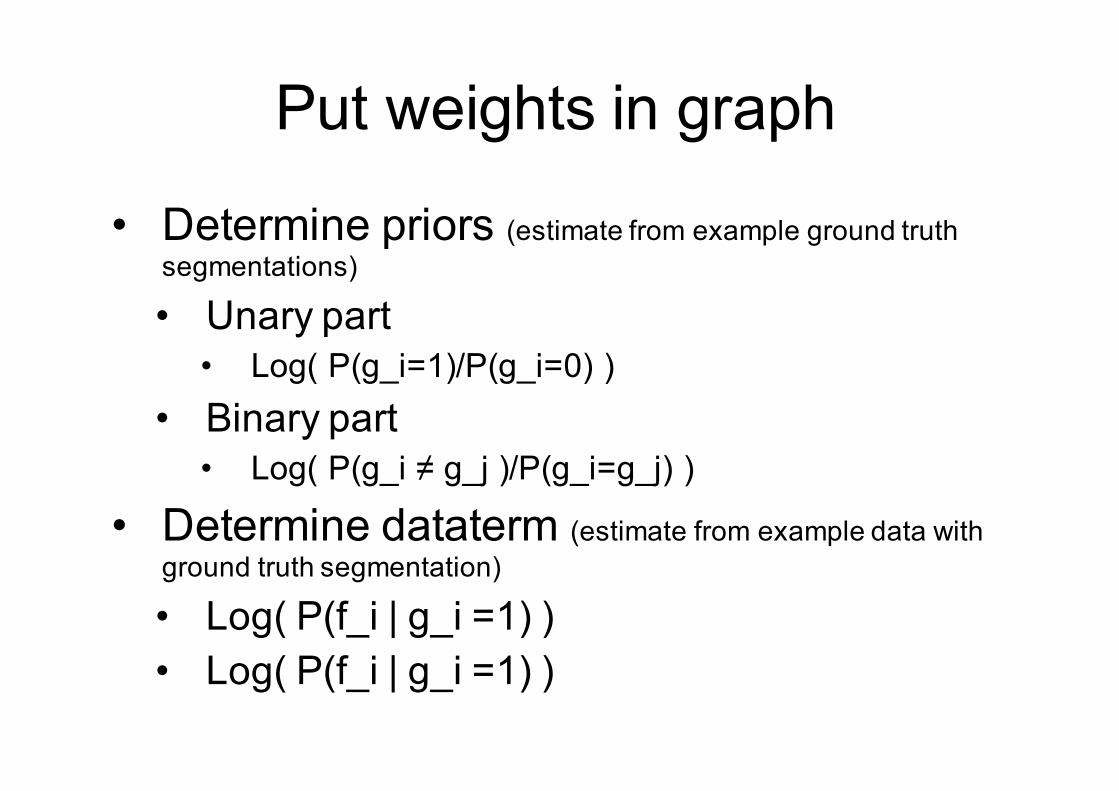
Put weights in graph
• Determine priors (estimate from example ground truthsegmentations)
• Unary part• Log( P(g_i=1)/P(g_i=0) )
• Binary part• Log( P(g_i ≠ g_j )/P(g_i=g_j) )
• Determine dataterm (estimate from example data withground truth segmentation)
• Log( P(f_i | g_i =1) )• Log( P(f_i | g_i =1) )

Edge weights –regularization term
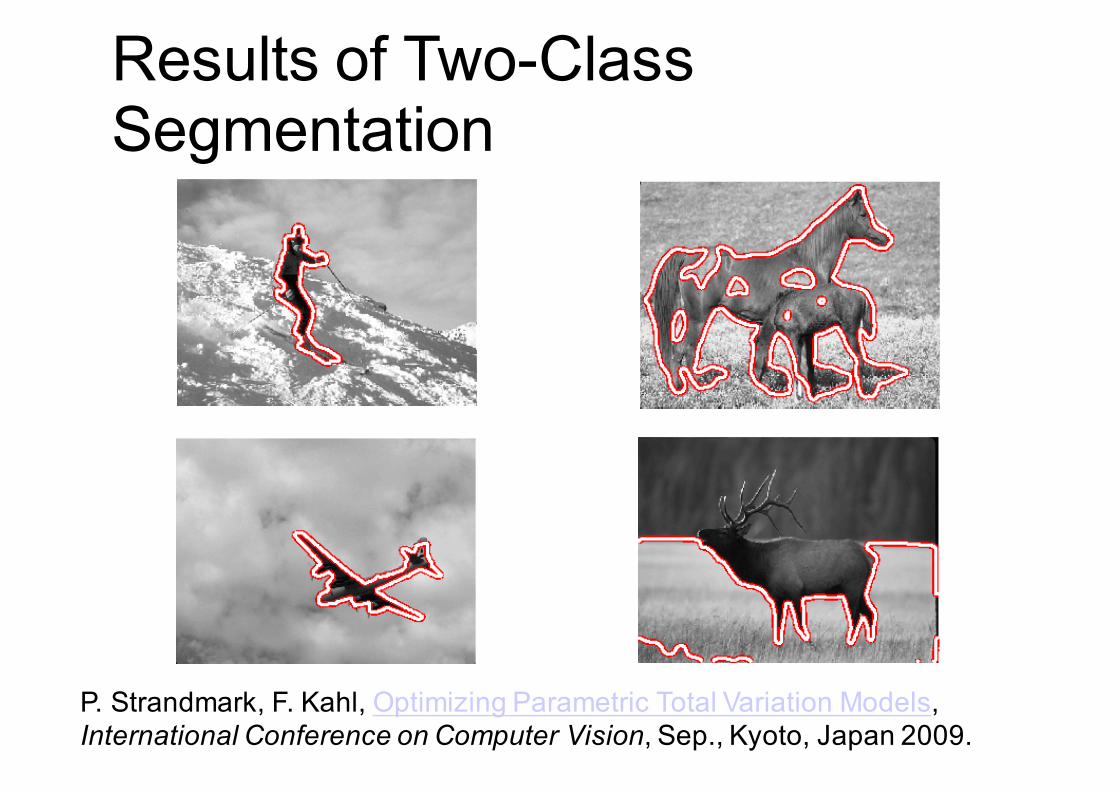
Results of Two-Class Segmentation
P. Strandmark, F. Kahl, Optimizing Parametric Total Variation Models,International Conference on Computer Vision, Sep., Kyoto, Japan 2009.

Example of graph-cut application:Multi-view volumetric reconstruction
There are many, many other applications with Graph Cuts in recent years
(recognition, stereo, motion estimation…)
Graph cuts homepage
http://www.cs.cornell.edu/~rdz/graphcuts.html
Wikipediahttp://en.wikipedia.org/wiki/Graph_cuts_in_computer_vision