Embed Size (px)
Citation preview

Background Report Reference
AP-42 Section Number: 1 1.6
Background Chapter: 4
Reference Number: 80
Title: Evaluation of the Origin, Emissions and Control of Organic and Metal Compounds from Cement Kilns Fired with Hazardour Wastes
H.B. Dellinger, D.W. Pershing, and A. F. Sarofim
Science Advisory Board on Cement Kiln Recycling
June 1993

A P 4 2 Section - 51
A report of The Scientific Advisory Board on Cement Kiln Recycling
H. B. Dellinger D. W. Pershiig A. F. Sarofirn
Process Technology Workgroup Scientific Advisory Board
June 8,1993

A report of The Scientific Advisory Board on Cement Kiln Recycling
H. B. Delliinger D. W. Pershing A. F. S a r o f i
Process Technology Workgroup Scientific Advisory Board
June 8,1993

This report was developed by the Scientific Advisory Board on Cement Kiln Recycling m e s s Technology Workgroup. Members include:
Adel F. Sarofim, Sc.D., Workgroup Chairman (Massachusetts Institute of Technology, Cambridge, Massachusetts)
David W. Pershing, Ph.D., (University of Utah, Salt Lake City, Utah)
Barry R. Dellinger, Ph.D., (University of Dayton, Dayton, Ohio)
This report has been peer reviewed and approved by the' following members of the Scientific Advisory Board on Cement Kiln Recycling:
George L. Carlo, Ph.D., M.S., J.D., SAB Chairman (Health & Environmental Sciences Group, Ltd., Washington, D.C.)
Russell Keenan, Ph.D., (ChemRisk, Inc., Portland, Maine)
Harold Imbus, M.D., Sc.D., (Health and Hygiene, Inc., Greensboro, North Carolina)
Technical assistance was provided by Drs. Michael P. Heap and Warren D. Owens, Reaction Engineering International, Salt Lake City, Utah, Maureen Jabliiske, Health & Environmental Sciences Group, Ltd., Washington, D.C., and James Baller, Esq., Baller Harnmett, Washington, D.C., Special Counsel to the SAB.

Background on SAB . . . . . . . . . . . . . . . . . . . . . . . . . . . . . . 1 SAB Guiding Principles . . . . . . . . . . . . . . . . . . . . . . . . . . . . . . 1
1 USE OF WASTE-DERIVED FUELS IN CEMENT KILNS 3
Advantages of the Use of Waste-Derived Fuels in Cement Kilns . . . 3 Scientific Issues . . . . . . . . . . . . . . . . . . . . . . . . . . . . . . . . . . 4 Summary Conclusions . . . . . . . . . . . . . . . . . . . . . . . . . . . . . . 5
2 SCIENTIFIC CONCLUSIONS AND RECOMMENDATIONS 6
Conclusions . . . . . . . . . . . . . . . . . . . . . . . . . . . . . . . . . . . . . 6 Recommendations . . . . . . . . . . . . . . . . . . . . . . . . . . . . . . . . 10
3 PROCESS DESCRIPTION AND REGULATIONS 13
RawMaterial . . . . . . . . . . . . . . . . . . . . . . . . . . . . . . . . . . . 14 Types of Cement Production Processes . . . . . . . . . . . . . . . . . . . . . 14 Characteristics of a Cement Kiln . . . . . . . . . . . . . . . . . . . . . . . . 16 Cement Kiln Dust . . . . . . . . . . . . . . . . . . . . . . . . . . . . . . . 24 BIF Regulations . . . . . . . . . . . . . . . . . . . . . . . . . . . . . . . . . 24
4 METALS 32
Summary . . . . . . . . . . . . . . . . . . . . . . . . . . . . . . . . . . . . . 32 Issues . . . . . . . . . . . . . . . . . . . . . . . . . . . . . . . . . . . 34 Theoretical Background . . . . . . . . . . . . . . . . . . . . . . . . . . . . . 35 Reliability of Data . . . . . . . . . . . . . . . . . . . . . . . . . . . . . . . . 64 Test Results . . . . . . . . . . . . . . . . . . . . . . . . . . . . . . . . . . . 68 Discussion . . . . . . . . . . . . . . . . . . . . . . . . . . . . . . . . . . . 87
5 ORGANICS 93
Summary . . . . . . . . . . . . . . . . . . . . . . . . . . . . . . . . . . . . . 93 . . . . . . . . . . . . . . . . . . . . . . . . . . . . . . . . . . . . . . . . Issues 95
Theoretical Background . . . . . . . . . . . . . . . . . . . . . . . . . . . . . 96 Reliability of Data . . . . . . . . . . . . . . . . . . . . . . . . . . . . . . . 120 Test Results . . . . . . . . . . . . . . . . . . . . . . . . . . . . . . . . . . . 121 Discussion of Environmental and Regulatory Implications . . . . . . . . . . . 135
REFERENCES 142

GLOSSARY 148
APPENDIX I
Mass Balance. . . . . . . . . . . . . . . . . . . . . . . . . . . . . . . . I52
APPENDIX II
Summary of POHC Emissions Data. . . . . . . . . . . . . . . . . . . . . . . I55
Emissions Data on Products of Incomplete Combustion . . . . . . . . . . . 158
APPENDIX IV
Summary of PCDDPCDF Emissions . . . . . . . . . . . . . . . . . . . . . . I72
APPENDIX v Continuous Emissions Monitoring (CEM) Data. . . . . . . . . . . . . . . . 174

\ tm June 1993 Pnge 1
The objective of this technical report is to evaluate the use of wastederived fuels (WDF) as a substitute for conventional fossil fuels in cement manufacture. This report has been prepared by the Scientific Advisory Board (SAB) on Cement Kiln Recycling at the request of the Cement Kin Recycling Coalition (CKRC). This report, its conclusions and recommendations are made without consideration of the Boiler and Industrial Furnace Regulations ("BIF" rule) or the adequacy of BIF rule to address these recommendations.
Background on SAB
The SAB was established in May of 1991 to serve as an independent scientific resource available to any organization interested in cement kiln recycling. Overall, the SAB provides analyses and interpretations of data that enable the cement industry to make informed science- based decisions toward developing and implementing responsible practices in the use of WDF in cement kilns. Currently the SAB is studying various issues related to the use of WDF in cement kilns, including: process technology (which the present report addresses), public health impact, worker health and safety, and product safety.
SAB Guiding Principles
In general, the SAB believes that:
1) industry should reduce all pollutant emissions, where technology allows, to the greatest extent possible, in order to minimize overall stress on the ecosystem;
2) the decisions aimed at managing impact on the ecosystem should be science-based and driven by rigorous study, interpretation and analysis;
3) industry can be successful with new endeavors if openness prevails between industry and the public, and if industry continually demonstrates its use of the best practicable technology to ensure that environmental integrity and public safety are maintained:

June 1993 Page 2 1; ~ -
4) in order to maintain the option of using WDF in cement kilns, the industry, in keeping with its own published code of conduct, should develop, implement, and periodically review methods for minimizing (to the maximum extent practicable) the emissions from its facilities;
5) considering the multiplicity of cement kiln designs, waste derived fuels and potential injection locations, the cement industry should establish its own guidelines regarding the replacement of coal by WDF; (without such guidelines, the database for combustion efficiency and emissions needs to be established for each new injection mode, including kilnlwaste type and location);
6) guidelines should smss the need to control emissions of all pollutants and set goals which are technology-driven rather than regulation-based; and
7) the ownerloperators should maintain an open dialogue with local communities, regional and/or national regulators, and other related indusmes, regarding efforts aimed at enhancing the safe and environmentally sound destruction of WDF in cement kilns.

I June 1993 Page 3
CHAPTER 1 USE OF WASTE-DERIVED FUELS IN CEMENT KILNS
This report focuses on organic and metal emissions from cement kilns using waste-derived fuels (WDF). The objective of this study is to address pertinent scientific issues regarding the recycling of hazardous waste in cement kilns, analyze the scientific implications, and provide a basis for recommendations regarding improved kiln performance with respect to organic and metal emissions. This document reports pertinent scientific issues regarding usage of hazardous waste in cement kilns, results and scientific implications of the SAB study, and SAB's overall position based on these technical findings.
1.1 Advantages of the Use of Waste-Derived Fuels in Cement Kilns
The combustion of WDF in cement kilns offers a practicable alternative to disposal or incineration of certain waste streams. Some of the notable advantages of using WDF in cement kilns include:
1) Long residence times and high temperatures maximize the combustion efficiency for WDF inwduced downstream from the raw-meal feed end of the kiln.
2) Process upsets that can result in emission of combustion by-products are minimized by the stable operating conditions needed to make high-quality cement.
3) Chlorine compounds generated by combustion of WDF are subject to capture by the alkali dust
4) Certain volatile metal compounds (e.g. As) react with high alkali content clinker, forming immobilized products.
5) Volatile metal compounds readily condense on the solids in the kiln gases because the high concentration of solids provides a large surface area.
6) The emission rate of volatile metal compounds from the main stack is reduced through the mixing of dust from the kiln with the new material in the preheater. In

June 1993 Page 4
effect, volatile metal compounds are diluted before reaching the main particulate control device.
7) Through the replacement of coal or other fuels by WDF, consumption of nonrenewable fossil fuel is substantially reduced.
1.2 Scientific Issues
Waste-derived fuels are increasingly replacing coal and other fossil fuels in cement kilns. A number of mal bums have recently been completed to determine whether cement kilns firing WDF can be operated in compliance with the federal regulations governing the buming of wastes in indusmal boilers and furnaces. This report examines these and other data and develops a theoretical framework for addressing key issues related to WDF usage in cement kilns. The following issues are evaluated in this report:
Are kiln temperatures and oxygen concentrations sufficient for complete destruction of liquid or solid hazardous wastederived fuel?
How does post-kiln processing of kiln off-gases and hydrocarbons in the raw meal affect pollutant emissions?
Can carbon monoxide or total hydrocarbons be used as continuously monitored surrogates of emissions of organic pollutants?
Can sulfur hexaflouride be used alone or in combination with another surrogate as an indicator of kiln performance?
Which metal compounds are most prevalent in the exhaust streams from the cement process, with and without waste firing?
What are the major pathways for the emission of metal compounds?
How are inputs and emissions of metal compound correlated? In particular, are the metal compound stack emissions proportional to metal compound input?
How do the type and composition of waste fuel affect overall metal compound emissions?
How do stack emissions vary with waste feed location?
What changes in the design or operation of kilns can further reduce emissions?

June 1993 Page 5
1.3 Summary Conclusions
Research completed to date suggests that the use of waste as a substitute fuel in cement kilns is fundamentally sound in theory, and in a number of cases, has been demonstrated sound in practice. Data suggest that, in addition to complying with the promulgated federal standards, the cement industry can introduce control processes and practices, over time, enabling cement plants to substitute WDF for fossil fuels without increasing ~ollutant emissions bv measurable amounts. -. Based on both available data and combustion engineering theory, the substitution of fossil fuels with WDF in cement kilns is a practicable long-term goal.
Recently the industry has developed other methods of adding WDF to cement kilns and continues to investigate other injection technologies. But the analyses, conclusions and recommendations in this report are limited to cement kilns which atomize liquid WDF at the discharge end of the kiln and the addition of containerized, non-pumpable solid WDF into the calcining zone (mid-process) or pre-heat zone.
However, several questions remain concerning the safe usage of solid or liquid hazardous waste in cement kilns. These include the following:
1) Gas-phase products of containerized WDF injected at the feed end of preheated precalciner systems or mid-kiln for long kilns are not.subjected to the same elevated temperatures and long residence times as those wastes injected at the discharge or hot end. In a worst-case scenario, volatile compounds may be released from the container so rapidly that they are. not able to mix with oxygen and ignite before they cool below a critical iemperature forming hazardous products of incomplete combustion (PICs).
2) If the raw materials contain high levels of hydrocarbons, main stack emissions of hydrocarbons may be dominated by volatilization/pyrolysis before the raw material enters the high temperature regions of the kiln. The chlorination of these hydrocarbons are a potential source of chlorinated hydrocarbon (CHC) emissions.
3) In general, the air emissions of metal compounds, with the exception of mercury, are considerably less than one percent of the input to the kiln system in the raw material, fuel, and WDF. Mercury emissions are variable and often represent a substantial percentage of the input to the kiln. The current CKRC practice of limiting the concentration of mercury in WDF should be maintained so that it does not add appreciably to that in the fossil fuel and raw material.
4) Metal compounds are fed to a kiln in the cement raw material, fuel, and WDF. For most elements, the raw material is the dominant source of compounds in the total feed to a kiln. Coal fuel is the primary source of some metals, including As, Ba, Hg, and Se. WDF may be the major source of other metals, such as Pb, Zn, Cr, Sb, and Cd, it would be useful to have a projection in time of their concentration in waste streams.

June 1993 Page 6
CHAPTER 2 SCIENTIFIC CONCLUSIONS AND
Conclusions and recommendations regarding the usage of WDF in cement kilns are discussed below. These results are based on current data and computational techniques and only apply to the waste addition techniques, combustion conditions, and kiln types addressed in this report.
2.1 Conclusions
2.1.1 Metal Compounds
1) The flows of metal compounds in cement kilns can be categorized into three classes, based on the volatilities of the metals and their salts: 1) metals which are or have compounds that are refractory or nonvolatile, including Ba, Be, Cr, As, Ni, V, AI, Ti, Ca, Fe, Mn, Cu, and Ag; 2) metals that are or have compounds that are of intermediate volatility (semi-volatile) including Sb, Cd, Pb, Se, Zn, K, and Na, and 3) metals that are or have compounds that are volatile, including Hg and Tl.
2) The high alkali content in cement kilns and the scrubbing action of the high solids content favor the high retention of metal compounds in the clinker and collected particulate matter, including the cement kiln dust (CKD). Emissions of refractory metal compounds are generally below 0.1 percent of the input and can be as low as 0.001 percent for the least volatile metal compounds. Emissions of semi-volatile metal compounds,tre generally below 0.5 percent.
3) The data on capture of mercury are highly variable and prone to uncertainty, due to difficulties in analyzing trace concentrations of mercury in solid manices, as well as difficulties in capturing its vapor constituents in stack gases. The major sources of mercury in the data analyzed include: kiln feed, coal, and spikes added to the liquid and solid waste streams. The current industry practice of not burning mercury- containing wastes is prudent and should be continued.

June 1993 Page 7
4) Controlling the emissions from kilns can be achieved 1) most effectively by reducing the total metal input to a kiln, 2) by using air pollution conml devices (APCDs) with high efficiencies and monitoring their performance, 3) by changing the rate of recycle of dust, and 4) to a lesser degree, by conmlling the combustion conditions within a kiln.
5) The amount of metal compound recycle within a kiln through vaporization and condensation is primarily a function of the volatilities of the metal compounds, and to a secondary degree, combustion temperatures in the kiln and total chlorine fed into the kiln. This recycle can lead to concentrations of the volatile trace metals in the cement kiln dust that are considerably higher than those in the clinker. In some cases, the metal compound concentration in the CKD may be several hundred times greater than those in the clinker. The intemal recycling of metals determines their distribution among the various streams exiting the kiln. While refractory metals tend to remain in the clinker, semi-volatile metals tend to be concentrated in the CKD in the by-pass, and volatile metals generally remain in the flue gases exiting the feed end of the kiln or preheater. Thus, control of emissions is achieved by the clinker APCD, by-pass APCD, and main stack APCD for refractory, semi-volatile, and volatile me& compounds, respectively.
6) Fairly complete data on metal compound emissions are available for several kilns. Material balances can be closed for a number of elements. Departure from closure of material balances can be attributed to: transients in the concentration of the feed to a kiln; difficulty of capture of volatile metals; and difficulties in analyzing metals at concentrations often approaching the detection limits. Determination of intemal data consistency by comparison of the emitted and collected dust composition is the preferred method of testing the reliability of data.
7) The location of injection of the WDF has a secondary effect on the distribution of metals between clinker and CKD from the main stack and by-pass duct. Metals distribution is influenced by two factors: 1) the injection of the WDF in suspension (clinker discharge end injection) or into the bed (mid-process introduction), and 2) the reduction in the intensity of the hot zone when the WDF is introduced mid- process rather than at the discharge end.
8) The substitution of wastes for fossil fuels may have several additional impacts on emissions, as described below:
The total metal- compound input changes in a case-specific manner. Differences in input are governed by the compositions of the waste and the fuel that it replaces. These differences can result in either increases or decreases in the total metal input to a kiln. The difference for many elements is small, since the major source of the input of most metal compounds is the kiln feed. The unspiked liquid and solid WDF, on a case-specific basis, contributes substantially to the metal compound input for select elements, including Cd, Cr, Pb, and Zn. Coal is a major source of certain elements,

June 1993 Page 8
most notably beryllium, and mercury. Therefore, the substitution of waste decreases the input of these metals. However, additional data on metal emissions are necessary to comprehensively characterize the impact of varying metal inputs on total emissions.
When waste is injected mid-process (into the calcining zone), metal compound volatility may decrease due to the decreased peak temperature, residence time, and entrainment which results from decreased gas velocity in the discharge zone.
2.1.2 Organics
1) There is a considerable quantity of data that indicate that cement kilns can destroy any organic compound fed as an atomized liquid to the clinker discharge end of the kiln with an efficiency of greater than 99.9999 percent, regardless of its stability. This efficiency level is theoretically reasonable due to the high temperatures and long gas-phase residence times of kilns. The extreme combustion conditions in kilns readily overcome any deficiencies in oxygen concenhations
2) Limited experimental data suggest that stable compounds are destroyed efficiently when fed as solids te at mid-kiln in long, wet-process kilns. Emissions data for one precalciner-type, dry-process kiln show >99.99% destruction removal efficiency @RE) for stable POHCs. Only preliminary data were available at the time of this study for feed-end introduction of solids in a preheater type, dry-process kiln. Additional results are being generated and need to be analyzed to establish statistical significance of the performance of this type of WDF inaoduction to a kiln. Because of uncertainties in gas temperature measurements and the possibly overwhelming effects of local heating or cooling of volatilized waste gases, a priori establishment of a minimum kiln temperature is likely to have little impact in ensuring acceptable waste destruction efficiency.
3) Data on emissions of PICs for cement kilns indicate that overall emissions are no greater than for other types of combustion sources. When burning WDF in some dry-process kilns, chlorinated hydrocarbon emissions in the by-pass stack may increase slightly; however, this increase appears to be offset by a reduction in main stack hydrocarbon emissions.
4) Total PCDDlPCDF emissions for cement kilns vary from the low-end of that observed for hazardous waste incinerators (viz.,<O.l-Ing/dscm of FCDD) to near the high-end of that observed for municipal solid waste incinerators (viz., 500-1000 ng/ dscm of PCDD). The available data suggest that the completeness of combustion and neither the type of cement kiln nor the form of the waste derived fuel have the major influence on PCDDPCDF emissions. However, because of the potential for less efficient burnout of hydrocarbons for mid-process feed of WDF, special attention should be paid to combustion conditions in kilns burning solid WDF. It is

June 1993 Page 9
not possible to determine from available data whether PCDDKDFs are formed in the kiln or in down-stream cool zones. It is also unclear whether specific chlorinated precursors present in the waste feed are involved in the formation reactions.
5) Evidence was found for formation of chlorinated aromatic compounds in the preheater and/or precalciner sections of dry-process kilns. Stack concentrations of chlorinated aromatic compounds were correlated to chlorine content of the WDF. The formation of these compounds is attributed to surfacecatalyzed chlorination of hydrocarbons in the raw-meal feed. A similar mechanism may be responsible for PCDDPCDF formation.
6) Carbon monoxide (CO) and total hydrocarbon (THC) emissions from the heating of raw meal containing significant hydrocarbons can be much greater than CO and THC generated during combustion. Because the process baseline is large and variable, monitoring CO or THC in the main stack as a surrogate for PICs from WDF combustion does not appear feasible. Monitoring THC in the by-pass stack of dry-process kilns prevents interference of THC released from the raw meal; however, monitoring of THC in the by-pass would not be representative of PICs formed in the preheater and/or precalciner.
7) Sulfur hexafluoride (SF6) can be an appropriate, stand-alone surrogate for POHC DRE because it appears to be more stable than any known organic compound under both oxidative and pyrolytic conditions. However, as the destruction rate of SF6 depends on neither oxygen concentration nor degree of fueVair mixing, it is not an appropriate stand-alone surrogate for PICs since they are formed in far greater yields in oxygen-deficient environments.
8) Under limited, wellcontrolled conditions, the concentrations of THC and O2 are inversely related. Because conditions can vary more widely under typical operating scenarios, O2 is not a good stand-alone surrogate for PIC emissions. However, both SF6 and @ may be appropriate continuously-monitored surrogate species that can be used to monitor PIC emissions.
9) It may be possible to control PIC emissions through adjustment of conditions in the preheaterlprecalciner zones (and by-pass stack in dry-process kilns), such that no increase in emissions is observed whdn WDF is bum&.-

June 1993 Page 10
2.2 Recommendations
2.2.3 Metal Compounds
1) The goal of minimizing air emissions of metal compounds from cement kilns should be constantly pursued through several measures:
a) Reduce the metal compound content of WDF. Metal content of waste is important relative to normal inputs of metals (with kiln feed and fuels) for only a few metals, on a case-specific basis. For those elements, such as Pb, Cr, Cd, and Zn, for which the waste streams have been found to contribute appreciably to the total kiln input, it would be useful to have a projection in time of their concentrations in waste streams.
b) Increase the performance of the APCD on the stream responsible for the emissions of potentially hazardous compounds and the use of the wastage of dust from the by-pass duct as a means of controlling metal compound emissions.
c) Increase the metal compound retention in the clinker through process optimization.
d) Where appropriate, evaluate the feasibility of adding sorbents to capture volatile metal compounds. For example, kaolinite effectively reacts with lead and cadmium compounds, while activated carbon has .been used to capture mercury.
2) The data base on the fractional release of the metal com~ounds from kilns should be expanded, particularly with regard to the data consistency through comparisons of emitted and collected dust commsition. Additional data collected under both normal and compliance test conditions are needed. Since most metals are present in the raw material, the need for spiking should be evaluated critically by a comparison of baseline data with data obtained using added metal compounds.
3) An improved understanding of the effect of process conditions on emissions is needed in order to implement l(b) and l(c) above. There is only fragmentary, and sometimes conflicting information, on the effects of: 1) chlorine content, 2) location of waste injection, and 3) the operation of the by-pass duct on the cycling of metal compounds in kilns. .
4) The development and validation of process models should be pursued. These can: 1) guide the development of process design and operation which reduce emissions, and 2) develop test protocols that reduce the amount of data that need be gathered in compliance tests.

June 1993 Page 11
2.2.4 Organics
1) Burning of liquid wastes fed to the clinker discharge end of the kiln should be continued at properly operated and permitted cement kilns. Specification of minimum~wmbustion conditions does not appear necessary, since all cement kilns implement an ample margin of safety in their normal operating conditions.
2) Additional performance data pertaining to the combustion of solid waste i n d u c e d at the raw material feed end or mid-kiln should be analyzed. These data should be used to pmvide specifications and controls on kiln oxygen concentration, waste BTU content, and waste charging rate. Specific research is recommended in the following areas:
Identification and yield of products formed with specific emphasis on the effect of waste chemical composition, combustibility, and volatility of components; and
The use of micro-encapsulated SF6 as a non-toxic tracer to determine the time-temperature history of solids fed to the kiln.
3) Bener characterization of organic compounds released by volatilization or pyrolysis of the raw meal in the preheaterlprecalciner, and the equivalent zones in long kilns, is needed for cases in which high-hydrocarbon raw material is used. Additional research needs include:
Bench-scale studies of the identity and rate of release of individual components, and.
Characterization of the total organic emissions as THC.
4) The potential for both pollutant destruction and formation in 'the preheaterl precalciner zones should be better characterized. The reaction between the chlorine and hydrogen chloride produced in the hot zone destruction of wastes with organic compounds emitted by the volatilization/pyrolysis of kiln feed can, in principle, also occur in long kilns, although the reactions are more difficult to isolate in the case of the long kiln. Specific research needs pertaining to the potential for chlorination in the preheater sections of all kiln systems include:
Experimental studies of the gas-phase chlorination rates of organic species in preheater sections;
Experimental studies of the role of surface catalyzed chlorination of organic species with specific emphasis on the role of calcium and magnesium as catalysts; and
Determination of the timeltemperature/oxygen-concentration requirements for POHC destruction in a heterogeneous, C02-rich environment.

June 1993 Page 12
5) SF6 serves as a potentially useful surrogate, since its destruction efficiency provides a measure of the temperature history from the point of injection to the point of sampling. SF6 may be used to ensure that wastes i n d u c e d at different locations in the cement processing operation are subjected to temperatures required for effective destruction. In addition, SF6 can be used to ensure that the required POHC DRE is attained. However, SF6 does not provide an indication of starved air conditions that could result in the emission of PICs. A measure of the adequacy of the oxygen supply within the clinker discharge zone of the kiln should be developed either by researching additional surrogates or by monitoring process parameters that would ensure adequate oxygen concentration and mixing intensity within the kiln. One option which warrants further research is the combination of monitoring oxygen to ensure oxygen availability and spiking with SF6 to ensure an adequate temperature.
6) The cement kiln industry can achieve a goal of no substantive increase in emissions when burning hazardous wastes without major process modifications. Approaches that may be pursued include:
Upgrade of thermal destruction conditions in the preheaterlprecalciner and by-pass zones (or their equivalent in long kilns);
Addition of existing in-line control technologies or development of new technologies to augment the control already naturally occurring in the preheater and precalciner zones (or their equivalent in long kilns);
Development of general good combustion practices and procedures to assure all guidelines for optimum combustion are routinely met.
June 1993 Page 13
CHAPTER 3 PROCESS DESCRIPTION AND
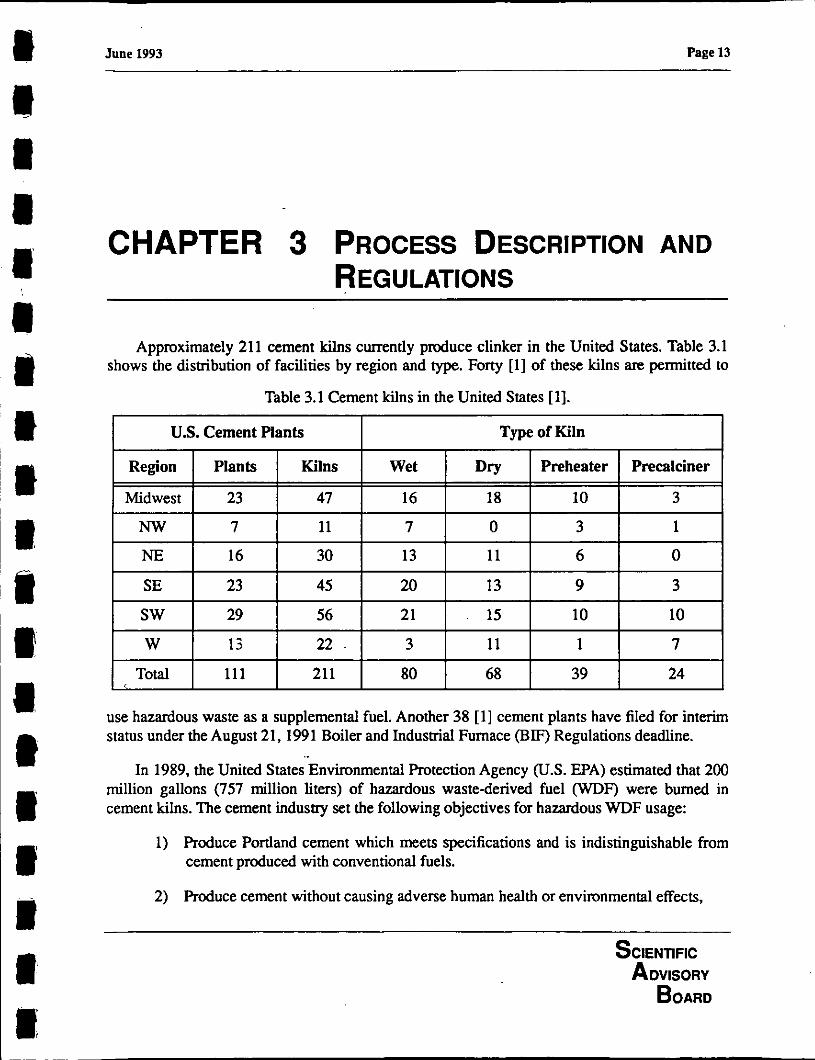
Approximately 211 cement kilns currently produce clinker in the United States. Table 3.1 shows the distribution of facilities by region and type. Forty [l] of these kilns are permitted to
Table 3.1 Cement kilns in the United States [I].
use hazardous waste as a supplemental fuel. Another 38 [ l ] cement plants have filed for interim status under the August 21, 1991 Boiler and Industrial Furnace (BIF) Regulations deadline.
In 1989, the United States Environmental Protection Agency (U.S. EPA) estimated that 200 million gallons (757 million liters) of hazardous waste-derived fuel (WDF) were burned in cement kilns. The cement industry set the following objectives for hazardous WDF usage:
1) Produce Portland cement which meets specifications and is indistinguishable from cement produced with conventional fuels.
2) Produce cement without causing adverse human health or environmental effects,

June 1993 Page 14
3) Destroy hazardous waste while conserving conventional fossil fuel.
4) Lower production costs by burning hazardous WDF rather than fossil fuel.
A stringent criterion for accepting WDF is to meet the chemical and physical specifications of Portland cement
A brief discussion follows describing major cement manufacturing processes, the thermal history of gases and solids in these processes, and federal regulations governing the use of WDF in cement kilns.
3.1 Raw Material
Cement manufacture involves heating limestone, clay, andlor shale, to approximately 2,700°F (1,755 K) to form clinker. The proponion of limestone to clay is typically 3 to 1 for common cement. These raw materials often contain metals and halogens, including: antimony, arsenic, barium, beryllium, cadmium, chromium, lead, mercury, nickel, selenium, silver, thallium, vanadium, zinc, bromine, chlorine, fluorine, and iodine. Raw material can also contain organic compounds. The U.S. EPA [2] investigated the quantity of organic compounds in raw materials used for cement production, and found the largest quantities were in shale. Although aromatics were found, the majority of organic compounds were alkanes (9 to 16 carbons).
Portland cement is manufactured from oxides of calcium, silica, alumina and iron, provided by raw materials such as: limestone, clay, shale, or cement rock. Prior to mixing, materials are crushed in gyratories, jaw crushers, impact crushers, or toothed rolls, depending on the nature of the material. After grinding, the raw material is either: 1) dried to less than 1 percent moisture and ground to a fine powder, or 2) mixed with water to produce a sluny. Both dry and wet processes are widely used in the United States.
3.2 Types of Cement Production Processes
The process of heating raw material to form clinker occurs in cement kilns. A cement kiln is a large, inclined, rotating, cylindrical furnace with diameter of 10 to 25 feet (3.50 - 7.62 meters), and length of 180 to 760 feet (55 - 232 meters). Raw material is fed into the upper, cooler end of kilns. Fuel can be introduced into the lower (clinker discharge end), mid, or upper (raw material feed) end of kilns. Normally, a majority of the fuel is introduced in the lower end. As raw material is heated, it undergoes drying and pyroprocessing reactions. The three major stages in cement pyroprocessing are shown in Table 3.2. After being cooled, clinker exits the kiln and is ground with gypsum into a fine powder cement, which is then used by concrete makers, masons, etc..
3.2.1 Wet Process
Raw material is ground from an original size of 2 to 2.5 inches (5.08 - 6.35 cm) to a powder, with 75 to 90 percent passing through a 200-mesh sieve. Water is added to the raw

June 1993 Page 15
Table 3.2 Major stages in cement thermal processing [6].
material, forming slurry (water content 30 and 34 percent), which is then fed into holding tanks and eventually into rotary kilns. Wet-process kilns (or long-wet kilns) use chains, hung inside the kiln near the feed end, to improve heat transfer (typically, about 100 tons of chain for a kiln producing 1000 tons of clinker/day). Water and volatile organic compounds present in sluny are evaporated in the chain (drying) zone and exit the system via combustion gases. The dried raw material travels further down the kiln and is converted directly into clinker. The fraction of material volatilized in the burning zone travels with combustion gases and condenses in the chain zone, thus setting up an internal recycle loop. The cement kiln dust (CKD) that remains in the exhaust gas is conveyed to the air pollution conml equipment. Some of the CKD can be recycled to the kiln, the remainder is managed on site. The clinker exits the kiln, is cooled, ground, and mixed with gypsum to form cement.
Zone
Drying and Preheating
Calcining
Burning
3.2.2 Dry Process
The crushing mills for the dry process are essentially the same as for the wet process. In the dry process, raw material is crushed, pulverized and fed to the kiln or preheater as a powdered or granular material. An efficient dry-process kiln will consume about 60 percent
Temperature
70 - 1100 OF (294 - 866 K)
1100 - 1650 OF (866 - 1172 K)
2200 - 2700 O F
(1277 - 1755 K)
Characteristic
Evaporation of water.
Evolution of combined water in the argillaceous components.
Calcination of calcium carbonate to calcium oxide.
Reaction of calcium oxide with silica to form dicalcium silicate.
Reaction of calcium oxide with oxides of aluminum and iron to form a liquid phase.
Foxmation of the clinker.
Evaporation,of volatiles (e.g., sodium, potassium, chlorides, and sulfates).
Reaction of excess calcium oxide with dicalcium silicate to form mcalcium silicate.

June 1993 Page 16
of the energy required to produce a ton (907.2 kg) of cement in a typical wet-process kiln (see Table 3.3). A drawback for a dry-process system is the difficulty in attaining the same
Table 3.3 Typical energy requirements for the wet and dry cement processes.
degree of homogenization of the raw feed material as in a wet kiln. Dry kilns may be long, preheater, or preheater/precalciner kilns.
Process Type
Wet
Dry
3.2.3 Semi-dry Process
Required Energy (GJlton of clinker)
5 - 6
3.6 - 4.5
In the semi-dry process, the raw materials is slunied as in a wet process; however, the slurry is dried into a moist cake or pellet before being fed into the kiln. Semi-dry kilns are Lepol-type designs.
3.3 Characteristics of a Cement Kiln
A critical question is whether the conditions in the cement kiln are sufficient for the destruction of hazardous wastes. The following sections briefly discuss the major process characteristics of cement kilns and their applicability as a device for the eeament of hazardous waste. A sample mass balance for a 60 tonhour (54,431 kglhr) dry-process cement kiln using 50 percent wastederived fuel is shown in Table 3.4. Gas temperatures inside the kiln can reach
Table 3.4 Sample material balance forcement processing[4].
3500°F (2200 K) and solids in excess of 2600°F (1700 K).
Constituent
Raw Material .
Clinker
coavcoke 7
Waste Fuel
CKD
Combustion Products
Throughput (tonslhr)l(kg/hr)
100/90,718
60154.431
514,535
514,535
514,535
45P0.7 18

June 1993 Page 17
Weitzman [S] calculated a cumulative gas residence time at different temperatures for a dry- process cement kiln (see Figure 3.1). As shown, the gas in a cement kiln is greater than 2200°F
Figure 3.1 Cumulative gas residence time versus temperature for a dry-process cement kiln.
(1477 K) for approximately 3 seconds. These calculated conditions, in addition to an average oxygen concentration of 1.7 percent, are favorable for destruction of both halogenated and nonhalogenated compounds. Basic descriptions of three major kiln processes used in the production of cement follow.
Figure 3.2 shows a process flow diagram for a typical wet-process kiln. General operational specifications, solids feed rates, gas flow rates, and major process temperatures are also listed. The solid hazardous waste is introduced on top of the hot bed at approximately 210 feet (64 meters) from the solids exit end of the kiln. As shown, the solids travel towards the clinker discharge end and the evolving gases travel to the raw material feed end. In addition to solid hazardous waste usage, liquid hazardous waste can be i n d u c e d with coal at the clinker discharge end. Combinations of all fuels introduced into the system add up to approximately 10 tonsthr (9,071.9 kg/hr) for the facility shown (solid hazardous waste typically has a heating value about 50 percent that of coal whereas liquid hazardous waste has a value approximately equal to that of coal).

June 1993 Page 18 1

June 1993 Page 19
Figure 3.3 shows typical gas and solids temperatures and gas velocities as a function of kiln length for a wet process. These profiles represent cement manufacture without the addition of hazardous waste.
Figure 3.4 shows typical gas and solids temperatures for a dry process.
3.3.3 Dry-process with re heater Figure 3.5 shows a process flow diagram of a dry-process kiln with a preheater.
General operational specifications, solids feed rates, gas flow rates, and major process temperatures are also listed. Solid hazardous waste is introduced at the raw material feed end of the kiln. As shown, the solids travel towards the clinker discharge end and the evolving gases travel towards the raw material feed end of the kiln. In addition to solid hazardous waste usage, liquid hazardous waste can be introduced at the burner end. As stated before, combinations of all fuels introduced into the system add up to approximately 10 tons/hr (9,071.9 k g h ) for the facility shown.
Figure 3.6 shows typical gadsolids temperatures and gas velocities for a preheater system as a function of kiln length. Thermal profiles for the preheater assembly are also included.
3.3.4 Dry Process with Preheater and Precalciner
Further advancement in cement kiln technology is the addition of a preheated precalciner onto the existing process. In precalciner kilns, an additional combustion vessel is added at the bottom of the.preheater tower to further heat the raw material prior to introduction to the kiln. Lower grade fuels can be used in the precalciner due to the lower calcination temperature requirements. Typical systems use approximately 30 to 60 percent of the kiln fuel in the precalciner to release up to 95 percent of the C02 from the raw material prior to introduction into the kiln. The capital cost of both preheaters and precalciners is high and electrical energy requirements are increased. Electrostatic precipitators and baghouses are used to collect materials entrained in the exhaust gases. In new systems, all of the captured solid material is returned as feed. This closed loop necessitates the installation of an alternative system for removing volatile salts. Commonly known as alkali by-pass systems, they remove gases from the kiln at the point prior to condensation of the volatile materials onto the surfaces of the feed. If the alkali salts accumulate beyond approximately 1 to 2 percent in the preheater, material begins to buildup and operating problems will occur. Upon removal from the kiln, the by-pass gas is then quenched using ambient air and water sprays, followed by removal of entrained particles using a separate electrostatic precipitator and baghouse. Systems without by-pass equipment are severely limited with respect to concentration of alkali metals, chlorides, and sulfur that can be tolerated in the raw material and fuel.

June 1993 Page 20 I
Length (feet)
-
r.00 . I&UI - i : 12m -
1000.
.m .
.w - ' O D -
I ( .
Figure 3.3 Typical gas (dashed line)/solids (solid line) temperature and gas velocities for a long wet-process cement kiln [6,7].
1 I L
, I
- - - - _ - - - , __-e . , . , , . '
.'8 ---- :
. 11m - 1 I U
. 2 L ) D I ? . I IM -
- 11)o
_ 1.""
. 10,"
. rm
. I,"
20 (18 b iu 160 oiu l i u i l u 8 4 0 260 110 210 ibo ilr ids i!u >Lo ,la rdo '10 640 &Lo rUI do ,lo ,do r, 10 ru u rd 6 ro 20 u ro urn t r o fiu i l n , l o #kt ria .

I June 1993 Page 21
Figure 3.4 Dry-process material (solid line) and gas temperatures (dashed line) [6].

June 1993 Page 22

June 1993 Page 23
Transition to Preheater
Length (feet)
Figure 3.6 Typical gas (dashed line)/solids (solid line) temperature and gas velocities for a preheater cement kiln [6,7].

June 1993 Page 24
Figure 3.7 shows a process flow diagram of a dry-process kiln with a preheater and precalciner. Operation of this type of cement kiln is very similar to that of a preheater kiln with the exception of the precalciner combustion zone. The total firing rates are approximately equal to those in a preheater with the exception of the location of where the fuel is introduced into the system. The overall thermal environments in the preheater kilns. with and without a precalciner, are reportedly very similar, however, the time at which the gas temperature is above 1650°F (900 OC) is slightly less in a precalciner-type kiln. Under the same conditions this may be significant for hydrocarbon destruction.
Figure 3.8 shows typical gas and material temperatures for a precalciner system as a function of kiln length. Thermal profiles for the preheaterlprecalciner assembly are also included.
3.4 Cement Kiln Dust
The counterllow combustion gases in the cement kiln entrain some of the raw material. These particulates are canied out of the kiln in the hot gases and transferred to the air pollution control device where the majority ark collected. These collected solids are referred to as cement kiln dust (CKD).
CKD can be returned to the kiln with the raw material; however, most processes waste the CKD in order to lower the buildup of alkali salts (which can disrupt operating conditions if the concentrations get to high). CKD can be used in other industries as neutralizers or additives. Typically the CKD is not utilized and is landfilled.
3.5 BIF Regulations
Currently, boilers, industrial furnaces, and cement kilns which bum hazardous waste must comply with the standards found in the final promulgated BIF rules published by the EPA on February 21,1991 (as amended) 181. An overview of the BIF rules, as applied to the cement kilns burning hazardous waste, are discussed in the following sections.
3.5.1 Organic Compounds
This section describes several BIF standards that are directly applicable to the destruction of organic compounds within a cement kiln burning waste. Sources for organic compounds include both the primary fuel (e.g., coal) and the waste-derived fuels. In addition, a significant amount of organic material is volatilized from the raw material fed to the kiln.
POHC Destruction
The Desnucrwn and Removal Efjiciency (DRE) Standard - Principal organic hazardous constituents (POHC's) as listed in 40 CFR part 261 Appendix VIII must be

I June 1993 Page 25

June 1993 Page 26 I
Figure 3.8 Typical gas (dashed line) and solids (solid line) temperature for a preheated precalciner cement kiln [6].

June 1993 Page 27
destroyed to a level of 99.99 percent. The level of 'four nines' reflects a destruction and removal efficiency at which the regulatory agency has indicated that the subsequent emissions will not pose a significant health risk. As an example of a DRE of 99.99 percent, for 100 lbs of initial material, less than 0.2 ounces could be emitted.
Dioxin-listed wastes must be destroyed to a level of 99.9999 percent. The level of 'six nines' can be exemplified by considering 10,000 lbs of initial material. In this case, less than 0.2 ounces of the original 10,000 lbs could be emitted.
The DRE requirements can be ovemdden during the permit process if it appears that a high-risk scenario may exist. Permit officials may use the omnibus permit authority of section 3005(c)(3) of the Resource Conservation and Recovery Act (RCRA) codified to develop permit requirements, as necessary, to protect human health.
Although the DRE standard is intended to insure the adequate destruction of POHC's in a cement kiln, there may be a significant amount of products of incomplete combustion (PICs) present if good combustion conditions do not exist. To insure proper operation of the cement kiln, either of the two following standards must be maintained:
CO Standurd - Carbon monoxide stack gas concentration from a facility burning waste cannot exceed 100 ppmv (corrected to 7 percent 02) on a rolling hourly average basis for cases when HC monitoring is not desired or needed. Compliance to this standard is monitored by continuous stack gas analysis.
Alternative CO Standard - Stack gas concentration of carbon monoxide from a facility burning hazardous waste may exceed the 100 ppmv limit provided that stack gas hydrocarbon (HC) concentrations do not exceed 20 ppmv - with one exception. Facilities not capable of meeting the 20 ppmv limit because of organic matter in normal raw material (valid for cement kilns), may establish an alternative HC limit as approved on a case-bycase basis. Cement kilns equipped with a by-pass duct meeting the requirements previously outlined are not eligible for the alternative HC limit. Compliance to this standard is accomplished by continuous stack gas analysis monitoring.
. . and F u
In addition to the DRE of 99.9999 percent for dioxins and furans mentioned above, facilities equipped with dry particulate matter control devices operating within the temperature range of 450 - 750°F (505 - 672 K), and operating under the alternative hydrocarbon limit regulation, have an additional requirement relating to dioxinlfuran emissions. The facility must conduct a site-specific risk assessment to

June 1993 Page 28
demonstrate that dioxinlfuran emissions do not result in an increase in lifetime cancer risk to the hypothetical maximum exposed individual (MEI) exceeding 1 in 100,000. Note that this requirement also applies to facilities.
3.5.2 Metal Compounds
Unlike the organic compounds, metal compounds introduced into a cement kiln will not undergo destruction; therefore, the regulations governing metal compounds are concerned more with the distribution of the metal compounds between the various ways of exiting the cement kiln, in particular, the amount of certain toxic metals that might be emitted from any of the exhaust stacks.
There are twelve toxic metals which have been identified as posing a hazard to human health. They are: 1) antimony, 2) arsenic*, 3) barium. 4) beryllium*, 5) cadmium*, 6) hexavalent chromium*. 7) lead, 8) mercury, 9) nickel*, 10) selenium, 11) silver, and 12) thallium. Five of these metals (or their compounds), noted by asterisks, are known or suspected carcinogens.
Emission limits for 10 of these toxic metals listed in Appendix Vm of 40 CFR pan 261 have been developed using standards found in Table 3.5. Nickel and selenium are not
Table 3.5 Standards for toxic metals. -
included because: 1) limits cannot be established for selenium due to inadequate health data, and 2) nickel is not controlled because the two nickel compounds suspected at this time of being potential human carcinogens, nickel carbonyl and subsulfide, are not likely to be emitted from combustion devices.
Metal Group
Carcinogenic Metals
Noncarcinogenic Metals
Lead
The standards described in Table 3.5 are implemented through a three-tiered approach, and a brief description of these tiers will be given below. Compliance with any tier is acceptable, and the tiers are constructed such to allow higher emission rates (and feed rates) if the owner or operator elects to conduct more site-specific testing and analyses. Regardless of which tier is selected, however, a ratio must be taken of the ambient air
Effected Metals
Arsenic, Beryllium, Cadmium, and hexava-
lent Chromium
Antimony, Barium, Mercury, Silver, Thal-
lium
Lead
Criteria
Limit lifetime cancer risk to the maximum exposed individual (MEI) maximum of 1 in 100,000.
Based on Reference Doses 0 s ) below which adverse health effects have not been observed.
National Ambient Air Quality Standard (NAAQS).

June 1993 Page 29
concentrations to the risk specific dose (RSD) for each toxic metal and then all of these ratios for all of the toxic metal's must be summed. The sum of these ratios cannot exceed one, thereby insuring that the cumulative risk of all the toxic metals emitted does not exceed the allowable risk to the maximum exposed individual (MEI).
This standard assumes that all of the metals entering the combustion system are emitted out the stack in either vapor or particulate form. Tier 1 is designed for systems which have small amounts of metals in the waste stream. Permit limits are determined by looking up values for each metal in feed rate screening tables (40 CFR part 266 Table 1). Facility metals feed rates are then determined and specified.
Additional operating leeway is provided by giving the facility credit for metals partitioning to the bottom ash or CKD, product, or collection by the air pollution control equipment. Emission screening tables for permitting are the same as those used in Tier 1 (40 CFR part 266 Table 1). Permit limits for metals feed rates are set based on feed rates during the conEormance test and measurements of the partitioning of the metals.
This tier is used by facilities that have a wide variety of metal waste streams. Permit levels are based on emissions testing to determine actual stack emission rates. In addition, site specific dispersion modeling is completed to account for actual dispersion factors. Noncarcinogenic metals cannot exceed the appropriate reference air concentration (RAC). Carcinogenic metals, as with Tiers 1 and 2, sum the ratios of the predicted ambient air concentrations to the risk specific dose (RSD) for each metal (the sum cannot exceed 1). Due to the difficulty of continuous emission monitoring, permit compliance is demonstrated by monitoring feed rates of metals from the feedstreams.
Adiusted Tier 1
A hybrid of Tiers 1 and 3 are completed incorporating dispersion factors for site specific modeling. This approach loosens up the requirements somewhat; however, this method still assumes that all the metal exits the stack.
These regulations apply to both interim status and permitted facilities. Other state and Fedeml regulations (e.g., RCRA) can be applied (the EPA has authorized states to implement RCRA at the state level) thus creating more stringent requirements for facility operators.

June 1993 Page 30
3.5.3 Hydrogen Chloride and Chlorine Gas
The source of chlorine in cement kilns burning waste is due primarily to the waste- derived fuel, and the BIF rule uses a three-tiered regulatory approach to limit HCI and C12 emissions under the same general approach used to control metal emissions. The operator must comply with and implement HCI and C12 controls in the same manner as for metals.
Permit limits are determined for a worst-case scenario by looking up values in feedrate s m n i n g tables (40 CFR part 266 Appendix 11).
The feedstream permit levels are determined by emissions testing and air dispersion modeling such that reference air concentrations for HCI (4.37E-10 lb/ft3, 7 pg/m3) and Clz (2.49E-11 lb/ft3, 0.4 pg/m3) are not exceeded. The feed rates are determined during the compliance testing.
3.5.4 Particulate Matter .
A cement kiln facility burning hazardous waste may not emit more than 0.08 gr/dscf (180 mg/Nm3) c o m t e d to 7 percent 02. However, permit writers can impose lower PM standards (BACT can supercede this requirement if the facility is subject to BACT) where facts warrant, pursuant to the omnibus permit authority in section 3005(C)(3). Compliance to the standard is demonsmite by emissions testing from a compliance test.
In facilities where recycling of PM is practiced, operators must comply with 1 of the 3 followine: 1) dailv monitoring of collected PM to ensure metals levels do not exceed limits .. , . - established (accounting for metal enrichment), 2) daily stack sampling for metals, or 3) conditionine of the device ~ r i o r to com~liance testing to ensure that metals emissions are at equilibrium-with metal feeh rates. It siould be noted the facilities operating under interim status must comply with the PM standard.
3.5.5 Exceptions to BIF Rules
Bevill Amendment
The cement kiln dust (CKD) generated in a cement kiln burning hazardous waste requires special attention because it is a essentially a residue generated from the disposal of hazardous wastes. Under RCRA guidelines, such a residue would be classified as a hazardous waste even though it may not exhibit hazardous characteristics. Under the Bevill Amendment, however, CKD is not classified as a hazardous waste.

June 1993 Page 31
The BIF rule requires that a facility show that either the CKD is not significantly enriched in toxic component when burning hazardous waste, or that the CKD thus generated does not exceed health-based standards. If the CKD fails to comply with both of these conditions, then the dust must be treated as a hazardous waste.
3.5.6 Guidelines for Process Variations
Waste
The EPA considers a hazardous waste to be burned or processed as an "in@ent" if it is used to produce a product. If hazardous waste is fed into a kiln for a purpose other than solely as an ingredient and at any other location than the "hot" end where the product is normally discharged, continuous HC monitoring must be used in accordance with the 20 ppmv or alternative HC limit for furnaces containing organic matter in the raw material irrespective of whether or not stack gas CO concentrations meet the 100 ppmv limit.
If hazardous waste is burned solely as an ingredient (metal concentrations in 40 CFR part 261 Appendix VIII c500 ppm and heating values c 5.000 Btuflb r11.63 M J / kg]), HC monitoring is not automatically required because emissions of nonmetal compounds are not of concern. Metals emissions controls will ensure that metals emissions do not pose a hazard.
If hazardous waste is fed into any industrial furnace during interim status at a location other than the hot product discharge end, combustion gas temperatures must exceed 180C0F (1255 K) at the point of introduction and adequate oxygen must be present to ensure complete combustion of organic constituents in the waste. For long, wet-process kilns, the additional waste is introduced mid-kiln, while a preheated pfecalciner kiln introduces additional waste on the feed shelf.
Cement kilns equipped with a by-pass may comply with CO and HC requirements by monitoring the gases in the by-pass duct as previously outlined provided that: 1) hazardous waste is fired only inside of the kiln and not at any location downstream from the kiln exit relative to gas flow, and 2) by-pass duct diverts a minimum of 10 percent of kiln off-gas. Otherwise, on-line monitoring of CO and HC must be accomplished in the stack.

June 1993 Page 32
CHAPTER 4 METALS
4.1 Summary
Conservation requires that the mass of all metals intrcduced into a cement kiln equal the mass exiting the kiln. The metals may enter with the fuel, raw material, or the waste derived fuel (WDF), and exit with the clinker, the cement kiln dust (CKD), or as an emission from the air pollution control device (APCD). Emissions may be gaseous or solid, depending on the volatility of the metal. A semiempirical model has been developed to rationalize the data base on metals emissions from cement kilns burning WDF. Once the empirical constants have been evaluated for a particular plant, metal emissions from wastes with different metal contents can be predicted.
Motivation
The understanding of the metal circulation in a cement kiln and its distribution between the clinker and the dust to the air pollution control devices (APCDs) on the main stack, by-pass duct (if any), and cooler vent can serve several purposes: 1) to extrapolate measurements from compliance tests to actual operation [concentration'of metal compounds can vary from the values in the tests which are artificially increased using spikes and detuned APCDs to represent a worst case scenario]; 2) to control emissions by redistributing elements between the different streams; 3) to optimize the selection of APCD equipment for a new or refurbished plant; and 4) to use the models to design protocols for testing that are more efficient in terms of both providing the information that is needed and in the use of resources.
Metals Behavior in Cement Kilns
CKD is enriched in certain trace metals as compared to clinker. Generally, the refractory metals have lower CKDIclinker concentration ratios than the volatile species. Based on these ratios, it is convenient to classify the metals into h e categories: 1) volatile (Tl, Hg); 2) semi- volatile (Sb. Se, Pb, Cd), and 3) refractory (Cr, Be, Ba, Ni, As, Ag). Metal compounds of different volatility will vaporize and condense along different sections of the kiln, and the process is further complicated by the entrainment and redeposition of particles from and to the bed. A key to modeling metal emissions from kilns is the treatment of the dust. Dust inside a cement kiln provides a mode by which vaporized metal compounds can condense and leave the

June 1993 Page 33
system. The kiln exit gases can cany this dust throughout the precalcinerlpreheater, and eventually to the APCD. Management of this dust in the process provides a means for controlling metal compound emission. Electrostatic precipitators and bag houses are used to trap the dust. The material leaving the stack may contain higher levels of metal compounds due to the internal recycle and enrichment; however, the escape of enriched material is greatly reduced because of the mixing in the preheaters of the recycle dust, air, and the raw materials. Controlling the emissions from kilns can be achieved most effectively by: 1) reducing the total metal input to a kiln; 2) using air pollution control devices with high efficiencies and assuring their performance; 3) changing the rate of recycle of dust, and 4) to a lesser degree, conmlling the combustion conditions within a kiln.
Database Evaluation
Fairly complete data on metal compound emissions are available for several kilns. Material balances can be closed for a number of elements. Departure from closure of material balances can be attributed to transients in the concenhation of the feed to a kiln, the difficulty in capturing volatile metals, and to analytical errors when metal concentrations approach detection limits. Examination of the database indicates:
The impact of WDF on metal emissions is dependent upon the composition of the metal compounds in the waste and in the fuel that it replaces. The total metal input to a kiln can increase or decrease as result of the substitution of WDF for coal. The difference for many elements is small since the major source of the input of most metal compounds is the kiln feed. The unspiked liquid and solid WDF, on a case- specific basis, is found to contribute substantially to the metal compound input for selected elements including cadmium, chromium, lead, and zinc. For certain elements, most notably beryllium, cadmium, and mercury, the coal is the major source and the substitution of waste for the coal, therefore, decreased the input of these metals.
The data on the capture of mercury are highly variable and prone to major uncertainty due to difficulties in analyzing mercury present in trace concentrations in solid matrices, and in capturing its vapor constituents in the stack gases.
The injection location of the WDF has a effect on the dismbution of the metals between the clinker and the CKD from the main stack and by-pass duct. This is a consequence of two factors: (a) the injection of the WDF in suspension (clinker discharge end injection) or into the bed (raw material feed end or mid-kiln introduction), and (b) the reduction in the intensity of the hot zone when the WDF is introduced mid-process rather than at the discharge end.
The scrubbing action of the high enuained-solids loading and the high alkali content in cement kilns favor the high retention of metal compounds in the clinker and collected particulate matter, including the cement kiln dust (CKD). Total emissions of refractory metal compounds are generally below 0.1 percent of the input and can be considerably smaller (as low as 0.001 percent for the least volatile metal compounds). Total emissions of the semi-volatile metal compounds

June 1993
are generally below 0.5 percent. The Boiler and Industrial Furnace (BIF) rules evaluate metal emissions based on a detailed impact/risk assessment on a site-specific basis. Analysis of data from a preheaterlpmalciner kiln show that metals emissions under the trial burn conditions (with the particulate collection equipment detuned) were almost two orders of magnitude below the allowable BIF limits.
4.2 Issues
Metal compounds may be introduced into a cement kiln system with the fossil fuel, raw materials used in the processing of cement, and metal bearing waste. The overall mass balance analysis of the process is based on the requirement that metals must be conserved. Metal compounds entering the system must either accumulate in an internal recycle stream and/or exit in the gas or solids pmcess streams. Figure 4.1 shows a generalized flow diagram of possible metal compound exit streams for a cement process. As shown, metal compounds can leave the system in several streams: namely, the clinker, the cement kiln dust (CKD), particulates, or as particulate matter or gaseous emissions from the air pollution control devices. The particulate emission comes from particles entrained from the stage 1 cyclone, from the by-pass, and from the clinker cooler. Understanding the loss of the metal compounds leaving the APCD therefore requires knowledge of the compositions, mass flow, and the collection efficiencies for the particles in these three streams. A major focus in the following sections is the development of an understanding of the factors that govem the mass flow and composition of particles entrained from cement kilns. Another source of metal emissions is in the vapor phase, which will be shown to be principally of concern for mercury, which will escape complete collection in a conventional APCD. Another path for metal compound escape is fugitive dust emissions generated from normal cement processing and transportation activities (not covered in this repon).
Some of the processes governing the behavior of metal compounds in cement kilns:
Metal compounds may vaporize in the clinker discharge zone and later homogeneously nucleate, condense and agglomerate to form submicron particles in the size range of 0.01 to 0.5 microns. The va~orization of volatile metal species is - dependent on; 1) presence of other mineral species (e.g., silicates), 2) initial form of metal species prior to combustion, 3) presence of other volatile metals (e.g., sodium or potassium), and 4) the. presence of other inorganic species (e.g., chlorine).
Some of the vaporized metal compounds may condense on entrained solids in the kiln or in the preheaterlprecalciner with sizes that will depend upon the local entrainment velocity and these sizes may range up to a millimeter.
Some of the vaporized metal compounds may not condense and therefore escape with the exhaust gases.
A fraction of the metal compounds will react with constituents in the clinker, becoming essentially immobilized.

June 1993 Page 35
Figure 4.1 Example flow diagram for metals exiting a cement kiln.
Reducing metal compounds to nonvolatile, insoluble forms is the desired goal for the safe treatment of waste in cement kilns.
4.3 Theoretical Background
The discussion on volatility is subdivided into a section on the general behavior of metals, followed by a section on the effects of metal compound speciation.

June 1993 Page 36
4.3.1 Volatility of Metals
The melting or boiling points of metal compounds are often used as measures of the volatilities of metals at high temperatures. More fundamental measures of volatility is provided by reviewing vapor pressures as a function of temperature for metals and metal compounds. However, the data are limited and sparse. Both methods of raring the volatility of these species will be used throughout this report.
It is advantageous to group metals species together with those of other metals that demonstrate similar volatilities and behavior in a cement kiln. For this purpose, we have divided metal species into three separate groups according to experimental observation. Grouping these metals does not mean to imply that overlapping of behavior or completely different behavior for a given metaVmetal compound cannot exist. Interactions among all species present in the system play a large role in describing the metals partitioning in cement kilns. Grouping provides an easy way to present data and theoretical trends in a qualitative manner.
Three major classifications of metal compounds in cement kilns are:
highly volatile metal compounds which have the potential of escaping from the system in the vapor phase,
compounds with an intermediate volatility that have a high potential for internal recycle and concentration in the cement kiln dust, and
refractory metal compounds which pass through the system and are incorporated in the matrix of the clinker.
Volatile metals and their compounds are those which may easily vaporize at the conditions experienced in the cement manufacturing process. The two metals that have compounds in the volatile domain are the compounds of mercury and thallium These metal compounds have a potential of escaping the main APCD. Although thallium is less volatile than mercury and may perhaps experience condensation under APCD conditions, it is still volatile enough to be present in the very fine dust fractions which has a higher probability of passing through the APCD.
Figure 4.2 shows log of the vapor pressures versus inverse temperature for the selected volatile metal species. As shown, the volatile metal species achieve appreciable vapor pressures between approximately 470 - 980°F (516 - 800 K). At cement kiln exit temperatures, mercury has a potential of escaping from the system in the vapor phase. As shown, mercury is completely volatile at temperatures for the solids at the exit of the preheater and kiln. On the other hand, thallium will oxidize, condense, and recirculate throughout the system. In order to better characterize their behavior, one therefore needs the oxide vapor pressure and perhaps other species vapor pressures as well.

June 1993 Page 37
Inverse . Tempmratura (1IK)
Figure 4.2 Log vapor pressure (mm, Hg) versus inverse temperature for selected volatile metal/metal compounds species [9].
Metals which have vapor pressures between 0.01 and 1 atmospheres at the exit of the kiln or preheater are classified in the semi-volatile group. Semi-volatile metal compounds (Sb, Se, Pb, Cd) tend to volatilize in the burning zone of the kiln and recondense in the cooler regions and concentrate in the CKD. Again, in order to better characterize their behavior it would be desirable to have the vapor pressures of the chemical species present in the cement kiln or preheater.
These metals can vaporize into the gas stream, condense on particles in the gas stream, or be stabilized within the crystalline mamx of the clinker. Some of the key semi-volatile metals are: 1) selenium, 2) cadmium, 3) lead, 4) antimony, 5) zinc, 6) potassium, and 7) sodium. For the alkali metals, the vapor pressures of their chlorides, one of their probable states, are provided in lieu of those of the metals.
Figure 4.3 shows log of the vapor pressure versus inverse temperature for the selected semi-volatile metal/metal compound species. The results show that these metaumetal compound species achieve appreciable vapor pressures at temperatures that range from that in the preheater to that in the kiln exit One of the most volatile of the species, cadmium, will be completely vaporized by 1184'F (913 K) while the least volatile metal, lead, would

June 1993 Page 38
Inverse Temperalura (1IK)
Figure 4.3 Log vapor pressure (mm, Hg) versus inverse temperature for selected intermediate metals [9].
require a temperature for completed vaporization of over 3074OF (1963 K). The vapor pressures reach significant levels at temperatures between approximately 2100 - 3028°F (1422 - 1937 K). The potential- of the semi-volatile metals remaining inside the system in an internal recycle loop is increased with these rnetdmetal compounds.
Refractory metals and metal oxides are those which do not appear to easily vaporize at conditions experienced in the cement manufacturing process. These elements and their compounds are stable even at the highest temperatures inside the cement kiln. Some of the refractory metals include: 1) chromium, 2) aluminum, 3) vanadium, 4) barium, 5) beryllium, 6) nickel, 7) iron, 8) arsenic, and 9) silver. It is believed that vaporization can be further suppressed because some of the refractory metals can substitute for calcium or silicon in the crystalline lattice of the dicalcium silicate and mcalcium silicate of the clinker. Some, such as arsenic, form acidic oxides which can react with the alkali to form salts such as arsenates. Arsenates are very stable unlike arsenic which is very volatile. These metals participate in the cement mineralogy, form new crystalline compounds, and are stabilized.
Some examples of vapor pressure versus inverse temperature relationships for refractory species are shown in Figure 4.4. Vanadium and beryllium were not included

June 1993 Page 39
Figure 4.4 Log vapor pressure (mm, Hg) versus inverse temperature for selected refractory metals [9].
because of a lack of data. Elemental arsenic was excluded from the graph because the data were in the range of the "volatile" grouping; however, it is the formation of calcium arsenate that renders arsenic refractory. As shown, it can be generally said that refractory species require relatively high temperatures to vaporize. The vapor pressures achieve appreciable levels at temperatures approximately between 2260 - 41 50°F (151 1 - 2561 K). These temperatures approach and exceed the normal operating temperatures found in a cement kiln. Therefore, the probability of these species staying in the solid clinker is quite high.
A couple of notable exceptions of the refracto~y grouping are hexavalent chromium oxide and zinc. Hexavalent chromium oxide decomposes at approximately 400°F (477 K); however, the majority of hexavalent chromium oxide is convened to chromates, which have relatively high melting points. In addition, elemental zinc has a low melting point (similar to lead); but, zinc oxide is stable and has a relatively high melting point causing it to behave as a refractory metal. Relatively large quantities of refractory metals can be added to the cement clinker without destroying the integrity of the material (this topic is not

June 1993 Page 40 rn covered in this section). Again, we see that the interrelationship between elemental metals, metallic compounds, and cement processing conditions plays a critical role in determining the ultimate fate of metals in this environment.
Metal melting and boiling temperatures have been used to help explain the volatile1 semi-volatile/refractory behavior of these species in cement kilns. However, as shown in Table 4.1 exceptions to the rule exist for the selected elements and compounds of interest.
Table 4.1 Melting points for selected metalslmetal oxide species. I
One notable exception found in the selected set shown in Table 4.1 is thallium. Pure thallium has a melting temperature high enough to fit into the refractory group. The vapor pressure figures clearly demonstrate that the quantitative description of partitioning behavior for metal species is far more complicated than simple meltinmiling temperature or vapor pressure dependency.
4.3.2 Effect of Metal Speciation
Figure 4.5 shows vapor pressure versus temperature for chlorides and oxides of selected metals. These results illustrate that chlorides may have higher volatilities than the

I June 1993 Page 41
25W 1667 1250 lo00 833 714
Inverse Temperature ( l i K top. K bottom)
Invarsm Temperature (11K top, K bottom)
Figure 4.5 Log vapor pressure versus inverse temperature for selected chlorides and oxides of the same element [9].

June 1993 Page 42
Inverse Temperature (11K lop. K bottom)
'8
loo0 500 333
Inverse Temperalure (OK lop, K bottom)
Figure 4.5 Con't Log vapor pressure versus inverse temperature for selected chlorides and oxides of the same element [9].

June 1993 Page 43
corresponding oxides, suggesting that vaporization may increase when burning wastes with high chlorine content.
From Figure 4.6,which shows the bonding level of lead and zinc in the clinker as a function of chlorine intake in a cement kiln, it can be seen that.zinc is not affected by the change in chlorine input, whereas there is a significant decrease in the bonding of lead in
Figure 4.6 Bonding level of lead and zinc in clinker versus chlorine intake in cement kiln [lo].
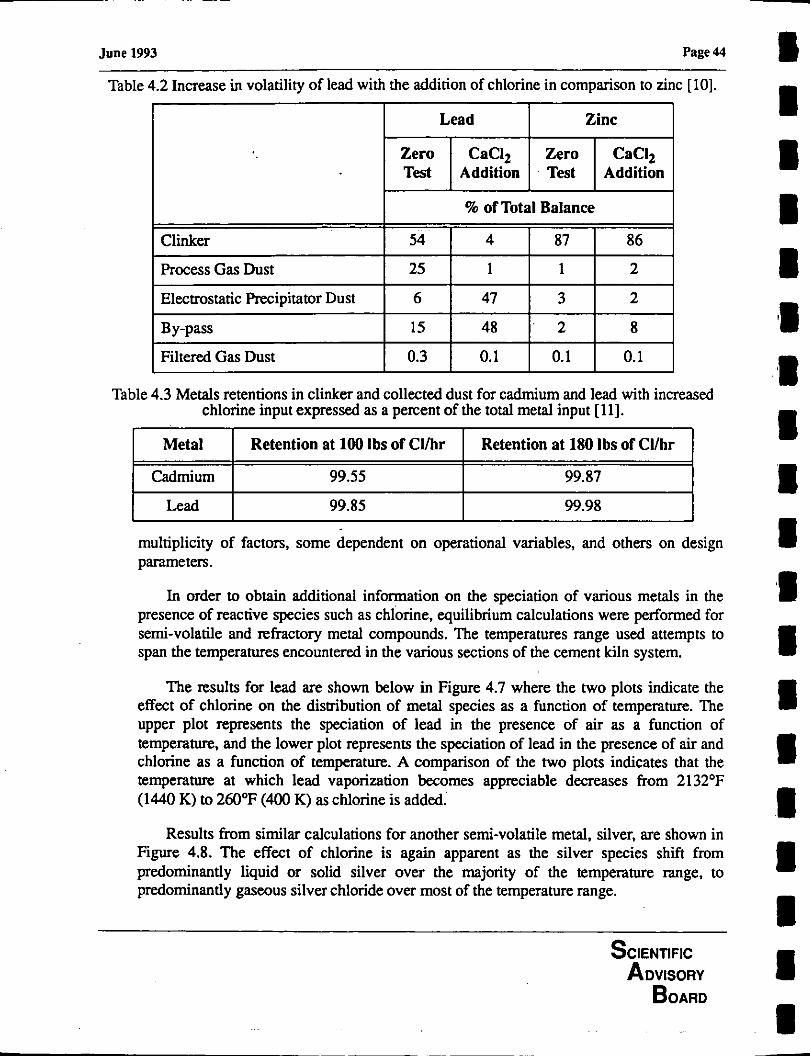
the clinker with increases in chlorine input. The addition of chlorine should therefore result in a larger fraction of Pb partitioning into the cement kiln dust. The data on the effect of chlorine content on metal partitioning in cement kilns, however, are mixed as shown in Table 4.2 and Table 4.3. The effect of chlorine in Table 4.2 shows that the lead vaporization increases as reflected by its decreased retention in the clinker. The data in Table 4.3 shows that the lead emitted from a kiln system decreases from 0.15 percent of the input to 0.02 percent as the chlorine increases. Since the amount of lead emitted should increase with the mass flow to the APCD, these two results are in conllict and indicate the need for additional data to resolve the issue. The vaporization of potassium, however, has been shown to increase with increasing chlorine content [13]. It should be noted that increased partitioning into the cement kiln dust does not necessarily result in an increase in particulate emission, since the emissions, as illustrated by the equations in Section 4.3.3, are a function of a
June 1993 Page 44
Table 4.2 Increase in volatility of lead with the addition of chlorine in comparison to zinc [lo].
Table 4.3 Metals retentions in clinker and collected dust for cadmium and lead with increased chlorine input expressed as a percent of the total metal input [ll].
multiplicity of factors, some dependent on operational variables, and others on design parameters.
In order to obtain additional information on the speciation of various metals in the presence of reactive species such as chlorine, equilibrium calculations were performed for semi-volatile and refractory metal compounds. The temperatures range used attempts to span the temperatures encountered in the various sections of the cement kiln system.
Retention at 180 lbs of Cllhr
99.87
99.98
Metal
Cadmium
Lead
The results for lead are shown below in Figure 4.7 where the two plots indicate the effect of chlorine on the distribution of metal species as a function of temperature. The upper plot represents the speciation of lead in the presence of air as a function of temperature, and the lower plot represents the speciation of lead in the presence of air and chlorine as a function of temperature. A comparison of the two plots indicates that the temperature at which lead vaporization becomes appreciable decreases from 2132OF (1440 K) to 260°F (400 K) as chlorine is added.'
Retention at 100 lbs of CUhr
99.55
99.85
Results from similar calculations for another semi-volatile metal, silver, are shown in Figure 4.8. The effect of chlorine is again apparent as the silver species shift from predominantly liquid or solid silver over the majority of the temperature range, to predominantly gaseous silver chloride over most of the temperature range.

8 June 1993 Page 45
Temperature (K)
Air only
FJB
P E L ?
E rn PbC12 (s)
Air + C1
- Temperature (K)

June 1993 Page 46 I
Temperature (K)
Air only
W AG AOCL
AWYL) H ACCYS)
Air + CI
Temps (K)
Figure 4.8 Equilibrium predictions of Ag speciation in the presence of air (upper plot) and air + 5% C12 (lower plot).
I I

8 June 1993 Page 47
Equilibrium calculations were also performed for a refractory metal, beryllium, to illustrate the predicted impact of chlorine on the speciation of this low-volatile metal. The results, shown in Figure 4.9, indicate that although some volatile chloride species are formed, the beryllium is present predominantly as a condensed species over most all of the temperature range of operation for the cement kiln system.

June 1993 Page 48
400 600 800 loo0 1200 1400 1600
Temperature (K)
Air only
H BECL BECU BE0
61 Buoz BE303
BE104 B W S )
Air + C1
Temperature (K)
Figure 4.9 Equilibrium predictions of Be speciation in the presence of air (top) and in the presence of air + 5% C12 (bottom).

June 1993
1 Page 49
4.3.3 Overall Material Balance for a Cement Kiln
Data on the composition of the clinker and cement kiln dust published by the Portland Cement Association (4) show a considerable enrichment of certain trace metals (particularly mercury and thallium) in the cement kiln dust. Generally, the refractory metals have lower CKDIclinker averages compared to the volatile species. Figure 4.10 through
0
0 20 40 60 80 100 120 140 160 180 200 CKDIClinker (Cadmium)
Figure 4.10 Histogram of PCA summary data for cadmium.
Figure 4.13 (frequency refers to the number of kilns reporting in this CKDlclinker ratio) show histograms of CKDIclinker ratios for cadmium, lead, silver, and beryllium. As shown, silver and beryllium have CKDIclinker ratios below and around one, indicating that these metals are more refractory. On the other hand, lead and cadmium have CKDIclinker ratios that are significantly higher than silver and beryllium, indicating volatilities greater than those of the refractory metals.
The averages of the ratios of the concentration of metals in the CKD and clinker are shown in Figure 4.14. The ratio provides a measure of the volatility of the metals or metal compounds. Based on these ratios, it is convenient to classify the metals into the categories of volatile (TI, Hg), semi-volatile (Sb, Se. Pb, Cd), and refractory (Cr, Be, Ba, Ni, As, Ag). There was a considerable degree of variance in the data as a consequence of two factors: the inclusion in the PCA survey of plants of widely differing design, and probably errors in the measured concentrations resulting from the various analytical procedures, particularly

June 1993 Page 50
0 100 200 300 400 CKDlClinker (Lead)
Figure 4.1 1 Histogram of PCA summary data for lead.
0 0.3 0.6 0.9 1.2 1.5 1.8 2.1 2.4 2.7 CKDlClinker (Silver)
Figure 4.12 Histogram of PCA summary data for silver.

June 1993
\ Page 51
0 0 0.3 0.6 0.9 1.2 1.5 1.8 2.1 2.4 2.7 3 3.3 3.6
CKDIClinker (Beryllium)
Figure 4.13 Histogram of PCA summary data for beryllium.
for those elements present at concentrations close to the detection limits. Despite the variance in the measured values, the trends in the data are unmistakable.
In order to understand the factors governing the enrichment of the CKD one needs to consider a material balance about the cement kiln. Because of the variation in temperature along the length of a kiln and the counter-current operation, a model for the vaporization and condensation of metal compounds in a kiln is complicated. Metal compounds of different volatility will vaporize and condense along different sections of the kiln and the process is further complicated by the entrainment and redeposition of particles from and to the bed. Simple lumped models in which the kiln, preheater, and other components of the process are treated as single unit operations have been found to be useful for interpreting data [13 - 171. These models are semi-empirical since parameters such as volatility of the metals or their salts are usually fitted to the data. One example of the use of such models is the study by Wolter and Hansen [12] on the effect of the burning process on the production of low alkali cement. Th'e material flows of alkalies, sulfate, and chlorine in a kiln were modeled for different firing conditions, using percent evaporation as the fitted parameter. In the following sections such simple models will be developed in order to provide an understanding of how different material properties and process parameters influence the flux of metals in cement kilns.
A key to modeling metal emissions from kilns is the treatment of the dust. Dust loading inside a cement kiln can provide a mode by which vaporized metal compounds can condense and leave the system. The gases exiting rotary kilns can cany this dust

June 1993 Page 52
0:1 1 10 100 1000
CKDIClinker Concentration Ratio
Figure 4.14 PCA data on ratio of CKDIclinker concentrations.
throughout the precalciner, preheater, and eventually to the APCD. In a wet-process system the dust at the kiln exit can be up to 15 percent of the total clinker output. A long dry- process plant can have a dust load in the exit stream that is as much as 15 percent of the kiln feed. A preheater or precalciner kiln will have, as a maximum, dust losses of between five and 7 percent Management of this dust in the process provides a means for controlling metal compound emission, as will be shown. Electrostatic precipitators and bag houses are used to trap the dust. The collected dust is then usually returned to the kiln and the escaping dust exits the system in the stack. The escaping magrial leaving the stack may contain higher levels of metal compounds due to the internal recycle and enrichment process of cement processing, but the escape of enriched material is greatly reduced because of the mixing in the preheaters of the recycle dust, air, and the raw materials.
As a first case, consider H simple example of a long kiln where the interest is in calculating the ratio of concentrations of irace metals in the CKD and the clinker (Figure

June 1993 Page 53 -
4.15). Let the amount of trace metal input be mi. Assume a fraction ai of the metal is
Main Stack Cooler Vent
Figure 4.15 Simplified flow diagram for a long kiln.
vaporized at node 1 and a fraction Pi is entrained at node 2. The entrainment fraction Pi is assumed to be constant for all elements and to therefore also apply to the total mass flow. The model is an oversimplification since vaporization and entrainment are not independent events, as, for example, early vaporization of a metal will reduce its probability for later entrainment. For these assumptions, the amounts of the trace metal vaporized and entrained into the CKD is given by aiq + &(l-a i )q and the residue in the clinker is given by (1- q)(l-h)mi. The ratio of the total mass of cement kiln dust to clinker is given by Pi/(l-Pi), since the amount of trace metal vaporized can be neglected. The ratio of trace metal concentrations in the CKD and clinker is therefore given by:
This simple model does not account for the recycle within the kiln as a result of condensation of volatiles on the dust and the redeposition of the dust in the kiln.

June 1993 Page 54
For a value of 0.01 and 0.1 for pi, corresponding to 10 and 100 grams of CKD per kilogram of clinker, the dependence of the ratio of concentrations in the CKD to the clinker, for different values of the vaporization fraction ai, is given in Table 4.4.
Table 4.4 Calculated ratio of concentrations in CKD and clinker as a function of vaporization fraction q for pi = 0.1 and 0.01.
Vaporization Fraction (q)
Concentration Ratio CKDIClinker (pi = 0.01)
From a comparison of these values in Table 4.4 with the data in Figure 4.14, it can be seen that the fractional vaporization of antimony is of the order of 0.1, for selenium, lead, and cadmium in the range 0.7 to 0.9, and for thallium and mercury between 0.9 and 0.99.
Concentration Ratio CKD/Clinker (pi = 0.1)
The simplified model can then be extended to a preheaterlprecalciner kiln (Figure 4.16). The modifications that need to be made are for the by-pass duct (node 8) and the
0
1
Mdn Stack Cooler Vent
1
RehulerlRg.lclna Kiln
Figure 4.16 Simplified flow diagram for a preheater/precalciner kiln. '
0.1
12.1
2.1
0.3
43.9
5.3
0.5
101
0.7
234
11 24.3

June 1993 Page 55
mixing of the solids from the kiln with the raw material in the vreheaterlurecalciner (node - 10). Again, there are oversimplifications. For example, mating the preheaterlprecalciner as a single node and neglecting the variations in the concenmtions in the precalciner and the different cyclones of the pGheater. The same procedures as above can be used, with the introduction of three additional parameters. The first is the fraction y of the stream at node 8 that is removed by the by-pass duct, the second is the amount of dust 6, expressed per unit mass of clinker that is carried to the APCD from the first cyclone shown as node 10, and the thud (at node 4) is a, the fraction of the solids in the clinker cooler carried to the cooler vent APCD. The algebraic equations for the different mass fluxes and concentrations, even for this simple case, are quite involved and are therefore presented in Appendix I.
The value of P = 0.14 and 6 = 0.083 are based on the average values reported for preheaterlprecalciner kilns by Sprung [lo]. Values of the ratios of concentrations of CKD to clinker and main APCD dust to clinker have been calculated as a function of the fraction ai of metal vaporized for selected values of y, the by-pass fraction. These ratios are given by:
'clinker
where,
and
where,
The results shown in Table 4.5 illustrate the importance of the dilution of the dust leaving the kiln with raw material in the precalciner in reducing the enrichment of the dust.

June 1993 Page 56
Table 4.5 Calculated enrichment of metals for the by-pass versus main stack (P = 0.14, y = 0.1,6 = 0.083).
It can be seen that the dust to the by-pass stack has a much greater enrichment than that to the main APCD. The understanding of how metal compounds are distributed between the different streams can be used to minimize the emission of metals of concern by providing guidance on the distribution of resources for the APCDs on the main stack, the by-pass duct, and the cooler vent. Since the gas volumes and the metal fluxes are not proportional, there is a potential to improve performance for a given investment.
Another important feature of cement kilns is that extensive recycling of volatile metal compounds occurs within the kiln. The ratio of the flux from node 2 to 10 to the metal input is shown as a function of volatility (a, vaporization fraction) and by-pass fractions in Figure 4.17. As shown, the recycle ratio increases with increasing volatility and decreasing by-pass fraction.
0 0.1 0.2 0.3 0.4 0.5 0.6 0.7 0.8 0.9
Vaporization Fraction (Decimal)
+ Bypass Fraction = 0.1
+ Bypass Fraction = 0.3
+ By-pass Fraction = 0.5
Figure 4.17 Effect of vaporization and by-pass flow on metals recycle ratio.

June 1993 Page 57 \
4.3.4 Factors Governing the Emission of Metals
The models developed (see Figures 4.15 and 4.16) for the long and preheaterlprecalciner kilns may be used to calculate emissions from the main (node 9), the by-pass (node 7), and the cooler vent (node 6) stacks. The models, in their simple fom, can be used to distinguish the separate impacts on the emissions from the three stacks of:
entrainment of solids (P), . .
extent of vaporization (a),
by-pass fraction (y), and
efficiency of the APCDs (A - main stack, B - by-pass stack, and C - cooler vent).
The value of the entrainment parameter (P) in the kiln is of order 0.08 but will vary between kilns of different design and operating parameters. The model for a long kiln has been used to show how the distribution of metal compounds between the clinker and the dust to the main APCD varies when the entrainment factor is increased for a metal compound with a 50 percent volatility (see Figure 4.18). As expected, increasing
%of Metal to Main APCD
of Metal to Product - 70
3 60
50 - $ 4 0
30 Vaporization Fraction = 0.5
20 APCD Efficiency = 99.87
10
0 I
0.05 0.08 0.11 Entrainment Fraction ( O h )
Figure 4.18 Effect of entrainment fraction on metal flows for a long kiln.
entrainment increases the amount of metal carryover to the main APCD. The percentage change in the carryover to the main APCD and, as a corollary, the emission from the main stack is small for this metal compound since the vaporization (50 percent) greatly exceeds

! June 1993 I ' I
the entrainment fraction (5 to 11 percent). For a metal compound of low volatility, changes in entrainment rate will have a much larger impact on the changes in emission from the main stack. The effect of changing the vaporization fraction in a long kiln for a fixed entrainment fraction (p) of 0.08 is shown in Figure 4.19. The results of the model show that
Vaporization Fraction (%)
%of Metal to Main APCD
% of Metal to Product
Entrainment Fraction = 0.08 APCD Efficiency = 99.87
Figure 4.19 Effect of vaporization fraction on metal flows for a long kiln. I the fraction of the metal compounds carried to the main APCD increases with increasing vaporization fraction.
'mi
The distribution of metal compounds for a preheater kiln are modeled next. The effect ,, of changing by-pass fraction (y) is shown in Figure 4.20 for a kiln entrainment fraction (p) of 0.14, a vaporization fraction (a) of 0.75, a preheater cyclone entrainment factor (6) of 0.083. and a clinker cmler entrainment factor (0) of 0.1. For these parameters, the flow to , II the by-pass duct increases with increasing by-pass fraction, mainly at the expense of the flux in the clinker product. The flow to the main duct is small because the vaporized metal compounds are mixed with the raw material in the preheater kiln with a subsequent recycle '1 of a major fraction of the vaporized metal compound to the kiln. The effect of an increase in vaporization fraction, given a fixed by-pass fraction of 0.15, is similar, as shown in Figure 4.21, with the flow to the by-pass increasing at the expense of the flow to the clinker as the vaporization fraction increased from 0.1 to 0.9.
I The flows to the APCDs, together with the APCD collection efficiencies, establish the
emission rates from the different stacks. For an assumed constant APCD collection m
efficiency of 99.87 percent, the results from Figure 4.18 through Figure 4.21 have been I

June 1993
100 % of Metal to Main APCD 90
80 % of Metal to Bypass APCD
70 ae 60
(i 50 Conditions
- Entrainment Fraction = 0.14
$ 40 Vaporization Fraction = 0.75
30 Entrainment to Main APCD = 0.083 Entrainment to Cooler APCD = 0.1
20 APCD Efficiency. Main = 99.87
10 APCD Efficiency, Bypass = 99.87
0 APCD Efficiency, Cooler - 99.87
Bypass Fraction (Oh)
Figure 4.20 Effect of by-pass fraction on metal flows for a preheater kiln.
90
80
70 a9 60 P 2 50 - $ 40
' 30
20
10
0 0.1 0.5 0.9
'japorization Fraction (%)
Oh of Metal to Bypass APCD
% of Metal to Product
Entrainment Fraction = 0.14 Bypass Fraction = 0.15 Entrainment to Main APCD = 0.083 Entrainment to Cooler APCD = 0.1 APCD Efficiency, Main = 99.87 APCD Efficiency. Bypass = 99.87 APCD Efficiency, Cooler - 99.87
Figure 4.21 Effect of vaporization fraction on metal flows for a preheater kiln.
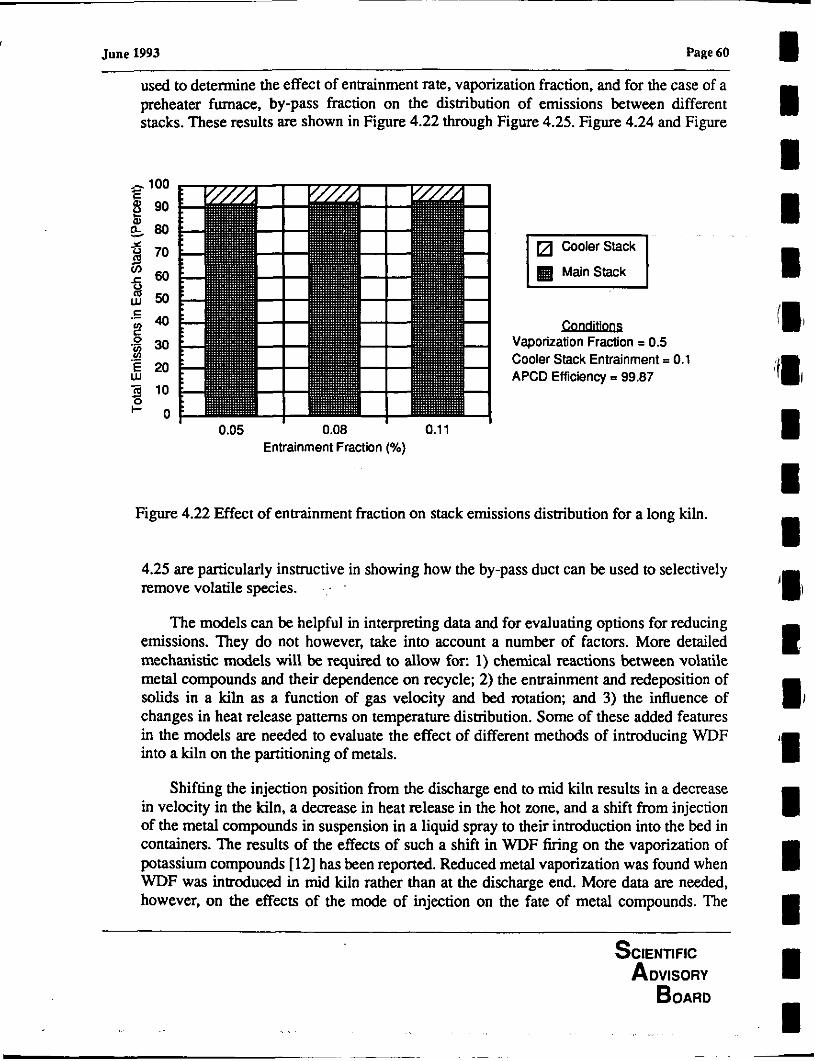
June 1993 Page 60
used to determine the effect of entrainment rate, vaporization fraction. and for the case of a preheater furnace, by-pass fraction on the distribution of emissions between different stacks. These results are shown in Figure 4.22 through Figure 4.25. Figure 4.24 and Figure
Main Stack
Conditions Vaporization Fraction = 0.5 Cooler Stack Entrainment = 0.1 APCD Efficiency = 99.87
Entrainment Fraction (Oh)
Figure 4.22 Effect of entrainment fraction on stack emissions distribution for a long kiln.
4.25 are particularly instructive in showing how the by-pass duct can be used to selectively remove volatile species. , .
The models can be helpful in interpreting data and for evaluating options for reducing emissions. They do not however, take into account a number of factors. More detailed mechanistic models will be required to allow for: 1) chemical reactions between volatile metal compounds and their dependence on recycle; 2) the entrainment and redeposition of solids in a kiln as a function of gas velocity and bed rotation; and 3) the influence of changes in heat release patterns on temperature distribution. Some of these added features in the models are needed to evaluate the effect of different methods of introducing WDF into a kiln on the partitioning of metals.
Shifting the injection position from the discharge end to mid kiln results in a decrease in velocity in the kiln, a decrease in heat release in the hot zone, and a shift from injection of the metal compounds in suspension in a liquid spray to their introduction into the bed in containers. The results of the effects of such a shift in WDF firing on the vaporization of potassium compounds [12] has been reported. Reduced metal vaporization was found when WDF was introduced in mid kiln rather than at the discharge end. More data are needed, however, on the effects of the mode of injection on the fate of metal compounds. The

June 1993 Page 61
Main Stack
I Conditions I Entrainment Fraction = 0.08 '
Cooler Stack Entrainment = 0.1 APCD Efficiency = 99.87
Vaporization Fraction (%)
Figure 4.23 Effect of vaporization fraction on stack emissions disaibution for a long kiln.
Bypass Stadc
Main Stack
Conditions Entrainment Fraction = 0.14 Vaporization Fraction = 0.75 Entrainment to Main APCD = 0.083 Entrainment to Cooler APCD = 0.1 APCD Efficiency. Main = 99.87 APCD Efficiency, Bypass = 99.87 APCD Efficiency, Cooler = 99.87
7 I I I
0.05 0.15 0.25 Bypass Fraction (%)
Figure 4.24 Effect of by-pass fraction on stack emissions dismbution for a preheater kiln.

June 1993 Page 62
I '
0.01 0.5 0.95 Vaporization Fraction (%)
Bypass Stack
Main Stack
Condifons Entrainment Fraction = 0.14 Bypass Fraction = 0.15 Entrainment to Main APCD = 0.083 Entrainment to Cooler APCD = 0.1 APCD Efficiency. Main = 99.87 APCD Efficiency. Bypass 199.87 APCD Efficiency, Cooler = 99.87
Figure 4.25 Effect of vaporization fraction on stack emissions distribution for a preheater kiln.
models, even in their simple form, can be used to provide a good fit of the data as will be demonstrated in Section 4.6.1.

I June 1993 Page 63
4.4 Reliability of Data
4.4.1 nansient Behavior
The objectives in reviewing the data are to provide a scientific basis for evaluating environmental impacts of burning waste in cement kilns and to compare those data with a baseline using conventional fuels. It is important in reviewing the data to appreciate the differences in fuels, kiln design, plant operation, and efficiency of the air pollution control devices. It is also necessary to recognize that there can be a significant time requirement for the concentrations to build up to the steady state values. Clark [17] and co-workers have reported time resolved measurements for lead and cadmium in by-pass dust from a cement plant Figure 4.26 shows the concentration of lead and cadmium as a function of time after spiking started. As illustrated, the times to reach steady state concentrations are approximately 10 hours for lead and greater than 30 hours for cadmium. The respective time constants are 3.5 and 23 hours. These times will vary depending upon: the volatility of the metal; the by-pass flow rate, and the type of kiln. These data illustrate the importance of allowing for transient behavior in measuring the emission of metal compounds from cement kilns. Results obtained for trials in which data were accumulated during the transient period cannot be used to predict steady-state behavior without correction for the departure from equilibrium conditions. It should be noted that for BIF compliance, metal equilibrium has to be demonstrated before the test data is accepted by the EPA.
4.4.2 Material Balance Closure
A material balance performed by monitoring all input and output flows and concentrations provides a good check on the consistency of data. Such measurements are I complicated by: 1) the rqiirements that the input concdntrations and flows and operating parameters be maintained constant during a period long enough to achieve steady-state, 2) the difficulty of obtaining representative samples for heterogeneous solid streams, 3) low concentrations of the trace elements with values often close to or below their detection limits, 4) the inability to capture volatile vapors in stack sampling systems, a problem of major significance with mercury.
Data complete enough to conduct material balances were found for only a few kiln systems and these are summarized below. The input and output data for the elements are listed along with the fractional closure of the material balance. The results for a four-stage preheater kiln at Plant K, a Lepol kiln at Plant Q, and a long wet kiln at Plant H are provided in Table 4.6 through Table 4.8.
Most of the data is within 30 percent of mass closure, which is good considering the difficulty of the measurements. The largest errors are found for volatile elements particularly mercury and thallium. Wherever possible, data should be used where sufficient information is available to apply consistency checks. In the absence of such checks, the possibility of uncertainty in the measurements should be recognized.

June 1993 Page 64 u,
5 10 Splklng l ime (hr)
Spiking Tlme (hr)
Figure 4.26 'lime-resolved measurements of lead and cadmium in a cement kiln.

June 1993 Page 65
Table 4.6 Material balance for Plant K. -
Table 4.7 Material balance for Plant H.
Metal
As
Ba
Be
Cr
Ni
Ag
V
Sb
Cd
Pb
Se
Zn
H g
TI
Input ObdW
1.91
51.9
0.19
14.3
7.86
1.80
5.86
1.47
, 1.37
16.6
0.17
40.3
0.131
1.71
Output (lbsflu)
2.48
56.3
0.18
16.6
6.23
0.80
7.03
0.54
0.56
14.6
0.13
29.0
0.017
0.17
OutIIn
1.29
1.08
1.06
1.16
0.79
0.42
1.20
0.37
0.41
0.88
0.76
0.72
0.13
0.10

June 1993 Page 66 I Table 4.7 (Con't) Material balance for Plant H. I
Table 4.8 Material balance for Plant Q.
Metal
Se
li
Zn
Input (kg/hr)
0.2
44
3.31
Output (kg/hr)
0.32
52.7
3.63
Outh
1.6
1.2
1.1

June 1993 Page 67
4.5 Test Results
4.5.1 Preheater Kiln
The cement kiln facility utilized for this test matrix was a conventional four-stage preheater system. The kiln feed material is passed through a series of cyclones where the feed material is preheated by contact with the exiting gas stream Particulates are removed h m the exhaust gas by the cyclones for recycle into the kiln system. The material exiting the lowest stage cyclone prior to entering the kiln reaches an approximate temperature of 1620°F (1155 K) and, at this point, is typically 40-45 percent calcined. In addition, the kiln system utilizes a by-pass stream with particulate collection to prevent accumulation of volatile species due to the recycle of materials within the system. Up to 15 percent of the kiln exhaust gases can be bled off in the by-pass stream.
Metals Input
Three separate tests were run at this facility comparing a base case, where the only inputs to the system were the raw feed materials and the coal utilized as fuel, to two other cases which included the addition of tire-derived fuel, liquid WDF fuel, and the
' liquid WDF was spiked with solutions of metal salts to increase total metal input into the kiln. Figure 4.27 displays the total metals input to the cement kiln system for the
M Raw Materlals. Coal I
Elements
Figure 4.27 Total metal feed rates in fuel and raw materials in a cement kiln fired by only coal.

June 1993 Page 68 -
base case with coal as fuel. As is shown, the metal with highest input rate is Ba under these conditions. To illustrate the distribution of metal comwunds between the .- .--
different input streams, a simple schematic of the overall kiln (see Figure 4.28) system was drawn and the relative percentages of metal compound inputs were included for all feed streams - in this case only the raw feed material and the coal. It is interesting to note that the fraction of the metis added by the coal is very small. With the excepzon of barium, the raw feed is the dominant source of metals.
Figure 4.29 summarizes the metal inputs for a mixed coawaste fuel plus spiked metals in the top panel and the ratios of those inputs to those for the case of coal alone in the bottom panel. As shown, the largest increases occurred with Ag and Cd which are actually artificially spiked into the system in large quantities (approximately 30 times the amount present in the case of no waste addition).
For some elements, for example vanadium, the input decreases slightly when waste is substituted for coal. It is interesting to trace the major sources of the elements in the input streams for this set of tests. The raw materials accounted for the majority (>SO percent) of the arsenic, barium, selenium, thallium, and vanadium. The major sources of zinc were tires and the liquid WDF streams. The liquid WDF stream was, in addition, a major source of chromium, lead, and nickel. The coal was a minor contributor for most metals. The spiked solution was added to provide partitioning coefficients for a series of elements and, therefore, artificially biases the data for antimony, cadmium, mercury, and silver in the waste input stream. In the absence of the spiked solutions, the major contributor for these four metals (Sb, Cd, Hg, Ag) would have been the cement raw materials. The data on tires are not expected to vary widely between kilns and tires are therefore only expected to be a major source of zinc. The data for coals and liquid WDF streams will be highly variable and need to be assessed separately for each individual case. These results emphasize the importance of characterizing the metal content of input streams as a first step in any assessment of metal compound emissions.
The distribution of the input metal flow rates for the case of auxiliary feed stream additions is shown in Figure 4.30, which is again a simple schematic of the overall cement kiln system with each feed stream labeled with a distribution plot In this test the raw material, the liquid WDF, and the spike all contributed significant metals; the tires only added zinc.
Total Emissions
Figure 4.31 displays the total mass flowrate of each metal constituent emitted from the by-pass, the kiln main stack and the cooler vent for the cases of operation with and without the waste feed metal inputs. As shown, the highest emissions (by weight) for the no waste case were for Zn and Ba. For the case of including auxiliary feed streams, Pb demonstrated the highest emission rate. Zn emissions did not change greatly; however, the zinc mass balances were rather poor (in the base case the measured Zn output was 230 percent of the input while in the waste case the measured
SCIENTIFIC

I June 1993 Page 69
I I I I I I. w I I w m I I I D I I

June 1993 Page 70
Elements
lrn 1
Elements
Figure 4.29 Metals input for mixed couwaste firing plus spiked metals; top panel - total mass input, bottom panel - mass input normalized by input for coal-only firing.

-
June 1993 Page 71
I I I N I I' i I m I n I I 4 I D I I

June 1993 Page 72 I
RawMaterials.Coal Raw Materials, Coal. T i LHWF, Spike
Refnnory 1
Element
Figure 4.31 Metal emission rates of all stacks and vents.
outputs only summed to 73 percent of the input). Hg emissions increased by a factor of 2 and Ba emissions actually decreased by a small amount Other variations between the two cases were much smaller.
Relative Importance of Individual Stacks
Figure 4.32 and Figure 4.33 illustrate the dismbution of metal emissions among the three stacks for the cases of firing with and without the auxiliary fuel smams. The percentage of stack emissions due to each source is shown by the stacked bars in Figure 4.32 for the base case of coal firing only and in Figure 4.33 for the case of various waste fuel additions. It is clear from comparing the two figures that emissions from all three sources are important and need to be considered. There is a substantial difference in the dismbution of emissions of different metals between the three stacks, as would be expected from their relative volatilities. Elements such as mercury, which are primarily in the vapor phase, will be selectively emitted from the main stack with the major fraction of the exhaust gas from the kiln. Elements, such as lead, which recycle to a large extent because of their volatility, will concentrate in the emissions from the by-pass stack. Refractory materials, such as barium, will concentrate in the clinker and be emitted preferentially from the cooler stack.

June 1993 Page 73
Coola Stack Bypass Stack Mainstack
Hg n Se Cd Pb Zn Sb Ag As Ba Be NI Cr V
Elements
Figure 4.32 Dishbution of emissions in stacks without waste addition.
- Raw Materials, Coal, Ties. LHWF, Spike
H CoolaStack Bypassstack
I MainStack
Hg n Se Cd Pb Zn Sb Ag As Ba Be Ni Cr V
Elements
Figure 4.33 Dismbution of emissions in stacks with waste addition.

June 1993 Page 74
Figure 4.34 shows the same data on a mass emission base for each stack. The data indicate that there is a tendency to emit more material in the by-pass and cooler stacks as opposed to the main kiln stack with the addition of waste feed streams.
Total Emissions Relative to Volatility
The following two figures (Figure 4.34 and Figure 4.35) illustrate the relative increase in total system emissions for each metal as a function of the increase in that element in the total system inputs. In this study, three different tests were conducted with varying amounts of each metal added to the base system by including tirederived fuel, liquid hazardous waste fuel, and spike solutions. As a result, the fraction of the total amount of each metal that originated in the raw material feed stream (kiln feed stream) varied over the range of the tests.
The purpose for developing these plots was to determine if there was any correlation between the source and amount of metals in the cement kiln system and the amount of that metal that ended up being emitted from one of the stacks. Figure 4.35 illustrates the results for the metals that increased in emission in approximate proportion to their increase in input level. The 45' line indicates the emissions that would occur if they increased linearly with increased metals quantities. Data'which fall on this line indicate behavior which is independent of the source of the metal. For example, the Cr input approximately doubled in the case with the largest spike and liquid WDF flow (relative to the base case) and the emissions likewise doubled. Similar behavior was observed for Sb, As, and likely Ni. Hg emissions appear to increase.less than linearly, but this is likely due to a measurement problem since the material balance is particularly poor at the high input case.
The only metal which appears to have increased faster than would have been expected is lead (Pb). In the high waste case the total lead input to the system was increased by 2.4 times, but the emissions increased by more than a factor of 6. This may be due to the increased CI content of the gas phase which enhanced the formation of the more volatile lead chlorides.
Figure 4.36 illustrates the same results for the elements which appear to have emissions increases significantly less than would have been expected from simple material balances. Cd and Ag were both greatly increased due to the spike; Zn was increased due to the use of tire derived fuel. In each case the increase in emissions was a small fraction of the increase in metals input to the system. These data suggest that significant amounts of these elements can be added to the high temperature portion of the system without causing major increases in metals emissions.
4.5.2 Long Wet Kiln
Both Plant 0 and Plant P cement kiln facilities are conventional long-wet systems. The feed material is passed through the feed hood into the chain section of the kiln. Here the

June 1993 Page 75
~ a w Feed, coal. Tires. LWDF, Spikn Raw Feed. Coal
0.01 = 0.009 € g 0.008 - - g 0.007 .g 0.006 In .- E 0.005 W 5 0.004 3 0.003 5 0.002 8 0.001
0
Figure 4.34 Mass emissions for each stack.
BOARD

June 1993 Page 76
0 1 2 3 4 5 6 7 8 Input (waste addition)llnput (baseline)
Figure 4.35 Metal emission increase versus metal input increase.
slurry comes into contact with combustion gases and dust exiting the kiln. The average gas temperature at the feed hood location under normal operating conditions is = 400°F (478 K). Both facilities are equipped to process solid and liquid WDF. The liquid WDF is i nduced in the burner end of the kiln through a injection port. The solid WDF enters the kiln through the shell in the calcining zone. The data reported represents mal burn conditions for both facilities. .
Metals Input
Figure 4.37 shows the dismbution of metals input from the various processlfuel streams for Plant 0. As shown, metals are introduced to the kiln cavity via raw feed, solid WDF , coaUcoke, and liquid WDF. A metals comparison between Plants 0 and P is shown in Figure 4.38 (the coaUcoke metals data for Plant P was not available). This figure shows that the total metals species input to the kiln was similar for both facilities, the majority being As, Cr, Pb, and Ba.

June 1993 Page 77
0 5 10 15 20 25 30 35 40 Increase in Inputs Utlizing Waste Fuels
Figure 4.36 Metal emission increase versus metal input increase.
Total Emissions Relative to Volatility
Figure 4.39 shows the total mass flow rate of each metal from the main stack of the facilities. The highest emissions from the stack (by weight) was lead for both kilns. The remaining emissions fall below 0.035 lbs/hr (15.89 grams~hr).
Figure 4.40 shows the ratio of stack emissions to metals input for arsenic, cadmium, chromium, and lead. The trial bum data show cadmium and lead at higher ratios than arsenic and chromium, indicating that the emission levels for the semi- volatile species is greater than the refractory species. The semivolatile metals have a fractional emission which was a factor of 11 to 22 higher than that of the refractory metals but was still below 0.5% of the input
4.5.3 Precalciner Kiln
This section of the report examines data from a modem precalciner kiln. Figure 4.41 illustrates the flow diagram for the unit which typically produces approximately 1,920 tons/ day (1.74 million kgtday) of clinker. The system can burn both liquid and solid WDF; the liquids are i n d u c e d at the clinker discharge end adjacent to the coal burner and the solids are added at the feed end of the kiln. The coal fuel is divided between the main kiln burner

June 1993 Page 78 1

June 1993 Page 79
Figure 4.38 Metals input comparison between Plants P and 0. Metal inputs for Plant P are in raw materials, liquid W F , and solid WDF; for Plant 0 in raw materials, coal,
liquid WDF, and solid WDF.
Figure 4.39 Total mass flow rate of each metal from the main stack of Plants 0 and P. Metal inputs for Plant P are in raw materials, liquid WDF, and solid WDF; for Plant 0 in
raw materials, coal, liquid WDF, and solid WDF.

June 1993 Page 80
Figure 4.40 Ratio of stack emissions to metals input for arsenic, cadmium, chromium, and lead for Plants 0 and I? Metal inputs for Plant P are in raw materials, liquid WDF, and solid
WDF; for Plant 0 in raw materials, coal, liquid WDF, and solid WDF.
and the calciner. The results discussed in this section are from a compliance test conducted in h4arch 1992.
Metal inputs
Figure 4.42 shows the metal input rates for a compliance test (not including the spiked compounds.) These data illustrate the importance of the metal compounds naturally contained in the raw meal and the coal. Although significant chlorine, barium, chromium, and lead are being added by the waste streams, lead is the only metal component where the sum of the metal in the liquid and solid waste streams exceeds the amount coming from the normal cement raw materials.
CKD Concentrations
In the previous sections, it was noted that the ratio of the metals concentration in the CKD to that in the clinker provide a good indication of the relative metal volatility. Table 4.9 summarizes the results from five tests with the precalciner system: the first two of which were conducted as part of the compliance certification testing and the latter three which were completed in January, 1991. In general the ratios show the same trends as reported earlier for the PCA data (Section 4.3). The semi-volatile metals, particularly Cd and Pb, are greatly enriched in the CKD relative to the clinker.

4 June 1993 Page 81
. . ......... PREHEATER
A 3 z B
w IL z 1
* - IL % fl 5 d
0 0
a -I w s Y
0 A b Z .......... d - E
STACK rl,

June 1993 Page 82
Figure 4.42 Metal input rates.
Table 4.9 Summary of CKDIclinker concentration ratios from five tests from the Plant R precalciner system.

June 1993 Page 83 - - -
Table 4.9 Summary of CKDIclinker concentlation ratios from five tests from the Plant R precalciner system.
The agreement between the two replicate compliance tests is generally v e j good, although there is a marked variation in the enrichment of the semivolatile metals during the compliance tests relative to the earlier screening test results, as will be discussed later.
The volatile metal ratios (Hg and Tl) are not nearly as enriched as the PCA data would suggest. This may be due to the difficulty in measuring these species, especially in the gas phase.
Total emissions relative to volatility
Before examining the. actual air emissions data, it is important to consider the overall material balance closure for the testing. Table 4.10 shows these data for the
Table 4.10 Overall material balance closure, reported as outputlinput.
COC #2
1.13
4.69
0.87
1.78
0.93
0.95
0.92
1.02
C1
Sb
As
Ba
Be
Cd
CI
Pb
COC #1
1.27
2.38
1.25
0.86
0.85
0.86
0.87
0.85

June 1993 Page 84
Table 4.10 Overall material balance closure, reported as output/input.
compliance tests and indicates that, with the exception of Ag and Sb (which are not present in the raw materials, wastes, or spiked in significant quantities), and the volatile metals (Hg, TI), the overall balances are quite good for this scale of experimentation.
Hg*
Ag*
Tl
Figure 4.43 shows the emission results for the five different tests as function of the 100
C o c # l cocn Testy1
E TesttZ Test #3
Total input lw than 0.1 ibs/hr
COC #1
0.08
0.44
3.54
Metals
COC #2
0.04
0.67
1.07
Figure 4.43 Emission results as a function of element for five different tests.
element. In general the data agree with those reported for the other kiln types; the fractional emission is less than 0.1% for the refractory and semi-volatile metals. Of the metals likely to be in industrial wastes, only mercury is strongly emitted and should, therefore, be carefully limited on the input side.

June 1993 Page 85
Impact of metals feed rate
It has been noted previously that metal emissions generally increase with increasing metal input. The comprehensive set of data available for this precalciner kiln provides an excellent opportunity to examine this in funher detail. Figure 4.44 shows the cadmium emission results as a function of the Cd input rate. The emissions
0.004
Cadmium Input (Ibshr)
Figure 4.44 Cadmium emissions as a function of cadmium input rate.
increase approximately linearly with increasing cadmium. The two lower (almost identical) values are from the compliance testing and correspond to the higher CKD/ clinker ratios shown in Table 4.9. The emissions are apparently lower because more of the Cd was retained in the CKD.
Figure 4.45 shows the corresponding data for lead and here the situation appears to be considerably more complex.The early screening data (open symbols) depend more strongly on the chlorine concentration in the system than on the total amount of lead present. The compliance data (solid symbols) have low emission rates in spite of high C1 concentrations. These data suggest that the emissions are dependent on factors not yet fully understood. Ii should be noted that the method of lead introduction was changed between the two test sequences. In the compliance testing the lead was introduced with the liquid hazardous waste; in the earlier screening tests the lead was blown in as a powder with the primary air. This difference may partially explain the differences in behavior. Fortunately, the values are all far below the allowable emission

June 1993 Page 86
Lead Input (Ibdhr)
Figure 4.45 Lead emissions as a function of lead input rate.
levels so the uncertainty does not have direct compliance implications for this kiln; however, if understood, the effect could possibly have beneficial uses.
Emissions relative to allowable levels
The BIl: rules evaluate metal emissions based on a detailed irnpactJrisk assessment for the specific site in question and it is important to consider the metals emissions relative to the allowable levels. Figure 4.46 shows the metal emissions for a preheater, precalciner plant relative to the BIF limits for this facility. In every case, the measured emissions under the trial bum conditions (with the particulate collection equipment detuned) were almost two orders of magnitude below the limits.
4.6 Discussion
4.6.1 Comparisons Between Data and Model Predictions
The metals model developed in Section 4.3 was used to predict metal emission behavior for the trial bum data of Plants 0 and P. Three model parameters (entrainment recycle, vaporization fraction, and the main APCD efficiency) were obtained using lead and chromium data from both facilities, and these are shown in Table 4.11. Factors for metal condensation onto the entrained particles and main APCD efficiency were very similar for both species. The experimentally-observed difference between lead (semi-volatile) and

June 1993 Page 87
Figure 4.46 Metal emissions for the preheater, precalciner plant relative to the corresponding BIF limits.
Table 4.11 Average model partitioning parameters.
chromium (refractory) behavior was evident from the vaporization and entrainment factors. Here we see that the values for vaporization and entrainment fractions of lead were considerably higher than those for chromium. These parameters were then used to predict plant-specific metals partitioning behavior.
Figure 4.47 through Figure 4.50 show the results of the model predictions and data comparisons for lead and chromium at both plants. As shown, the model does an adequate job of predicting the metals partitioning for both kilns, and provides a basis for estimating the effect of control parameters, such as the wastage of CKD.
Chromium
0.08
0.0
0.9987 '
Parameter
Entrainment recycle (a)
Vaporization fraction @)
Main APCD efficiency
Lead
0.0803
0.8332
0.9961

June 1993 Page 88
20
18
16
L
14
a 12
5 10 2 a 8 a
6
4
2
0 Clinker Dust Stack
Figure 4.47 Lead predictions versus data for Plant P.
I Measured I
I I Clinker Dust Stack
Figure 4.48 Lead predictions versus data for Plant 0.

June 1993 Page 89
Measured
Clinker Dust Stack
Figure 4.50 Chromium predictions versus data for Plant 0.

June 1993 Page 90
4.6.2 Percent of Input Emitted
A most useful measure of the potential for release of metal compounds by a kiln is that giving the percent of the input metal that is emitted. The previous section showed that the assumption of linearity between emissions and inputs is not always valid; however, the assumption of linearity is useful as a means of extrapolating the data to different metal inputs [ll]. The percent emission (total stack output divided by total metal input) is given in Table 4.12 - Table 4.14 for the different kilns in Section 4.5. Results are reported for all
Table 4.12 Percent of input emitted - preheater kiln.
Table 4.13 Percent of input emitted - long wet kiln.
Metal % emitted
~ l * 0.014
As 0.001
Ca* 0.003

June 1993 Page 91
Table 4.13 (Con't) Percent of input emitted - long wet kiln.
Table 4.14 Percent of input emitted - Lepol kiln.
Metal % emitted
8 cr* 0.008
As 0.004
V* 0.042
~i 0.039
cu* 0.010
~d' 0.115
Pb 0.715
~ n * 0.012
Tl* 0.046
Hg BD
* metals which the material balance closed to within 25 percent
metals, and elements for which the material balance closed to within 25 percent are marked with an asterisk.
There is a larger body of literature on the percentage of the input emitted, based on stack measurements and the input, without test for closure. The data support the generalization that for refractory metals and their salts the emissions are generally below 0.02 percent of input, and for semi-volatiles the emissions are in the range of 0.05 to 0.5

June 1993 Page 92 I percent of input If the lack of closure for mercury balances is assumed to be a consequence of vapor emissions, the value for mercury ranges from 20 to over 90 percent. More data are needed where inclusion of a mercw vauor trap has been included in the sampling train.
B

June 1993 Page 93
I
H CHAPTER 5 ORGANICS
4 5.1 Summary This analysis on the fate of organics when WDF is substituted for fossil fuel in cement kilns
is based on 20 data sets obtained at various cement plants over the period 1974 through,1992. Direct comparison between different data sets is not always possible because the quantity and quality of the data collection has improved over this eighteen-year period. The most recent data, generated in 1991 and 1992, have been largely related to BIF compliance testing; however, this report does not include an analysis of all compliance tests that were required by BIF. ~btwithstandin~ the difficulties in-interpretation, thk database is probably more complete than for most other combustion sources, including hazardous waste incinerators.
POHC desmction and PIC emissions have been evaluated in terms of: 1) waste type (solid or liquid); 2) kiln type (long wet, preheater, and preheaterlprecalciner); 3) waste injection location (kiln discharge end, mid-kiln, and kiln feed end for preheaterlprecalciner kilns), and 4) raw material characteristics (the presence of raw material hydrocarbons).
POIiC Destruction
POHC emission data are summarized in Appendix 11. Emissions data show that organic compounds present in atomized liquid waste injected at the discharge end of the kiln can be destroyed to greater than 99.9999 percent. This observation is supported by theory. The high temperatures and long gas-phase residence times ensure high destruction efficiencies when the cement kiln is operated according to good combustion practice.
Recent compliance tests with solid waste in two, long, wet-process kilns and one, dry- process, preheaterlprecalciner kiln gave DREs ranging from 99.9996 to 99.99998 for the highly stable POHC monochlorobenzene. Measured DREs for the thermally fragile POHC 1,l.l- mchloroethane, which was added to both solid and liquid waste, were consistently greater than 99.99 percent and were always controlled by emission detection limits. The compli&ce data for long wet-process kilns are supported by kinetic modeling which predicted DREs greater than 99.9999 percent for all POHCs under both pyrolytic and oxidative conditions. Model predictions, however, for injection at the feed end of a dry-process preheater/precalciner kiln are varied. Even under pyrolytic conditions, DREs of greater than 99.9999 percent are predicted for chloroform,

June 1993 Page 94
carbon tetrachloride, temchloroethane and hexachlorobenzene. Predicted DREs for benzene under pyrolytic conditions, however, are 92.3 and 58.0 percent in the main and the by-pass stacks, respectively. The comparison between the model and the one data point underlies the importance of assuring adequate residence time in the kiln for preheaterlprecalciner kilns.
PIC Emissions
Data on the emission of PICs from cement kilns burning waste are more complete than those available for hazardous waste incinerators and indicate that overall emissions are no greater than for other combustion sources. Analysis of the database on PIC emissions is complicated by the presence of hydrocarbons in the raw feed of some kilns. There is evidence of chlorinated aromatic compound (CAC) formation in dry-process preheater and preheaterlprecalciner kilns, and the CAC concentrations correlate with the chlorine content of the waste. A surface-catalyzed hydrocarbon chlorination reaction is postulated to account for these observations. The reactant hydrocarbons may be the result of inadequate combustion in the kiln, or may be due to the presence of hydrocarbons in the raw feed.
Total PCDDIPCDF emissions were found to vary from the low end of the range observed for hazardous waste incinerators to the high end of the range observed for municipal waste incinerators. The data suggest that:
Combustion conditions have a much more significant influence on PCDDPCDF formation than either kiln type or the form of the wastederived fuel.
Yields of PCDDsIPCDFs and emissions of chlorinated benzene derivatives may be the result of different pathways, with gas-phase or surface-catalyzed reaction of chlorinated precursors being responsible for the PCDDJPCDF yields and surface- catalyzed chlorination of hydrocarbons being responsible for the chlorinated benzene derivative emissions.
Monitoring
When hydrocarbons are present in the raw meal, monitoring CO and THC in the main stack as surrogates for PICs does not appear viable. Although monitoring THC in the by-pass stack avoids the interference from raw material hydrocarbons, it provides no indication of PIC formation from raw material hydrocarbons downstream from the by-pass in the preheater andlor precdciner. Because of its extreme t h e d stability, SF6 may be an appropriate surrogate for POHC DRE. However, SF6 does not appear to be appropriate as a stand-alone surrogate for PICs because its rate of destruction is independent of oxygen concennation. Therefore, SF6 gives no indication of PIC formation under oxygendeficient conditions caused by poor fuellair mixing. The combination of the use of SF6 and an oxygen monitor at the end of the kiln can, however, provide measures of both the temperature and oxygen histories.

June 1993 Page 95
5.2 Issues
In contrast to metals, which are limited in number and whose individual masses are preserved. a few organic compounds fed to a combustor may in principal react to form tens, hundreds, or even thousands of individual organic compounds. Thus, consideration of the potential emissions of organic compounds from cement kilns co-fired with hazardous waste is an undeniably complex undertaking.
Research data generated largely under EPA sponsorship in the late 1970's and 1980's and also resulting from the more recent development of BIF regulations, have identified several technical issues related to combustion of hazardous waste in cement kilns. Because cement kilns are primarily designed to make clinker, there are some aspects of waste combustion that may be relatively unique to cement kilns. Of particular note are the possibilities for gas-solid interaction, emission of organic compounds due to heating of the raw meal, and post-treatment of kiln off- gases in the raw-meal preheater and precalciner sections.
The following is a list of questions raised by the technical and regulatory community that we specifically address in this report:
Cement manufacture requires that the raw material experiences a well-established thermal profile. Temperatures in cement kilns are higher than those generally experienced in incinerators; however, oxygen concentrations are lower. Can the regulated waste destruction be achieved in cement kilns under the temperature and oxygen conditions that are dictated by cement production?
Containerized solid waste is not fed at the discharge end of cement kilns. In long wet kilns it is injected at mid-kiln. For preheater and preheaterlprecalciner kilns it is injected at the feed end of the kiln with the partially processed meal. One facility is h o w n to inject powdered solid waste at the kiln discharge end. How do the chemical composition .and physical characteristics of the solid waste affect combustion performance for these injection locations?
The raw meal may contain hydrocarbons that will be released as the meal is heated during the drying and calcination processes. The temperature at which the hydrocarbon is released will be material-specific. What is the effect of post- processing calcination-zone off-gases in the preheat and precalcining zones of different type of kilns?
BIF requires monitoring THC and CO as surrogates for PIC emissions because low C O m C concentrations are indicative of high combustion efficiency. However, are CO and THC appropriate emission surroga&s for cement kilns whdn CO, released from calcining limestone, and THC, volatilized from the raw meal, affect measured THC and CO in the stack?

June 1993 Page 96 --- -- - - -
Performance assurance for cement kilns burning WDF is important Can sulfur hexaflouride (SF6) be used done, or in combination with other combustion indicators, as.a surrogate for POHUPIC emissions?
In the following sections we use a combination of available data and combustion theory to address these issues and identify where current approaches are sufficient or additional action is required.
5.3 Theoretical Background
It has long been recognized in the combustion community that sufficient reaction time, temperature, and fuel-air contact are necessary for efficient oxidation of organic compounds to their thermodynamic end-products [20]. A "failure" in any of these three parameters could, in principle, cause less than acceptable combustion and result in pollutant emissions.
Depending upon the type of facility, kiln gas-phase residence times of volatilized waste introduced to the dischargeend will range from as low as 4 to as high as 16 seconds [21, 221. Temperatures are reported to range upwards of 2800T (1811 K) in the sintering zone at the - - discharge-end of thd kiln. Laboratory generated data on oxidation of organic compounds have shown that these times and temperaNeS far exceed the requirement for >99.99 percent DRE of any organic compound (cf. able 5.1) [23 - 261. ~owev&, laboratory data on the pyrolysis of organic compounds have shown that the temperatures required for 99.99 percent DRE may be increased by over 400'F (222 K) for some materials when the fuel-air equivalence ratio is increased from 0.3 to 3.0 (cf. Table 5.2) [27]. Because the Portland cement process requires
Table 5.1 Thermal oxidation data for selected organic compounds indicating temperams required for the onset of destruction, 99% destruction and 99.99% destruction at a gas-phase - .
reaction time of 2.0 seconds.

June 1993 Page 97
Table 5.1 (Con't) Thermal oxidation data for selected organic compounds indicating tem~eratures reuuired for the onset of destruction. 99% destruction and 99.99% destruction at a *
gas-phase reaction &e of 2.0 seconds.
oxygen concentrations that are lower (e.g. 1-4%) than that used in most hazardous waste incinerators (which may have 7-12% oxygen in the afterburner), there is some initial concern that destruction of organic materials may not be complete. In order to begin the process of quantitatively evaluating the efficiency of various cement kiln configurations for processing hazardous wastes, a theoretical evaluation of the destruction of selected, representative POHCs was made.

June 1993 Page 98 I
Table 5.2 Thermal pyrolysis data for selected organic compounds indicating temperatures required for 99% destruction efficiency at a gas-phase reaction time of 2.0 seconds.
m 8

June 1993 Page 99
Table 5.2 (Con't) Thermal pyrolysis data for selected organic compounds indicating temperatures required for 99% destruction efficiency at a gas-phase reaction time of 2.0 seconds.
5.3.1 Kinetic Models of POHC Destruction: DischargeEnd Introduction of Waste
Using available process data, we devised a simple thennal-desmction model for a typical dry-process kiln with a preheater, and for a wet-process kiln in which liquid or powdered solid waste was. introduced at the discharge end of the kiln. For the dry-process kiln, the model entailed the establishment of five thermal destruction zones for the flow through the main stack and three thermal destruction zones for the flow in the by-pass stack. For the wet-process kiln, five kiln zones were included. Pseudo-first order reaction kinetics data were used in these initial models (cf. Table 5.3). The relevant process conditions for the dry-process kiln and wet-process kiln are summarized in Table 5.4 and Table 5.5, respectively.
Table 5.3 Pseudo-first order kinetic parameters for selected compounds [23,27].
Sulfur hexafluoride
1,2,4-Trichlorobenzene I 2.2E8 39 ' 1 1.7E7 39

June 1993 Page 100 I Table 5.4 Themud destruction model parameters for discharge-end introduction of waste in a
dry-process kiln with preheater.
Table 5.5 Thermal destruction model parameters for dischargeend introduction of waste in a long, wet-process kiln.
2
3
Air quench-Water quench
Water quench-Air cool
826 (714)
576 (575)
0.50
-0.50
12
N A

June 1993 Page 101
In the case of the dry-process kiln, the five zones for the main stack flow consist of the 1 kiln zone and the 4 cyclone zones. The three zones for the by-pass flow consist of the kiln up to the air quench, the zone from the air quench to the water quench, and the zone from the water quench to the air cool. The temperatures in the tables are arithmetic average temperatures that were, for the most part, calculated from the quoted temperatures at the entrance and exit of each zone [28] (c.f. Chapter 3). It should be noted that it was necessary to estimate the residence time in each individual preheater zone from the typically quoted total preheater residence time of 5.5 seconds. This calculation assumed that each zone was of eaual volume and that the residence time in each zone was solely proportional to the tempkrature in each zone. This approach had a significant effect-in the results. The residence time in the hottest preheasecondster zone (cyclone 4) was only 1.1 seconds while in the coolest zone (cyclone-l).it was 1.8 seconds. ~stimated oxygen concentrations were also included in the tables, but were not used in the model at its current level of sophistication.
The wet-process model considered kiln desnuction only. The five thermal zones consisted of clinkering, calcination, feed preheat, evaporation, and sluny preheat zones. The time-temperature histories were estimated from published literature [21, 221 (c.f. Chapter 3).
To address the effect of oxygen concentration on waste destruction, calculations were performed for both oxygen-rich and oxygen-starved conditions. This approach was used because it was felt that it would bracket the range of behaviors from worst case (pyrolysis) to best case (oxidation). The oxidation kinetics are from flow reactor studies of pure compounds in a reaction atmosphere of flowing oxygen [23]. The pyrolysis kinetics are from studies of the behavior of three to five component mixtures with chlorine to hydrogen ratios of 1:3 and fuel to air equivalence ratios of 3.0 [27].
5.3.2 Model Results: DlschargaEnd Introduction of Waste
The results of these calculations for wastes introduced at the discharge-end of typical dry and wet-process kilns, respectively, are summarized in Table 5.6 and Table 5.7. The entries in each table represent the estimated cumulative destruction efficiency of each compound up to that point in the process. The last column thus represents the estimated overall destruction efficiency for each compound for each separate stack.
The results of this exercise are extremely encouraging, as destruction efficiencies of >99.9999 percent are expected for all POHCs. The compounds used in this analysis are (with the exception of chloroform and carbon tetrachloride) expected to be very thermally stable (cf. Table 5.1 and Table 5.2). The calculations suggests that even under "worst-case" pyrolytic conditions, the temperatures in the kiln are sufficient to completely destroy POHCs that are expected to be refractory under such conditions.

June 1993 Page 102
Table 5.6 Cumulative destruction efficiencies (percent) of WHCs for dischargeend induction of waste in a dry-process kiln with preheater.
> 99.999 for all compounds. in all zones. for both oxidation and pyrolysis
> 99.9999 for all compounds, in aII zones. for both oxidation and pyrolysis

Page 103
Table 5.7 Cumulative destruction efficiencies (percent) of POHCs for dischargeend introduction of waste in a long wet-process kiln.
I For the sake of comparison, a two zone model for a typical rotary kiln/afterburner type hazardous waste incinerator was also developed (cf. Table 5.8) [29]. The predicted
I Table 5.8 Thermal destruction model parameters for a rotary kildafterburner incinerator.
Kiln 5 Zone Model
Zones
destruction efficiencies for the same POHCs were calculated. Cumulative destruction efficiencies for all POHCs were >99.9999 percent except for sulfur hexafluoride (-99.4 percent) and benzene under pyrolytic conditions (-99.5 percent) (cf. Table 5.9). These results suggest that the performance of a typical cement kiln where liquid (or powdered solid) waste is introduced to the discharge-end of the kiln may be superior to that of a typical hazardous waste incinerator.
5
Zone #
1
2
4 ComDound Hexachlorobenzene
Chlorobenzene
Benzene
Tenachloroethene
Trichloroethene
Chloroform
Carbon Tetrachloride
1,2,4 Trichlorobenzene
Sulfur Hexafluoride
Zone
Kiln
Afterburner
> 99.999 for all compounds, in all zones, for both oxidation and pyrolysis
. .
1
Temperature O F (K)
1800 (1255)
1999 (1366)
2 3
Residence Time(s)
2.0
2.0
Oxygen(%)
4.0
12.0

June 1993 Page 104
Table 5.9 Cumulative destruction efficiencies (percent) of POHCs fed to a rotary kiln/ afterburner incinerator.
5.3.3 Kinetic Models of POHC Destruction: Waste Introduced At "Mid- Process"
In order to treat containerized solid wastes, it is necessary to introduce them up-stream from the discharge end of the kiln. For long wet-process kilns, the waste is typically introduced at mid-kiln in 7-gallon metal cans or 6-gallon plastic containers; for dry-process kilns, it is introduced at the kiln feed-end. For both the precalciner type, dry-process kilns, and the long wet-process kilns, the waste is introduced at the beginning of the cement
>99.9999
>99.9999
>99.9999
>99.9999
>99.9999
99.358 1
Tetrachloroethene
Trichloroethene '
Chloroform
Carbon Tetrachloride
12.4 Trichlorobenzene
Sulfur Hexafluoride
>99.9999
99.9878
>99.9999
>99.9999
>99.6201
21.4112

June 1993 Page 105
calcining zone. In a preheater-type dry-process kiln, the waste is introduced just prior to the cement precalcining zone. From a process view-point, the point of introduction is the same in a precalciner and a wet kiln, i.e. mid-process. For a preheater kiln, the point of introduction is somewhat upstream from mid-process. Containerized solid wastes are not currently fed further down stream in even honer zones of the kiln because the mechanical system needed to feed solid wastes cannot survive the high-temperature, abrasive environment and care must be exercised to prevent discoloration of the cement by any carbon reaching the clinker zone.
Because gases evolved from wastes fed at these points do not experience the full time- temperature history of the kiln and because cement kilns do not have high-temperature afterburners, it is important that waste destruction in the kiln be highly efficient. While it is true that there may be some additional destruction in the precalciner and/or preheater zones of dry-process kilns. the fraction of the off-gases withdrawn in the by-pass stack has no opportunity for further destruction. Furthermore, the efficiencies of the preheater and precalciner for destruction or removal are currently unknown. Because of these issues, there is an overall concern about feeding wastes at any point other than the discharge-end.
In fact, previous research on a bench-scale, model incinerator has shown that when charging rates are too high in a kiln, transient puffs of incompletely destroyed organic matter can result [30,31]. Although the exact nature and yield of products is dependent on the types of materials fed, it is known that these puffs occur when volatiles are released too rapidly such that insufficient mixing occurs between the organic gases and air. Although the solids may be burning, fuel rich pockets of vapor which are being pyrolyzed, not oxidized, may still escape, resulting in emissions of organic compounds [32]. Under these conditions molecular growth type reactions may be favorable, resulting in formation of polynuclear aromatic hydrocarbons (PAH) from even low molecular weight feed materials [33-351. These prior studies are not directly applicable to cement kilns, but indicate the need for proper design and operation of waste injection systems in general. . .
To theoretically assess the efficiency of cement kilns for destruction of waste introduced at mid-process, process models similar to those developed for the discharge-end feed were also developed. The process conditions estimated for a dry-process kiln without a precalciner and a dry-process kiln with a precalciner are summarized in Table 5.10 and Table 5.11. As in the previous models, the zone temperatures are arithmetic averages of the measured entrance and exit temperatures for each zone. The residence time in the high- temperature region of the kiln is critical. The time was estimated based on physical observation of the distance of travel of 6 gallon plastic drums before their ignition and the gas flow in the kiln [28]. A four zone process model for feed-end introduction of solid waste to the same wet-process kiln described in Table 5.5, is given in Table 5.12.

June 1993 Page 106 I Table 5.10 Thermal desuuction model parameters for feed-end introduction of solid waste to a
preheater type, dry-process kiln. I

June 1993 Page 107
Table 5.11 Thennal destruction model parameters for feed-end introduction of solid waste to a preheater/precalciner type, dry-process kiln.
Table 5.12 Themal destruction model parameters for mid-kiln introduction of solid waste in a long wet-process kiln.

June 1993 Page 108
5.3.4 Model Results: Mid-Process Introduction of Waste
The results of the calculations for the mid-kiln induction are very encouraging as destruction efficiencies of greater than 99.9999 percent were predicted for all POHCs under both oxidative and pyrolytic conditions (cf. Table 5.13). The destruction efficiencies are due to the long residence time in the calcining zone at a temperature of 2372 "F (1573 K).
Table 5.13 Cumulative destruction efficiencies (percent) of POHCs for mid-kiln induction of solid waste in a long wet-process kiln.
An examination of the results for the preheater kiln (Table 5.14) indicates that the results are quite varied. The predicted destruction efficiencies for chloroform, carbon tetrachloride, tetrachloroethene, and hexachlorobenzene are approximately 100 percent, even under pyrolytic conditions. For benzene under pyrolytic conditions, however, the destruction efficiencies are as low as 92.3 and 58.0 in the main and by-pass stacks, respectively. Under oxidative conditions, the lowest calculated destruction efficiency (with the exception of SF6, which will be discussed later) is for trichloroethene which is calculated to be 99.9746 percent in the main stack and 93.9414 percent in the by-pass stack. Much can be said about the relative destruction efficiencies of the compounds and their behavior under oxidative and pyrolytic conditions, although it is probably not relevant to this particular analysis. However, careful consideration of these results and appropriate process modifications could result in significantly improved performance.
Kiln 4 Zone Model
Zones
ComDound Hexachlorobenzene
Chlorobenzene
Benzene
Tetrachloroethene
Trichloroethene
Chloroform
Carbon Tetrachloride
1.2.4 Trichlorobenzene
Sulfur Hexduoride
1
> 99.9999 for all compounds in all zones, for both oxidation and pyrolysis.
2 3 4

Page 109
I Table 5.14 Cumulative destruction efficiencies (percent) of POHCs for feed-end introduction of
I solid waste to a preheater type, dry-process kiln.

June 1993 Page 110
Table 5.14 (Con't) Cumulative destruction efficiencies (percent) of POHCs for feed-end introduction of solid waste to a preheater type, dry-process kiln.
By Pass Stack 3 Zone Model
Pyrolysis (Zones)
The addition of a precalciner resulted in no significant improvement (cf. Table 5.15). This is because quoted temperams in the precalciner of a preheater/precalciner-type kiln are actually lower than those quoted for cyclone 4 of a preheater type kiln [28].
This result would not seem to be consistent with the concept that the waste which is introduced at mid-kiln in a wet-process kiln and the waste that is introduced at the kiln feed-end in a preheaterlprecalciner kiln experience the same combustion conditions because both are i n d u c e d at mid-process. We currently believe that the timettemperature

Page 111
Table 5.15 Cumulative destruction efficiencies (percent) of POHCs for feed-end introduction of solid waste to a preheatertprecalciner type, dry-process kiln.
Carbon Tetrachloride >99.9999 >99.9999 S9.9999 >99.9999 >99.9999 >99.9999
12.4-Trichlorobenzene >99.9947 >99.9971 >99.9984 >99.9999 >99.9987 >99.9987
Sulfur Heduoride 99.9152 99.9154 99.9157 >99.9999 99.9157 99.9157
L

June 1993 Page 112
Table 5.15 (Con't) Cumulative destruction efficiencies (percent) of POHCs for feed-end introduction of solid waste to a preheaterfprecalciner type, dry-process kiln.
history of the solids feed are approximately the same for both types of kilns; however, the gas-phase timeltemperature histories, which are more important to waste destruction, are indeed different. This may be due to the increased heat transfer efficiency in the newer, preheaterlprecalciner type kilns.
Carbon Tetrachloride
1.24-Trichlorobenzene
Sulfur Hexafluoride
These results demonstrate how the existence of a "threshold" temperature for on-set of destruction can severely effect combustor performance. Below this temperature, the rate of
sr;;MFIcy BOARD
>99.9999
>99.9869
99.8386
>99.9999
>99.9869
99.8386

June 1993 Page 113
POHC destruction is very slow, and above this temperature the rate increases rapidly. For a gas phase residensecondsce time of 1.0 second, this temperature is 1472-1652 OF (1073- 1173 K) for the most stable organic compounds, which is typically just above the operating temperature of most of the flow path of current preheaters and precalciners. This underlines the importance of assuring adequate residence times in the kiln for the mid-process injection system. One method of doing this is by propelling the WDF pails down the kiln.
These calculations suggest that the majority of the destruction is occurring in the kiln itself. The preheater zones are moderately effective in destroying residual organic compounds while the temperatures in the by-pass zones are too low to cause significant additional destruction. The calculated destruction efficiencies in the main stack under oxidative conditions all approach or exceed 99.99 percent. Under pyrolytic conditions, the destruction efficiencies of most of the compounds are reduced. Although each zone is nominally operating under oxidative conditions, pyrolytic pockets of pwr-tnixing could, if present, contribute to the overall emissions 1321. Thus, the overall destruction efficiencies are expected to be some type of weighted average of the calculated oxidative and pyrolytic destruction efficiencies [32,33]. If mixing is poor in the by-pass stack, some stable POHCS would be predicted to have destruction efficiencies of less than 99.99 percent. Operating guidelines should be developed to prevent the persistence of pockets of oxygen-starved gases.
5.3.5 Development of Additional Kinetic Model Information
It is recognized that the results of this process modelling does not cover all possible operating scenarios. To address these other cases, reaction kinetic models were used to calculate the times and temperatures required for 99.99 percent destruction efficiency of POHCs of varying stability [23-261. These results are presented in Figure 5.1, Figure 5.2, Figure 5.3, and Figure 5.4.
The plots are for POHCs with values of the pseudo-first order kinetic parameters A and Ea ranging from id-10"s-' and 10-100 kcal/mole, respectively. The curves shown on each plot are for constants of 99.99 percent destruction efficiency (viz. "isotetranons" from the Greek for "constant four-nines?', or "isotets" for short). If the values of E, and A for a given POHC are known, the possible time-temperature histories resulting in 99.99 percent destruction can be estimated from these plots.
For convenience, the curves corresponding to E, = 20 kcal/mole, A = lds-', and Ea = 15 -1 90 kcal/mole, A = 10 s are highlighted. The former represents a known absolute worst- - -
case behavior for a POHC considered stable under oxidative conditions (i.e., trichloroethene). The latter represents worst-case for a POHC stable under pyrolytic conditions (i.e., sulfur hexafluoride). Using these two curves, various combinations of time
, and temperature that simultaneously result in 99.99 percent DE for both POHCs can be identified.

June 1993 Page 114
Figure 5.1 Plots of constant 99.99 percent DE for model POHCs with A = 10%-l and various values of E,.
Figure 5.2 Plots of constant 99.99 percent DE for theoretical POHCs with A = 10%" and various values of E,.

I June 1993 Page 115
12 -1 Figure 5.3 Plots of constant 99.99 percent DE for theoretical POHCs with A = 10 s and various values of E,
I Figure 5.4 Plots of constant 99.99 percent DE for theoretical POHCs with A = 1 0 ~ ~ s * ' and various values of E,.

June 1993 Page 116
As an example of the procedure we use hexachlorobenzene, which would be an appropriate surrogate for a high molecular weight POHC introduced to the dischargeend of the kiln. Approximate oxidation kinetic parameters of A = 10's-I and Ea = 40 kcal/mole
15 -1 and pyrolysis kinetic parameters of A = 10 s and Ea = 80 kcal/mole may be used to correspond to the limited number of values given in the plots (see Table 5.3). Using Figure 5.2 and Figure 5.4 for the oxidation and pyrolysis cases, respectively, one tinds that 99.99 percent DE can, for example, be achieved at t = 0.3 second. and 2012 OF (1373 K) (controlled by the pyrolysis rate) or t, = 5.0 seconds. and 1742 OF (1223 K) (controlled by the oxidation rate). Depending upon the design of a particular system, one of these combinations, or another combination, may be most readily achieved.
5.3.6 Assumptions and Other Factors Affectingthe Theoretical Model Results
Given the potential importance of the results of this exercise, it is appropriate to enumerate some of the uncertainties in the model and the calculation.
As currently formulated, the model assumes essentially isothermal conditions for destruction. For example, it does not allow for localized heating of the puff of gas released from the rupture of the pail of waste introduced at the feed-end of the kiln. If ignition occurs, the temperature of the bulk of the puff may increase to near its adiabatic flame temperature. If all of the waste is exposed to this temperature, then complete destruction can occur. However, if the mixing energy is insufficient, the fuel-to-air ratio within the puff may be too low for ignition. Even in this case, there will be some oxidation of the puff. Since oxidation is an exothermic reaction, there will still be some localized heating. This heating may even be sufficient to result in complete destruction of even the most stable POHCs.
In contrast, if the kiln oxygen concentration is too low, the waste charging rate is too high, or the BTU content of the.waste too low, local cooling may actually occur for the case of mid-kiln introduction of waste. If this is significant, the temperature experienced by the waste puff may be sufficiently less than 2350°F such as to cause less than 99.9999 percent destruction efficiency. Furthermore, pyrolysis and p h a l oxidation products may be formed and emitted. This phenomenon could conceivably manifest itself as an increase in THC emissions without a concomitant decrease in POHC destruction efficiency.
Furthermore, it is not clear how the waste introduction equipment and procedures will vary from facility to facility, thus it is difficult to extrapolate the model or the limited experimental results. Since the time-temperature history of the gases evolved from the solids fed to the kiln are so critical, chemical reaction tracer studies to determine the history would be useful for optimizing the process. Sulfur hexafluoride, a non-toxic material, would seem to be ideal for this testing and would represent a way in which the waste feed procedures could be optimized without environmental risk.

June 1993 Page 117
Another consideration is the simplicity of the pseudo-first order kinetic model that has been used. The oxidation kinetics are for pure compounds and do not include the possible effects of other components [23]. Such effects are expected to be most significant for the perchlorinated species such as hexachlombenzene and tetrachloroethene that do not contain hydrogen and thus cannot produce free hydrogen atoms or hydroxyl radicals to attack the parent compound The pyrolysis kinetics do include mixture interactions. but it should be noted the substoichiomemc oxygen conditions are designed to simulate absolute worst case perfomance. Consequently, pyrolysis kinetics alone should never be considered to be representative of the performance of the system [27,36]. It should also be noted that, with the exception of chloroform and carbon tetrachloride, reaction kinetics for extremely stable compounds have been used. Although this approach is environmentally conservative and generally justifiable, it yields a moderately distorted view of the overall effectiveness of the system.
An additional consideration is that this model does not consider removal in addition to destruction of the POHCs. Since the regulations specify 99.99 percent destruction and removal, then removal is also a regulatorally acceptable phenomenon. This may, in part, be responsible for the apparently superior performance reported for some kilns.
Finally, there is the potential for catalytic destruction of organic compounds in a CaCO$aCO/CQ rich environment. This effect is largely hypothetical, but is certainly possible. Its role and potential for further improved effectiveness should be explored.
5.3.7 Products of incomplete Combustion
The preceding POHC destruction models demonstrate that cement kilns should be highly efficient in destroying the waste feed for most operating scenarios. However, this model does not address formation and destruction of products of incomplete combustion (PICs). It is well documented in the literature on hazardous waste incineration, that under less than perfect operating conditions, combustion of organic materials can result in PICs emitted in greater concentrations than the parent species. This is largely because PICs are formed downstream of the combustion wne and do not experience the full time1 temperature history that the parent POHCs experience.
The feed preheat zone is among the distinguishing features of cement kilns as a facility used to destroy hazardous wastes. It is characterized by intermediate temperatures and relatively longresidence times. In dry-process kilns, this zone is physically skparated from the kiln and is probably better characterized as to its combustion conditions and emissions than in wet-process kilns. For example, data from the Plant K facility indicate that temperatures range from 800 OF (700 K, stack end) to 1400 OF (1033 K, kiln end) in the preheater with a total gas-phase residence time of 4-8 seconds [28]. Oxygen concentrations are similar to that at the kiln exit, i.e., 1-6 percent. Within these zones, the kiln off-gases will also come into contact with the raw meal. Because of the intermediate temperatures and large gas-solid contact in this zone, several types of chemistry can occur. These include:

June 1993 Page 118 - --
Kiln off-gases may be partially oxidized or pyrolyzed.
Organic compounds within the raw meal may be vaporized and introduced into the gas stream.
These volatilized organic materials may be partially oxidized or pyrolyzed.
Compounds produced during the kiln combustion may react with the compounds vaporized from the raw meal.
Any or al l of these materials may undergo surface reactions on the raw meal or other surfaces within these sections.
Because of the high solid (CKD) to gas ratio and the relatively low temperature in the preheat zone, surface catalyzed reactions may be occurring. Of specific interest is the possibility of surface catalyzed chlorination of hydnxarbons to form chlorinated hydrocarbons (CHCs). This type of mechanism for PCDD and PCDF formation has been widely explored and used to explain emissions of these compounds from municipal and hazardous waste incinerators [36].
Based on thennodynamic.equilibrium, HCI is expected to be the principal form in which chlorine exits the high-temperature, calcining zone of the kiln. Because of the strength of the HCl bond, which is not readily broken at preheat-zone temperatures, HCl is a poor chlorinating agent [36]. Temperatures in excess of 1600 OF (1144 K) are necessary for direct reaction of HCl or liberation of C1 by bimolecular reaction with hydroxyl radical (OH) [20,36,37].
In contrast, molecular chlorine (ClZ) can be a very efficient chlorinating agent. C12 can react directly with radicals such as phenyl (CgH5.) to produce chlorobenzene (CgH5CI).
C12 also thermally decomposes to chlorine atoms (Cl) at approximately 900 OF (755 K). C1 can then chlorinate hydrocarbons through hydrogen atom displacement.
Although this reaction is slow and the reverse is favored, trace quantities of CHCs can be formed if C12 is present [36].
The Deacon reaction,
results in the conversion of HCl to C12 [38]. This reaction is usually considered unimportant in high-temperature combustion because the equilibrium lies suongly to the

I June 1993 Page 119
left above 1400T (cf. Figure 5.5). However, at typical preheater temperatures, e.g., 800 O F
(700 K) to 1200OF (922 K), equilibrium favors the formation of molecular chlorine (C12).
Figure 5.5 Equilibrium vs. temperature for the Deacon Reaction: 4HCl+ 4 = 2CI2 + 2H20.
If equilibrated, the gas-phase Deacon reaction can result in chlorination of hydrocarbons, but the reaction'is slow at preheater temperatures [38, 391. The reaction is known, however, to proceed rapidly between 850 O F (728 K) and 1200 OF (922 K) in the presence of copper catalysts [38]. Furthermore, research on the reverse Deacon reaction has demonstrated that group II alkali metal oxides and hydroxides (i.e., calcium and magnesium) can also act as catalysts [40]. Specifically, the oxides may catalyze the process

June 1993 Page 120
via the following sequential reactions which occur readily at 850 OF (728 K) and 1000 O F
(8 11 K), respectively.
The hydroxides can also catalyze the overall reaction in the same temperature range via a slightly different set of reactions.
Thus from a theoretical perspective, it may be possible to form CHCs in trace quantities in the preheat zones of both dry- and wet-process kilns. Although initially counter-intuitive, increases in temperature and oxygen concentration may actually increase yields because increased 0 2 shifts the equilibrium of the Deacon reaction towards C12 and increased temperature increases the rate of conversion of HCl to C12.
5.4 Reliability of Data
The analysis presented in this report is based on 20 sets of data obtained at various cement kilns from 1974 through 1992. Most of the data prior to 1990 were obtained under sponsonhip of the US EPA office of Research and Development as part of a program to assess the viability of burning hazardous waste in cement kilns. The data generated in 1991 and 1992 have been largely related to BIF compliance testing.
Over this period, the research and compliance testing communities have learned much about how to conduct field studies. As such, the quantity and quality of data has tended to increase in the latter studies. For example, congener-specific analyses of PCDDs and PCDFs were routinely conducted in latter tests and sensitivity of analytical techniques have improved to the point that concentrations less than 0.1 ngldscm of specific isomers have been detected. In earlier studies, detection limits were 1 to 2 orders of magnitude higher. Thus, one cannot compare results of early studies (based on detection limits) to recent studies where much lower levels are reported.
This same type of observation can be made for POHC DREs and PIC concentrations. Many POHC DREs and PIC yields in earlier studies were based on worst-case detection limits. Furthermore, because the extent of PIC analyses were much more limited in the earlier studies, one cannot readily compare total PIC yields from test to test. This difficulty is even a problem in recent tests where the level of detail in various studies is not the same. Consequently, we do not routinely intercompare results from different facilities unless a truly viable basis for comparison can be established.

June 1993 Page 121
When attempting to correlate data trends with process parameters, it was apparent that some critical process data were not available for some studies. Consequently, it was not always possible to determine the origin or mechanism of formation of a particular pollutant.
Notwithstanding the difficulties in interpreting the available data base, it should be emphasized that the data base in burning hazardous waste in cement kilns is probably more complete than for most combustion sources (including hazardous waste incineration). In fact, the emission data base is extraordinarily detailed (cf. Appendices I1 and In) because of the improved ability to target likely PICs for analysis, as well as to sample and analyze with greater sensitivity. However, because of the greater lever of detail with studies of cement kilns versus hazardous waste incinerators, direct comparisons of these two combustion sources can be very misleading.
5.5 Test Results
Significant organic emissions data and process data are available from 20 studies of 16 cement kilns burning hazardous wastes (cf. Table 5.16). These studies generated 6 data sets on burning
Table 5.16 Summary of organic emission tests.

June 1993 ,122
Table 5.16 (Con't) Summary of organic emission tests.
I
,4 trichlorobenzene.
1.1.1 hichlomethane Liquid Waste: 1.2.4 hichlombenzene. tetrachlomahene
tetrachlorcethene I I
liquid wastes in wet-process kilns, 8 data sets (from 5 kilns) on burning liquid wastes in preheater-type, dry-process kilns, 3 data sets on burning solid wastes via mid-kiln injection in I wet-process kilns, 2 data sets (from 1 kiln) on burning solid waste via feed-end injection in precalciner, dry-process kilns and 1 data set on injecting powdered waste at the discharge end of a wet-process kiln. To our knowledge, no data is currently available on introduction of solid 1 waste at the feed end of preheater kilns, nor are there any directly. relevant laboratory or pilot- scale studies.
5.5.1 POHC Emlssions
Appendix II summarizes the available POHC emission data [41-631. This table includes baseline (fuel only) emission rates, emission rates during waste burning, and
I m
S*lFlc, BOARD
I I

June 1993 Page 123
DREs that are uncorrected for baseline emissions or other possible anomalous sources (e.g., scrubber water, sampling train contamination).
Except for the anomalies discussed below for some of the earlier studies where data quality can be questioned, DREs for stable POHCs fed as liquid waste to the discharge-end either exceeded 99.99% or were based on emission detection limits. DRE measurements for feed of solid wastes have been limited to the POHCs 1,2,4 mchlorobenzene (TCBz), l,l,l-trichloroethane (TCA), and monochlorobenzene (MCBz). DREs for the highly stable TCBz ranged from 99.9996 - 99.9998% at the one precalciner and two wet-process kilns that were tested. TCA was introduced with both the liquid waste at the discharge of the kiln and with the solid waste at mid-process. DREs consistently approached 99.9999% for this thermally fragile POHC. Worst case DREs can be calculated for the TCA fed at mid- process by assuming all of the TCA fed as a liquid is destroyed and all emissions are due to the TCA fed at mid-kiln. Even on this basis, DREs for TCA range from 99.9986 - 99.9999%.
Although the vast majorities of the DREs were greater than the regulatory requirement of 99.99 percent, there were some exceptions including the data set from Plant E, methylene chloride at Plant H and Plant I, toluene at Plant K (1987) and Plant J, monochlorobenzene(MCBz) at Plant M (1990) and Plant K, and less than the TSCA requirement of 99.9999 percent DRE for PCBs at Plant B.
The apparent failure for methylene chloride has been attributed to high background1 blank concentrations. In the case of Plant E, the observed DREs were fairly consistently below 99.99 percent. Interpretation of this older data is confused by high baseline levels of the POHCs when only fuel oil was burned. It is not clear if these baseline levels were due to uptake by the kiln material of the POHCs during waste bums followed by release during the baseline burn, or whether the POHCs were present in or generated by combustion of fuel oil in the presence of the raw meal. In either case, baseline levels could not account for the lower-than-acceptable DREs. The most likely reason for failure was the poor atomizer design. The waste nozzle was positioned off-center and parallel to the fuel-oil gun. The spray was poorly atomized and the spray angle was maintained narrow to prevent impingement on the kiln walls. These results suggest that good combustion practices are still necessary to achieve regulatory levels of desmction of POHCs, in wet-process kilns.
In the case of the DREs observed for PCBs burned at Plant B, it was noted that high levels of PCBs were found in the river water used to make the slurry feed to the cold end of the kiln. Test results showed no difference between the baseline and PCB bum emissions. Since the slurry water feed O~PCBS was not used in the DRE calculation, the 49.9999 percent DREs were attributed to the slurry water contamination.
Toluene DREs at Plant J and Plant K (1987) were 99.977 and 99.733, respectively. In the case of Plant J, baseline fuel runs clearly indicated that almost none of the toluene emissions were due to incomplete combustion of the liquid feed. At Plant K, main-stack concentrations were 500 times greater than those in the by-pass. (Data were not available to calculate DREs for the individual stacks.) This suggests that organic species may have been
S~::::Y
BOARD

June 1993 Page 124
evolved from the raw-meal feed in the preheater and were responsible for the majority of the main stack emissions.
Chlorubenzene DREs were less than 99.99 percent at both Plant M (1990), and Plant K based on the sum of emissions from the main stack and the by-pass stack; however, the DRE was consistently greater than 99.99 percent based on by-pass stack emissions only. At Plant M, MCBz main stack concentrations were similar for the runs where MCBz was spiked into the solids feed at the cold end of the kiln and the runs for where only unspiked liquid waste were burned, suggesting that the MCBz emission rate was independent of its input rate to the kiln. In contrast, the MCBz levels were higher in the by-pass stack when the spiked, solid waste was burned than when only unspiked liquids were burned, suggesting that DREs in the by-pass were unaffected by post-kiln MCBz formation. For the Plant K tests, DREs were greater than 99.99 percent in the by-pass stack but less than 99.99 percent in the main stack for some of the test runs in both April and December. When the data for both sets of tests were combined, a correlation was observed between MCBz emissions from the main stack and chlorine feed rates to the kiln.
The by-pass stack emissions are considered to be representative of combustion in the kiln and suggest that MCBz is.efficiently destroyed in the combustion zone. This further suggests that the less-than-99.99-percent DREs observed in the main stack were due to MCBz formation in the precalciner or preheater at Plant M or the preheater at Plant K. This point is further discussed in the following section.
5.5.2 Products of Incomplete Combustion
This section addresses available data concerning PICs other than PCDDs and PCDFs (cf. section 5.5.3). Data are available on PICs from tests at Plant E, Plant G, Plant H, Plant M (1990), Plant N. Plant L and Plant K. In several cases, many of the PICs observed during waste burns were also observed during baseline burns. In most cases, PIC analyses were not exhaustive nor designed to detect products expected to form from the specific waste being burned, thus complicating interpretation of the results.
PIC data from Plant E are based on GC (not GCJMS) screening analyses and thus are not considered exhaustive or quantitative. PICs typically encountered from most combustion sources such as phenol (2.4-11 ngls), benzaldehyde (10-18 ng/s), benzoic acid (3.5-48 ngls), substituted naphthalene (24-96 ngls), and anthracene (1.9-4.0 ngls) were observed from the waste combustion but not reported for the baseline testing.
Plant G provided limited data for PICs from coal combustion, benzene (120-530 ppb) and toluene (12-70 ppb) being the major PICs. Tr&e quantities of methylene chloride (0.2 ppb) and hichloroethane (0.4 ppb) were also observed during the baseline testing.
Benzene and toluene were the major PICs from coal combustion at Plant H with concentrations of 290 ppb and 30 ppb, respectively, in agreement with data from Plant G. Other substituted benzenes were observed with total emission rates of 15.6 ngls compared

June 1993 Page 125
to that of benzene of 36 ng/s. Naphthalene, methyl naphthalene and biphenyl were emitted at rates of 12.3, 8.3, and 2.5 ng/s, respectively.
Only scanning GCIMS analyses for PICs were conducted at PIant M while both full- scan and selected ion monitoring (SIM) GCMS analyses for PICs were conducted at Plant N, Plant L and Plant K. Because the SIM target analysis was for different compounds at each facility, interfacility comparisons are probably not valid. The PIC data for each of these facilities are presented in Appendix In.
At Plant M, which separately burned liquid and solid WDF, there were no major differences in main stack emissions for the coal-only bums and the liquid or solid waste burns. There may have been a small increase in non-chlorinated organic emissions when solid waste was burned, but there was a small decrease when liquid waste was burned. A similar trend may be m e for the by-pass when solid waste is burned.
For Plant N, there was a small but clear overall increase in emission of some chlorinated hydrocarbons when burning a combination of liquid and solid wastes over that emitted when coal-only or coal and diesel fuel were burned (cf. Figure 5.6). Hazardous
R Coal only
El Hazardous Waste and
D i e s e l and Coal Y Figure 5.6 Comparison of yield for the 10 most highly concenaated
chlorinated hydrocarbons at Plant N when burning liquid and solid WDF, diesel oil/wal, and coal-only.
waste burning also resulted in a slight increase in emissions of non-chlorinated organics

June 1993 Page 126
versus burning of coal only. However, substituting hazardous waste for diesel fuel seemed to reduce emissions of the non-chlorinated organic compounds.
Baseline versus liquid fuel comparison data were not available for Plant L; however, extensive emissions measurement data were available. Major organic emissions were formaldehyde, benzene, and acetaldehyde, acetone, toluene, and xylene with concentrations of 904, 602, 374, 299, 119, and 22.0 pgldsm, respectively, for the 40 percent liquid fuel case. Of the numerous PNAs that were tested, only naphthalene, phenanthrene, anthracene, fluoranthene, pyrene, chrysene, and benzo(b+k) fluoranthene were detected. Surprisingly, higher concentrations of Freon 11 3 were detected (284 and 600 pgldscm for 15 percent and 40 percent liquid fuel, respectively) with no obvious source. With the exception of benzene, emissions were generally lower when less liquid waste was burned.
For the Plant K which burned liquid WDF, nonchlorinated hydrocarbon emissions were greater in the main stack than the by-pass. With the exception of MCBz and some other chlorinated aromatic species, there was also evidence of increased emissions of chlorinated hydrocarbons in the by-pass versus the main stack (cf. Figure 5.7). A
H Bypass - Liquid Waste, T i s , Coal
k?4 Main Stack - Liquid Waste, T i s , Coal
I w ~ y p a s s - coal only I
Figure 5.7 Comparison of emission of halogenated hydrocarbons at Plant K observed in the main stack and by-pass stacks when burning liquid hazardous
waste and the by-pass stack when burning coal only.

dune 1993 Page 127
comparison of emissions for the coal-only baseline burns with the hazardous waste bum emissions for the by-pass stack suggests that there may be a reduction in hydrocarbon emissions when hazardous waste is co-6red. These data must be intermeted with care since -~ -
SIM analysis of MM-5 samples @PA Modified Method 5) that may have detected low levels of hydrocarbons, primarily PNAs, were not performed for the by-pass, condition I1 tests. However, SIM analyses were conducted on the main stack samples and the concentration of hydrocarbons were higher for the coal-only runs than for the hazardous waste bums in this comparison as well. Chlorinated hydrocarbons and fluorocarbon emissions were detected in baseline runs but were much lower than for the runs in which hazardous waste was bumed (cf. Figure 5.7).
Taken at face value, these differences suggest that the preheater section is partially destroving chlorinated hvdrocarbons emitted from the kiln, but hydrocarbons and their . - pyrolysis products are. bekg produced in the preheater tower. This behavior is evidence that the pplysis , chlorination and oxidation reactions described in section 5.3.7 are occurring.
Recall that at both Plant M and Plant K, it was also observed that measured DREs for the POHC chlombenzene were lower in the main stack than in the by-pass stack. In both cases, there was a correlation between the chlorobenzene emission rate and the feed rate in the by-pass but not in the main stack, indicating chlombenzene was being formed in the main stack. A correlation was observable, however, between chlorobenzene emission rate and chlorine input into the kiln. A plot of log chlorobenzene emission rate versus chlorine input rate gave? values of 0.76 and 0.99 for Plant K and Plant M, respectively (cf. Figure 5.8). A semi-logarithmic fit of this type is consistent with a mechanism of chlorobenzene fonnation that is due to a reaction between an organic precursor and chlorine that is first- order in both the precursor and the chlorine concentration.
In pre-compliance testing at Plant K, it was found that when the oxygen concentration and temperature in the preheater were slightly lower than during the compliance testing, that chlorobenzene DREs were greater than 99.99 percent. This is counter-intuitive since a lower temperature and a lower oxygen concentration would be expected to lower the DRE destruction efficiency. It is possible that the lower temperature may have been insufficient to drive the chlombenzene gas-phase fonnation reaction. However, the more likely explanation is the occurrence of the surface catalyzed chlorination mechanism discussed in section 5.3.7. In this mechanism, surfaces catalyze the oxidation of HCI to C12, the latter being a potent chlorinating agent. The yield of C12 is kinetically controlled at the preheater temperatures and should increase with increasing oxygen concentration and temperature.
Thus, slightly increased temperatures and oxygen concentration in the pre-heater tower observed at Plant K, can result in faster, more efficient, conversion of HCI to C1.L and result in formation of CHCs such as chlorobenzene. Current operating conditions in the preheater tower are in a region where slight changes in process can result in increased destruction or formation of CHCs. For CHC formation to be significant, it appears that there must be chlorine in the waste feed, catalysts in the raw meal, and sufficient oxygen and temperature

June 1993 ,128 I
-
-
-
- - - Plant M
0 . 6 r " ' ~ ' ' ~ ~ ' ' ' ' " ' ' ' ' ' ' ' ' ' ' ' ' ' ' ' 0 50 100 150 200 250 300
Total Chlorine Input (Ihlhr)
Figure 5.8 Chlorobenzene main stack emissions vs. kiln chlorine feed rate for Plant K . and Plant M.
0

June 1993 Page 129
in the preheater to drive the Deacon reaction and chlorination reactions; however, the temperature must be low enough not to initiate significant CHC destruction.
In some respects, it is surprising that any chlorinated compounds could be formed via chlorination in a cement kiln. It is frequently supposed that a highly alkaline environment, as is encountered within a cement kiln, should scavenge any available chlorine, making it unavailable for chlorination. To partially address this question, we have performed equilibrium calculations to determine the effectiveness of calcium (as CaC03, Ca(OH)2, or CaO) in capturing HCl as CaC12. The results of these calculations indicate that calcium captures about 90% of HCl as CaC12 at 260 OF (400 K) but this is reduced to 60% by 800 OF (700 K) and less than 1% at 1520 OF (1 100 K). However, these calculations also confirm the conversion of HCl to C12, with -2% yields of Cl2. Thus, even a highly basic species such as Ca(OH)2 would not be expected to effectively control CHCs (including PCDDs and PCDFs) formation at temperatures much above 400 O F (478 K) and be totally ineffective in the combustion zone. In light of the conversion of HCI to C12, one might even suspect that the reported effectiveness of Ca(OH)2 in preventing PCDDPCDF formation in low temperature APCDs may be due to a mechanism other than scavenging of HCl.
5.5.3 Emission of Chlorinated Dioxins and Furans
Appendix N summarizes PCDD and PCDF emissions data for three cases where kilns were burning liquid wastes (Plants K, L and M) and three cases where kilns were burning a combination of liquid wastes and containerized solid wastes (Plants M, 0 and P). Plant N emissions data is also included as it injects solid wastes; however, it does not follow the practice of containerizing the solids and i n j e c ~ g them at mid-kiln. The solids at Plant N are injected at the discharge end of the kiln. The addition of Plant N in this analysis represents the only consideration of solids injection at any location other than mid-kiln.
PCDD and PCDF emissions were very low at all three facilities burning liquid wastes, as the total PCDD and PCDF concentrations ranged from ~0.271 - 3.50 and 0.341 - 7.82 ng/dscm, respectively. These concentrations are on the low end of those reported for hazardous waste incinerators and are one to three orders of magnitude less than those typically reported for municipal solid waste incinerators (MSW) [64-681.
The data for burning solid wastes is far more varied. Total PCDD concentrations ranged from a low of 1.72 ng/dscm for the dry-process, precalciner type kiln at Plant M, to a high of 439 ng/dscm for the wet-process kiln firing non-containerized solids at Plant N. With the notable exception of the most recent tests at Plant P, the wet-process kilns had much higher PCDD concentrations than the precalciner kiln (cf. Table 5.17 and Figure 5.9). PCDF concentrations varied less, but the wet-process kilns still tended to have higher stack concentrations than the precalciner kiln. The range of PCDDPCDF concentrations brackets that typically reported for hazardous waste incinerators, and the PCDD concentration of 439 ngldscm approaches that reported for MSW incinerators [64-681.

June 1993 Page I30 I
Plant M
Plant 0
Plant P (4/92)
Plant P (1 1/92)
I3 Plant N
TCllD F'eCDD HxCDD HpCDD W D Total
Figure 5.9 Comparison of PCDD emissions from four kilns burning solid waste. m Table 5.17 Summary of PCDDiPCDF emissions data and process data for kilns burning solid
waste.

June 1993 Page 131 - -- -
Table 5.17 (Con't) Summary of PCDDPCDF emissions data and process data for kilns burning solid waste.
At least partially. because of limitations on availability of process data, no conclusive correlation could be made with parameters suspected to influence PCDDPCDF yields. However, there were possible positive correlations with chlorine mass input rate, main stack THC and a negative correlation with O2 (i.e., the higher the kiln oxygen concentration, the lower the PCDD concentration).
Both gas-phase and surfacecatalyzed theories of PCDDPCDF formation have been proposed, although the latter theory has gained prominence in recent years [69-731. The purely gas-phase chlorination of hydrocarbon precursor species (e.g., unchlorinated dibenwfuran) to form highly chlorinated PCDDsPCDFs appears to be an unlikely event based on the kinetics of chlorination reactions. Thus, if the gas-phase formation mechanism is dominant, it would appear to require that chlorinated precursors (e.g., chlomphenols and PCBs) be already present in the waste feed [69] or that these precursors be pyrosynthesized from highly chlorinated waste components such as mchloroethylene.
Kiln 4 (96)
2.75
a
Research on the surface-catalyzed mechanism suggests that hydrocarbons may be chlorinated on surfaces if sufficient chlorine is available and if temperatures are low enough for significant surface.absorption to occur [69-731. For this reason, the surface theory presupposes the existence of low temperature (typically 600°F) reaction sites. Furthermore, because the chlorination steps are sequential and each step is less probable than the previous one, congener distributions are likely to be skewed towards the less chlorinated species.
Plant P Nov. 1991
(wet)
For the kilns studied, the PCDD congener dismbution peaks at the hexa-congener; however, the PCDF congeners concenaations decrease with increasing chlorination (the tetra-congener is the least chlorinated that was analyzed). This suggests that the PCDDs are formed from specific chlorinated precursors present in the waste feed, either by a gas-phase mechanism or a surface catalyzed condensation reaction involving the chlorinated precursors.
THC b m )
18
The specific precursor thwry is suppoxted by the data shown in Figure 5.10, which compares the yields of 3 chlorinated benzene derivatives at Plant M, Plant P (April 1992). and Plant 0. In contrast to the PCDD data, which showed the highest PCDD concentrations at Plant P (a wet kiln), these data show the highest yields of chlorinated benzene derivatives at Plant M (a precalciner kiln).
CO m m )
628
Total PCDD
( n d k m )
5.79
PCDF (ngldscm)
5.96
CI input ~bs/hr)
836

June 1993 Page 132
I3 Plant M Plant P . Plant 0 T
Chlorobenzene 2chlorophenol 1.3- dichlorobenzene
Figure 5.10 Comparison of emission of chlorinated benzene derivatives at 3 kilns burning solid waste.
The higher yields of chlorinated benzene derivatives at the precalciner, dry-process kiln are entirely consistent with the surface-catalyzed chlorination mechanism discussed in Section 5.3.7. If PCDDs were fonned by the same mechanism, one would expect the highest concentrations to be observed at the same facility. In fact, the exact opposite was observed. Thus it appears that the yields of PCDDsIPCDFs and emissions of chlorinated benzene derivatives may be the result of different pathways. Gas-phase or surface- catalyzed reaction of chlorinated precursors being responsible for the PCDDJPCDF emissions and surface-catalyzed chlorination of hydrocarbons being responsible for the chlorinated benzene derivative emissions.
A question then arises as to why one wet kiln has higher PCDDKDF emissions than another. An obvious explanation is that the necessary precursors are not present in the feed material of all the kilns. Without detailed data on the waste feed composition, it cannot be determined if this is the cause.
The efficiency of combustion within the kiln can also have an impact; for example, if the necessary precursors are destroyed, they cannot react to form PCDDsPCDFs. The combustion efficiency is expected to have less effect on the surfacecatalyzed chlorination mechanism than on the chlorinated precursor mechanism. The lesser dependence on combustion efficiency for the surface-catalyzed chlorination mechanism in cement kilns is because the necessary hydrocarbons can be obtained by their release from the raw meal,
s~;:::Y
BOARD
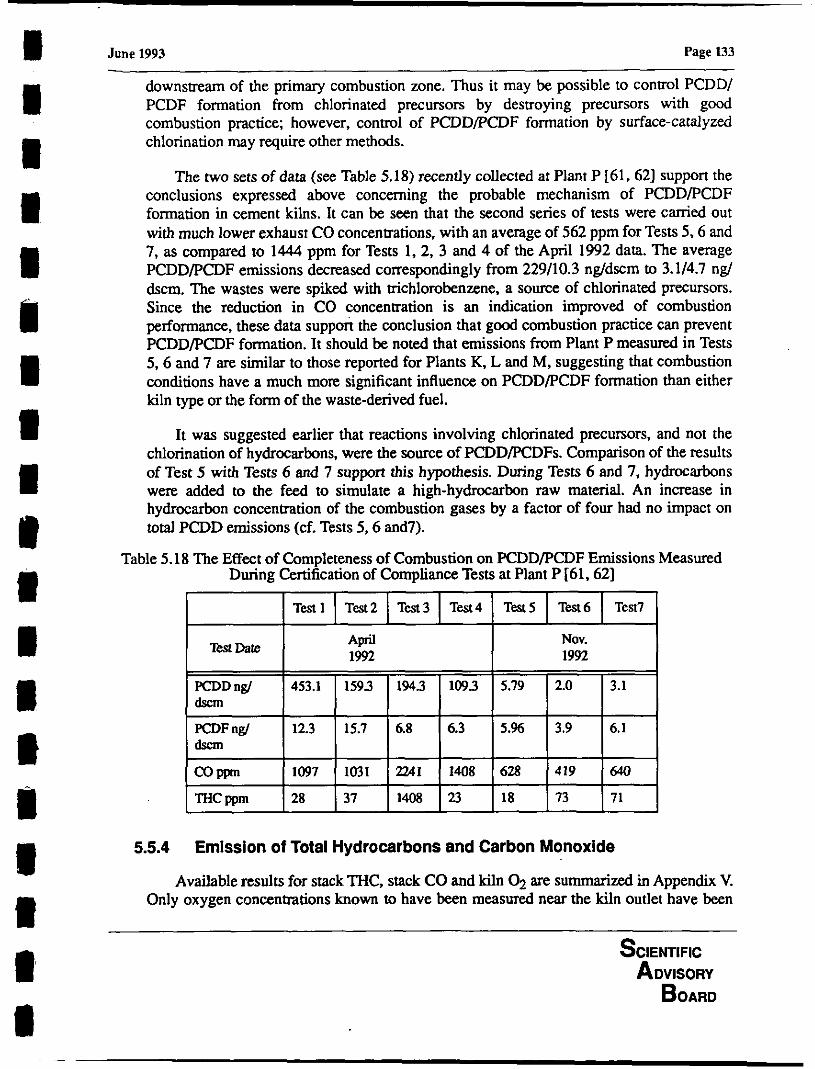
June 1993 Page 133
downstream of the primary combustion zone. Thus it may be possible to control PCDDI PCDF formation from chlorinated precursors by destroying precursors with good combustion practice; however, conml of PCDDIPCDF formation by surface-catalyzed chlorination may require other methods.
The two sets of data (see Table 5.18) recently collected at Plant P 161,621 support the conclusions expressed above concerning the probable mechanism of PCDDPCDF formation in cement kilns. It can be seen that the second series of tests were canied out with much lower exhaust CO concentrations, with an average of 562 ppm for Tests 5.6 and 7, as compared to 1444 ppm for Tests 1, 2, 3 and 4 of the April 1992 data. The average PCDDPCDF emissions decreased correspondingly from 229110.3 ng/dscm to 3.114.7 ng/ dscm. The wastes were spiked with trichlorobenzene, a source of chlorinated precursors. Since the reduction in CO concentration is an indication improved of combustion performance, these data suppon the conclusion that good combustion practice can prevent PCDDPCDF formation. It should be noted that emissions from Plant P measured in Tests 5.6 and 7 are similar to those reported for Plants K, L and M, suggesting that combustion conditions have a much more significant influence on PCDDPCDF formation than either kiln type or the form of the waste-derived fuel.
It was suggested earlier that reactions involving chlorinated precursors, and not the chlorination of hydrocarbons, were the source of PCDDKDFs. Comparison of the results of Test 5 with Tests 6 and 7 support this hypothesis. During Tests 6 and 7, hydrocarbons were added to the feed to simulate a high-hydrocarbon raw material. An increase in hydrocarbon concentration of the combustion gases by a factor of four had no impact on total PCDD emissions (cf. Tests 5.6 and7).
5.5.4 Emission of Total Hydrocarbons and Carbon Monoxide
Table 5.18 The Effect of Completeness of Combustion on PCDDPCDF Emissions Measured During Certification of Compliance Tests at Plant P 161,621
Available results for stack THC, stack CO and kiln O2 are summarized in Appendix V. Only oxygen concentrations known to have been measured near the kiln outlet have been

June 1993 Page 134
listed since dilution will considerably affect the values measured in the stack. Even with this restriction, interfacility comparisons of measured "kiln" oxygen are still probably tenuous.
CO and THC are currently used as continuously monitored surrogates for PIC emissions from hazardous waste incinerators and the same use has been proposed for cement kilns [63]. However the utility of these measurements has come under question because: I), CO generated in the calcining of CaC03 can swamp combustion-generated CO in most kilns; and 2), THC generated by heating of the raw meal can swamp combustion- generated THC. However, the problem may be somewhat alleviated in dry-process kilns with a by-pass stack because raw-meal THC is volatilized in the preheater (which is up- stream from the by-pass stack) and the by-pass typically has very low background THC levels.
Nevertheless, the US EPA has devoted considerable time to determine if THC can serve as a suitable surmgate for PIC emissions. One concern is that conventional CEM THC analyzers have an unheated sample line and ice bath chiller in order to drop out moisture which could also drop out higher molecular-weight compounds. Thus, a modified "hot" THC technique has been developed in which the sample line is heated to 302 O F (423 K) [54,55]. In tests at Plants M and N, the measured THC for the "hot" and "cold" THC monitors were compared to the total organic mass (TOM) emission t55.561. TOM was measured using a Method 0010 train designed to trap all organic material. Analyses were then conducted using GC for the C1-C7 and the C8-C17 fractions and by gravimetry for >C17, the sum of these fractions representing TOM.
The TOM and THC data for Plants M and N are summarized in Appendix V. The cold THC values typically varied between 50 and 70 percent of the hot THC values, the difference being attributed to losses in the cold trap. The hot THC values typically mged from 75 percent to 110 percent of TOM while cold THC values were typically 35 percent - 75 percent. The C1 - C7 fraction consistently averaged about 70 percent of the TOM, with methane, ethane, and ethylene being about 30 percent of the C1 - C7 fraction. At Plant N, TOM was higher when burning hazardous waste than when burning coal, but was comparable to TOM when burning diesel and coal. There were no significant changes in TOM in either the by-pass or main ducts under any of the conditions at Plant M. The increase of 6.8 ppm TOM when going from coal to liquid waste was the largest variation.
Although the hot THC agreed better with the TOM measurements, both hot and cold THC appeared to correlate with TOM for the wet-vrccess kiln where both measurements were mahe in the same stack (cf Figure 5.11). ~ inEe the conventional cold THC analyzer proved much more reliable, it was concluded that there was no significant advantage of a hot THC analyzer over a coldTHC analyzer.
Even with this background research, however, it has proven difficult to observe consistent correlations between THC and CO and burning waste. THC emissions increased during waste burning at Plants E, H, I, N (vs. coal baseline), M (1990) (when burning solid and liquid waste vs. fuel oil baseline), and K (under condition I vs. a coal only baseline).
S~.":::,".Y
BOARD

June 1993 Page 135
20.0 0 10 20 30 40 50 60
THC (ppmv) Figure 5.1 1 TOM vs. "cold" THC for Plant N.
-
- -
- Plant N
THC decreased at Plants B (vs. a coal baseline) and M (when buming only liquid waste) and remained essentially constant at Plants C, N (vs. coaVdiesel fuel baseline) and K (condition II). CO emissions appeared unrelated to waste combustion in the earlier pre- 1990 tests but clearly increased over baseline fuel runs for the tests at Plants N, M, and K.
Data are available from the main and by-pass stacks at Plants M and K. At Plant M, by- pass stack THC levels were only 2-6 ppm lower than the main stack for each condition. CO levels were 300 to 600 ppm lower in the by-pass. At Plant K, THC levels were 80-100 ppm lower in the by-pass, while CO levels were 140 - 200 pprn lower. However, CO did not typically correlate with THC. It is clear from the lack of any definitive pattern in the data that neither CO nor main stack THC are suitable surrogates for PICs. The strongest correlations observed in any tests were for THC vs. kiln 02. This was particularly evident for Plants L and P. where the most data were available.
The data for the Plant P, wet-process kiln which burns solid and liquid waste, show a clear relationship between THC and stack 02 (cf Figure 5.12). When the oxygen concentration was maintained at >5.5 percent (corresponding to a kiln oxygen level of -3 percent), THC concentrations were < 20 ppm, regardless of the fuel type. As the oxygen concentration was decreased, the THC increased. This increase was fastest for bags of solid waste, slowest for coal, and intermediate for pails of waste. This data indicates that: I), it is somewhat more difficult to efficiently burn solid waste than coal, but 2). if the oxygen concentration is maintained at 54.5 percent, THC can be controlled regardless of the fonn of the solid fuel feed.

June 1993
Oxygen Concentration (percent)
Figure 5.12 THC vs. 02 for different fuels for the Plant P wet-process kiln.
5.6 Discussion of Environmental and Regulatory Implications
Consideration of the available field data and simple theoretical models have. identified three key issues related to burning hazardous waste in cement kilns. These are:
1. Potential for emissions from waste introduced at any point other than the discharge end of the kiln;
2. Potential for formation of PICs (including PCDDs/PCDFs) in the preheat zones of the cement kilns; and .
3. Identification of POHC DRE and PIC emission surrogates in light of the concerns about CO and THC.
Our cu=ent technical understanding of these issues, as well as the environmental and regulatory implications of our findings, are summarized in the following paragraphs.

June 1993 Page 137
5.6.1 Emissions Due to Waste Introduced at "Mid-Process"
Results from both kinetic modeling and field studies are sufficient to suggest that both POHCs and PICs are efficiently destroyed when fed at the clinker discharge end. Although PIC data indicate that there is some increase in CHC emissions when burning hazardous waste, the increase appears minimal from a health or regulatory perspective. Also, the data indicate a surprising decrease in hydrocarbon emissions when burning hazardous wastes. This decrease could possibly be due to chlorine acting as an oxidizer in an otherwise reduced oxygen system. In any event, there is no obvious increase in overall organic emissions when waste is i n d u c e d at the discharge end of the kiln. For a well-managed facility, there should be little problem in meeting reasonable regulatory or environmental targets.
The data on mid-process waste introduction is less complete, but highly encouraging. Kinetic modeling suggest that introduction of waste at mid-kiln in long, wet-process kilns should result in DREs of greater that 99.9999% for even the most stable POHCs. Experimental DRE data is available on 1.2.4 TCBz and 1.1.1 TCA for two of these kilns and DREs were consistently 99.999 - 99.9999%. 1,2,4 TCBz is a very stable compound and these results support the kiln performance; however, 1,1,1 TCA is a fragile POHC which is not expected to significantly challenge kiln performance for solid waste fed at mid-kiln. PIC data are also limited, however, the data for three PICs (chlorobenzene, 2-chlorophenol, 1.3-dichlmbenzene), which are usually high-yield, stable PICs in most waste combustors, show concentrations of only 0.1-3 pgldscm. These are low concentrations for these types of PICs. Although more data is clearly desirable, the available data suggest that normal kiln operation is sufficient to ensure POHC DREs and that combustion-generated PIC emissions are within currently acceptable regulatory and environmental standards.
However, there is some anecdotal evidence that if solid wastes are not properly introduced at mid-kiln, that burnout of the solid residue may not be complete. The operating conditions and physical properties that are required for efficient combustion of solid wastes fed at mid-kiln are well known in the industry and documented in the patent literature [74-771. Strict adherence to the guidelines outlined in these documents would appear to be prudent in light of the relative inexperience of the industry with burning solid waste.
There are only two precalciner kilns burning wastes introduced at the feed-end of the kiln and there are no preheater kilns currently burning solid waste (although Plant K anticipates operation in this mode in 1993). Only data from Plant M is available on precalciner kiln performance. This data again shows 99.999 - 99.9999% DREs for 1,2,4 TCBz and 1,1,1 TCA. PIC data is again limited to chlorobenzene, 2chlorophenol, and 1.2 dichlorobenzene. However, concentrations are 2-10 times greater than at the two, long wet kilns where waste was introduced at mid-kiln. These results support some of the concerns indicated by the kinetic modeling effon that feedend, waste introduction may not control very stable POHCs and PICs to acceptable environmental or regulatory levels.

June 1993 Page 138
A major question for precalciner kilns has been whether introduction at the feed end in these kilns is equivalent to mid-kiln induc t ion in long, wet-process kilns. Although theses two types of kilns are designed to give the same timeltemperature profile for the raw- meal feed, available gas-phase temperature data indicate that precalciner kilns have lower gas temperatures. These relatively low precalciner gas temperatures were responsible for the breakthrough of some POHCs predicted by the kinetic modeling. Although, it is possible that portions of the precalciner are hotter than the quoted temperatures, the experimental data are not available to clearly resolve this question.
The kinetic modeling for preheater kilns burning waste introduced at the feed end of the kiln gave similar results to those for precalciner kilns. Although some additional POHC destruction was predicted in the preheater section, the effect was modest, reducing emissions by a factor of typically about 50%. Because feed-end introduction in preheater kilns is not mid-process in the sense that it is for precalciner kilns, there are some additional concerns over emissions resulting from solids fed to these types of kilns.
Experimental studies of SF6 destruction have recently been completed at Plant K. Although the data are highly preliminary, the SF6 results suggest that greater than 99.99% DRE can be achieved for stable organic POHCs. No PIC data is available for these facilities. Planned future testing at Plant K for POHC DREs and PIC emissions will be critical to determining the viability of preheater kilns for burning solid hazardous waste.
5.6.2 PlCs Formed In Preheat Zones
At Plant K there was clear evidence of reformation of chlorobenzene in the preheater section of this dry-process kiln. At Plant M there was equally clear evidence of chlorobenzene reformation in the preheater andlor precalciner of this facility. Comparisons of data for chlorobenzene. 2-chlomphenol and 1.2 dichlorobenzene at Plants M. 0, and P show higher concentrations at the Plant M preheater/precalciner kiln than at either of the two wet-process kilns. These data further support the possibility of the formation of chlorinated (aromatic) PICs in preheaters.
Because it is possible to sample before and after the preheater in dry-process kilns, this reformation phenomenon is readily observable in these types of kilns. Although, similar conditions may also be present in the preheat zones of l o n ~ ~ ~ e t - ~ m c e s s kilns, they are not amenable to direct testing. Although the formation of chlorobenzene at Plant K did not represent a health risk, it does raisequestions about reformation of other PICs with higher health risks.
Some researchers have proposed mechanisms of PCDDJPCDF formation on surfaces that are very similar to those that we have been previously considering for chlmbenzene formation. In light of the relatively high PCDD concennations reported at Plants 0 and P, we must seriously consider the possibility of PCDD formation in the preheat zones of long, wet kilns burning solid waste.

June 1993 Page 139
Unfortunately, the data are not consistent enough nor complete enough to resolve the source of PCDDs. Chlorobenzene was observed to reform in the two dry-process kilns; however, the PCDDPCDF concentrations were low. PCDDs were observed in the three wet-process kilns; however, the chlorobenzene concentrations were low. This observation would argue for different mechanisms of formation, such as formation from specific precursors for the PCDDs and surface catalyzed chlorination for the chlorobenzene, 1.2- dichlorobenzene, and 2-chlorophenol. Detailed knowledge of the waste feed compositions and better understanding of the rate of surface-catalyzed chlorination reactions are needed to begin to resolve the question.
If the formation of these compounds is from precursors in the gas phase, then combustion must be improved to destroy the precursors. Alternatively, although less practical, the precursors should not be accepted in the waste feed. If the mechanism of formation is via surface-catalyzed chlorination, several control approaches are available. One simple, but less desirable, approach would be to limit the chlorine input rate. It is known that reducing the chlorine input reduces chlorobenzene formation in preheaters; however, the available process data is not sufficient to determine whether reducing the chlorine content of the waste will control PCDD formation.
A second approach would be to reduce the quantity of hydrocarbons entering the preheat zones through better desmction of hydrocarbons in the kiln; however, this would only be effective if combustion was the source of the hydrocarbons. As previously pointed out, the raw meal may be the dominant source of hydrocarbons and it may be necessary, therefore, to control raw-meal hydrocarbons. Preliminary data suggests that the temperature in the ball mill of preheater kilns may be sufficient to volatilize hydrocarbons from the raw meal prior to entering the preheater. However, a portion of these hydrocarbons may recondense on the particles in the APCD which are subsequently reintroduced to the preheater. If process modification can be made to pre-volatilize hydrocarbons for all types of kilns and prevent their introduction to the preheat zones, then it may be possible to effectively control both PCDDs/PCDFs and PICs such as chlorobenzene.
A final alternative is to adjust the conditions in the preheat zones to prevent formation. If practical, this might include temperature or oxygen concenfration reductions. Additionally, some consideration could be given to introducing a catalyst poison.
For any of these systems to be applied, it is clear that much more most be learned about the origin and mechanism of formation of PICs such as chlorobenzene and PCDDd PCDFs.
5.6.3 POHClPlC Surrogates
Although available data generally indicate that cement kilns are capable of destroying even the most stable molecules, the technology may still be susceptible to process upsets

June 1993 Page 140
resulting in measurable increases in emissions. Thus, to be viable, a reliable continuous monitor of system performance must be identified.
CO is clearly inappropriate due to CO emissions from the raw meal. In addition, the use of THC has several difficulties. First of all, THC appears to be volatilized from the raw meal in quantities that far exceed the combustion-generated THC. It has been proposed that the problem can be circumvented in dry-process kilns by measuring THC in the by-pass stack, which is not impacted by THC released in the preheater or precalciner. However, this approach has limitations as THC in the by-pass cannot be representative of PICs found in the preheater such as MCBz and possibly PCDDs/PCDFs.
It has been argued that preheater PICs are unrelated to the combustion process and therefore should not be included in the emissions evaluations. It is clear, however, that the source of chlorine is waste combustion in the kiln and, regardless of the source of THC, the preheater PIC emissions are indeed correlated with the burning of hazardous waste. Furthermore, since credit is given for POHC destruction in the preheater, then the impact of PIC formation should also be included in any environmental assessment. Thus it appears that the concentration of any viable surrogate must correlate with PIC formation in the preheater since this may indeed be the major source of PIC emissions.
This logic would seem to require that continuous monitors be located in the main stack for all types of kilns. One approach would be to remove THC from the raw meal upstream of the monitor and preheat zones such that THC measurements only reflect combustion- generated THC. As pointed out in the previous section, preliminary data suggest that "warm" or "hot" ball mills in a preheater kiln may remove raw-meal THC. This approach has the significant added benefit of controlling PICs related to raw-meal THC. It may also be possible to design a unit to economically remove THC from the raw meal in a wet- process kiln. Other than installing by-pass stacks on all wet-process kilns and somehow correlating by-pass PICs with main stack PICs, and co~relating by-pass THC with either or both types of PICs, the upstream-THC-removal approach would appear to be the only viable method for utilizing THC as a continuously-monitored surrogate.
An alternative approach is to identify a new surrogate or surrogates for continuous monitoring. One surrogate that has been previously proposed for POHC DRE is sulfur hexaflouride. This compound is theoretically only susceptible to unimolecular decomposition by sulfur-fluorine bond rupture. Thus its decomposition is only related to its time/temperature history in the kiln and is unrelated to the oxygen concentration or degree of fueUair mixing. The kinetic model results presented in Section 5.3 and the DRE results from Plant K suggest that SF6 should have a lower destruction efficiency than any organic POHC under either oxidative or pyrolytic conditions. Thus, a DRE for SF6 of > 99.99% (or slightly less) should ensure organic POHC destruction of > 99.99%. Thus SF6 would appear to be an appropriate surrogate for POHC DRE.
Current knowledge of combustion processes, however, strongly suggest PICs are formed primarily under oxygen-starved conditions; therefore, since SF6 destruction is not sensitive to oxygen concentration, SF6 alone would not make a good surrogate for PICs.

June 1993 Page 141
However, if a second surrogate, indicative of oxidation conditions, can be identified, then a combination of this new compound with SF6 could serve as a general POHCJPIC surrogate.
The situation could be as simple as monitoring oxygen at the kiln exit (or stack if corrections for air leakage can be made). The data presented in Figure 5.12 indicate the correlation of oxygen concentration with THC. Thus one might consider SF6 as a surrogate for two of the three T's required for good combustion, time and temperature, and kiln (stack) oxygen as an indicator of the elimination of fuel-rich pyrolysis pockets or the third T, turbulence (mixing).
One concern, however, is whether a kiln-oxygen measurement reflects oxygen availability at the microscale level. Although difficult to prove from a fundamental viewpoint, practical macroscale correlations such as that shown in Figure 5.12 suggest that an oxygen measurement at the kiln exit may suffice. The alternative is probably an unsatisfactory approach such as introduction of a separate oxidation surrogate. Fluorobenzene would be an appropriate choice from the viewpoint of its being more susceptible to oxidative attack (via H abstraction by OH) than pyrolytic attack (F displacement by H). Furthermore, it should not present in waste snearns in amounts sufficient to interfere with its emissions measurement as an additive surrogate. However, the economic feasibility of any additional surrogate may force the use of kiln oxygen as a macroscopic oxidation surrogate.

June 1993 Page 142
1 Hansen E.R., Ash Grove Cement Company, 8900 Indian Creek Parkway, Suite 600, Overland Park, Kansas 66210, Feb. 1992.
2 Garg S., Emissions testing of a wet cement kiln at Hannibal Missouri, Draft Interim Report. EPA 530fSW-91-017, U.S. EPA, Office of Solid Waste, Washington D.C., 1990.
3 Hastings, K.A., and Hereth, M.L., Factors Influencing Hydrocarbon Emissions From Cement Kilns, New RCRA Regulations for Indusmal Boilers Furnaces and Incinerators, AWMA, 1992.
4 Portland Cement Association (PCA), An Analysis of Selected Trace Metals in Cement and Kiln Dust, 1992.
5 Weitzman L., Cement Kilns as Hazardous Waste Incinerators, 2(1):10-14,1983.
6 Peray K.E., The Rotary Cement Kiln 2nd ~dition, Chemical Publishing Co., New York, NY, 1986.
7 Weber P., Heat Transfer in Rotary Kilns, Bauverlag GmbH, Wiesbaden, Berlin, 1963.
8 Federal Register, February 21, 1991, July 17, 1991, August 27, 1991, September 5, 1991 and August 25,1992.
9 Peny's Chemical Engineers' Handbook Sixth Edition, McGraw-Hill, New York. NY, 1984.
10 Sprung S., Technological Problems in Pyroprocessing Cement Clinker: Cause and Solution, Research Institute of German Cement Industry, 1985.
11 von Seebach, M. & Tompkins J.B., Metal Emissions Are Predictable, Rock Products, 31-35, April 1991.

June 1993 Page 143
Wolter A. & Hansen E.R., IEEE Conference, Dallas, Texas 1985.
Ritzman H., am.-Kalk-Gips 24(8), 338, 1971.
Mesas. F. L. Smidth & Co., Behavior of Volatile Matters, Cement Production Seminar, 1975.
Biege N.W. and Parsons L.J., Pit & 0- 71(1), 91,1978.
Peter M.F., ICS Proceedings 25, 1978.
Ritzman H., Rock Products 77(2), 66, 1974.
Clark W.D. et al., Spiking,Time Required for Metals Emissions to Approach Steady State in Cement Kilns Burning Hazardous Waste, Energy and Environmental Research Corp, Iwine, CA, 1992.
Southdown Cement Corp, The Dixie plant Certification of Conformance documents, 1992.
Edwards J. B., Combustion. The Formation and Emission of Trace S ~ e c i e ~ , Ann Arbor Science Publishers, Inc., Ann Arbor, Michigan, 1977.
Lea F. M., The and Concr& Chemical Publishing Co., Inc., New York. NY, 1970.
22 Peray K. E., n e Rotarv Cement Kiln, 2nd ed., Chemical Publishing Co., Inc., New York, NY, 1986.
23 Delliiger B., Toms J. L., Rubey W. A., Hall D. L.,Graham J. L. , and Carnes R. A., Hazardous Waste Vol. 1 , No. 2, 1984.
24 J. L. Graham, D. L. Hall, and B. Dellinger, -Sci. Vol. 20, p. 703, 1986.
25 D. L. Hall, B. Dellinger, J. L. Graham, and W. A. Rubey,-, Vol. 3, No. 4, p. 441,1986.
26 B. Dellinger, "Theory and Practice of Developing a Practical Index of Hazardous Waste Incinerability," in Hazard Asmnt D e v e l m , Vol. 6, J. Saxena, Ed., Hemisphere Publ. Corp, 1989.
27 P. H. Taylor, B. Dellinger, and C. C. Lee, Environ. Sci. & Technol., Vol. 24, p. 316, 1990.
28 Personal communication^-Charles Lamb. 1992.

June 1993 Page 144
B. Dellinger, M. D. Graham, and D. A. Trey, Haz. Waste and Haz. Mat., Vol. 3, No. 3, p. 293, 1986.
W. P. Linak, J. P. Kilgroe, J. A. McSorley, J. D. L. Wendt, and J. E. Dunn, JAPCA, Vol. 37, p. 54, 1987. .
W. P. Linak, J. A. McSorley, J. 0. L. Wendt, and J. E. Dunn, JAPCA. Vol. 37, p. 934, 1987.
B. Dellinger, M.D. Graham, and B.A. Tuey, Waste m, Vol 3, No. 2, p. 139, 1986.
D. A. Tuey, P. H. Taylor, and B. Dellinger, "Products of Incomplete Combustion from the High Temperature Pyrolysis of the Chlorinated Methanes," In Emissions from . . CombustionProcesses: Chpt. 8, p. 109, 1990.
D. A. Tuey, P. H. Taylor, J. H. Kasner, and B. Dellinger, Technolo% Vol. 74, p. 137, 1990.
B. Dellinger, P. H. Taylor, D. A. Tirey, and C. C. Lee, J. of Haz. Mat, Vol. 22, p. 175, 1989.
B. Dellinger, P. H. Taylor, and D. A. T i y , "Minimization and Control of Hazardous Combustion By-Products," EPA/600/92-90/039,1991.
I. Glassman. combustion; Academic Press, New York. New York, 1977.
J. S. Sconce. Chlorine. Reynold Publishing Corp., New York, New York.
A. K. Nanda, D. L. Ulrichson, Jnt. J. Hvdroeen E n e m Vol. 13, No. 2, p. 67,1988.
D. L. Ulrichson and Y. Yeh, "Thermochemical Water Splitting, The Reverse Deacon Reaction and Alternatives," A m Chem. Soc. Div. of Fuel Chem., Preprint, Vol. 21, No. 3, p. 55. 1976.
Beny E. E., MacDonald L. P., and Skinner D. J, Experimental Burning of Waste Oil as a Fuel in Cement Manufacture, Environment Canada, Report No. EPS 4-WP-75-1. 1975.
MacDonald L. P., Skinner D. J., Hopton F. J.. and Thomas G. H., Burning Waste Chlorinated Hydrocarbons in a Cement Kiln, Fsheries and Environment Canada, Report No. EPS 4-WP-77-2, 1977.
Swanson Environmental, Inc.. PCB Emission Study at Peerless Cement Company, Detroit, Michigan, Deparpnent of Natural Resources, Air Quality Division, Detroit, Michigan, 1976.

June 1993 Page 145
Ahling B., Combustion Test with Chlorinated Hydrocarbons in a Cement Kiln at Stora V i a Test Center, Swedish Water and Air Pollution Research Institute, Stockholm, Sweden, 1978.
Ahling B., Destruction ofchlorinated Hydrocarbons in a Cement Kiln, Environ. Sci, m, 13(11), 1377-1379, 1979.
Higgins G. M. and Helmstetter A. J., Evaluation of Hazardous Waste Incineration in a Dry Process Cement Kiln, 1982.
Branscome M. J., Bolstad J., et al., Evaluation of Waste Combustion in a Dry- Process Cement Kiln at Lone Star Indusmes, Oglesby, Illinois. Draft Report, EPA Contract No. 68-02-3149, U.S. Environmental Protection Agency, Cincinnati, OH, 1984.
Peters J. A., et al., Evaluation of Hazardous Waste Incineration in Cement Kilns at San Juan Cement Company, Draft Report, EPA Contract No. 68-03-3025, U.S. Environmental Protection Agency, Cincinnati, OH, 1983.
Nesselbeck E. R., Baseline and Solvent Fuels Stack Emissions Tests, Prepared for Energy and Resource Recovery Corporation, Albany, NY, January 1982.
Jenkins A. C., et al., Supplemental Fuels Project, General Portland, Inc., Los Robles Cement Plant, State of California Air Resources Board, Report (2-82-080, 1982.
Branscome M. J., ~olstad J.. et al., Evaluation of Waste Combustion in a Wet Process Cement Kiln at General Portland Inc.. Paulding, Ohio, Draft Repon, EPA Contract No. 68-02-3149, U.S. Environmental Protection Agency, Cincinnati, OH, 1984.
Powell J. H.. Synfuel Trial Burn Repon for Kiln No. 3 at Medusa Portland Cement, TRC Project No. 3196E31.1985.
Meadows F., Destruction and Removal Efficiency of POHCs at Southwestern Portland Cement Company, Fairborn, Ohio, Pollution Control Service Report PN 325002,1987.
Bell A. C., Non-Critical Pollutant Emissions and AB2588 Testing From the Lebec Cement Plant Rotary Kiln, Energy Systems Associates Repon, ESR 51000-2038, 1990.
Garg S., Emissions Testing of a Pre-Calciner Cement Kiln at Louisville, NE, EPA 530-SW-91-016, PB 91-130195,1990.
Garg S.. Emissions Testing of a Wet Cement Kiln at Hannibal, MO, EPA 530-SW-91- 017, PB 91-130203,1990.

June 1993 Page 146
Entropy, Inc., Stationary Source Sampling Report for SWPCO, Fairborn, OH, Ref. No. 8114,1991.
Entropy, Inc., Stationary Source Sampling Report for SWPCO, Fairborn, OH, Ref. No. 10584,1991.
Ash Grove Cement Company, RCRA Trial Bum Report and Certification of Compliance, Louisville, Nebraska, Waste-Derived Fuel Facility. 1992.
Ash Grove Cement Company, RCRA Trial Burn Report and Certification of Compliance, Foreman, Arkansas, Waste-Derived Fuel Facility, 1992.
Ash Grove Cement Company, RCRA Trial Bum Report and Certification of Compliance, Chanute, Kansas, Waste-Derived Fuel Facility, April 1992.
Ash Grove Cement Company, RCRA Trial Bum Report and Certification of Compliance, Chanute, Kansas, Waste-Derived Fuel Facility, November 1992.
Mournighan R. F. and Branscome M. J., Hazardous Waste Combustion in Industrial Processes: Cement and Lime Kilns, RTI Final Report, EPA Contract 68-03-3149, 1987.
M. R. Beychok, Atmos~heric Environment, Vol. 21, No. 1, p. 29,1987.
. . p, ASMJ3, New York, New York, 1981.
E. T. Oppelt, JAPCA, Vol. 37, No. 5, p. 558, 1987.
0. Hutzinger, R. W. Frei, E. Merian, and F. Pocchiari, Chlorinated Dioxins and Related Com~oun&, New York: Pergamon Press, 1982.
Miles, A.J., Keating, M.H., and C.L. Jamgochian, National dioxin study tier 4 - combustion sources: Engineering Analysis Report EPA 4501484-014h, 1987.
W. M. Shaub and W. Tsang, "Overview of Dioxin Formation in Gas and Solid Phase Under Municipal Incinerator Conditions," in Chlorinated Dibenzodioxins and Dibenzofms in the Total Environment II, G. Choudhary, L. H. Kieth, and C. Rappe, eds., Buttenvorth, Stoneham, Mass., p. 469, 1985.
H. Vogg and L. Stieglitz, C h e m o s ~ h e ~ , Vol. 15, Nos. 9-12, p. 1373, 1986.
D: F. Wiesenhahn, C. P. Li, and S. S. Penner, Vol. 13, No. 3, p. 225,1988.
E. R. Altwicker, J. S. Schonberg, Ravi, K.N.V. Konduri, and M. S. Milligan, & Waste and Haz. Mat, Vol. 7, No. 1, p. 73,1990.

June 1993 Page 147 - -
73 B. K. Gullett, K. R. Bruce, and L. 0. Beach, "Formation Mechanisms of Chlorinated Organics and Impact of Sorbent Injection," Presented at the International Conference on Municipal Waste Combustion, Hollywood, Florida, Paper 8C, 1989.
74 M. Benoit, et al., U.S. Patent No. 4,850,290, "Method for Energy Recovery from Solid Hazardous Waste", July 25 1989.
75 Peterson, et al., "Apparatus for Charging Solid Fuel to Rotary Kilns," U.S. Patent No. 4,930,965, June 5 1990.
76 Tutt, et al., "Device for Charging Combustible Solids to Rotary Kilns," U.S. Patent No. 5,078,594. January 7 1992.
77 M. Benoit, et al., "Processed Wastes as Supplemental Fuel for Modified Cement Kilns," U.S. Patent No. 5,083,516, January 28 1992.

June 1993 Page 148
2-CP: 2-Chlorophenol.
1,I DCA: 1.1-Dichloroethane.
IJ DCA: 1,2 Dichloroethane.
1,I DCE: 1.1-Dichloroethylene.
I J DCPE: 1.2-Dichloropropylene.
1,lJ TCA: 1,l.l-Trichlororethane.
1,IJ TCA: 1.1.2-Trichlororethane.
1,1,2,2, TCA: 1.1.2.2-Tetrachloroethane.
2,4,6 TCP: 2.4.6-Trichlorophenol.
Ag: The chemical symbol for the element silver.
APCD: Air pollution control device.
As: The chemical symbol for the element arsenic.
Ba: The chemical symbol for the element barium.
BACr Best available conwol technology.
Be: The chemical symbol for the element beryllium.
BIF: Boilers and Industrial Furnaces.
BTU. British Thermal Unit.
C: The chemical symbol for the element carbon; or abbreviation for centigrade.

June 1993 Page 149
Ca: The chemical symbol for the element calcium.
CAC: Ch1orinat.d aromatic compound.
CC14: Carbon tetrachloride.
Cd: The chemical symbol for the element cadmium.
CFR: - Code of Federal Regulations.
CH2C12: Dichloromethane.
CHC: Chlorinated hydrocarbon.
CHC13: Chloroform.
CKD: Cement kiln dust.
CKRC: Cement Kiln Recycling Coalition.
C1: The chemical symbol for the element chlorine.
Clinker: The solid product exiting the cement kiln that is later finely ground to become the principal ingredient in cement manufacture.
CO. Carbon monoxide.
Cr: The chemical symbol for the element chromium.
DBM: Dibromomethane.
DCBz: Dichlorobenzene.
DE: Destruction efficiency.
Dkchurge end: Descriptive of the clinker discharge end or primary fuel burner end of a cement kiln.
DRE: Destruction and removal efficiency.
I? An abbreviation for Fahrenheit.
Fe: The chemical symbol for the element iron.
Feed end: Descriptive of the end of the cement kiln where the raw materials are fed and the hot combustion gases exit.
H: The chemical symbol for the element hydrogen.

June 1993 Page 150
HCA: Hexachloroethane.
Hg: The chemical symbol for the element mercury.
Hot end or hot zone: See discharge end.
HpCDD: Heptachlorodibenzodioxin.
LHWF: Liquid hazardous waste fuel.
LWDF: Liquid wastederived fuel.
M 23 samples: Samples for U.S. EPA Method 23 analysis for dioxins.
MCBr: Monochlorobenzene.
MCP: Monochlorophenol.
MEI: Maximum exposed individual.
Mid-process: Wastes i n d u c e d mid-process refer to injection at mid-kiln for a long, wet system or at the feed end of the kiln for a preheaterlprecalciner system.
MM5: EPA modified method 5 for semi-volatile organic emissions.
NAAQS: - National Ambient Air Quality Standard.
Ni: The chemical symbol for theelement nickel.
0: The chemical symbol for the element oxygen.
OCDD: Octachlorodibenzodioxin.
PAH: Polynuclear aromatic hydrocarbon.
P k The chemical symbol for the element lead.
PCDD: Polychlorinated dibenzodioxin.
PeCDD: Pentachlorodibenzodioxin.
PIC: Product of incomplete combustion.
PNA: Poly-nuclear aromatic.
POHC: Principal organic hazardous constituent.

June 1993 Page 151
POHC DRE: Principal organic hazardous constituent destruction and removal efficiency.
RAC: - Reference air concentration.
RCRA: - Resource Conservation and Recovery Act.
R p : - Reference dose.
RSD: - Risk-specific dose.
Raw Meal: The raw materials fed into a cement kiln; normally consists of limestone, clay, shale, and perhaps a source of iron.
SAB: Scientific Advisory Board.
Sb: The chemical symbol for the element antimony.
SF6: Sulfur hexduoride.
Si: The chemical symbol for the element silicon.
SZM analysis: Selected Ion Monitoring analysis.
SWDF: Solid wastederived fuel.
TCBz: Trichlorobenzene.
TCDD: Tetrachldibenzodioxin.
TCE: Trichlomthylene.
THC: Total hydrocarbons.
TI: The chemical symbol for the element thallium.
TOM: Total organic mass.
TSCA: Toxic Substances Control Act.
U.S. EPA: United States Environmental Protection Agency.
WDF: Waste-derived fuel.
Zn: The chemical symbol for the element zinc.

June 1993 Page 152 I
Appendix I I I
Mass Balance
The major flow paths for a preheater kiln are shown in Figure I. 1 with all the pemnent mass By-pass Stack
"
Maln Stack Cooler Vent
Figure I. 1 Simplified flow diagram and material flows for a preheated precalciner kiln.
flows indicated. A description of the node points are provided in Table I. 1. The material balances for the different nodes are:

I June 1993 Page 153
Table 1.1 Material balance node point description.
kiln;
by-pass duct;

June 1993 Page 151
product stream;
ml3 = ~(l-a)(l-P)m3
~ I I = (l-o)(l-a)(I-P)m3
ml4 = Ca(l-a)(l-P)m3
m15 = (1-C)o(l-a)(l-P)m3
ml2 = (1-o)(l-a)(l-P)m3 + Co(l-a)(l-P)m3
main stack;
and the inlet:
where A, B, and C are the collection efficiencies of the APCDs on the main stack, by-pass stack, and cooler vent, respectively. As shown, all of the flows are proportional to m3. Performing a mass balance about node 10 and explicitly solving for m3 will enable all of the equations to be written in terms of the flow fractions and APCD collection efficiencies.
For the preheaterlprecalciner:
Solution of this balance in terms of ml yields:
The substitution of m3 in the proceeding mass balance equations provides all the mass flows as a function of the fractional vaporization a, fractional entrainment p, the canyover to the main
I APCD 6 per unit mass of product, the fractional entrainment o in the clinker cooler, and the APCD collection efficiencies A, B, and C.

I June 1993 Page 155
Summary of POHC Emissions Data
Baseline Emissions Waste Bum Emissions Waste Componmt I DRE I in&) I (nus) I
Muhylme chloride Trkhlomethylme AU chlorinated hydrocarbom PCB Chlorinated phenols Phmoxy adds Frmn 113
Methylme chloride Trichloromethane Carbon tenachloride
Chlminated aliphadcs Chlorinated ammatics PCBs
PCB's
Methylme chloride 1.l.l-Trichloroethane 1.3.5-Trimethyl-baumc Xylm
N A
0.13-0.55'
>99.990 >99.989 >99.986
99.9981-99.9986
Methylme chloride F r m 113 Methyl ethyl ketone 1.1.1-Trkhlomthsnc Toluene
N A
0.10-0.75
>99.99 99.99
99.95 >99.99
Methylme chloride Feon 113 Methyl ethyl ketone 1.l.l-Trichlomethane Toluene
c0.14.43 0.13-03 ~0.1-c75 4.1-4.1
99.956-99.998 >99.999
99.978-99.997 99.991 -99.999 99.W99.988
0.61d 4.022 0.044' 0.77 4.7
99.94-99.99 99.999
99.997-99.999 999.999
99.986-99.998
4.sd 0.43'
4.029 0.17 1.5
0.9 0.079 4.014 0.14 0.98

June 1993 Page 156
(solid+liq.feed)
5.7xld-7.6~10~ (liq. feed)
K (April Carbon ~etracNoride 99.99993-99.99996 ND < 1 . 4 x 1 ~ 4 . 2 ~ 1 ~ 1991) CNorobenzme 99.97-99.9998 ND <8.2xld-<1.8~10~
sulfur he~a~uoride 99.9997-99.99994 ND i.zxid Tekpchloroethme 99.9995-99.9996 ND <[email protected]~1@ Tendlorobewme 99.9997 ND <6.9xld-<7.6xld Trichlombcnzere 99.9996-99.9997 ND <9.6xld-<1.7~1@
Bv-oass Stack Carbon IetracNoridc >99.9999 ND <6.6xld-<l.6~1& CNorobewmc 99.9999->99.9999 ND <4.5xld-<1.0~1@ S u h hexaRuoride m.9999 ND [email protected]~1@ Tehpchloroetkne 99.9997-99.9998 ND c9.0xld-~.0x104 Tenachlorobenzme 99.9999 ND <3.~xid-c35xid Trichlombcnzere 99.9997-99.9998 ND <83xid-<i.1~104
K CNorohmne (main stack) 99.969-99.989 NA <6.3~10~-<13~10~ (Dec. CNombsnzmc(by-pass 99.9992-99.9996 NA <z0xid-<4.9~16 1991) stack)
M ~machloroethene~ >99.9987 N A i.95xid (1992) 1 . 2 4 T r i c N ~ ~ >99.99996>99.99997 N A 5.58xld
1.1.1 TricNomethane >99.9986-S9.9995 N A 5.14~16
0 ~chschloroethme~ >99.99997 N A 1.07~104 (1992) 1,24~ric~ombmzen$ >99.99989 N A 1.41~104 Kiln I 1.1.1 Trichlomethane S9.9982 NA 2.91xlOd

June 1993 Page 157
one of the target compounds except chlomfm was found during the baseline test. Emission estimates are based on detection limit values and maximum waste feed raw (except for measured values for chlorofom and Freon).
CBaseline results based on reported average concenbation and an average gas flow of 1.800 n3/min. *~esults are suspect bccause of methylem chloride contamination on blanks. 'Blank values for MEK were roughly comparable to sample values, resulu are suspect because of potential contamination.
'LOW level contamination of Freon 113 seen on blanks. 'Average of main and by-pass stacks. '~ed in the solid WDF only. ' ~ed in the liquid WDF only.

June 1993 F'age 158
Emissions Data on Products of Incomplete Combustion
Table III-1 PIC data for Plant M.
Methylene chloride
1,1,2,2-Tetrachloroethane
Trichlorofluoromethane . ND ND 35
Anthracene 5 ND ND
Bis(2-ethylhexyl) phthalate 15.5 68.5 62

June 1993 Page 159
Table 111-1 PIC data for Plant M.

June 1993 Page 160
Table HI-2 PIC data for Plant N.
Dibromochloromethane
Chlorobenzene (MCBZ)
Ethylbenzene
Bromoform
0.3
51
140
0.2
0.03
33
200
ND
0.6
33 - 26
1.1 -

June 1993 Page 161
Table HI-2 PIC data for Plant N.
'High value may be due to 1aboTBU)ry contamination.

June 1993 Page 162
Table III-3 PIC data for Plant L. I

I June 1993 Page 163
Table III-3 PIC data for Plant L.

June 1993
Table 111-4a Organic emissions from the by-pass stack at Plant K when burning liquid waste, tires and coal (cond. 11).
I u I m I I I I u I t I I I u

I June 1993 Page 165
Table III-4a Organic emissions from the by-pass stack at Plant K when burning liquid waste, tires and coal (cond. 11).
'1n contrast to the main stack Condition II, and the by-pass stack Condition III, stack emission data presented in Tables 2 and 3 SIM's analysis was not performed on the

June 1993
Table III-4b Organic emissions from the main stack at Plant K when burning liquid waste, tires I - and coal (cond. 11).

I June 1993 Page 167
I Table III-4b Organic emissions from the main stack at Plant K when burning liquid waste, tires and coal (cond. 11).

June 1993 Page 168
Table III-4b Organic emissions from the main stack at Plant K when burning liquid waste, tires and coal (cond. 11). u

I June 1993 Page 169
Table III-4c Organic emissions from the by-pass stack at Plant K when burning coal-only (cond. 111).

June 1993 Page 170
Table 111-4c Organic emissions from the by-pass stack at Plant K when burning coal-only (cond. 111).

I June 1993 Page 171
Table 111-4c Organic emissions from the by-pass stack at Plant K when burning coal-only (cond. 1x0.

June 1993 Page 172
Summary of PCDDIPCDF Emissions

Summary of PCDDPCDF Emissions.

June 1993
Continuous Emissions Monitoring (CEM) Data
Table V-1 Summary of THC, CO and O2 concentrations.
Baseline
PCBs <10 100-1500 Baseline < lo 100
Chlorophenols/ 10 50-500 phenoxy acids 50
Baseline 10
Freon 4 0 100-500 Baseline <10 50
-

June 1993 Page 175
Table V-1 Summary of THC, CO and O2 concentrations.
Plant
April 1991
Sept. 1991
Main stack Liauid & solid waste I 9.5 1 708 1 5.2
Test Condition
Liquid and solid waste Coal Coal & Diesel
THC (ppmla
42.4 8.3
41.8
Liquid waste Coal only
Liquid & solid waste Liquid waste Coal only
Synfuel
Bv-Pass Liquid Waste (Cond I) Liquid Waste (Cond II) Coal only
Main Stack Liquid waste (Cond I) Liquid waste (Cond 11) Coal only
CO (ppm)
290 198 257
3.0 6.0
2.5 0.8 0
7.9-40.1
0 2 (%)
4.0e 5.9 4.5
109 81.2 83.8
Liquid waste
M 1 (1992) 1 =Solid Waste 1 10.1 1 5.2 I
813 324
97.5 216 25
145-273
IkQaSs Liquid waste
I l E S o l i d Was. 1 19.5 1 335 I NA
4.4 4.7
2.5-1.3
232 202 173
N A
2.1 2.4 1.7
NA
158
P April 1992
N A
24 NA
Coal Liquid and Solid Waste
15-20 23-45
N A 1031-2241
-3 -3

June 1993 Page 176 I Table V-1 Summary of THC, CO and O2 concentrations.
I
.Expressed as ppm methane unless otherwise noted. %otal nonmethane hydmarbons. Qange of rest averages. * ~ o t measured. 'All Q data is from measurement in the kiln.
CO ( P P ~ )
419-640
THC ( P P ~ ) ~
18-73
Plant
P Nov. 1992
0 2 (%I
-3
Test Condition
Main Stack Liquid and Solid Waste

June 1993 Page 177
Table V-2 THC and TOM emissions.
TOM, ppmv dry as propane