Embed Size (px)
Citation preview

ENTERTAINMENT ONE LTD. FULL YEAR RESULTS
FOR THE YEAR ENDED 31 MARCH 2016
STRONG GROWTH IN TELEVISION AND FAMILY
Solid financial performance with strong growth in Television and Family, despite challenges in Film
- Group reported revenues up 2% to £803 million, driven by strong Television and Family performance, offset by weaker Film
- Group reported underlying EBITDA up 20% to £129 million, driven by organic Television and Family growth, and acquisitions
completed during the year
- Group reported profit before tax up 9% at £48 million
- Diluted earnings per share was 9.6 pence per share (19.4 pence per share on an adjusted basis)
- Net debt leverage remains low at 1.4x Group underlying EBITDA
- 9% increase in dividend to 1.2 pence per share (2015: 1.1 pence per share)
Creating a global television business
- eOne Television saw strong organic growth of 27% in the financial year with revenues increasing to £188 million and
underlying EBITDA up 44% to £23 million
- 998 half hours of new programming acquired/produced in the year (2015: 752 half hours) with a strong pipeline of
programming already greenlit for the next financial year
- Continued success from third party content and a significant number of new development and production deals announced
The Mark Gordon Company delivering strong performance
- Financial performance in line with expectations with strong cash generation from existing library participations, with five series
currently airing on US network and premium cable
- Very positive television production slate, with two new series in production for major US networks for first seasons, and almost
sixty projects in development
Making Peppa Pig the world’s most loved pre-school property
- The Family Division saw strong growth in the financial year with revenues up 10% to £67 million and underlying EBITDA up
82% to £43 million, supported by the acquisition of Astley Baker Davies Limited in October 2015
- The delivery of a new series of Peppa Pig commences in July 2016
- Over 500 new and renewed broadcast, licensing and merchandising contracts signed during the financial year, with almost 850
deals in total now live
- PJ Masks took an average audience share of 29% of 2-5 year olds on Disney Channel and Disney Junior in the US – the
merchandising programme launches in the US in autumn 2016 and the broadcast roll-out to 30 Disney channels internationally
continues over the course of 2016
Positioning Film for the future
- The Film Division saw continued weakness with revenues 7% lower at £553 million and underlying EBITDA 28% lower at £53
million, but with stronger adjusted cash conversion at 87% of underlying EBITDA (2015: 25%)
- 210 theatrical releases in the year compared to 227 in the prior year
- A very strong upcoming slate of films in the new financial year is expected to deliver around 220 theatrical releases, led by The
BFG, the first film from eOne’s new partnership with Steven Spielberg’s Amblin Partners, and David Brent: Life on the Road
starring Ricky Gervais, from the team behind the hit series The Office
- Restructuring programme launched which will yield annual cost savings of £10 million from FY18, including the previously
announced partnerships with 20th Century Fox Home Entertainment and Sony Pictures Home Entertainment designed to
maximise eOne’s opportunities within the evolving home entertainment marketplace
On track to double the size of the business over the five years to 2020
- Successfully built content pipeline supported by strategic investments and acquisitions, including Amblin Partners, Sierra
Pictures and Renegade 83
- Foundations for growth are now in place, allowing the focus to move to delivery of organic growth across the business
- The £201 million rights issue completed in October 2015 and the issuance of £285 million senior secured notes in December
2015 have put the appropriate long-term financing structure in place to support the Group’s organic growth strategy
Positive outlook
- eOne remains well-positioned to benefit from long-term structural industry drivers
- Content markets remain dynamic and the Group continues to review potential investment and corporate acquisition
opportunities

DARREN THROOP, CHIEF EXECUTIVE, COMMENTED:
eOne has delivered solid financial results at the Group level, driven by strong organic growth in Television and Family, and the impact of
acquisitions completed during the year, despite weakness in the Film Division continuing into the second half. The benefit of the Group’s
diversified model is apparent with growth in Television and Family providing a greater balance to the Group’s portfolio, enhancing the mix
of eOne’s revenues towards higher margin activities and protecting the bottom line against the cyclical film market.
The Group’s model to source, select and sell high quality content continues to be at the centre of our strategy and is at the foundation of the
Group’s achievements in the year. We have continued to build relationships with world-class content producers through our investment in
Amblin Partners with Steven Spielberg and our acquisition of Renegade 83. We continue to select the best content to exploit across our
global network and expect our film and television slate for the next financial year to be particularly strong. At the same time, we continue to
deliver sales across the world through long-standing local relationships in our own territories and through our global international sales
network, which has been enhanced through the investment in Sierra Pictures.
As has always been the case, great content is at the heart of Entertainment One – The Mark Gordon Company has five US network and cable
series currently airing and two new series in production for major US networks for first seasons, eOne Television has delivered strong
content and the Film slate looks to be the strongest for many years. In Family, new production PJ Masks has surpassed our expectations on
the Disney channels, and we start to deliver the new series of Peppa Pig from July.
Whilst there are positive expectations for the new financial year in Film, we have taken specific steps in the Division to address its long term
profitability – a wide-reaching restructuring programme has been launched which will see annual cost savings of £10 million per annum
from FY18, including long-term partnerships with Fox and Sony to help maximise eOne’s home entertainment profitability.
The foundations for growth are in place, with eOne’s key capability for high quality content generation allowing the focus to move to
delivery of organic growth across the business. With consumer demand continuing to grow, we anticipate that audiences will increasingly
focus on the quality of the content that they consume, gravitating towards premium television series, film and speciality genres. This market
dynamic plays to Entertainment One’s strengths and supports our strategic goal to double the size of the business over the five years to 2020.

FINANCIAL SUMMARY
Reported
£m 2016 2015 Change
Revenue 802.7 785.8 2%
Underlying EBITDA 1 129.1 107.3 20%
Investment in acquired content and productions 218.5 280.8 (22%)
Reported Adjusted
£m 2016 2015 Change 2016 2015 Change
Profit before tax 2 47.9 44.0 9% 104.1 88.8 17%
Diluted earnings per share (pence) 2 9.6 12.5 (23%) 19.4 20.8 (7%)
1 Underlying EBITDA is operating profit before one-off items, amortisation of acquired intangibles, depreciation and amortisation of software, share-based payment charge, and tax, finance costs and depreciation related to joint ventures. Underlying EBITDA is reconciled to operating profit in the "Other Financial Information” section of this Results Announcement.
2 Adjusted profit before tax is the reported measure before amortisation of acquired intangibles, share-based payment charge, tax, finance costs and depreciation related to joint ventures, operating one-off items and one-off items relating to the Group’s financing arrangements. Adjusted diluted earnings is adjusted for the tax effect of these items and other one-off tax items. The denominator for the purposes of calculating both basic and diluted earnings per share has been adjusted to reflect the rights issue in October 2015.
Group reported revenues were 2% higher at £802.7 million (2015: £785.8 million), driven by strong growth in Television (up 31%) and
Family (up 10%), partly offset by lower revenues in the Film Division, 7% lower. Acquisitions completed during the financial year
contributed £21.6 million to Group reported revenues. On a constant currency basis, Group revenue growth was 6%, reflecting the impact of
stronger pounds sterling against the Canadian dollar, Australian dollar and euro during the year, and underlying Group revenue growth
(excluding acquisitions) was 3%.
Group reported underlying EBITDA was 20% higher at £129.1 million (2015: £107.3 million), driven by strong growth in Television (up
120%) and Family (up 82%), partly offset by lower underlying EBITDA in the Film Division, 28% lower, driven primarily by fewer film
releases, weaker title performance and the impact of the weaker slate in FY15. On a constant currency basis, Group underlying EBITDA
growth was 24%, reflecting the impact of stronger pounds sterling during the year. Acquisitions completed during the financial year
contributed £14.8 million to Group underlying EBITDA, resulting in underlying growth of 10% on a constant currency basis.
Group investment in acquired content and productions in the year amounted to £218.5 million, 22% lower than the prior year (2015: £280.8
million), driven primarily by lower investment in the Film Division.
Reported profit before tax was 9% higher in the year, at £47.9 million (2015: £44.0 million). Adjusted profit before tax for the year increased
by 17% to £104.1 million (2015: £88.8 million) in line with the increase in underlying EBITDA, partly offset by higher underlying finance
charges primarily reflecting higher average debt levels year-on-year, following the acquisition of The Mark Gordon Company in January
2015, and the impact of higher interest rates following the re-financing in December 2015.
Diluted adjusted earnings per share were 1.4 pence lower at 19.4 pence (2015: 20.8 pence). On a reported basis, diluted earnings per share
were 2.9 pence lower at 9.6 pence (2015: 12.5 pence) and reflected higher one-off finance costs in relation to the re-financing and higher
amortisation of acquired intangibles driven by acquisitions in the year.
In line with the Group’s progressive dividend policy, the directors have declared a final dividend up 9% to 1.2p per share (2015: 1.1p per
share).

OUTLOOK
The Television Division will see continued organic growth from eOne Television as well as the benefits of full year contributions from
Renegade 83, Dualtone Music Group and Last Gang Entertainment. eOne Television recently received a straight-to-series order for Sharp
Objects, the high-end drama commissioned by HBO, starring Amy Adams and based on the book by Gone Girl author Gillian Flynn. It is
anticipated that around 1,100 half hours of content will be available for distribution through the Group’s global sales network in the new
financial year. FY17 is expected to see a significant increase in production at The Mark Gordon Company (MGC), with the ramp-up of
activity on greenlit series and the continued conversion of some of the many projects in development. MGC has seen two new primetime
commissions, Conviction and Designated Survivor, ordered to series in recent months, adding to the company’s roster of long-running
franchises on major US networks that include Grey’s Anatomy, Quantico, Ray Donovan, and Criminal Minds and Criminal Minds: Beyond
Borders, all of which have renewed in the year.
Family continues to focus on building Peppa Pig into the most loved pre-school brand in the world while continuing to develop and build
new brands across the Family portfolio, including Ben & Holly’s Little Kingdom and PJ Masks. The delivery of a new series of Peppa Pig
commences in July 2016 and the continued roll-out of PJ Masks on Disney during the year will support the almost 850 licensing and
merchandising deals that are now live across the portfolio.
As the independent film market continues to recover in 2016, the Group’s exciting film slate is expected to deliver a significant pick-up in
the Group’s box office performance, which will drive revenues in ancillary content release windows in future years. The Film Division plans
to release around 220 films in the new financial year, in line with its profile of annual investment of around £160 million in acquired content
and £70 million in productions over the next three to five years. This consistent profile of investment, as well as the restructuring of the Film
Division’s operations, is anticipated to drive good long-term cash conversion in the Division.
The drivers are clear across all of the Divisions, giving a positive outlook which is underpinned by market dynamics that play to the strengths
of the Group. The appetite for quality content continues to be driven by numerous factors, including the growth of digital platforms and ‘TV
anywhere’. Having created the foundations for high quality content generation and with the appropriate long-term financing structure in
place to support the delivery of the organic growth strategy, the directors look forward to the new financial year with confidence.
STRATEGY
The growth in the market for content rights is underpinned by changes in the way content is being consumed. Entertainment One’s strategy
to focus on growth through content ownership puts it at the centre of this positive structural change.
BUSINESS MODEL
The Group’s business model remains unchanged. We continue to build the scale of the business by focusing on the Group’s three key
capabilities:
Source: Developing relationships with the best creative talent in the film and television industries by being their partner of choice,
reflecting the quality of our people and our global distribution capabilities
Select: Leveraging local market insight from our independent sales network to invest in the right content for consumers across all eOne
territories, and producing content with global appeal to service the Group’s global sales operations
Sell: Using the Group’s infrastructure, sales operations and global scale to maximise investment returns, ensuring the business is well-
positioned to benefit from new and emerging broadcast and digital distribution platforms
The Board continues to see significant opportunity for further growth and to target doubling the size of the business by 2020 through its
strategy of:
- Developing more relationships and partnerships with top producers and talent to increase the volume and quality of productions
- Building the world’s leading independent content rights sales business to maximise the return on investment
The strategy focuses on building a more balanced content and brand business which will see strong revenue and EBITDA growth in
Television and Family, while Film continues to focus on delivering an improving investment return through a consistently strong release
slate and further efficiency savings.
Operationally, as well as developing a digital future across the Group, the strategy targets our Divisions to deliver specific drivers of growth:
Television: Building a global production business and a world-class television sales network
Family: Making Peppa Pig the world’s most loved pre-school brand and building a global portfolio of brands
Film: Developing partnerships with premium film-makers and maximising scale and efficiency in independent film distribution
STRATEGIC PROGRESS
FY16 has been a strong year of progress on delivering the Group’s strategy.
Organic growth in the Television business, the recent acquisition of Renegade 83, the ramping-up of production at The Mark Gordon
Company and continued success in fostering development deals in the US and internationally is transforming eOne Television into a
diversified global content business. The increased output seen from these businesses is further fuelling eOne’s well-established global
television sales network.

The acquisition of a controlling stake in Astley Baker Davies Limited gives eOne greater control of and a higher share in the financial
success of Peppa Pig, which is a key strategic driver for Family and a proven, successful pre-school brand where the Group believes the
opportunity exists to increase global retail sales to US$2 billion in the medium term. The early success of PJ Masks in the US and the strong
prospects for a licensing programme as it rolls out across Disney channels internationally are indicative of an exceptional property that will
further build out eOne’s Family portfolio in a substantive way.
The Film Division has an expanded relationship with Steven Spielberg through the strategic investment in Amblin Partners and a strong
addition to the Group’s global sales capability through the investment in Sierra Pictures. In parallel, the Group continues to focus on driving
margins in the Film Division, through a wide-reaching restructuring of how the Division operates, which is expected to deliver annual cost
savings of £10 million from FY18.
eOne’s capital structure is aligned with delivering the Group’s strategy following the re-financing of the business in December 2015, with
long-term, non-amortising, fixed-rate debt provided via senior secured notes and short-term working capital needs being funded via a new,
more flexible revolving credit facility.

DIVISIONAL OPERATIONAL & FINANCIAL REVIEW
Television
OVERVIEW
The Television Division comprises eOne Television, MGC, the Group’s Music label and also incorporates the results of eOne’s investment
in digital media company, Secret Location. The Division’s focus is on the development and production of television programming and the
acquisition of third party television content rights, for sale to broadcasters and digital platforms globally. Previously, the Family operation
was reported within the Television segment and is now reported as a separate Division.
STRATEGY
Entertainment One’s growth strategy is based on partnering with the best creative talent to produce and own the best quality content and
ensuring that the Group’s global sales presence maximises the international sales opportunities for the content rights it controls.
Over the last two years, Entertainment One has created a portfolio of leading content producers through a mix of organic and acquisitive
growth. In its core production business, eOne Television, the Group continues to work closely with producers through first-look, co-
production, overhead and output deals to bring the best content into its production pipeline.
Following its acquisition in January 2015, The Mark Gordon Company has migrated its operating model from servicing a limited number of
US networks through exclusive overhead deals into a much broader television studio creating, financing and selling to broadcast and over-
the-top (OTT) platforms. The company has been engaged in packaging new projects and has recently won two primetime commissions from
US broadcasters, which Entertainment One will sell around the world. MGC has expanded its customer base to include the digital platforms
and is currently working on a number of projects for this increasingly important segment of the television content market.
In 2014, the Group acquired Paperny Entertainment and Force Four Entertainment to bring critical mass to its non-scripted capability. In
March 2016, the Group consolidated its position in this genre by acquiring a 65% stake in the non-scripted producer Renegade 83 with its
innovative slate of current hit shows including Naked and Afraid and You the Jury.
Looking ahead, the strategy remains unchanged for Television – a mix of organic growth supplemented with strategic bolt-on acquisitions
that help ‘lock-in’ production talent across the world in both the high-end scripted drama and non-scripted genres. The Television Division
continues to be a major contributor to the Group achieving its overall growth target by the year 2020, with further English-language
production investments and acquisitions being considered, where in line with the Group’s strategic goals.
In addition to controlling the best content, the Group focuses on maintaining a leading global sales capability, a key competitive advantage
for eOne, selling content to over 500 broadcasters in more than 150 territories around the world. As well as selling eOne original
productions, the Group has also been active in selling high quality content from partners such as AMC and SundanceTV and other third
party acquisitions across this infrastructure, with strong demand for leading shows such as Fear the Walking Dead, the companion series to
the highly successful The Walking Dead franchise.
With its growing portfolio of independent television producers, including The Mark Gordon Company, Paperny Entertainment, Force Four
Entertainment, Renegade 83, and eOne’s own original Television business, all powered by eOne’s global sales network, eOne is building a
significant global independent television business.
FINANCIAL REVIEW
Revenues for the year were 31% higher at £244.7 million (2015: £186.5 million) driven by continued growth in eOne Television and the
impact of The Mark Gordon Company being consolidated as a subsidiary. Underlying EBITDA increased by 120% to £39.2 million (2015:
£17.8 million) driven by higher revenues and improved margins. Underlying EBITDA margin improved by 6pts to 16.0% (2015: 9.5%)
driven by the full year impact of The Mark Gordon Company on the Divisional mix.
£m 2016 2015 Change
Revenue 244.7 186.5 31%
Underlying EBITDA 39.2 17.8 120%
eONE TELEVISION
eOne Television includes the production and global sales business, Paperny Entertainment, Force Four Entertainment and Renegade 83,
which was acquired in March 2016.
Revenues for the year were up 27% to £187.9 million (2015: £148.4 million) driven by increased levels of production and higher global sales
of both owned and acquired content. Underlying EBITDA increased by 44% to £22.8 million (2015: £15.8 million), supported by revenue
growth across the business.
Investment in acquired content and productions was lower than prior year at £91.8 million (2015: £100.7 million), driven by lower
investment in productions offset by higher acquisitions in the international sales business. The level of investment in productions in the year
was lower partly as a result of the increase in tax credits received which related to prior year investments.

£m 2016 2015 Change
Revenue 187.9 148.4 27%
Underlying EBITDA 22.8 15.8 44%
Investment in acquired content 18.5 9.2 101%
Investment in productions 73.3 91.5 (20%)
998 half hours of new programming were produced/acquired in the year compared to 752 half hours in the prior year. The business has
successfully maintained a steady pipeline of productions as new show commissions replace long-running series that have come to an end.
Key scripted deliveries included third seasons of Rogue and Bitten, season four of Saving Hope, the fifth and final season of Hell on Wheels,
new series Private Eyes starring Jason Priestley and the first season of polyamorous comedy You Me Her for AT&T’s Audience Network.
eOne’s non-scripted business has grown significantly year-on-year with deliveries including seasons one and two of Fameless (David Spade)
for TruTV, About the Business and Nellyville (hip-hop star Nelly) for BET and season five of Mary Mary for WeTV. Programming delivered
by Paperny Entertainment and Force Four Entertainment included season three of Coldwater Cowboys, Chopped Canada, Timber Kings and
Yukon Gold, as well as new commissions Klondike Trappers, Keeping Canada Alive and First Dates.
eOne continues to invest in first-look agreements, scripts, book options and development deals with industry talent to grow the development
slate. Recent successes include straight-to-series orders by HBO of suspense drama Sharp Objects, starring multi-award winning actress
Amy Adams, and series Ransom inspired by the life experiences of a renowned hostage-negotiator, from executive producer Frank Spotnitz.
Crime drama Havana, starring Antonio Banderas, is also in development with Starz. New scripted shows in 2016 also include Cardinal for
CTV and Mary Kills People for Global. Renewals include season four of Rogue, season five of Saving Hope and a new season of You Me
Her. eOne is also continuing its relationship with award-winning producer Ilana Frank, responsible for the success of Rookie Blue and Saving
Hope, and her production company ICF FILMS, with a new three-year deal. In addition, ongoing relationships with Eleven Film, responsible
for The Enfield Haunting, through new series Foreign Bodies for E4 and TNT, and the creation of a television venture with Creative England
enable eOne to continue to produce high quality scripted shows from around the world.
The non-scripted business continues to grow, with a significant number of renewals expected for existing series as well as new commissions.
Renegade 83 will deliver the next seasons of Naked and Afraid and Naked and Afraid XL which is Discovery’s number one Sunday night
show. eOne also has a large number of non-scripted projects in development, supported by investments in first-look deals with high profile
non-scripted talent. These include the company behind The Real Housewives franchise, Purveyors of Pop, Creature Films (VH1’s Behind the
Music and MTV’s Laguna Beach) and veteran reality producer Chris Deaux. A deal has also recently been signed with Chopped creator
Keller and Noll.
Key content acquisitions for the year included the first season of Fear the Walking Dead, season six of The Walking Dead, season two of
Halt and Catch Fire and Turn, and the first season of Into the Badlands from AMC. Other acquisitions included The Enfield Haunting, one
of the highest-rated shows on Sky Living and nominated for three Baftas, David Attenborough’s Great Barrier Reef, and seasons eight and
nine of the popular Canadian series Heartland.
The Group's exclusive distribution agreement with AMC Networks continues to support revenues and the key shows Turn and Halt and
Catch Fire have continued to drive strong ratings and international sales, and both shows have been renewed for third seasons. New series
Into the Badlands, with an average 5.6 million viewers per episode, delivered the third highest-rated first season in US cable TV history and
has been renewed for a second season, with an increase from six to ten episodes. The six episode series Hap and Leonard which aired on
SundanceTV in March 2016 has received positive reviews.
The Walking Dead series continues to enjoy very strong ratings having the highest total viewership of any series in cable television history
with the average number of viewers for season six still at over 13 million. Driven by this continued success, filming has started on the
seventh season which is expected to air in October 2016. Fear the Walking Dead (the companion series to The Walking Dead) continues to
be very well received by audiences, with the average number of viewers being over 7 million for the first season, a higher level than seen for
the first two seasons of The Walking Dead. The second season of Fear the Walking Dead premiered in the US in April 2016. AMC have
announced a third 16-episode season of Fear the Walking Dead expected to air in 2017.
The number of half hours of programming expected to be acquired/produced next year is expected to be around 1,100, with over 60% of
budgeted revenues for the new financial year already committed or greenlit. Investment in acquired content is expected to increase to £30
million and production spend is expected to grow to around £110 million.
THE MARK GORDON COMPANY
Effective 19 May 2015, following a change in the MGC shareholder agreement that governs the basis for determining ‘control’ for the
purpose of accounting for the venture, MGC has been fully consolidated as a subsidiary of the Group. Previously it was accounted for as a
joint venture which only incorporated the Group’s share of joint venture results and did not include revenues associated with the venture. In
line with this change, MGC fully adopted the Group’s accounting policies which included moving to an accruals basis for the accounting of
participation revenues, which were previously accounted for based on cash received. This change in accounting resulted in an improvement
in EBITDA of £3.5 million in relation to the participation revenues in respect of FY15.
Revenues for the year were £14.6 million (2015: £nil) driven by strong participation revenues and producer fees from existing series.
Underlying EBITDA increased to £14.4 million (2015: £0.6 million).
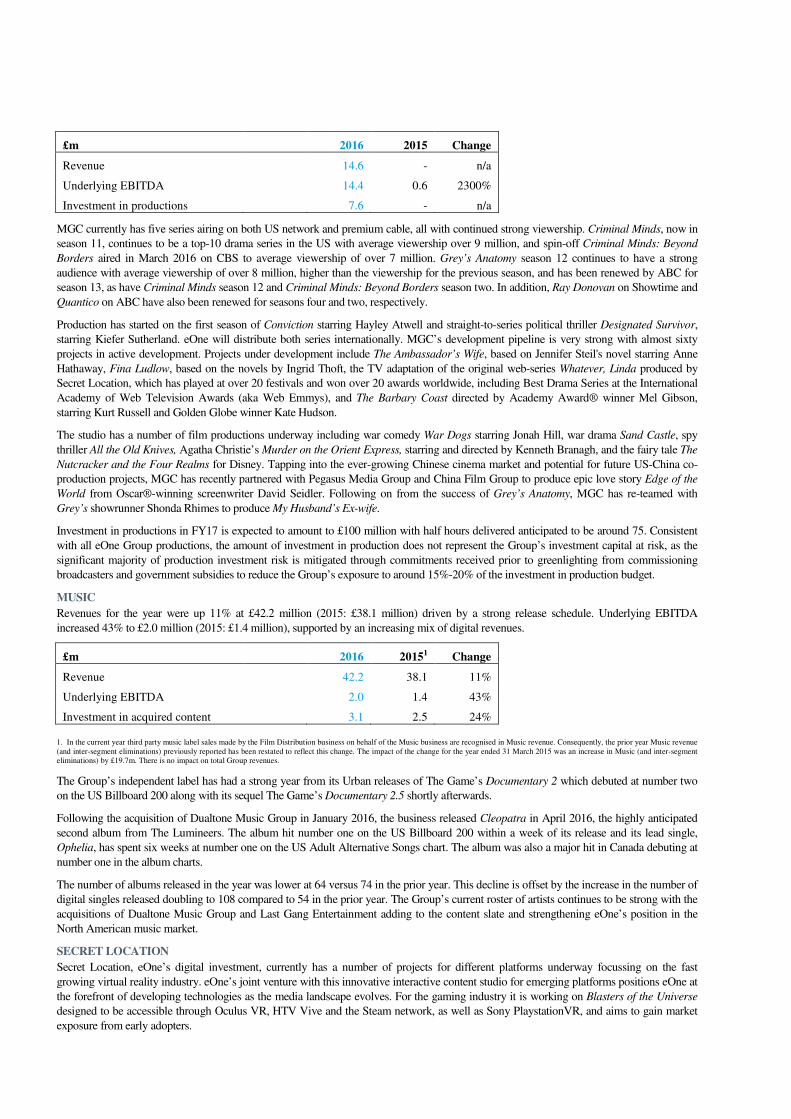
£m 2016 2015 Change
Revenue 14.6 - n/a
Underlying EBITDA 14.4 0.6 2300%
Investment in productions 7.6 - n/a
MGC currently has five series airing on both US network and premium cable, all with continued strong viewership. Criminal Minds, now in
season 11, continues to be a top-10 drama series in the US with average viewership over 9 million, and spin-off Criminal Minds: Beyond
Borders aired in March 2016 on CBS to average viewership of over 7 million. Grey’s Anatomy season 12 continues to have a strong
audience with average viewership of over 8 million, higher than the viewership for the previous season, and has been renewed by ABC for
season 13, as have Criminal Minds season 12 and Criminal Minds: Beyond Borders season two. In addition, Ray Donovan on Showtime and
Quantico on ABC have also been renewed for seasons four and two, respectively.
Production has started on the first season of Conviction starring Hayley Atwell and straight-to-series political thriller Designated Survivor,
starring Kiefer Sutherland. eOne will distribute both series internationally. MGC’s development pipeline is very strong with almost sixty
projects in active development. Projects under development include The Ambassador’s Wife, based on Jennifer Steil's novel starring Anne
Hathaway, Fina Ludlow, based on the novels by Ingrid Thoft, the TV adaptation of the original web-series Whatever, Linda produced by
Secret Location, which has played at over 20 festivals and won over 20 awards worldwide, including Best Drama Series at the International
Academy of Web Television Awards (aka Web Emmys), and The Barbary Coast directed by Academy Award® winner Mel Gibson,
starring Kurt Russell and Golden Globe winner Kate Hudson.
The studio has a number of film productions underway including war comedy War Dogs starring Jonah Hill, war drama Sand Castle, spy
thriller All the Old Knives, Agatha Christie’s Murder on the Orient Express, starring and directed by Kenneth Branagh, and the fairy tale The
Nutcracker and the Four Realms for Disney. Tapping into the ever-growing Chinese cinema market and potential for future US-China co-
production projects, MGC has recently partnered with Pegasus Media Group and China Film Group to produce epic love story Edge of the
World from Oscar®-winning screenwriter David Seidler. Following on from the success of Grey’s Anatomy, MGC has re-teamed with
Grey’s showrunner Shonda Rhimes to produce My Husband’s Ex-wife.
Investment in productions in FY17 is expected to amount to £100 million with half hours delivered anticipated to be around 75. Consistent
with all eOne Group productions, the amount of investment in production does not represent the Group’s investment capital at risk, as the
significant majority of production investment risk is mitigated through commitments received prior to greenlighting from commissioning
broadcasters and government subsidies to reduce the Group’s exposure to around 15%-20% of the investment in production budget.
MUSIC
Revenues for the year were up 11% at £42.2 million (2015: £38.1 million) driven by a strong release schedule. Underlying EBITDA
increased 43% to £2.0 million (2015: £1.4 million), supported by an increasing mix of digital revenues.
£m 2016 20151 Change
Revenue 42.2 38.1 11%
Underlying EBITDA 2.0 1.4 43%
Investment in acquired content 3.1 2.5 24%
1. In the current year third party music label sales made by the Film Distribution business on behalf of the Music business are recognised in Music revenue. Consequently, the prior year Music revenue (and inter-segment eliminations) previously reported has been restated to reflect this change. The impact of the change for the year ended 31 March 2015 was an increase in Music (and inter-segment eliminations) by £19.7m. There is no impact on total Group revenues.
The Group’s independent label has had a strong year from its Urban releases of The Game’s Documentary 2 which debuted at number two
on the US Billboard 200 along with its sequel The Game’s Documentary 2.5 shortly afterwards.
Following the acquisition of Dualtone Music Group in January 2016, the business released Cleopatra in April 2016, the highly anticipated
second album from The Lumineers. The album hit number one on the US Billboard 200 within a week of its release and its lead single,
Ophelia, has spent six weeks at number one on the US Adult Alternative Songs chart. The album was also a major hit in Canada debuting at
number one in the album charts.
The number of albums released in the year was lower at 64 versus 74 in the prior year. This decline is offset by the increase in the number of
digital singles released doubling to 108 compared to 54 in the prior year. The Group’s current roster of artists continues to be strong with the
acquisitions of Dualtone Music Group and Last Gang Entertainment adding to the content slate and strengthening eOne’s position in the
North American music market.
SECRET LOCATION
Secret Location, eOne’s digital investment, currently has a number of projects for different platforms underway focussing on the fast
growing virtual reality industry. eOne’s joint venture with this innovative interactive content studio for emerging platforms positions eOne at
the forefront of developing technologies as the media landscape evolves. For the gaming industry it is working on Blasters of the Universe
designed to be accessible through Oculus VR, HTV Vive and the Steam network, as well as Sony PlaystationVR, and aims to gain market
exposure from early adopters.

Work is underway on a number of projects including digital extensions for CBC’s landmark project The Story of Us and Wild Canadian
Year, also with CBC, as well as a significant VR documentary for General Electric, all representing ground-breaking virtual reality projects.
Secret Location won a Prime Time Emmy® Award for The Sleepy Hollow: VR Experience created last year to promote the second season of
the hit Fox TV series. The historic win marks the first time a virtual reality project has ever been awarded an Emmy® Award or any major
entertainment award. Secret Location also won three Webby Awards, including two for its innovative OrchestraVR project with the
prestigious LA Philharmonic and a Peabody-Facebook Future of Media Awards for Ebola OutbreakVR with PBS.
Secret Location continues to develop innovative original products in the digital space including a large, original serialised virtual reality
project, Insomnia, with Stephen King, as well as their original VR and linear episodic format Halcyon, for IPF and SyFy.
Secret Location will also launch hybrid television/digital project, Sweat the City, featuring a well-known Instagram personality. In October
2015 Secret Location announced the launch of DitchTV, a new way of consuming YouTube content by combining channel surfing with
interactive controls and an intuitive interface.
Family
OVERVIEW
The Family business develops, produces and distributes a portfolio of children’s properties on a worldwide basis, the principal brand being
Peppa Pig, with much of its profitability generated through licensing and merchandising programmes across multiple retail categories. In
addition to managing the growth of Peppa Pig, the Family business is also developing a balanced portfolio of complementary family brands.
Ben & Holly’s Little Kingdom continues to develop in a number of new territories, PJ Masks saw a very strong debut in the US on Disney
Channels and the Group is in development on a number of new brands with major broadcasting partners.
During the year, eOne acquired a 70% stake in Astley Baker Davies Limited (ABD), the creator of Peppa Pig, giving the Group economic
benefit of 85% ownership of the underlying IP in Peppa Pig from 1 August 2015, in addition to the continuation of fees historically earned
by eOne for managing the licensing and merchandising activities of the brand. This gives the Group the ability to control the property’s
strategic development as eOne aims to double the size of the brand. The brand continues to be rolled out into a range of new markets with
broadcasting agreements supported by licensing and merchandising programmes, as well as a significant online presence. As traction for the
brand grows amongst consumers, eOne carefully manages the pace of its retail programmes to ensure the brand’s longevity is maximised.
The early success of PJ Masks in the US and the strong prospects for a licensing programme as it rolls out across Disney channels
internationally are indicative of an exceptional property that will start to build out eOne’s Family portfolio in a more substantive way.
STRATEGY
One of the key strategies for growth in Family is to establish Peppa Pig as the most loved pre-school brand in the world. The first stage of
this process is to build audiences through both traditional broadcast networks and, increasingly, digital platforms. The Group works with
leading children’s channels to drive this awareness; often this phase of the brand’s development can take several years.
Once traction with audiences has been achieved, merchandising programmes can be launched with licensee partners to meet consumer
demand for toys, apparel, stationery and other products. The Group takes a long-term approach with these programmes to gradually build
retail presence and create longevity for the brand.
By adopting this measured approach, eOne has been growing Peppa Pig into a major pre-school brand. Peppa Pig was launched twelve
years ago in the UK and has since grown to become the leading pre-school children’s property in this market, supported by broadcast roll-
outs into the US, Canada, Europe, Australia, Latin America and the Far East. Market data indicates that, with the current exception of Japan,
Peppa Pig is on air in the most important licensed merchandise territories globally. This wide exposure of the brand to global pre-school
audiences (and its widespread acceptance) are expected to help drive future consumer demand over the long-term as Peppa Pig continues to
grow into these substantial markets.
The most significant development for Peppa Pig over the last year has been the consumer launch of the brand in the US, the world’s largest
licensing and merchandising market. In the summer of 2015 the territory’s two largest retailers, Walmart and Target, launched a limited
range of Peppa Pig products, predominantly toys and apparel, two of the largest licensing categories. Sales have been strong and the Group
will gradually expand the product offering during the new financial year to carefully manage the supply of products in relation to demand.
As well as rolling out into new broadcast and consumer territories, the Group has also started production of the fourth series of Peppa Pig.
These new shows not only refresh existing content for broadcasters and digital platforms but also include new characters to help drive future
licensed product development and sales.
The Family strategy also includes the development of a global portfolio of other brands and there have been exciting developments during
the year. Ben & Holly’s Little Kingdom was launched on Nick Jr in the US during the year and although it is early in the brand’s broadcast
development in this territory, the early signs are very encouraging. Further, Ben & Holly will be launched to broadcasters in other territories
around the world in the current year, with licensing programmes to follow as consumer demand builds.
New properties which have been developed and produced by the Group include PJ Masks which had a very successful US broadcast debut
in September 2015 on Disney. The series has been developed in partnership with Disney and France 5 and is based on the popular French
picture books Les Pyjamasques. It is being launched on the Disney and Disney Junior channels worldwide over the coming months, and it is
already a top-rated series for Disney Jr in the UK, Spain, Italy and Germany. The show’s characters and scenarios have been developed with
the licensing markets in mind and more specifically targeting boys to complement the more girl-skewed licensing programme on Peppa Pig.
A range of products such as action figures, playsets, vehicles, clothing and plush items will be launched this autumn in the US. With strong
audience ratings on one of the world’s leading children’s television networks, prospects for PJ Masks look very attractive.
FINANCIAL REVIEW
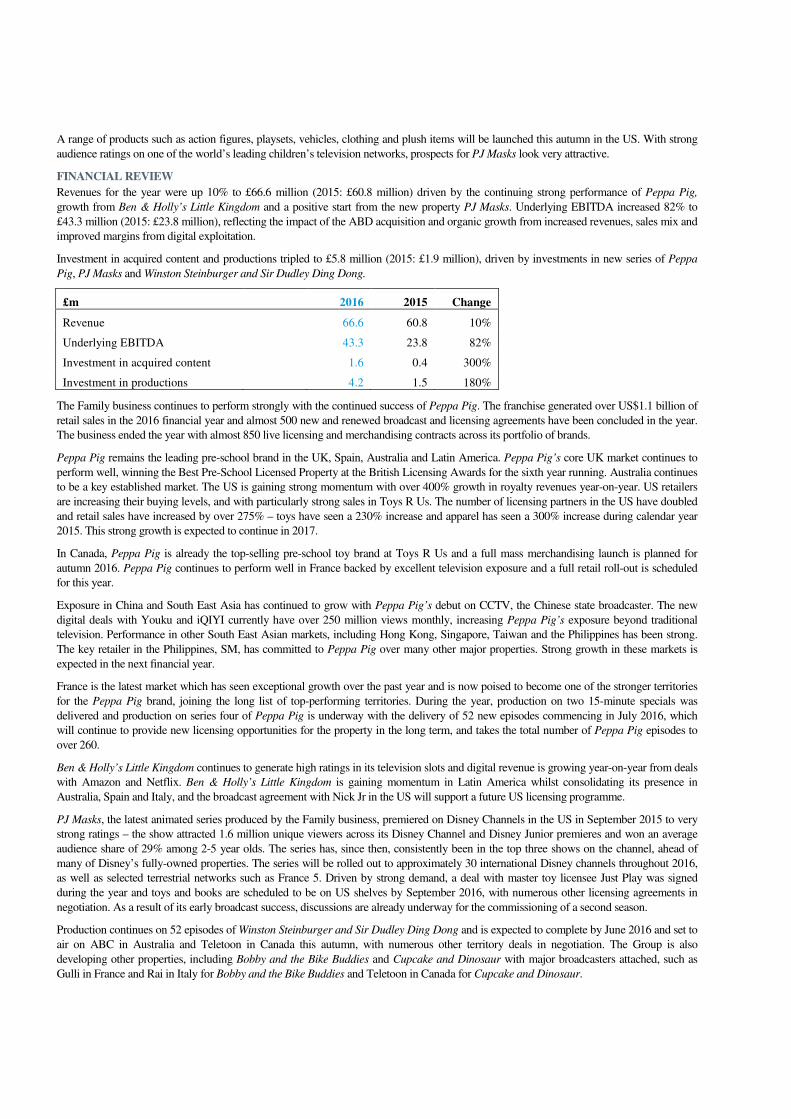
Revenues for the year were up 10% to £66.6 million (2015: £60.8 million) driven by the continuing strong performance of Peppa Pig,
growth from Ben & Holly’s Little Kingdom and a positive start from the new property PJ Masks. Underlying EBITDA increased 82% to
£43.3 million (2015: £23.8 million), reflecting the impact of the ABD acquisition and organic growth from increased revenues, sales mix and
improved margins from digital exploitation.
Investment in acquired content and productions tripled to £5.8 million (2015: £1.9 million), driven by investments in new series of Peppa
Pig, PJ Masks and Winston Steinburger and Sir Dudley Ding Dong.
£m 2016 2015 Change
Revenue 66.6 60.8 10%
Underlying EBITDA 43.3 23.8 82%
Investment in acquired content 1.6 0.4 300%
Investment in productions 4.2 1.5 180%
The Family business continues to perform strongly with the continued success of Peppa Pig. The franchise generated over US$1.1 billion of
retail sales in the 2016 financial year and almost 500 new and renewed broadcast and licensing agreements have been concluded in the year.
The business ended the year with almost 850 live licensing and merchandising contracts across its portfolio of brands.
Peppa Pig remains the leading pre-school brand in the UK, Spain, Australia and Latin America. Peppa Pig’s core UK market continues to
perform well, winning the Best Pre-School Licensed Property at the British Licensing Awards for the sixth year running. Australia continues
to be a key established market. The US is gaining strong momentum with over 400% growth in royalty revenues year-on-year. US retailers
are increasing their buying levels, and with particularly strong sales in Toys R Us. The number of licensing partners in the US have doubled
and retail sales have increased by over 275% – toys have seen a 230% increase and apparel has seen a 300% increase during calendar year
2015. This strong growth is expected to continue in 2017.
In Canada, Peppa Pig is already the top-selling pre-school toy brand at Toys R Us and a full mass merchandising launch is planned for
autumn 2016. Peppa Pig continues to perform well in France backed by excellent television exposure and a full retail roll-out is scheduled
for this year.
Exposure in China and South East Asia has continued to grow with Peppa Pig’s debut on CCTV, the Chinese state broadcaster. The new
digital deals with Youku and iQIYI currently have over 250 million views monthly, increasing Peppa Pig’s exposure beyond traditional
television. Performance in other South East Asian markets, including Hong Kong, Singapore, Taiwan and the Philippines has been strong.
The key retailer in the Philippines, SM, has committed to Peppa Pig over many other major properties. Strong growth in these markets is
expected in the next financial year.
France is the latest market which has seen exceptional growth over the past year and is now poised to become one of the stronger territories
for the Peppa Pig brand, joining the long list of top-performing territories. During the year, production on two 15-minute specials was
delivered and production on series four of Peppa Pig is underway with the delivery of 52 new episodes commencing in July 2016, which
will continue to provide new licensing opportunities for the property in the long term, and takes the total number of Peppa Pig episodes to
over 260.
Ben & Holly’s Little Kingdom continues to generate high ratings in its television slots and digital revenue is growing year-on-year from deals
with Amazon and Netflix. Ben & Holly’s Little Kingdom is gaining momentum in Latin America whilst consolidating its presence in
Australia, Spain and Italy, and the broadcast agreement with Nick Jr in the US will support a future US licensing programme.
PJ Masks, the latest animated series produced by the Family business, premiered on Disney Channels in the US in September 2015 to very
strong ratings – the show attracted 1.6 million unique viewers across its Disney Channel and Disney Junior premieres and won an average
audience share of 29% among 2-5 year olds. The series has, since then, consistently been in the top three shows on the channel, ahead of
many of Disney’s fully-owned properties. The series will be rolled out to approximately 30 international Disney channels throughout 2016,
as well as selected terrestrial networks such as France 5. Driven by strong demand, a deal with master toy licensee Just Play was signed
during the year and toys and books are scheduled to be on US shelves by September 2016, with numerous other licensing agreements in
negotiation. As a result of its early broadcast success, discussions are already underway for the commissioning of a second season.
Production continues on 52 episodes of Winston Steinburger and Sir Dudley Ding Dong and is expected to complete by June 2016 and set to
air on ABC in Australia and Teletoon in Canada this autumn, with numerous other territory deals in negotiation. The Group is also
developing other properties, including Bobby and the Bike Buddies and Cupcake and Dinosaur with major broadcasters attached, such as
Gulli in France and Rai in Italy for Bobby and the Bike Buddies and Teletoon in Canada for Cupcake and Dinosaur.

Film
OVERVIEW
The Group’s Film Division is comprised of its Distribution and Production businesses.
The Group’s Film Distribution business has a local presence in the UK, Canada, Spain, the Benelux, Australia and New Zealand, as well as
in the US and a global digital rights business. On a combined basis, eOne is one of the largest independent film distributors in the world.
The Film Distribution business acquires exclusive film content rights and exploits these rights, alongside original productions, on a single
and multi-territory basis across all media channels. These rights are acquired both through output deals and single picture acquisitions with
independent production studios. The majority of film titles are acquired on a single-picture basis but the Group continues to seek output deals
with producers on attractive commercial terms, where appropriate. During the year, Film expanded its relationship with Steven Spielberg
through the strategic investment in Amblin Partners in December 2015.
Through its film production activities, eOne aims to maximise its access to the best portfolio of content by entering earlier in the production
process and exploiting that content globally, including its core distribution territories. To achieve this global distribution ability, the Film
Division manages international sales activities for its own productions and for films it represents. The production and sales activities have
been expanded during the year through the Group’s strategic investment in Sierra Pictures in December 2015.
STRATEGY
In spite of the short term challenges across the independent film market, Entertainment One has continued to execute its strategy of
partnering with the best content producers to deliver the best content to the world. Over the short term, the Group's strategy to exploit its
diversified library of film content rights to maximise returns, and the multi-year phasing of its revenues have helped to mitigate film market
volatility to deliver a portfolio return for the Division over the medium term.
During the year the Group continued to invest in film content to build future value, at the same time developing closer relationships with key
content producers. One of the most important new relationships is the formation of Amblin Partners, with Entertainment One becoming a
partner alongside Steven Spielberg, Participant Media and Reliance Entertainment. The partnership aligns the Group with one of the most
renowned and successful film producers of all time, allowing it to become the film distributor of choice for future Amblin Partners
productions in its territories, and to share in the global success of these titles through the partnership.
Entertainment One has also expanded its presence in production and international film sales through its investment in Sierra Pictures. The
new partnership brings together the Group’s financial strength in film production with the broad producer relationships held by Sierra
Pictures, while enhancing the Group’s global distribution capability through Sierra’s international sales operation.
The Group also continues to build its own film production pipeline. By engaging in production activities the Group can secure attractive
content earlier on in its lifecycle for distribution across its core territories as well as participate in the upside from the global success of a
release. In 2015, production on Eye in The Sky (a thriller starring Helen Mirren, Alan Rickman and Aaron Paul) was completed and the
movie premiered at the Toronto International Film Festival to critical acclaim. It has generated over US$30 million in global box office
receipts to-date and will continue its international roll-out through the summer. Also during the year, the Group has been in production on the
Ricky Gervais project David Brent: Life on the Road, with excitement already building around its UK release in August 2016.
From a content standpoint, the Group believes that it is well-positioned with an exciting slate of releases in the new financial year and
beyond. Its distribution and production strategy of developing partnerships with film-makers and building scale in film distribution remains
unchanged, with knowledge gained from operating directly in local markets a key competitive differentiator to the Group’s content selection
process.
Operating with the most efficient infrastructure is a key discipline across the Group as it maximises its global distribution network. Its
position as one of the largest independent content distributors in the world gives it not only presence with key retailers, broadcasters and
digital content service providers but also brings scale advantages relative to its smaller peers. As the markets continue to change,
Entertainment One has evolved its structure to ensure that it operates at optimal efficiency, particularly as consumers continue their evolution
from physical products to digital.
During the year, the Group has taken significant steps in addressing the cost structure of its Film Division to ensure that the business is
positioned to maximise profitability in the future. The Group continues to focus on driving margin improvements in the Film Division,
through a wide-reaching restructuring of how the Division operates, which is expected to deliver annual cost savings of £10 million from
FY18.
As part of this restructuring programme, new partnerships have been created with 20th Century Fox Home Entertainment, on a multi-
territory basis, and Sony Pictures Home Entertainment, in the US, to ensure that the Group remains best-positioned to compete in the
evolving home entertainment marketplace. These partnerships give eOne the benefit of scale at retail and increased cost efficiencies and
placement opportunities across its territories.
After the short term slate challenges experienced by the Group recently, Entertainment One remains well-positioned in distribution with a
strong slate for the rest of 2016 and beyond. New long-term content partnerships will bring high quality releases into the pipeline, driving
further revenue opportunities across an efficient sales infrastructure. As the film market continues to evolve, eOne remains focused on
maximising the value that can be delivered from its extensive film content library by exploiting the Group's content assets across the broadest
range of commercial opportunities. eOne continues to explore options for increasing the coverage of its international network, either through
potential corporate opportunities or partnerships.

FINANCIAL REVIEW
Revenues decreased by 7% to £553.4 million (2015: £592.6 million), driven by Film Distribution, partly offset by Film Production.
Underlying EBITDA was 28% lower year-on-year driven by Film Distribution.
£m 2016 2015 Change
Revenue 553.4 592.6 (7%)
Film Distribution 494.9 581.4 (15%)
Theatrical 64.9 79.7 (19%)
Home entertainment 192.4 246.0 (22%)
Broadcast and digital 189.1 214.6 (12%)
Other 48.5 41.1 18%
Film Production 60.4 20.9 189%
Eliminations (1.9) (9.7) (80%)
Underlying EBITDA 52.8 73.1 (28%)
Investment in acquired content 98.3 154.2 (36%)
Investment in productions 11.9 21.5 (45%)
FILM DISTRIBUTION
Revenues decreased by 15% to £494.9 million (2015: £581.4 million). This was mainly driven by lower theatrical activity and title-specific
under-performance, driving theatrical revenues down 19%. Home entertainment revenues were down 22% reflecting theatrical performance
and general market decline.
Theatrical
Overall theatrical revenues decreased reflecting lower box office takings, which were down by 16% to US$259 million (2015: US$308
million). This reduction was driven by challenging market conditions, in which the Group had a reduced volume of releases year-on-year
(210 compared to 227 in 2015) and under-performance of a number of specific titles.
Despite the overall weaker box office performance, the Group had a number of notable releases in the year which included Spotlight, winner
of Best Picture at the Oscars®, being the Group’s second Best Picture winner in the last three years. Other key releases included The
Divergent Series: Allegiant Part 1, Insidious: Chapter 3, The Hunger Games: Mockingjay Part 2, Quentin Tarantino’s The Hateful Eight,
Sicario and Southpaw.
The slate for the new financial year is expected to feature a number of high profile releases and the Group’s investment in acquired content is
expected to increase to around £160 million. The 2017 release slate includes highly anticipated titles such as The BFG, directed by Steven
Spielberg, The Girl on the Train, based on the best-selling book, both sourced from the Group’s new partnership with Amblin Partners, and
David Brent: Life on the Road, starring Ricky Gervais reprising his character from the original UK version of The Office.
Home entertainment
Revenues decreased by 22% reflecting the continuing migration from physical to digital formats as well as the flow-through impact of fewer
theatrical releases and the weaker 2015 and 2016 theatrical slate on the home entertainment window. In total, 569 DVDs and Blu-rays were
released (2015: 690) including strong performing titles such as The Divergent Series: Insurgent, The Hunger Games: Mockingjay Part 2,
Paddington and Mr. Holmes.
eOne’s new partnerships with 20th Century Fox Home Entertainment, on a multi-territory basis, and Sony Pictures Home Entertainment, in
the US, ensure that the Group remains best-positioned to compete in the physical home entertainment marketplace as it transitions to a digital
future.
Over 400 releases are planned for release in the new financial year including The Divergent Series: Allegiant Part 1, The BFG, The Girl on
the Train and David Brent: Life on the Road. The planned reduction in the number of releases is driven by fewer non-theatrical releases,
partly offset by an increase in the number of theatrical DVD releases.
Broadcast and digital
The Group’s combined broadcast and digital revenues were 12% lower reflecting the impact of lower box office revenues in 2015 on the
television and digital exploitation windows.
Key broadcast/digital titles in the year included The Divergent Series: Insurgent, Nativity 3, Insidious: Chapter 3, The Hunger Games:
Mockingjay Part 1, Nightcrawler, Sicario and Mr Turner.
During 2016 the Group renewed its deal with Amazon Instant Video in the UK, giving Amazon Prime members exclusive access to all eOne
new releases from its future film slate. In addition, the Benelux has new agreed deals with Proximus and BETV and Spain has signed a new
output deal with Movistar+ and Netflix.
Canada has agreed a number of significant deals during the year, including an agreement with Netflix to distribute The Hunger Games
franchise as well as catalogue titles. In addition, Canada signed a five-year output deal with TVA, the number one French Canadian
broadcaster and signed a new deal with Shomi in May which will add more than 175 films to Shomi’s viewing catalogue and a landmark
joint deal with Shomi and Corus for the entire Divergent franchise.

FILM PRODUCTION
Revenues increased by 189% to £60.4 million (2015: £20.9 million). In the year, eOne delivered titles including Sinister 2, Insidious:
Chapter 3 and Eye in the Sky generating global box office revenues of US$221 million to May 2016 (2015 titles: US$62 million, driven by
Suite Française and Woman in Black: Angel of Death). Eye in the Sky received strong reviews from its worldwide premiere at the Toronto
International Film Festival and has sold to all territories worldwide.
The pipeline for the new financial year includes a number of exciting projects. David Brent: Life on the Road, written by and starring Ricky
Gervais, is expected to be delivered in summer 2016, and will be released in eOne’s territories as well as the remaining rights being sold
internationally, with a deal already secured with a global OTT platform. eOne also has distribution rights for its production Message from the
King in its distribution territories and all other territories on a global basis. Additionally, eOne has the international rights, excluding Canada
and France, for Cannes Jury Prize winner Xavier Dolan’s first English language film, The Death and Life of John F Donovan, starring
Jessica Chastain, Kit Harrington, Kathy Bates, Michael Gambon and Natalie Portman – it is expected to be delivered at the end of the next
financial year.
Entertainment One is positioning a trio of films to begin principal photography before the end of the year. Molly’s Game, produced as part of
the partnership with Mark Gordon Productions, tells the story of Molly Bloom, who ran the world’s most exclusive high stakes poker game
before being arrested by the FBI, and is written by Aaron Sorkin and marks his directorial debut. The film stars Jessica Chastain and Idris
Elba. Stan and Ollie, about the beloved comedy duo Stan Laurel and Oliver Hardy, stars Steve Coogan and John C. Reilly. Villa Capri is a
comedy starring Morgan Freeman and Tommy Lee Jones. All three films have significantly outperformed sales expectations at the recent
Cannes Film Festival. Production’s global sales business has also seen a strong performance in the year with significant sales of the
international rights of Trumbo, Captain Fantastic and the Oscar®-winning Spotlight.
During the year eOne strengthened its production and global sales businesses through a strategic investment in Sierra Pictures. Going
forward, the international sales and distribution of films produced and acquired by eOne, as well as eOne-distributed films from The Mark
Gordon Company, will be handled by Sierra outside of Canada, the UK, Australia/New Zealand, Benelux and Spain, where eOne directly
distributes titles.
Investment in productions is expected to grow to around £70 million (2016: £11.9 million) in the new financial year.

OTHER FINANCIAL INFORMATION
Adjusted operating profit increased by 20% to £124.7 million (2015: £103.6 million) reflecting the growth in the Group’s underlying
EBITDA. Adjusted profit before tax increased by 17% to £104.1 million (2015: £88.8 million), in line with increased adjusted operating
profit, partly offset by higher underlying finance charges reflecting higher average debt levels year-on-year, following the acquisition of The
Mark Gordon Company in January 2015, and higher interest rates following the re-financing in December 2015. Reported operating profit
increased by 25% to £75.0 million, with the Group reporting a profit before tax of £47.9 million (2015: £44.0 million).
Reported Adjusted
Group
2016
£m
2015
£m
2016
£m
2015
£m
Revenue 802.7 785.8 802.7 785.8
Underlying EBITDA 129.1 107.3 129.1 107.3
Amortisation of acquired intangibles (27.4) (22.2) - -
Depreciation and amortisation of software (4.4) (3.7) (4.4) (3.7)
Share-based payment charge (4.1) (3.4) - -
Tax, finance costs and depreciation related to joint ventures (1.6) 0.1 - -
One-off items (16.6) (17.9) - -
Operating profit¹ 75.0 60.2 124.7 103.6
Net finance costs (27.1) (16.2) (20.6) (14.8)
Profit before tax 47.9 44.0 104.1 88.8
Tax2 (7.7) (2.7) (24.5) (20.0)
Profit for the year 40.2 41.3 79.6 68.8
1. Adjusted operating profit excludes amortisation of acquired intangibles, share-based payment charge, tax, finance costs and depreciation related to joint ventures and operating one-off items and one-off items relating to the Group’s financing arrangements.
2. The Group calculates the effective tax rate after adjusting for the share of results of joint ventures of £3.4 million (2015: £0.2 million). The Group calculates the adjusted effective tax rate after adjusting for profit before tax relating to joint ventures of £5.0 million (2015: £0.1 million) and the related underlying income tax charge of £2.1 million (2015: £nil) (excluding tax one-off credits of £0.5 million recognised during the year (2015: £0.1 million credit)).
JOINT VENTURES
Underlying EBITDA includes £5.0 million of EBITDA related to joint ventures, of which £4.7 million relates to MGC. Following the
change in the MGC shareholder agreement in May 2015 the financial results of MGC are now fully consolidated.
AMORTISATION OF ACQUIRED INTANGIBLES
Amortisation of acquired intangibles increased by £5.2 million to £27.4 million reflecting the increased acquisition and investment activity
throughout the year, which included The Mark Gordon Company (fully consolidated from May 2015), Astley Baker Davies Limited, Sierra
Pictures, Dualtone Music Group and Last Gang Entertainment. The FY17 charge is expected to increase to around £33 million, reflecting the
full year impact of the acquisitions completed during FY16.
DEPRECIATION & CAPITAL EXPENDITURE
Depreciation, which includes the amortisation of software, has increased by £0.7 million to £4.4 million, reflecting the higher level of
investment in software and property, plant and equipment as the Group grows.
Capital expenditure on property, plant and equipment and software increased £5.0 million to £7.7 million (2015: £2.7 million) (excluding
Production capital expenditure of £0.9 million (2015: £0.3 million)), primarily reflecting the move to a new office location in Toronto in
September 2015.
SHARE-BASED PAYMENT CHARGE
The share-based payment charge of £4.1 million has increased by £0.7 million during the year, as a result of the ongoing effect of the
broadening of the number of employees to whom grants were made under the Group’s Long Term Incentive Plan.
ONE-OFF ITEMS
During the year ended 31 March 2016 the Group continued to develop and progress its growth strategy, including the reorganisation of the
physical distribution business. One-off restructuring costs of £12.4 million were incurred during the year and included closure of facilities in
North America and costs of moving physical stock from those facilities, staff redundancies and a reassessment of the carrying value of
investment in acquired content rights and other assets throughout the Group’s Home Entertainment business, specifically relating to the
closure of the Group’s UK-based international home video business.
In addition, in line with the increased acquisition and investment activity during the year, costs of £7.0 million were incurred relating to The
Mark Gordon Company (fully consolidated from 19 May 2015), Astley Baker Davies Limited (22 October 2015), Sierra Pictures (22
December 2015), Dualtone Music Group (11 January 2016), Last Gang Entertainment (7 March 2016) and Renegade 83 (24 March 2016). A
credit of £2.8 million related to the release of excess accruals in relation to the Alliance transaction.
NET FINANCE COSTS
Reported net finance costs increased by £10.9 million to £27.1 million. These included one-off net finance costs of £6.5 million in the current
year mainly relating to the write-off of unamortised deferred finance charges expensed to the income statement following the Group’s re-

financing in December 2015. Adjusted finance charges (which exclude one-off items) of £20.6 million were £5.8 million higher in the
current year, reflecting higher average debt levels year-on-year driven by The Mark Gordon Company acquisition in January 2015, which
was financed with debt, and higher interest rates following the Group’s re-financing in December 2015. The weighted average interest rate
for the Group’s corporate facility was 5.6%, compared to 4.5% in the prior year. The FY17 weighted average interest rate is expected to be
6.5%, which is higher than FY16 driven by the full year impact of the re-financing completed in December 2015.
TAX
On a reported basis the Group's tax charge of £7.7 million (2015: £2.7 million), which includes the impact of one-off items, represents an
effective rate of 17.3% compared to 6.2% in the prior year. On an adjusted basis, the effective rate is in line with the prior year at 22.6%
(2015: 22.6%). The FY17 effective tax rate on an adjusted basis is expected to be approximately 23%.
CASH FLOW & NET DEBT
The table below reconciles cash flows associated with the net debt of the Group. It excludes cash flows associated with production activities
which are reconciled in the Production Financing section below.
£m (unless specified) 2016 2015
Television Family Film Centre Total Television Family Film Centre Total
Underlying EBITDA 32.0 43.6 51.8 (6.2) 121.2 7.5 24.1 71.7 (7.4) 95.9
Content investment/amort’n gap 5.5 (1.5) 21.6 - 25.6 5.3 (0.2) (6.1) - (1.0)
Prod’n investment/amort’n gap (7.7) (1.6) (3.2) - (12.5) - 0.7 (0.4) - 0.3
Working capital (15.6) (13.3) (25.3) - (54.2) (17.2) 1.3 (47.1) - (63.0)
Joint venture movements (4.5) - - - (4.5) (0.4) - (0.1) - (0.5)
Adjusted cash flow 9.7 27.2 44.9 (6.2) 75.6 (4.8) 25.9 18.0 (7.4) 31.7
Cash conversion (%) 30% 62% 87% - 62% (64%) 107% 25% - 33%
Capital expenditure
Tax paid
(7.7)
(2.7)
(14.4) (5.5)
Net interest paid (10.2) (10.9)
Free cash flow 43.3 12.6
One-off items (inc financing) (20.7) (17.2)
Acquisitions, net of net debt acquired (inc intangibles) (177.0) (105.4)
Net proceeds of share issue 194.5 -
Dividends paid (4.0) (2.9)
Foreign exchange 8.0 (1.0)
Movement 44.1 (113.9)
Net debt at the beginning of the year (224.9) (111.0)
Net debt at the end of the year (180.8) (224.9)
Adjusted cash flow
Adjusted cash flow at £75.6 million is higher than prior year by £43.9 million, with improved cash flow in all Divisions, representing an
underlying EBITDA to adjusted cash flow conversion of 62% (2015: 33%).
Television
The Television adjusted cash inflow improved in the year to £9.7 million (2015: (£4.8m) outflow), representing an underlying EBITDA
to adjusted free cash flow conversion of 30% (2015: -64%), driven by the increase in underlying EBITDA, partly offset by the
investment in productions gap in MGC relating to Conviction and Designated Survivor both of which were financed from MGC cash
reserves without the use of production financing. The working capital outflow in the current financial year of £15.6 million mainly
relates to the increase in receivables reflecting the increase in SVOD revenues, where the payment terms spread receipts over the term of
the licence.
Family
The Family adjusted cash inflow increased to £27.2 million (2015: £25.9m), representing an underlying EBITDA to adjusted cash flow
conversion of 62% (2015: 107%). The cash flow conversion reduction primarily reflects one-time working capital outflows related to the
lower royalty payable accrual as a result of the ABD acquisition.
Film
The Film adjusted cash inflow of £44.9 million delivers an underlying EBITDA to adjusted cash flow conversion of 87% (2015: 25%).
This has significantly improved compared to the prior year, despite the reduced underlying EBITDA, driven by lower year-on-year
working capital outflows as the prior year included a number of non-recurring acquisition related outflows. In addition, Film’s
investment in acquired content gap in the year is positive as a result of lower investment spend, as fewer titles have been acquired than
during the prior year, and the timing of minimum guarantee payments. The working capital outflow in the current financial year of £25.3
million is primarily due to an increase in receivables driven by the profile of year-on-year Q4 revenue phasing and a decrease in creditors
mainly due to the lower royalties reflecting film slate performance in the year.

Free cash flow
Positive free cash flow for the Group of £43.3 million was £30.7 million higher than the previous year driven by increased adjusted cash
flow offset by increased capital expenditure and tax payments in the year. Capital expenditure increased to £7.7 million mainly driven by
costs associated with the consolidation of the Group’s Toronto offices. Tax paid increased by £8.9 million to £14.4 million due to the impact
of consolidating MGC as a subsidiary and the acquisition of ABD. Net cash interest paid is broadly in line with prior year, even though the
overall cost of debt has increased, as the interest on the Group’s senior secured notes is paid on a bi-annual basis with the first payment due
in July 2016.
Net debt
In December 2015, the Group re-financed its existing credit facility through the issuance of £285 million senior secured notes (due 2022) and
the closing of a new £100 million revolving credit facility maturing in 2020. At 31 March 2016, overall net debt at £180.8 million was £44.1
million better than the prior year primarily reflecting the positive free cash flow of the Group. Net debt leverage improved to 1.4x Group
EBITDA (2015: 2.1x). Other major cash flow movements in the year included one-off items, proceeds from the equity raise to fund
acquisitions and dividend payments.
The net proceeds of the share issue of £194.5m related to the Group’s rights issue in October 2015. These proceeds have been used to acquire
the following businesses net of acquired net debt: 70% of Astley Baker Davies Limited in October 2015 for £140.5 million, 100% of
Dualtone Music Group in January 2016 for £2.9 million, 100% of Last Gang Entertainment in March 2016 for £0.9 million, 65% of
Renegade 83 in March 2016 for £14.0 million, as well as the investment in Sierra Pictures in December 2015 for £8.8 million and the
purchase of acquired intangibles of £17.9 million primarily relating to the Amblin Partners investment. The acquisition spend also includes
an inflow of £7.7 million resulting from the consolidation of MGC from May 2015 and £0.3 million due to finalisation of the Paperny
Entertainment working capital position.
The dividends paid of £4.0 million includes £3.2 million relating to the final dividend of 1.1 pence per share in respect of the year ended 31
March 2015 paid on 10 September 2015 and £0.8 million paid to the non-controlling shareholders of Astley Baker Davies Limited.
Foreign exchange gains of £8.0 million (2015: £1.0 million loss) occurred during the year. In the current year, the movements are primarily
related to the translation impact of the strengthening of pounds sterling against the Canadian dollar to December 2015, when the Group re-
financed the senior debt facility (c.50% denominated in Canadian dollar) to the pounds sterling denominated senior secured notes.
PRODUCTION FINANCING
Overall production financing increased £28.7 million year-on-year to £118.0 million primarily reflecting the positive investment in
productions gap where amortisation of film productions exceeded investment spend, driven by the timing of film deliveries year-on-year.
This was offset by the production financing acquired as part of the Sierra deal.
£m 2016 2015
Television Family Film Total Television Family Film Total
Underlying EBITDA 7.2 (0.3) 1.0 7.9 10.3 (0.3) 1.4 11.4
Prod’n investment/amort’n gap 5.8 (1.1) 21.3 26.0 (11.9) (1.3) (19.4) (32.6)
Working capital (11.4) 0.5 3.5 (7.4) (2.3) 1.0 (5.6) (6.9)
Joint venture movements - - (0.5) (0.5) - - 0.4 0.4
Adjusted cash flow 1.6 (0.9) 25.3 26.0 (3.9) (0.6) (23.2) (27.7)
Capital expenditure
Tax paid
(0.9)
(0.3)
(3.3) (5.3)
Net interest paid (0.1) (2.5)
Free cash flow 21.7 (35.8)
One-off items (inc financing) (0.6) -
Acquisitions, net of production financing acquired (49.0) (0.7)
Foreign exchange (0.8) 1.2
Movement (28.7) (35.3)
Net production financing at the beginning of the year (89.3) (54.0)
Net production financing at the end of the year (118.0) (89.3)
The Production cash flows relate to production financing which is used to fund the Group’s television, family and film productions. The
financing is arranged on an individual production basis by special purpose production subsidiaries which are excluded from the security of
the Group’s corporate facility. It is short-term financing whilst the production is being made and is paid back once the production is delivered
and the sales receipts and tax credits are received. The Company deems this type of financing to be working capital and therefore timing-
based, in nature. The Company therefore shows the cash flows associated with these activities separately. The Company also believes that
higher production net debt demonstrates an increase in the success of the Television, Family and Film production businesses, which helps
drive revenues for the Group and therefore increases the generation of EBITDA and cash for the Group, which in turn reduces the Group’s
net debt leverage.

FINANCIAL POSITION AND GOING CONCERN BASIS
The Group’s net assets increased by £295.6 million to £660.4 million at 31 March 2016 (31 March 2015: £364.8 million). The increase
primarily reflects the acquired assets from the acquisitions and investments made during the year.
The directors acknowledge guidance issued by the Financial Reporting Council relating to going concern. The directors consider it
appropriate to prepare the consolidated financial statements on a going concern basis, as set out in Note 3 to the consolidated financial
statements.
CONSOLIDATED FINANCIAL STATEMENTS
Independent Auditor’s Report to the Members of Entertainment One Ltd.
Consolidated Income Statement
Consolidated Statement of Comprehensive Income
Consolidated Balance Sheet
Consolidated Statement of Changes in Equity
Consolidated Cash Flow Statement
NOTES TO THE CONSOLIDATED FINANCIAL STATEMENTS
1. Nature of operations and general information
2. New, amended, revised and improved Standards
3. Significant accounting policies
4. Significant accounting judgements and key sources of estimation uncertainty
5. Segmental analysis
6. Operating profit
7. Key management compensation and directors’ emoluments
8. Staff costs
9. One-off items
10. Finance income and finance costs
11. Tax
12. Deferred tax assets and liabilities
13. Dividends
14. Earnings per share
15. Goodwill
16. Other intangible assets
17. Investment in productions
18. Property, plant and equipment
19. Inventories
20. Investment in acquired content rights
21. Trade and other receivables
22. Cash and cash equivalents
23. Interest-bearing loans and borrowings
24. Production financing
25. Trade and other payables
26. Provisions
27. Business combinations
28. Subsidiaries
29. Interests in joint ventures
30. Interests in partly-owned subsidiaries
31. Financial instruments
32. Financial risk management
33. Stated capital, own shares and other reserves
34. Share-based payments
35. Commitments and contingencies
36. Related party transactions

INDEPENDENT AUDITOR’S REPORT
TO THE MEMBERS OF ENTERTAINMENT ONE LTD.
OPINION ON THE CONSOLIDATED FINANCIAL STATEMENTS OF ENTERTAINMENT ONE LTD.
In our opinion:
– the consolidated financial statements give a true and fair view of
the state of the Group’s affairs as at 31 March 2016 and of the
Group’s profit for the year then ended; and
– the Group’s consolidated financial statements have been
properly prepared in accordance with International Financial
Reporting Standards (IFRSs) as adopted by the European Union.
The consolidated financial statements comprise the consolidated
income statement, the consolidated statement of comprehensive
income, the consolidated balance sheet, the consolidated statement
of changes in equity, the consolidated cash flow statement and the
related Notes 1 to 36. The financial reporting framework that has
been applied in their preparation is applicable law and IFRSs as
adopted by the European Union.
GOING CONCERN AND THE DIRECTORS’ ASSESSMENT OF THE PRINCIPAL RISKS THAT WOULD THREATEN THE SOLVENCY OR LIQUIDITY OF THE GROUP
As required by the Listing Rules we have reviewed the directors’
statement regarding the appropriateness of the going concern basis
of accounting and the directors’ statement on the longer-term
viability of the Group contained within the Directors’ Report.
We have nothing material to add or draw attention to in relation to:
– the directors' confirmation that they have carried out a robust
assessment of the principal risks facing the Group, including
those that would threaten its business model, future performance,
solvency or liquidity;
– the disclosures that describe those risks and explain how they are
being managed or mitigated;
– the directors’ statement in note 3 to the financial statements
about whether they considered it appropriate to adopt the going
concern basis of accounting in preparing them and their
identification of any material uncertainties to the Group’s ability
to continue to do so over a period of at least twelve months from
the date of approval of the financial statements;
– the directors’ explanation as to how they have assessed the
prospects of the Group, over what period they have done so and
why they consider that period to be appropriate, and their
statement as to whether they have a reasonable expectation that
the Group will be able to continue in operation and meet its
liabilities as they fall due over the period of their assessment,
including any related disclosures drawing attention to any
necessary qualifications or assumptions.
We agreed with the directors’ adoption of the going concern basis of
accounting and we did not identify any such material uncertainties.
However, because not all future events or conditions can be
predicted, this statement is not a guarantee as to the Group’s ability
to continue as a going concern.
INDEPENDENCE
We are required to comply with the Financial Reporting Council’s
Ethical Standards for Auditors and we confirm that we are
independent of the Group and we have fulfilled our other ethical
responsibilities in accordance with those standards. We also confirm
we have not provided any of the prohibited non-audit services
referred to in those standards.
OUR ASSESSMENT OF RISKS OF MATERIAL MISSTATEMENT
The assessed risks of material misstatement described below are
those that had the greatest effect on our audit strategy, the allocation
of resources in the audit and directing the efforts of the engagement
team.
Risk How the scope of our audit responded to the risk
ACCOUNTING FOR INVESTMENT IN ACQUIRED
CONTENT RIGHTS AND INVESTMENT IN PRODUCTIONS
As set out in Notes 17 and 20, the Group has £241.3m (2015:
£221.1m) of investment in acquired content rights and £133.8m
(2015: £85.5m) of investment in productions on the consolidated
balance sheet at 31 March 2016.
Accounting for the amortisation of these assets requires significant
judgement as it is directly affected by management’s best estimate
of future revenues, which are determined from opening box office
performance or initial sales data, the pattern of historical revenue
streams for similar genre productions and the remaining life of the
Group’s rights.
There is a risk that inappropriate assumptions are made in respect of
the forecast future revenues which could result in the recognition of
expenses not appropriately matching the flow of economic benefits
from the underlying assets.
Our audit approach included an assessment of the design and
implementation of key controls related to the process for estimating
and maintaining future revenue forecasts and the mechanical
calculation of the amortisation and royalty charges.
We have assessed management’s process for estimating future
revenues, specifically by:
– discussing the expectations for a selection of titles and shows
(including titles yet to be released), and corroborating
management’s forecasts by looking at box office, home
entertainment, SVOD and TV performance (based on current
sales data, past performance of similar titles and other specific
market information and contractual arrangements); and
– assessing whether the carrying value of the balances are
considered recoverable by analysing the assets on a portfolio
basis (Film – by release year, TV – by show type) and comparing
the carrying value as at 31 March 2016 against current year
revenue and remaining forecast future revenues to determine if
any indicators of impairment exist.

Risk How the scope of our audit responded to the risk
CARRYING VALUE OF GOODWILL AND OTHER
INTANGIBLE ASSETS
As set out in Notes 15 and 16, the Group carries £353.9m (2015:
£209.8m) of goodwill and a further £320.5m (2015: £87.6m) of
other intangible assets on the consolidated balance sheet at 31
March 2016.
Management prepare a detailed assessment of the carrying value of
goodwill and other intangible assets by cash generating unit (CGU)
using a number of judgemental assumptions (as described in note 15
to the financial statements) including 2016 Board-approved
forecasts, discount rates and long-term growth rates. There is a risk
that the application of inappropriate assumptions supports assets that
should otherwise be impaired.
We tested the design and implementation of controls over goodwill
and other intangible assets recognition and impairment.
We considered whether management’s impairment review
methodology is compliant with IAS 36 Impairment of Assets.
We challenged management’s assumptions used in the impairment
model for goodwill and other intangible assets, as described in Note
15 to the consolidated financial statements. Our audit work on the
assumptions used in the impairment model focussed on:
– using valuation experts to determine the appropriateness of the
discount rates applied and benchmarking the rates against a
relevant comparator group;
– agreeing the underlying cash flow projections for each CGU to
Board-approved forecasts;
– comparing short-term cash flow projections against recent
performance and historical forecasting accuracy;
– assessing the long-term growth rates used against independent
market data; and
– considering the appropriateness of management’s sensitivity
analysis to ensure no further indicator of impairment is identified.
ACQUISITION ACCOUNTING
As set out in Note 27, the Group has made a number of acquisitions
in the period, with total cash consideration in the year of £170.2m,
including The Mark Gordon Company, Astley Baker Davies
Limited, Sierra Pictures LLC and Renegade 83.
The accounting for these acquisitions can be complex and involves
judgement, including the appropriate classification (associate, joint-
venture, or subsidiary) and in relation to the valuation of acquired
intangible assets. Given the complexity, there is a risk of
inappropriate accounting and therefore misleading presentation in
the financial statements.
We tested the design and implementation of controls over key
outputs of the Group’s acquisition accounting, including controls
over the consideration of accounting treatments for new or complex
areas and the oversight exercised by Group finance over the
alignment of accounting policies.
We reviewed the sale and purchase agreements and discussed the
substance of the arrangements with management. We audited the
acquisition accounting noting, in particular the requirements of IFRS
3 Business Combinations, IFRS 10 Consolidated Financial
Statements and IFRS 11 Joint Arrangements in assessing the
appropriate classification and presentation.
Our audit procedures also included the following:
– testing the validity and completeness of consideration by
reference to supporting evidence;
– assessed the qualifications and experience of key specialists
engaged by the Group;
– assessing the process that management has undertaken to
determine the fair value of the acquired intangible assets
including understanding the scope of work performed; and
– using valuation experts to determine the appropriateness of
management’s assumptions and methodology supporting the fair
value of acquired intangible assets (including exclusive content
agreements and libraries and trade names and brands) for each
significant acquisition in the year, by reference to, amongst other
things, historical trends, and assumptions used in similar
historical acquisitions.
REVENUE RECOGNITION
As described in Note 3, the Group derives its revenues from the
licensing, marketing, distribution and trading of feature films,
television, video programming and music rights and family
licensing and merchandising sales.
The risk of material misstatement due to valuation and cut-off errors
will manifest itself in different ways in each segment depending on
the nature of trade and the respective revenue recognition policies
(e.g. early recognition of physically distributed titles or license fees
We tested the design and implementation of controls over the key
revenue streams in each financially significant business unit.
Our audit procedures included:
– assessing the Group’s revenue recognition policy and confirming
the consistent application of the policy across the Group;
– completing detailed substantive procedures with regards to the
significant revenue streams by agreeing to third party
confirmation, royalty statements, gross box office revenues and
other supporting information;

Risk How the scope of our audit responded to the risk
for titles where the license period has not commenced). – reviewing significant SVOD and licencing and merchandising
contracts to corroborate licence period commencement and
delivery dates to ensure revenue was recognised in the correct
period; and
– performing detailed testing on the returns provision calculations,
and assessing whether the methodology applied is appropriate for
each business unit based on the historical level of returns.
Last year our report included two risks which are not included in
our report this year: the presentation and consistency of the
income and expenditure presented separately as one-off items
and deferred tax assets. They are no longer considered to be risks
that had the greatest effect on our audit strategy, the allocation of
resources in the audit and directing the efforts of the engagement
team. The acquisition accounting risk is newly disclosed in the
current year as it is a key area of focus due to the number of
businesses acquired including The Mark Gordon Company,
Astley Baker Davies Limited, Sierra Pictures and Renegade 83.
The description of risks above should be read in conjunction with
the significant issues considered by the Audit Committee as
discussed in their Report.
These matters were addressed in the context of our audit of the
financial statements as a whole, and in forming our opinion
thereon, and we do not provide a separate opinion on these
matters.
OUR APPLICATION OF MATERIALITY
We define materiality as the magnitude of misstatement in the
financial statements that makes it probable that the economic
decisions of a reasonably knowledgeable person would be
changed or influenced. We use materiality both in planning the
scope of our audit work and in evaluating the results of our work.
We determined materiality for the Group to be £3.6m (2015:
£3.2m), which is approximately 5% (2015: 5%) of profit before
tax after adding back operating and net financing one-off items.
We use this as a base for materiality as it is a key measure of
underlying business performance for the Group.
We agreed with the Audit Committee that we would report to the
Committee all audit differences in excess of £72,000 (2015:
£64,000), as well as differences below that threshold that, in our
view, warranted reporting on qualitative grounds. We also report
to the Audit Committee on disclosure matters that we identified
when assessing the overall presentation of the consolidated
financial statements.
AN OVERVIEW OF THE SCOPE OF OUR AUDIT
Our Group audit was scoped by obtaining an understanding of
the Group and its environment, including Group-wide controls,
and assessing the risks of material misstatement at the Group
level. Based on that assessment, we focused our Group audit
scope primarily on the UK and Canadian business units and The
Mark Gordon Company. Six (2015: five) business units were
subject to a full audit, whilst the remaining business units were
subject to analytical review procedures performed by the Group
audit team. The six full scope divisions represent the principal
business units and account for 70% (2015: 69%) of the Group’s
revenue and 87% (2015: 85%) of the Group’s underlying
EBITDA. They were also selected to provide an appropriate
basis for undertaking audit work to address the risks of material
misstatement identified above. Our audit work at the different
locations was executed at levels of materiality applicable to each
individual entity which were lower than Group materiality and
ranged from £1.8m to £2.2m (2015: £1.8m to £2.1m).
At the parent entity level we also tested the consolidation process
and carried out analytical procedures to confirm our conclusion
that there were no significant risks of material misstatement of
the aggregated financial information of the remaining
components not subject to audit or audit of specified account
balances.
The Group audit team continued to follow a programme of
planned visits that has been designed so that the Senior Statutory
Auditor or a senior member of the Group audit team visits each
of the locations where the Group audit scope was focused at least
once every year. In addition, for each component in scope, we
reviewed and challenged the key issues and audit findings,
attended the component close meetings and reviewed formal
reporting and selected work papers from the component auditors.
MATTERS ON WHICH WE ARE REQUIRED TO REPORT BY EXCEPTION
CORPORATE GOVERNANCE STATEMENT
Under the Listing Rules we are also required to review the part
of the Corporate Governance Statement relating to the
Company’s compliance with certain provisions of the UK
Corporate Governance Code. We have nothing to report arising
from our review.
OUR DUTY TO READ OTHER INFORMATION IN THE
ANNUAL REPORT
Under International Standards on Auditing (UK and Ireland), we
are required to report to you if, in our opinion, information in the
annual report is:
– materially inconsistent with the information in the audited
financial statements; or
– apparently materially incorrect based on, or materially
inconsistent with, our knowledge of the group acquired in the
course of performing our audit; or
– otherwise misleading
In particular, we are required to consider whether we have
identified any inconsistencies between our knowledge acquired
during the audit and the directors’ statement that they consider
the annual report is fair, balanced and understandable and
whether the annual report appropriately discloses those matters
that we communicated to the audit committee which we consider
should have been disclosed. We confirm that we have not
identified any such inconsistencies or misleading statements.

RESPECTIVE RESPONSIBILITIES OF DIRECTORS AND AUDITOR
As explained more fully in the Directors’ Responsibilities
Statement, the directors are responsible for the preparation of the
financial statements and for being satisfied that they give a true
and fair view. Our responsibility is to audit and express an
opinion on the financial statements in accordance with applicable
law and International Standards on Auditing (UK and Ireland).
Our audit methodology and tools aim to ensure that our quality
control procedures are effective, understood and applied. Our
quality controls and systems include our dedicated professional
standards review team and independent partner reviews.
This report is made solely to the Company’s members, as a
body, in accordance with Disclosure and Transparency Rule 4.1.
Our audit work has been undertaken so that we might state to the
Company’s members those matters we are required to state to
them in an auditor’s report and for no other purpose. To the
fullest extent permitted by law, we do not accept or assume
responsibility to anyone other than the Company and the
Company’s members as a body, for our audit work, for this
report, or for the opinions we have formed.
SCOPE OF THE AUDIT OF THE FINANCIAL STATEMENTS
An audit involves obtaining evidence about the amounts and
disclosures in the financial statements sufficient to give
reasonable assurance that the financial statements are free from
material misstatement, whether caused by fraud or error. This
includes an assessment of: whether the accounting policies are
appropriate to the Group’s and the parent company’s
circumstances and have been consistently applied and adequately
disclosed; the reasonableness of significant accounting estimates
made by the directors; and the overall presentation of the
financial statements. In addition, we read all the financial and
non-financial information in the annual report to identify
material inconsistencies with the audited financial statements and
to identify any information that is apparently materially incorrect
based on, or materially inconsistent with, the knowledge
acquired by us in the course of performing the audit. If we
become aware of any apparent material misstatements or
inconsistencies we consider the implications for our report.
DELOITTE LLP
CHARTERED ACCOUNTANTS AND STATUTORY
AUDITOR
London
23 May 2016

CONSOLIDATED INCOME STATEMENT
FOR THE YEAR ENDED 31 MARCH 2016
Note
Year ended 31 March 2016
£m
Year ended 31 March 2015
£m
Revenue 5 802.7 785.8
Cost of sales (569.6) (578.0)
Gross profit 233.1 207.8
Administrative expenses (161.5) (147.8)
Share of results of joint ventures 29 3.4 0.2
Operating profit 6 75.0 60.2
Finance income 10 0.4 -
Finance costs 10 (27.5) (16.2)
Profit before tax 47.9 44.0
Income tax charge 11 (7.7) (2.7)
Profit for the year 40.2 41.3
Attributable to:
Owners of the Company 36.5 41.8
Non-controlling interests 3.7 (0.5)
Operating profit analysed as:
Underlying EBITDA 3, 5 129.1 107.3
Amortisation of acquired intangibles 16 (27.4) (22.2)
Depreciation and amortisation of software 16,18 (4.4) (3.7)
Share-based payment charge 34 (4.1) (3.4)
Tax, finance costs and depreciation related to joint ventures 29 (1.6) 0.1
One-off items 9 (16.6) (17.9)
Operating profit 75.0 60.2
Earnings per share (pence)
Basic 1 14 9.8 12.7
Diluted 1 14 9.6 12.5
Adjusted earnings per share (pence)
Basic 1 14 19.7 21.0
Diluted 1 14 19.4 20.8
1. The 2015 earnings per share and adjusted earnings per share have been adjusted to reflect the bonus element of the rights issue completed on 20 October 2015.
All activities relate to continuing operations.
CONSOLIDATED STATEMENT OF COMPREHENSIVE INCOME
FOR THE YEAR ENDED 31 MARCH 2016
Year ended 31 March 2016
£m
Year ended 31 March 2015
£m
Profit for the year 40.2 41.3
Items that may be reclassified subsequently to profit or loss:
Exchange differences on foreign operations 25.8 (9.8)
Fair value movements on cash flow hedges 2.4 5.0
Reclassification adjustments for movements on cash flow hedges (6.0) 2.1
Tax related to components of other comprehensive income 0.6 (1.6)
Total comprehensive income for the year 63.0 37.0
Attributable to:
Owners of the Company 59.3 37.5
Non-controlling interests 3.7 (0.5)

CONSOLIDATED BALANCE SHEET
AT 31 MARCH 2016
Note
Year ended 31 March 2016
£m
Year ended 31 March 2015
£m
ASSETS
Non-current assets
Goodwill 15 353.9 209.8
Other intangible assets 16 320.5 87.6
Interests in joint ventures 29 3.2 91.0
Investment in productions 17 133.8 85.5
Property, plant and equipment 18 12.0 6.1
Trade and other receivables 21 48.1 45.8
Deferred tax assets 12 19.2 12.6
Total non-current assets 890.7 538.4
Current assets
Inventories 19 51.1 52.0
Investment in acquired content rights 20 241.3 221.1
Trade and other receivables 21 341.1 279.6
Cash and cash equivalents 22 108.3 71.3
Current tax assets 1.6 0.6
Financial instruments 31 8.6 9.7
Total current assets 752.0 634.3
Total assets 1,642.7 1,172.7
LIABILITIES
Non-current liabilities
Interest-bearing loans and borrowings 23 275.5 248.7
Production financing 24 33.6 47.2
Other payables 25 51.1 16.5
Provisions 26 0.3 0.3
Deferred tax liabilities 12 53.1 6.9
Total non-current liabilities 413.6 319.6
Current liabilities
Interest-bearing loans and borrowings 23 - 19.9
Production financing 24 98.0 69.7
Trade and other payables 25 439.1 372.1
Provisions 26 3.7 2.8
Current tax liabilities 24.8 19.8
Financial instruments 31 3.1 4.0
Total current liabilities 568.7 488.3
Total liabilities 982.3 807.9
Net assets 660.4 364.8
EQUITY
Stated capital 33 500.0 305.5
Own shares 33 (3.6) (3.6)
Other reserves 33 10.7 13.7
Currency translation reserve 11.8 (14.0)
Retained earnings 100.3 63.0
Equity attributable to owners of the Company 619.2 364.6
Non-controlling interests 41.2 0.2
Total equity 660.4 364.8
Total liabilities and equity 1,642.7 1,172.7
These consolidated financial statements were approved by the Board of Directors on 23 May 2016.
GILES WILLITS (DIRECTOR)
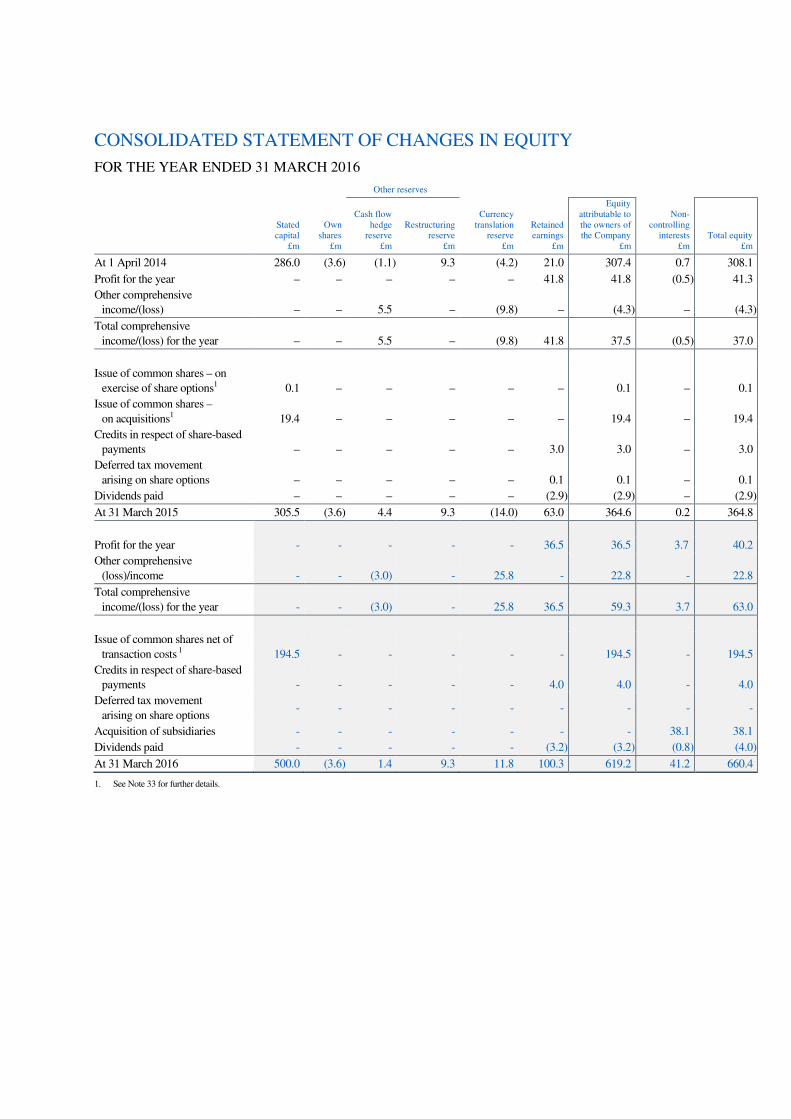
CONSOLIDATED STATEMENT OF CHANGES IN EQUITY
FOR THE YEAR ENDED 31 MARCH 2016
Other reserves
Stated capital
£m
Own shares
£m
Cash flow hedge
reserve £m
Restructuring reserve
£m
Currency translation
reserve £m
Retained earnings
£m
Equity attributable to the owners of the Company
£m
Non-controlling
interests £m
Total equity £m
At 1 April 2014 286.0 (3.6) (1.1) 9.3 (4.2) 21.0 307.4 0.7 308.1
Profit for the year – – – – – 41.8 41.8 (0.5) 41.3
Other comprehensive
income/(loss) – – 5.5 – (9.8) – (4.3) – (4.3)
Total comprehensive
income/(loss) for the year – – 5.5 – (9.8) 41.8 37.5 (0.5) 37.0
Issue of common shares – on
exercise of share options1 0.1 – – – – – 0.1 – 0.1
Issue of common shares –
on acquisitions1 19.4 – – – – – 19.4 – 19.4
Credits in respect of share-based
payments – – – – – 3.0 3.0 – 3.0
Deferred tax movement
arising on share options – – – – – 0.1 0.1 – 0.1
Dividends paid – – – – – (2.9) (2.9) – (2.9)
At 31 March 2015 305.5 (3.6) 4.4 9.3 (14.0) 63.0 364.6 0.2 364.8
Profit for the year - - - - - 36.5 36.5 3.7 40.2
Other comprehensive
(loss)/income - - (3.0) - 25.8 - 22.8 - 22.8
Total comprehensive
income/(loss) for the year - - (3.0) - 25.8 36.5 59.3 3.7 63.0
Issue of common shares net of
transaction costs 1 194.5 - - - - - 194.5 - 194.5
Credits in respect of share-based
payments - - - - - 4.0 4.0 - 4.0
Deferred tax movement
arising on share options - - - - - - - - -
Acquisition of subsidiaries - - - - - - - 38.1 38.1
Dividends paid - - - - - (3.2) (3.2) (0.8) (4.0)
At 31 March 2016 500.0 (3.6) 1.4 9.3 11.8 100.3 619.2 41.2 660.4
1. See Note 33 for further details.
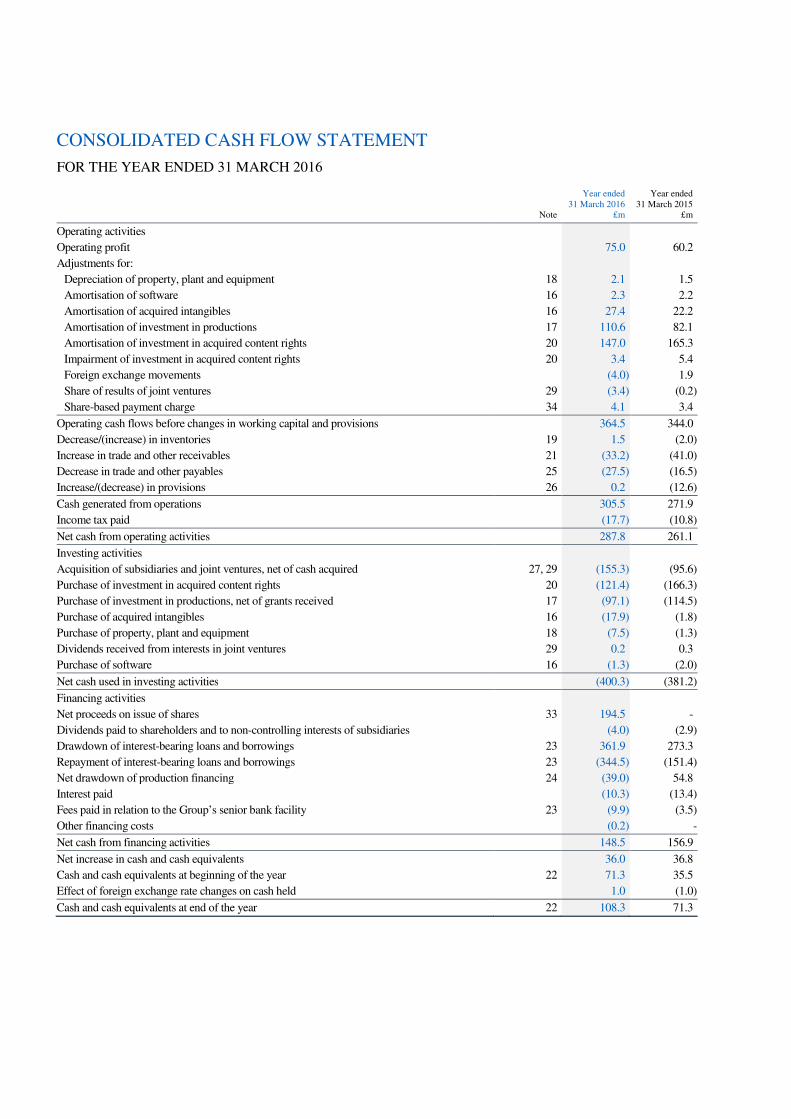
CONSOLIDATED CASH FLOW STATEMENT
FOR THE YEAR ENDED 31 MARCH 2016
Note
Year ended 31 March 2016
£m
Year ended 31 March 2015
£m
Operating activities
Operating profit 75.0 60.2
Adjustments for:
Depreciation of property, plant and equipment 18 2.1 1.5
Amortisation of software 16 2.3 2.2
Amortisation of acquired intangibles 16 27.4 22.2
Amortisation of investment in productions 17 110.6 82.1
Amortisation of investment in acquired content rights 20 147.0 165.3
Impairment of investment in acquired content rights 20 3.4 5.4
Foreign exchange movements (4.0) 1.9
Share of results of joint ventures 29 (3.4) (0.2)
Share-based payment charge 34 4.1 3.4
Operating cash flows before changes in working capital and provisions 364.5 344.0
Decrease/(increase) in inventories 19 1.5 (2.0)
Increase in trade and other receivables 21 (33.2) (41.0)
Decrease in trade and other payables 25 (27.5) (16.5)
Increase/(decrease) in provisions 26 0.2 (12.6)
Cash generated from operations 305.5 271.9
Income tax paid (17.7) (10.8)
Net cash from operating activities 287.8 261.1
Investing activities
Acquisition of subsidiaries and joint ventures, net of cash acquired 27, 29 (155.3) (95.6)
Purchase of investment in acquired content rights 20 (121.4) (166.3)
Purchase of investment in productions, net of grants received 17 (97.1) (114.5)
Purchase of acquired intangibles 16 (17.9) (1.8)
Purchase of property, plant and equipment 18 (7.5) (1.3)
Dividends received from interests in joint ventures 29 0.2 0.3
Purchase of software 16 (1.3) (2.0)
Net cash used in investing activities (400.3) (381.2)
Financing activities
Net proceeds on issue of shares 33 194.5 -
Dividends paid to shareholders and to non-controlling interests of subsidiaries (4.0) (2.9)
Drawdown of interest-bearing loans and borrowings 23 361.9 273.3
Repayment of interest-bearing loans and borrowings 23 (344.5) (151.4)
Net drawdown of production financing 24 (39.0) 54.8
Interest paid (10.3) (13.4)
Fees paid in relation to the Group’s senior bank facility 23 (9.9) (3.5)
Other financing costs (0.2) -
Net cash from financing activities 148.5 156.9
Net increase in cash and cash equivalents 36.0 36.8
Cash and cash equivalents at beginning of the year 22 71.3 35.5
Effect of foreign exchange rate changes on cash held 1.0 (1.0)
Cash and cash equivalents at end of the year 22 108.3 71.3

1. NATURE OF OPERATIONS AND GENERAL INFORMATION
Entertainment One is a leading independent entertainment group focused on the acquisition, production and distribution of television, family,
film and music content rights across all media throughout the world. Entertainment One Ltd. (the Company) is the Group’s ultimate parent
company and is incorporated and domiciled in Canada. The registered office of the Company is 134 Peter Street, Suite 700, Toronto,
Ontario, Canada, M5V 2H2.
Entertainment One Ltd. presents its consolidated financial statements in pounds sterling. These consolidated financial statements were
approved for issue by the directors on 23 May 2016.
2. NEW, AMENDED, REVISED AND IMPROVED STANDARDS
NEW STANDARDS AND AMENDMENTS, REVISIONS AND IMPROVEMENTS TO STANDARDS ADOPTED DURING THE
YEAR
During the year ended 31 March 2016, the following were adopted by the Group:
New, amended, revised and improved Standards Effective date
Annual improvements 2010-2012 Cycle
Amendments to IFRS 2 Share-based Payment 1 February 2015
Amendments to IFRS 3 Business Combinations 1 February 2015
Amendments to IFRS 8 Operating Segments 1 February 2015
Amendments to IFRS 13 Fair Value Measurement 1 February 2015
Amendments to IAS 16 Property, Plant and Equipment and IAS 38 Intangible Assets 1 February 2015
Amendments to IAS 24 Related Party Disclosures 1 February 2015
Annual improvements 2011-2013 Cycle
Amendments to IFRS 1 First-time adoption of international financial reporting standards 1 February 2015
Amendments to IFRS 3 Business Combinations 1 February 2015
Amendments to IFRS 13 Fair Value Measurement 1 February 2015
Amendments to IAS 40 Investment Property 1 February 2015
Amendments to IAS 19 Defined Benefit Plans: Employee Contributions 1 February 2015
The adoption of these new, amended and revised Standards had no material impact on the Group’s financial position, performance or its
disclosures.
NEW, AMENDED AND REVISED STANDARDS ISSUED BUT NOT ADOPTED DURING THE YEAR
At the date of authorisation of these consolidated financial statements, the following Standards, which have not been applied in these
consolidated financial statements, are in issue but not yet effective for periods beginning 1 April 2015:
New, amended and revised Standards Effective date
Annual improvements 2012-2014 Cycle
Amendments to IFRS 1 First-time adoption of international financial reporting standards 1 January 2016
Amendments to IFRS 3 Business Combinations 1 January 2016
Amendments to IFRS 13 Fair Value Measurement 1 January 2016
Amendments to IAS 40 Investment Property 1 January 2016
Amendments to IFRS 11 Accounting for Acquisitions of Interests in Joint Operations 1 January 2016
Amendments to IAS 16 and IAS 38 Clarification of Acceptable Methods of Depreciation and Amortisation 1 January 2016
Amendments to IAS 27 Equity Method in Separate Financial Statements 1 January 2016
Amendments to IAS 1 Disclosure Initiatives 1 January 2016
Amendments to IAS 12 Recognition of Deferred Tax Assets for Unrealised Losses 1 January 2017 *
Amendments to IAS 7 Disclosure Initiative 1 January 2017 *
IFRS 9 Financial Instruments 1 January 2018 *
IFRS 15 Revenue from Contracts with Customers 1 January 2018 *
IFRS 16 Leases 1 January 2019 *
* These pronouncements have been implemented by the International Accounting Standards Board (IASB) effective from the dates noted,
but have not yet been endorsed for use in the European Union (EU).
The Group is currently assessing the new, amended and revised standards and currently plans to adopt the new standards on the required
effective dates as prescribed by the EU.

3. SIGNIFICANT ACCOUNTING POLICIES
USE OF ADDITIONAL PERFORMANCE MEASURES
The Group presents underlying EBITDA, one-off items, adjusted profit before tax and adjusted earnings per share information. These
measures are used by the directors for internal performance analysis and incentive compensation arrangements for employees. The terms
“underlying”, “one-off items” and “adjusted” may not be comparable with similarly titled measures reported by other companies.
The term “underlying EBITDA” refers to operating profit or loss excluding amortisation of acquired intangibles; depreciation; amortisation
of software; share-based payment charge; tax, finance costs and depreciation related to joint ventures; and operating one-off items.
The terms “adjusted profit before tax” and “adjusted earnings per share” refer to the reported measures excluding amortisation of acquired
intangibles; share-based payment charge; tax, finance costs and depreciation related to joint ventures; operating one-off items; finance one-
off items; and, in the case of adjusted earnings per share, one-off tax items. Refer to Note 14.
BASIS OF PREPARATION
i. Preparation of the consolidated financial statements on the going concern basis The Group’s activities, together with the factors likely to affect its future development, are set out in the Business and Financial review.
In addition to its senior secured notes (due 2022) the Group meets its day-to-day working capital requirements and funds its investment in
content through its cash in hand and through a revolving credit facility which matures in December 2020 and is secured on certain assets held
by the Group. Under the terms of this facility the Group is able to draw down in the local currencies of its operating businesses. The amounts
drawn down by currency at 31 March 2016 are shown in Note 23. The facility is subject to a series of covenants including interest cover
charge, gross debt against underlying EBITDA and capital expenditure.
The Group has a track record of cash generation and is in full compliance with its bank facility and bond covenant requirements. At 31
March 2016, the Group had £94.7m of cash and cash equivalents not held repayable only to production financing (refer to Note 22),
£180.8m of net debt and undrawn down amounts under the revolving credit facility of £106.1m (refer to Note 23).
The Group is exposed to uncertainties arising from the economic climate and uncertainties in the markets in which it operates. Market
conditions could lead to lower than anticipated demand for the Group’s products and services and exchange rate volatility could also impact
reported performance. The directors have considered the impact of these and other uncertainties and factored them into their financial
forecasts and assessment of covenant headroom. The Group’s forecasts and projections, taking account of reasonable possible changes in
trading performance (and available mitigating actions), show that the Group will be able to operate within the expected limits of the facility
and provide headroom against the covenants for the foreseeable future. For these reasons the directors continue to adopt the going concern
basis of accounting in preparing the consolidated financial statements.
ii. Statement of compliance These consolidated financial statements have been prepared under the historical cost convention (except for derivative financial instruments
and share-based payment charges that have been measured at fair value) and in accordance with applicable International Financial Reporting
Standards as adopted by the EU and IFRIC interpretations (IFRS). The Group’s consolidated financial statements comply with Article 4 of
the EU IAS Regulation.
BASIS OF CONSOLIDATION
The consolidated financial statements comprise the financial statements of the Company and its subsidiaries (the Group). Control of the
Group’s subsidiaries is achieved when the Group is exposed, or has rights, to variable returns from its involvement with the investee and has
the ability to affect those returns through its power over the investee.
The financial statements of the subsidiaries are generally prepared for the same reporting periods as the parent company, using consistent
accounting policies. Subsidiaries are fully consolidated from the date of acquisition and continue to be consolidated until the date of disposal.
All intra-group balances, transactions, income and expenses, and unrealised profits and losses resulting from intra-group transactions that are
recognised in assets, are eliminated in full.
BUSINESS COMBINATIONS
Business combinations are accounted for using the acquisition method. The cost of a business combination is measured as the aggregate of
the consideration transferred, measured at acquisition date fair value and the amount of any non-controlling interests in the acquiree. For each
business combination, the acquirer measures the non-controlling interests in the acquiree either at fair value or at the proportionate share of
the acquiree’s identifiable net assets.
The cost of a business combination is measured as the aggregate of the fair values, at the date of exchange, of assets given, liabilities incurred
or assumed, and equity instruments issued by the Group in exchange for control of the acquiree. Acquisition-related costs are recognised in
the consolidated income statement as incurred.
Any contingent consideration to be transferred by the acquirer is recognised at fair value at the acquisition date. Subsequent changes to the
fair value of the contingent consideration which is deemed to be an asset or liability, are recognised either in the consolidated income
statement or as a change to other comprehensive income.

3. SIGNIFICANT ACCOUNTING POLICIES CONTINUED
Goodwill arising on a business combination is recognised as an asset and initially measured at cost, being the excess of the aggregate of the
consideration transferred and the amount recognised for non-controlling interests over the fair value of net identifiable assets acquired
(including other intangible assets) and liabilities assumed. If this consideration is lower than the fair value of the net assets of the subsidiary
or business acquired, any negative goodwill is recognised immediately in the consolidated income statement.
REVENUE RECOGNITION
Revenue represents the amounts receivable for goods and services provided in the normal course of business, net of discounts and excluding
value added tax (or equivalent). Revenue is derived from the licensing, marketing and distribution and trading of feature films, television,
video programming and music rights. Revenue is also derived from television and film production and family licensing and merchandising
sales. The following summarises the Group’s main revenue recognition policies:
– Revenue from the exploitation of television, film and music rights is recognised based upon the completion of contractual
obligations relevant to each agreement
– Revenue is recognised where there is reasonable contractual certainty that the revenue is receivable and will be received
– Revenue from television licensing represents the contracted value of licence fees which is recognised when the licence term has
commenced, the production is available for delivery, substantially all technical requirements have been met and collection of the
fee is reasonably assured
– Revenue from the sale of own or co-produced film or television productions is recognised when the production is available for
delivery and there is reasonable contractual certainty that the revenue is receivable and will be received
– Revenue from the sale of home entertainment and audio inventory is recognised at the point at which goods are despatched. A
provision is made for returns based on historical trends
– Revenue from licensing and merchandising sales represents the contracted value of licence fees which is recognised when the
licence terms have commenced and collection of the fee is reasonably assured
– Revenue from digital sales is recognised on transmission or during the period of transmission of the sponsored programme or
digital channel
PENSION COSTS
Payments to defined contribution retirement benefit plans are charged as an expense as they fall due. Any contributions unpaid at the year
end reporting date are included as a liability within the consolidated balance sheet.
OPERATING LEASES
The determination of whether an arrangement is, or contains, a lease is based on the substance of the arrangement at inception date, whether
fulfilment of the arrangement is dependent on the use of a specific asset or assets or the arrangement conveys a right to use the asset, even if
that right is not explicitly specified in an arrangement. Rentals payable under operating leases are charged to the consolidated income
statement on a straight-line basis over the lease term.
INTEREST COSTS
Borrowing costs, including finance costs, are recognised in the consolidated income statement in the period in which they are incurred.
Borrowing costs are accounted for using the effective interest rate method.
Production financing interest directly attributable to the acquisition or production of a qualifying asset (such as investment in productions)
form part of the cost of that asset and are capitalised.
FOREIGN CURRENCIES
i. Within individual companies The individual financial statements of each Group company are presented in the currency of the primary economic environment in which it
operates (its functional currency). For the purpose of the consolidated financial statements, the results and financial position of each Group
company are expressed in pounds sterling, which is the functional currency of the Company and the presentation currency for the
consolidated financial statements.
In preparing the financial statements of the individual companies, transactions in currencies other than the entity’s functional currency are
recorded at the rates of exchange prevailing on the dates of the transactions. Foreign exchange differences arising on the settlement of such
transactions and from translating monetary assets and liabilities denominated in foreign currencies at year end exchange rates are recognised
in the consolidated income statement.
ii. Retranslation within the consolidated financial statements For the purpose of presenting consolidated financial statements, the assets and liabilities of the Group’s foreign operations are translated at
exchange rates prevailing on the balance sheet date. Income and expense items are translated at the exchange rate ruling at the date of each
transaction during the period. Foreign exchange differences arising, if any, are classified as equity and transferred to the Group’s translation
reserve. Such translation differences are recognised as income or expenses in the period in which the operation is disposed of.

3. SIGNIFICANT ACCOUNTING POLICIES CONTINUED
ONE-OFF ITEMS
One-off items are items of income and expenditure that are non-recurring and, in the judgement of the directors, should be disclosed
separately on the basis that they are material, either by their nature or their size, in order to provide a better understanding of the Group’s
underlying financial performance and enable comparison of underlying financial performance between years.
The one-off items recorded in the consolidated income statement include items such as significant restructuring, the costs incurred in entering
into business combinations, and the impact of the sale, disposal or impairment of an investment in a business or an asset.
TAX
i. Income tax The income tax charge/credit represents the sum of the current income tax payable and deferred tax.
The current income tax payable is based on taxable profit for the year. Taxable profit differs from profit as reported in the consolidated
income statement because it excludes items of income or expense that are taxable or deductible in other years and it further excludes items
that are never taxable or deductible. The Group’s asset or liability for current tax is calculated using tax rates that have been enacted or
substantively enacted by the balance sheet date.
ii. Deferred tax assets and liabilities Deferred tax is the tax expected to be payable or recoverable on differences between the carrying amounts of assets and liabilities in the
financial statements and the corresponding tax bases used in the computation of taxable profit, and is accounted for using the balance sheet
liability method. Deferred tax liabilities are generally recognised for all taxable temporary differences and deferred tax assets are recognised
to the extent that it is probable that taxable profits will be available against which deductible temporary differences can be utilised. Such
assets and liabilities are not recognised if the temporary difference arises from the initial recognition of goodwill or from the initial
recognition of other assets and liabilities in a transaction (other than in a business combination) that affects neither the tax profit nor the
accounting profit.
Deferred tax liabilities are recognised for taxable temporary differences arising on investments in subsidiaries, except where the Group is
able to control the reversal of the temporary difference and it is probable that the temporary difference will not reverse in the foreseeable
future.
In the UK and the US, the Group is entitled to a tax deduction for amounts treated as compensation on exercise of certain employee share
options or vesting of share awards under each jurisdiction’s tax rules. A share-based payment charge is recorded in the consolidated income
statement over the vesting period of the relevant options and awards. As there is a temporary difference between the accounting and tax
bases, a deferred tax asset is recorded. The deferred tax asset arising is calculated by comparing the estimated amount of tax deduction to be
obtained in the future (based on the Company’s share price at the balance sheet date) with the cumulative amount of the share-based payment
charge recorded in the consolidated income statement. If the amount of estimated future tax deduction exceeds the cumulative amount of the
compensation expense at the statutory rate, the excess is recorded directly in equity, against retained earnings.
The carrying amount of deferred tax assets is reviewed at each balance sheet date and reduced to the extent that it is no longer probable that
sufficient taxable profits will be available to allow all or part of the asset to be recovered.
Deferred tax assets and liabilities are measured on an undiscounted basis at the tax rates that are expected to apply in the period when the
asset is realised or the liability is settled, based on tax rates (and tax laws) that have been enacted or substantively enacted by the balance
sheet date. Deferred tax is charged or credited in the consolidated income statement, except when it relates to items charged or credited
directly to equity, in which case the deferred tax is also dealt with in equity.
Deferred tax assets and liabilities are offset when there is a legally enforceable right to offset current tax assets against current tax liabilities.
This applies when they relate to income taxes levied by the same tax authority and the Group intends to settle its current tax assets and
liabilities on a net basis.
GOODWILL
Goodwill arising on a business combination is recognised as an asset and initially measured at cost, being the excess of the aggregate of the
consideration transferred and the amount recognised for non-controlling interests over the fair value of net identifiable assets acquired
(including other intangible assets) and liabilities assumed. Transaction costs directly attributable to the acquisition form part of the
acquisition cost for business combinations prior to 1 January 2010, but from that date such costs are written off to the consolidated income
statement and do not form part of goodwill. Following initial recognition, goodwill is measured at cost less any accumulated impairment
losses.
Goodwill is allocated to cash generating units (CGUs) which are tested for impairment annually or more frequently if there are indications
that goodwill might be impaired. The CGUs identified are the smallest identifiable group of assets that generate cash flows that are largely
independent of the cash flows from other groups of assets. Gains or losses on the disposal of an entity include the carrying amount of
goodwill relating to the entity sold.

3. SIGNIFICANT ACCOUNTING POLICIES CONTINUED
OTHER INTANGIBLE ASSETS
Other intangible assets acquired by the Group are stated at cost less accumulated amortisation. Amortisation is charged to administrative
expenses in the consolidated income statement on a straight-line basis over the estimated useful life of intangible fixed assets unless such
lives are indefinite.
Other intangible assets mainly comprise amounts arising on consolidation of acquired subsidiaries such as exclusive content agreements and
libraries, trade names and brands, exclusive distribution agreements, customer relationships and non-compete agreements. Other intangible
assets also include amounts relating to costs of software.
Other intangible assets are generally amortised over the following periods:
Exclusive content agreements and libraries 3-14 years
Trade names and brands 1-15 years
Exclusive distribution agreements 9 years
Customer relationships 9-10 years
Non-compete agreements 2-5 years
Software 3 years
INTERESTS IN JOINT ARRANGEMENTS
An associate is an entity over which the Group has significant influence. Significant influence is the power to participate in the financial and
operating decisions of the investee, but is not control or joint control over those policies.
A joint venture is a type of joint arrangement whereby the parties that have joint control of the arrangement have rights to the net assets of the
joint venture. Joint control is the contractually agreed sharing of control of the arrangement, which exists only when decisions about the
relevant activities require unanimous consent of the parties sharing control.
The Group’s interests in its associates and joint ventures are accounted for using the equity method. The investment is initially recognised at
cost and is subsequently adjusted to recognise changes in the Group’s share of net assets of the associate or joint venture since the acquisition
date. The share of results of its associates and joint ventures are shown within single line items in the consolidated balance sheet and
consolidated income statement, respectively.
The financial statements of the Group’s associates and joint ventures are generally prepared for the same reporting period as the Group.
Where necessary, adjustments are made to bring the accounting policies in line with those of the Group.
INVESTMENT IN PRODUCTIONS
Investment in productions that are in development and for which the realisation of expenditure can be reasonably determined are classified
and capitalised in accordance with IAS 38 Intangible Assets as productions in progress within investment in productions. On delivery of a
production, the cost of investment is reclassified as productions delivered. Also included within investment in productions are programmes
acquired on acquisition of subsidiaries.
Amortisation of investment in productions, net of government grants, is charged to cost of sales unless it arises from revaluation on
acquisition of subsidiaries in which case it is charged to administrative expenses. The maximum useful life is generally considered to be 10
years.
GOVERNMENT GRANTS
A government grant is recognised and credited as part of investment in productions when there is reasonable assurance that any conditions
attached to the grant will be satisfied and the grants will be received and the programme has been delivered. Government grants are
recognised at fair value.
PROPERTY, PLANT AND EQUIPMENT
Property, plant and equipment are stated at original cost less accumulated depreciation. Depreciation is charged to write-off cost less
estimated residual value of each asset over their estimated useful lives using the following methods and rates:
Leasehold improvements Over the term of the lease
Fixtures, fittings and equipment 20%-30% reducing balance
The carrying amounts of property, plant and equipment are reviewed for impairment when events or changes in circumstances indicate that
the carrying amounts may not be recoverable. The Group reviews residual values and useful lives on an annual basis and any adjustments are
made prospectively.
An item of property, plant and equipment is derecognised upon disposal or when no future economic benefits are expected to arise from the
continued use of the asset. Any gain or loss arising on derecognition of the asset (determined as the difference between the sales proceeds
and the carrying amount of the asset) is recorded in the consolidated income statement in the period of derecognition.

3. SIGNIFICANT ACCOUNTING POLICIES CONTINUED
IMPAIRMENT OF NON-FINANCIAL ASSETS
The carrying amounts of the Group’s non-financial assets are tested annually for impairment (as required by IFRS, in the case of goodwill)
or when circumstances indicate that the carrying amounts may be impaired. If any such indication exists, or when annual impairment testing
for an asset is required, the Group makes an estimate of the asset’s recoverable amount. The recoverable amount is the higher of an asset’s or
CGU’s fair value less costs to sell and its value-in-use and is determined for an individual asset, unless the asset does not generate cash flows
that are largely independent of those from other assets or groups of assets. Where the carrying amount of an asset or CGU exceeds its
recoverable amount, the asset is considered to be impaired and is written down to its recoverable amount. In assessing value-in-use, the
estimated future cash flows are discounted to their present value using a pre-tax discount rate that reflects current market assessments of the
time value of money and the risks specific to the asset or CGU. In determining fair value less costs to sell, an appropriate valuation model is
used. These calculations are corroborated by valuation multiples or other available fair value indicators.
INVENTORIES
Inventories are stated at the lower of cost, including direct expenditure and other appropriate attributable costs incurred in bringing
inventories to their present location and condition, and net realisable value. The cost of inventories is calculated using the weighted average
method. Net realisable value is the estimated selling price in the ordinary course of business, less estimated costs of completion and the
estimated costs necessary to make the sale.
INVESTMENT IN ACQUIRED CONTENT RIGHTS
In the ordinary course of business the Group contracts with film and television programme producers to acquire content rights for
exploitation. Certain of these agreements require the Group to pay minimum guaranteed advances (MGs). MGs are recognised in the
consolidated balance sheet when a liability arises, usually on delivery of the film or television programme to the Group.
Investments in acquired content rights are recorded in the consolidated balance sheet if such amounts are considered recoverable against
future revenues. These costs are amortised to cost of sales on a revenue forecast basis over a period not exceeding 10 years from the date of
initial release. Acquired libraries are amortised over a period not exceeding 20 years. Amounts capitalised are reviewed at least quarterly and
any portion of the unamortised amount that appears not to be recoverable from future net revenues is written off to cost of sales during the
period the loss becomes evident. Balances are included within current assets if they are expected to be realised within the normal operating
cycle of the Television, Family and Film businesses. The normal operating cycle of these businesses can be greater than 12 months. In
general 65%-75% of film and television programme content is amortised within 12 months of theatrical release/delivery.
TRADE AND OTHER RECEIVABLES
Trade receivables are generally not interest-bearing and are stated at their fair value as reduced by appropriate allowances for estimated
irrecoverable amounts.
CASH AND CASH EQUIVALENTS
Cash and cash equivalents in the consolidated balance sheet comprise cash at bank and in hand. For the purpose of the consolidated cash
flow statement, cash and cash equivalents consist of cash and cash equivalents as defined above, net of outstanding bank overdrafts. Bank
overdrafts are shown within borrowings in current liabilities on the consolidated balance sheet.
INTEREST-BEARING LOANS AND BORROWINGS
All interest-bearing loans and borrowings are initially recognised at the fair value of the consideration received less directly attributable
transaction costs. Gains and losses are recognised in the consolidated income statement when the liabilities are derecognised, as well as
through the amortisation process.
PRODUCTION FINANCING
Production financing relates to short-term financing for the Group’s television, family and film productions. Production financing interest
directly attributable to the acquisition or production of a qualifying asset form part of the cost of that asset and are capitalised.
DEFERRED FINANCE CHARGES
All costs incurred by the Group that are directly attributable to the issue of debt are initially capitalised and deducted from the amount of
gross borrowings. Such costs are then amortised through the consolidated income statement over the term of the instrument using the
effective interest rate method.
Should there be a material change to the terms of the underlying instrument, any remaining unamortised deferred finance charges are
immediately written off to the consolidated income statement as a one-off finance item. Any new costs incurred as a result of the change to
the terms of the underlying instrument are capitalised and then amortised over the term of the new instrument, again using the effective
interest rate method.
TRADE AND OTHER PAYABLES
Trade payables are generally not interest-bearing and are stated at their nominal value.
The potential cash payments related to put options issued by the Group over the non-controlling interest of subsidiary companies are
accounted for as financial liabilities. The amount that may become payable under the option on exercise is initially recognised on acquisition
at present value within other payables with a corresponding charge directly to equity. The charge to equity is recognised within non-
controlling interests.

3. SIGNIFICANT ACCOUNTING POLICIES CONTINUED
Such options are subsequently measured at amortised cost, using the effective interest rate method, in order to accrete the liability up to the
amount payable under the option at the date at which it first becomes exercisable; the charge arising is recorded as a financing cost. In the
event that the option expires unexercised, the liability is derecognised with a corresponding adjustment to equity.
PROVISIONS
Provisions are recognised when the Group has a present obligation (legal or constructive) as a result of a past event, where the obligation can
be estimated reliably, and where it is probable that an outflow of economic benefits will be required to settle that obligation. Provisions are
measured at the directors’ best estimate of the expenditure required to settle the obligation at the balance sheet date, and are discounted to
present value where the effect is material. Where discounting is used, the increase in the provision due to unwinding the discount is
recognised as a finance expense.
DERIVATIVE FINANCIAL INSTRUMENTS AND HEDGING
Derivative financial assets and liabilities are recognised when the Group becomes a party to the contractual provisions of the instrument.
The Group may use derivative financial instruments to reduce its exposure to foreign exchange and interest rate movements. The Group does
not hold or issue derivative financial instruments for financial trading purposes.
Derivative financial instruments are classified as held-for-trading and recognised in the consolidated balance sheet at fair value. Derivatives
designated as hedging instruments are classified on inception as cash flow hedges, net investment hedges or fair value hedges. Changes in
the fair value of derivatives designated as cash flow hedges are recognised in equity to the extent that they are deemed effective. Ineffective
portions are immediately recognised in the consolidated income statement. When the hedged item affects profit or loss then the amounts
deferred in equity are recycled to the consolidated income statement.
Fair value hedges record the change in the fair value in the consolidated income statement, along with the changes in the fair value of the
hedged asset or liability. Changes in the fair value of any derivative instruments that do not qualify for hedge accounting are immediately
recognised in the consolidated income statement.
DIVIDENDS
Distributions to equity holders are not recognised in the consolidated income statement under IFRS, but are disclosed as a component of the
movement in total equity. A liability is recorded for a dividend when the dividend is declared by the Company’s directors.
EQUITY INSTRUMENTS
An equity instrument is any contract that evidences a residual interest in the assets of an entity after deducting all of its liabilities. Equity
instruments issued by the Company are recorded at the proceeds received, net of direct issue costs.
OWN SHARES
The Entertainment One Ltd. shares held by the Trustees of the Company’s Employee Benefit Trust (EBT) are classified in total equity as
own shares and are recognised at cost. Consideration received for the sale of such shares is also recognised in equity, with any difference
between the proceeds from sale and the original cost being taken to reserves. No gain or loss is recognised on the purchase, sale, issue or
cancellation of equity shares.
SHARE-BASED PAYMENTS
The Group issues equity-settled share-based payments to certain employees. Equity-settled share-based payments are measured at fair value
at the date of grant. The fair value determined at the grant date of equity-settled share-based payments is expensed on a straight-line basis
over the vesting period, based on the Group’s estimate of shares that will eventually vest. Fair value is measured by means of a binomial
valuation model. The expected life used in the model has been adjusted, based on management’s best estimate, for the effect of non-
transferability, exercise restrictions, and behavioural considerations.
SEGMENTAL REPORTING
The Group’s operating segments are identified on the basis of internal reports that are regularly reviewed by the chief operating decision
maker in order to allocate resources to the segment and to assess its performance. The Chief Executive Officer has been identified as the
chief operating decision maker. The Group has three reportable segments: Television, Family and Film, based on the types of products and
services from which each segment derives its revenues.
The Television segment includes revenues from all of the Group’s activities in relation to the production, acquisition and exploitation of
television and music content.
The Family segment includes revenues from all of the Group’s activities in relation to the production, acquisition and exploitation, including
licensing and merchandising, of family content.
The Film segment includes revenues from all of the Group’s activities in relation to the production, acquisition and exploitation of film
content rights.

4. SIGNIFICANT ACCOUNTING JUDGEMENTS AND KEY SOURCES OF ESTIMATION UNCERTAINTY
The preparation of consolidated financial statements under IFRS requires the Group to make estimates and assumptions that affect the
amounts reported for assets and liabilities at the balance sheet date and amounts reported for revenues and expenses during the year. The
nature of estimation means that actual outcomes could differ from those estimates.
Estimates and judgements are reviewed on an ongoing basis. Revisions to accounting estimates are recognised in the period in which the
estimate is revised if the revision affects that period only, or in the period of the revision and future periods if the revision affects both current
and future periods.
The estimates and assumptions which have a significant risk of causing a material adjustment to the carrying amount of assets and liabilities
are discussed below.
IMPAIRMENT OF GOODWILL
The Group determines whether goodwill is impaired on at least an annual basis. This requires an estimation of the value-in-use of the CGUs
to which the goodwill is allocated. Estimating a value-in-use amount requires the directors to make an estimate of the expected future cash
flows from the CGU and also to choose a suitable discount rate in order to calculate the present value of those cash flows. Further details of
goodwill are contained in Note 15.
ACQUIRED INTANGIBLES
The Group recognises intangible assets acquired as part of a business combination at fair value at the date of acquisition. The determination
of these fair values is based upon the directors’ judgement and includes assumptions on the timing and amount of future incremental cash
flows generated by the assets and selection of an appropriate cost of capital. Furthermore, the directors must estimate the expected useful
lives of intangible assets and charge amortisation on these assets accordingly. Further details of acquired intangibles are contained in Note
16.
INVESTMENT IN PRODUCTIONS AND INVESTMENT IN ACQUIRED CONTENT RIGHTS
The Group capitalises investment in productions and investment in acquired content rights and then amortises these balances on a revenue
forecast basis, recording the amortisation charge in cost of sales. Amounts capitalised are reviewed at least quarterly and any amounts that
appear to be irrecoverable from future net revenues are written off to cost of sales during the period the loss becomes evident. The estimate of
future net revenues is determined based on the pattern of historical revenue streams and the remaining life of each contract. Further details of
investment in productions and investment in acquired content rights are contained in Notes 17 and 20, respectively.
PROVISIONS FOR ONEROUS FILM AND TELEVISION CONTRACTS
The Group recognises a provision for an onerous film and television contract when the unavoidable costs of meeting the obligations under
the contract exceed the expected benefits to be received under it. The estimate of the amount of the provision requires management to make
judgements and assumptions on future cash inflows and outflows and also an assessment of the least cost of exiting the contract. To the
extent that events, revenues or costs differ in the future, the carrying amount of provisions may change. Further details of onerous film
contracts are contained in Note 26.
SHARE-BASED PAYMENTS
The charge for share-based payments is determined based on the fair value of awards at the date of grant by use of the binomial model which
requires judgements to be made regarding expected volatility, dividend yield, risk free rates of return and expected option lives. The list of
inputs used in the binomial model to calculate the fair values is provided in Note 34.
DEFERRED TAX
Deferred tax assets and liabilities require the directors’ judgement in determining the amounts to be recognised. In particular, judgement is
used when assessing the extent to which deferred tax assets should be recognised with consideration to the timing and level of future taxable
income. Further details of deferred tax are contained in Note 12.
INCOME TAX
The actual tax on the result for the year is determined according to complex tax laws and regulations. Where the effect of these laws and
regulations is unclear, estimates are used in determining the liability for tax to be paid on past profits which are recognised in the
consolidated financial statements. The Group considers the estimates, assumptions and judgements to be reasonable but this can involve
complex issues which may take a number of years to resolve. The final determination of prior year tax liabilities could be different from the
estimates reflected in the consolidated financial statements. Further details relating to tax are contained in Note 11.
FAIR VALUE MEASUREMENT OF FINANCIAL INSTRUMENTS
When the fair values of financial assets and financial liabilities recorded in the consolidated balance sheet cannot be measured based on
quoted prices in active markets, their fair value is measured using valuation techniques including discounted cash flow models. The inputs to
these models are taken from observable markets where possible, but where this is not feasible, a degree of judgement is required in
establishing fair values. Judgements include considerations of inputs such as liquidity risk, credit risk and volatility. Changes in assumptions
about these factors could affect the reported fair value of financial instruments. See Note 32 for further disclosures.

4. SIGNIFICANT ACCOUNTING JUDGEMENTS AND KEY SOURCES OF ESTIMATION UNCERTAINTY CONTINUED
CONTINGENT CONSIDERATION
Contingent consideration, resulting from business combinations, is valued at fair value at the acquisition date as part of the business
combination. When the contingent consideration meets the definition of a financial liability, it is subsequently re-measured to fair value at
each reporting date. The determination of the fair value is based on discounted cash flows. The key assumptions take into consideration the
probability of meeting each performance target and the discount factor.
5. SEGMENTAL ANALYSIS
OPERATING SEGMENTS
For internal reporting and management purposes, the Group is organised into three main reportable segments based on the types of products
and services from which each segment derives its revenue –Television, Family and Film. These Divisions are the basis on which the Group
reports its operating segment information. As a result of the acquisition of Astley Baker Davies Limited during the year, the Group took the
decision to report its Family business as a separate segment.
The types of products and services from which each reportable segment derives its revenues are as follows:
– Television – the production, acquisition and exploitation of television and music content rights across all media.
– Family – the production, acquisition and exploitation, including licensing and merchandising, of family content rights across all
media.
– Film – the production, acquisition and exploitation of film content rights across all media.
Inter-segment sales are charged at prevailing market prices.
Segment information for the year ended 31 March 2016 is presented below:
Note
Television
£m
Family
£m
Film
£m
Eliminations
£m
Consolidated
£m
Segment revenues
External sales 201.3 61.4 540.0 - 802.7
Inter-segment sales 43.4 5.2 13.4 (62.0) -
Total segment revenues 244.7 66.6 553.4 (62.0) 802.7
Segment results
Segment underlying EBITDA 39.2 43.3 52.8 - 135.3
Group costs (6.2)
Underlying EBITDA 129.1
Amortisation of acquired intangibles 16 (27.4)
Depreciation and amortisation of software 16,18 (4.4)
Share-based payment charge 34 (4.1)
Tax, finance costs and depreciation related to joint ventures 29 (1.6)
One-off items 9 (16.6)
Operating profit 75.0
Finance income 10 0.4
Finance costs 10 (27.5)
Profit before tax 47.9
Income tax charge 11 (7.7)
Profit for the year 40.2
Segment assets
Total segment assets 511.6 256.6 864.7 - 1,632.9
Unallocated corporate assets 9.8
Total assets 1,642.7
Other segment information
Amortisation of acquired intangibles 16 (7.7) (5.7) (14.0) - (27.4)
Depreciation and amortisation of software 16,18 (0.5) (0.1) (3.8) - (4.4)
Tax, finance costs and depreciation related to joint ventures 29 (1.5) - (0.1) - (1.6)
One-off items 9 (3.2) (1.4) (12.0) - (16.6)

5. SEGMENTAL ANALYSIS CONTINUED
Segment information for the year ended 31 March 2015 is presented below:
Note
Television
£m
Family
£m
Film
£m
Eliminations
£m
Consolidated
£m
Segment revenues
External sales 146.2 56.5 583.1 - 785.8
Inter-segment sales 1 40.3 4.3 9.5 (54.1) -
Total segment revenues 186.5 60.8 592.6 (54.1) 785.8
Segment results
Segment underlying EBITDA 17.8 23.8 73.1 - 114.7
Group costs (7.4)
Underlying EBITDA 107.3
Amortisation of acquired intangibles 16 (22.2)
Depreciation and amortisation of software 16,18 (3.7)
Share-based payment charge 34 (3.4)
Tax, finance costs and depreciation related to joint ventures 29 0.1
One-off items 9 (17.9)
Operating profit 60.2
Finance costs 10 (16.2)
Profit before tax 44.0
Income tax charge 11 (2.7)
Profit for the year 41.3
Segment assets
Total segment assets 403.3 31.1 728.6 - 1,163.0
Unallocated corporate assets 9.7
Total assets 1,172.7
Other segment information
Amortisation of acquired intangibles 16 (3.3) (1.0) (17.9) - (22.2)
Depreciation and amortisation of software 16,18 (0.3) - (3.4) - (3.7)
Tax, finance costs and depreciation related to joint
ventures 29 0.1 - - - 0.1
One-off items 9 (4.0) (0.7) (13.2) - (17.9)
1. In the current year third party music label sales made by the Film Distribution business on behalf of the Music business are recognised in Music revenue. Consequently, the prior year Music revenue (and inter-segment eliminations) previously reported has been restated to reflect this change. The impact of the change for the year ended 31 March 2015 was an increase in Music (and inter-segment eliminations) by £19.7m. There is no impact on total Group revenues.
GEOGRAPHICAL INFORMATION
The Group’s operations are located in Canada, the UK, the US, Australia, the Benelux and Spain. Television Division operations are located
in Canada, the US, the UK and Australia. Family Division operations are located in Canada and the UK. Film Division operations are located
in Canada, the UK, the US, Australia, the Benelux and Spain. The following table provides an analysis of the Group’s revenue based on the
location of the customer and the carrying amount of segment non-current assets by the geographical area in which the assets are located for
the years ended 31 March 2016 and 2015.
External revenues
2016 £m
Non-current assets1 2016
£m
External revenues
2015 £m
Non-current assets1 2015
£m
Canada 191.4 252.9 259.6 267.3
UK 167.8 286.1 199.7 74.2
US 235.0 290.3 150.9 54.0
Rest of Europe 125.5 29.5 107.2 29.5
Other 83.0 9.5 68.4 9.8
Total 802.7 868.3 785.8 434.8
1. Non-current assets by location exclude amounts relating to interests in joint ventures and deferred tax assets.

6. OPERATING PROFIT
Operating profit for the year is stated after charging/(crediting):
Note
Year ended 31 March 2016
£m
Year ended 31 March 2015
£m
Amortisation of investment in productions 17 110.6 82.1
Amortisation of investment in acquired content rights 20 147.0 165.3
Amortisation of acquired intangibles 16 27.4 22.2
Amortisation of software 16 2.3 2.2
Depreciation of property, plant and equipment 18 2.1 1.5
Impairment of investment in acquired content rights 20 3.4 5.4
Staff costs 8 86.5 79.4
Net foreign exchange losses/(gains) 2.8 (0.1)
Operating lease rentals 35 9.7 6.9
The total remuneration during the year of the Group’s auditor was as follows:
Year ended 31 March 2016
£m
Year ended 31 March 2015
£m
Audit fees
– Fees payable for the audit of the Group’s annual accounts 0.4 0.3
– Fees payable for the audit of the Group’s subsidiaries 0.3 0.3
Other services
– Services relating to corporate finance transactions 0.5 0.4
– Tax compliance services - 0.1
Total 1.2 1.1
7. KEY MANAGEMENT COMPENSATION AND DIRECTORS’ EMOLUMENTS
KEY MANAGEMENT COMPENSATION
The directors are of the opinion that the key management of the Group in the years ended 31 March 2016 and 2015 comprised the two
executive directors. These persons had authority and responsibility for planning, directing and controlling the activities of the Group, directly
or indirectly.
The aggregate amounts of key management compensation are set out below:
Year ended 31 March 2016
£m
Year ended 31 March 2015
£m
Short-term employee benefits1 1.5 1.9
Share-based payment benefits 0.7 0.5
Total 2.2 2.4
1. Short-term employee benefits comprise salary, taxable benefits, annual bonus and pensions and include employer social security contributions of £0.1m (2015: £0.1m).
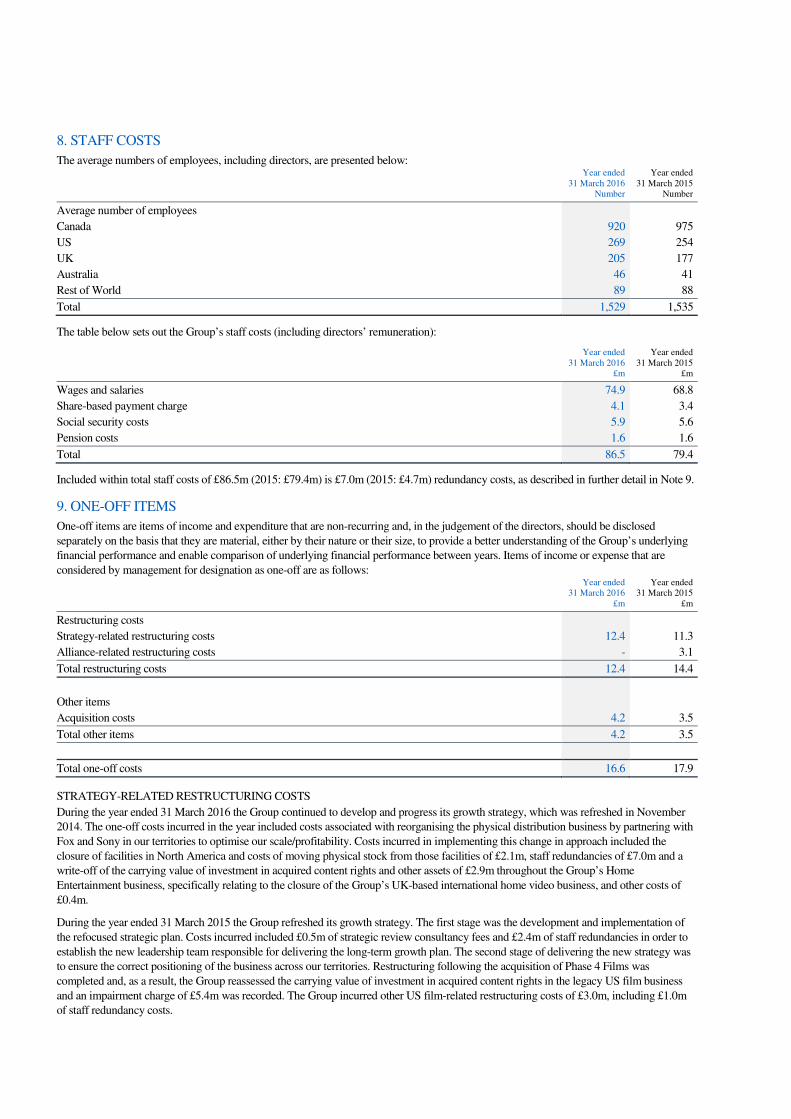
8. STAFF COSTS
The average numbers of employees, including directors, are presented below:
Year ended 31 March 2016
Number
Year ended 31 March 2015
Number
Average number of employees
Canada 920 975
US 269 254
UK 205 177
Australia 46 41
Rest of World 89 88
Total 1,529 1,535
The table below sets out the Group’s staff costs (including directors’ remuneration):
Year ended 31 March 2016
£m
Year ended 31 March 2015
£m
Wages and salaries 74.9 68.8
Share-based payment charge 4.1 3.4
Social security costs 5.9 5.6
Pension costs 1.6 1.6
Total 86.5 79.4
Included within total staff costs of £86.5m (2015: £79.4m) is £7.0m (2015: £4.7m) redundancy costs, as described in further detail in Note 9.
9. ONE-OFF ITEMS
One-off items are items of income and expenditure that are non-recurring and, in the judgement of the directors, should be disclosed
separately on the basis that they are material, either by their nature or their size, to provide a better understanding of the Group’s underlying
financial performance and enable comparison of underlying financial performance between years. Items of income or expense that are
considered by management for designation as one-off are as follows:
Year ended 31 March 2016
£m
Year ended 31 March 2015
£m
Restructuring costs
Strategy-related restructuring costs 12.4 11.3
Alliance-related restructuring costs - 3.1
Total restructuring costs 12.4 14.4
Other items
Acquisition costs 4.2 3.5
Total other items 4.2 3.5
Total one-off costs 16.6 17.9
STRATEGY-RELATED RESTRUCTURING COSTS
During the year ended 31 March 2016 the Group continued to develop and progress its growth strategy, which was refreshed in November
2014. The one-off costs incurred in the year included costs associated with reorganising the physical distribution business by partnering with
Fox and Sony in our territories to optimise our scale/profitability. Costs incurred in implementing this change in approach included the
closure of facilities in North America and costs of moving physical stock from those facilities of £2.1m, staff redundancies of £7.0m and a
write-off of the carrying value of investment in acquired content rights and other assets of £2.9m throughout the Group’s Home
Entertainment business, specifically relating to the closure of the Group’s UK-based international home video business, and other costs of
£0.4m.
During the year ended 31 March 2015 the Group refreshed its growth strategy. The first stage was the development and implementation of
the refocused strategic plan. Costs incurred included £0.5m of strategic review consultancy fees and £2.4m of staff redundancies in order to
establish the new leadership team responsible for delivering the long-term growth plan. The second stage of delivering the new strategy was
to ensure the correct positioning of the business across our territories. Restructuring following the acquisition of Phase 4 Films was
completed and, as a result, the Group reassessed the carrying value of investment in acquired content rights in the legacy US film business
and an impairment charge of £5.4m was recorded. The Group incurred other US film-related restructuring costs of £3.0m, including £1.0m
of staff redundancy costs.

9. ONE-OFF ITEMS CONTINUED
PRIOR YEAR ALLIANCE-RELATED RESTRUCTURING COSTS
In the year ended 31 March 2015, the Group incurred £3.1m of restructuring costs relating to the Alliance acquisition, which was completed
in January 2013. A charge of £1.3m was recorded for staff redundancy costs associated with the Group’s synergy-realisation programme. A
charge of £0.4m was recorded in respect of unused office space as a result of the integration of the operations in Canada. Other restructuring
costs of £1.4m were incurred during the prior year, including costs associated with IT systems integration.
ACQUISITION COSTS
Acquisition costs of £7.0m were incurred during the year ended 31 March 2016 relating to the Group’s acquisition and investment activities,
relating to The Mark Gordon Company (fully consolidated from 19 May 2015), Astley Baker Davies Limited (22 October 2015), Dualtone
Music Group (11 January 2016), Last Gang Entertainment (7 March 2016) and Renegade 83 (24 March 2016) as well as the investment in
Sierra Pictures (22 December 2015).
A credit of £2.8m related to the release of excess accruals in relation to the Alliance transaction was recognised during the year ended 31
March 2016.
Acquisition costs of £1.8m were incurred during the year ended 31 March 2015 related to the Group’s acquisitions of Phase 4 Films (3 June
2014), Paperny Entertainment (31 July 2014) and Force Four Entertainment (28 August 2014) and the strategic investment in Secret
Location (completed 28 May 2014), as well as £1.7m of costs on consideration of a number of potential acquisitions which did not ultimately
complete.
10. FINANCE INCOME AND FINANCE COSTS
Finance income and finance costs comprise:
Note
Year ended 31 March 2016
£m
Year ended 31 March 2015
£m
Finance income
Other finance income 0.4 -
Total finance income 0.4 -
Finance costs
Interest cost (16.4) (10.5)
Amortisation of deferred finance charges 23 (2.2) (1.9)
Other accrued interest charges (1.1) (0.7)
Write-off of deferred finance charges 23 (5.3) -
Fees payable on amendment to bank facility 23 - (0.7)
Loss on fair value of derivative financial instruments (0.5) -
Net foreign exchange losses (2.0) (2.4)
Total finance costs (27.5) (16.2)
Net finance costs (27.1) (16.2)
Comprised of:
Adjusted net finance costs (20.6) (14.8)
One-off net finance costs 14 (6.5) (1.4)
One-off net finance costs of £6.5m (2015: £1.4m) comprise a charge of £5.3m in respect of deferred finance charges written off on the re-
financing of the Group’s bank facility during the year (2015: £0.7m facility amendment fees), a £0.5m fair value loss on derivative financial
instruments broken on the refinancing, £1.1m (2015: £0.7m) of non-cash accrued interest charges on certain liabilities and £0.4m of interest
receivable of certain tax refunds.

11. TAX
ANALYSIS OF CHARGE IN THE YEAR
Note
Year ended 31 March 2016
£m
Year ended 31 March 2015 1
£m
Current tax (charge)/credit:
– in respect of current year (21.9) (13.7)
– in respect of prior years 2.0 1.2
Total current tax charge (19.9) (12.5)
Deferred tax credit:
– in respect of current year 9.3 8.7
– in respect of prior years 2.9 1.1
Total deferred tax credit 12.2 9.8
Income tax charge (7.7) (2.7)
Of which:
Adjusted tax charge on adjusted profit before tax 14 (22.4) (20.0)
One-off net tax credit 14 14.7 17.3
1. The allocation between the current and deferred tax (charge)/credit in respect of the prior year have been restated to reflect a presentational change that does not impact the income tax charge.
The one-off tax credit comprises tax credits of £2.5m (2015: £1.3m) in relation to the one-off items described in Note 9, tax credits of £5.0m
(2015: £3.9m) on amortisation of acquired intangibles described in Note 16, a tax credit of £0.6m (2015: tax credit of £0.1m) on one-off net
finance items as described in Note 10, a tax credit of £nil (2015: tax credit of £0.2m) on share-based payments as described in Note 34, a tax
credit of £4.9m (2015: £2.3m) relating to prior year current tax and deferred tax adjustments, and a tax credit of £1.7m (2015: £9.5m) on
other non-recurring tax items.
The charge for the year can be reconciled to the profit in the consolidated income statement as follows:
Year ended
31 March 2016 Year ended
31 March 2015
£m % £m %
Profit before tax (including joint ventures) 47.9 44.0
Deduct share of results of joint ventures (3.4) (0.2)
Profit before tax (excluding joint ventures) 44.5 43.8
Taxes at applicable domestic rates (9.7) (21.8) (8.3) (19.0)
Effect of income that is exempt from tax 3.1 7.0 1.6 3.7
Effect of expenses that are not deductible in determining taxable profit (5.2) (11.7) (1.5) (3.4)
Effect of deferred tax recognition of losses/temporary differences 3.3 7.4 7.9 18.0
Effect of losses/temporary differences not recognised in deferred tax (4.3) (9.7) (4.5) (10.3)
Effect of non-controlling interests 0.2 0.5 - -
Effect of tax rate changes - - (0.2) (0.5)
Prior year items 4.9 11.0 2.3 5.3
Income tax charge and effective tax rate for the year (7.7) (17.3) (2.7) (6.2)
Income tax is calculated at the rates prevailing in the respective jurisdictions. The standard tax rates in each jurisdiction are 26.5% in Canada
(2015: 26.5%), 36.0%-40.8% in the US (2015: 36.0%), 20.0% in the UK (2015: 21.0%), 25.0% in the Netherlands (2015: 25.0%), 30.0% in
Australia (2015: 30.0%) and 27.3% in Spain (2015: 29.5%).
ANALYSIS OF TAX ON ITEMS TAKEN DIRECTLY TO EQUITY
Note
Year ended 31 March 2016
£m
Year ended 31 March 2015
£m
Deferred tax credit/(charge) on cash flow hedges 0.6 (1.7)
Deferred tax credit on share options - 0.1
Total credit/(charge) taken directly to equity 12 0.6 (1.6)

12. DEFERRED TAX ASSETS AND LIABILITIES
The following are the major deferred tax assets and liabilities recognised by the Group and movements thereon during the year:
Note
Accelerated tax depreciation
£m
Other intangible assets
£m
Unused tax losses
£m
Financing items
£m Other
£m Total
£m
At 1 April 2014 - (14.9) 14.9 0.3 1.8 2.1
Acquisition of subsidiaries 27 - (4.6) - - - (4.6)
Credit/(charge) to income 0.1 1.3 7.4 (0.2) 1.2 9.8
Charge to equity 11 - - - (1.5) (0.1) (1.6)
Exchange differences - 0.3 (0.3) 0.1 (0.1) -
At 31 March 2015 0.1 (17.9) 22.0 (1.3) 2.8 5.7
Acquisition of subsidiaries 27 - (50.9) - - - (50.9)
(Charge)/credit to income (0.1) 7.9 4.4 0.2 (0.2) 12.2
Credit to equity 11 - - - 0.6 - 0.6
Exchange differences - (1.9) 0.7 - (0.3) (1.5)
At 31 March 2016 - (62.8) 27.1 (0.5) 2.3 (33.9)
The category “Other” includes temporary differences on share options, accrued liabilities, certain asset valuation provisions, foreign
exchange, investment in productions and investment in acquired content rights.
The deferred tax balances have been reflected in the consolidated balance sheet as follows:
31 March 2016
£m 31 March 2015
£m
Deferred tax assets 19.2 12.6
Deferred tax liabilities (53.1) (6.9)
Total (33.9) 5.7
Utilisation of deferred tax assets is dependent on the future profitability of the Group. The Group has recognised net deferred tax assets
relating to tax losses and other short-term temporary differences carried forward as the Group considers that, on the basis of the most recent
forecasts, there will be sufficient taxable profits in the future against which these items will be offset. At the balance sheet date, due to the
unpredictability of future profit streams, the Group has unrecognised deferred tax assets of £40.3m (2015: £38.6m) relating to tax losses and
other temporary differences available for offset against future profits. Included in unrecognised deferred tax assets are £17.0m
(2015:£17.9m) relating to losses that will expire in the years ending 2026 to 2035, and £1.0m expiring before 2026 (2015: £1.0m).
The Group also has unrecognised deferred tax assets of £7.7m (2015: £nil) in connection with the put and call options that were granted over
the remaining 35% in Renegade 83 and of the remaining 49% in Sierra Pictures (see Note 27 for further details).
At the balance sheet date, the aggregate amount of temporary differences associated with undistributed earnings of subsidiaries for which
deferred tax liabilities have not been recognised was £11.6m (2015: £6.0m). The amount of temporary differences arising in connection with
interests in joint ventures was £nil (2015: £0.5m).
Further reductions in the corporate income tax rate in the UK were enacted during the year ended 31 March 2016, reducing the rate from the
current rate of 20% (applicable from 1 April 2015) to 19% from 1 April 2017, and to 18% from 1 April 2020. These rates are reflected in the
deferred tax calculations as appropriate.
13. DIVIDENDS
On 23 May 2016 the directors declared a final dividend in respect of the financial year ended 31 March 2016 of 1.2 pence (2015: 1.1 pence)
per share which will absorb an estimated £5.1m of total equity (2015: £3.2m). It will be paid on or around 9 September 2016 to shareholders
who are on the register of members on 8 July 2016 (the record date). This dividend is expected to qualify as an eligible dividend for
Canadian tax purposes. The dividend will be paid net of withholding tax based on the residency of the individual shareholder.

14. EARNINGS PER SHARE
On 20 October 2015, the Group completed a fully underwritten 4 for 9 renounceable rights issue of 131,476,173 new common shares at
153.0 pence per new common share. The denominators within the prior year calculation of both basic and diluted earnings per share have
been adjusted to reflect the bonus factor of 14% of this rights issue to ensure an appropriate comparison.
Year ended 31 March 2016
Pence
(Restated)
Year ended 31 March 2015
Pence
Basic earnings per share 9.8 12.7
Diluted earnings per share 9.6 12.5
Adjusted basic earnings per share 19.7 21.0
Adjusted diluted earnings per share 19.4 20.8
Basic earnings per share is calculated by dividing earnings for the year attributable to the owners of the Company by the weighted average
number of shares in issue during the year, excluding own shares held by the Employee Benefit Trust (EBT) which are treated as cancelled.
Adjusted basic earnings per share is calculated by dividing adjusted earnings for the year attributable to the owners of the Company by the
weighted average number of shares in issue during the year, excluding own shares held by the EBT which are treated as cancelled. Adjusted
earnings are the profit for the year attributable to the owners of the Company adjusted to exclude one-off operating and finance items, share-
based payment charge, ‘tax, finance costs and depreciation’ related to joint ventures and amortisation of acquired intangibles (net of any
related tax effects).
Fully diluted earnings per share and adjusted fully diluted earnings per share are calculated after adjusting the weighted average number of
shares in issue during the year to assume conversion of all potentially dilutive shares. There have been no transactions involving common
shares or potential common shares between the reporting date and the date of authorisation of these consolidated financial statements.
The weighted average number of shares used in the earnings per share calculations are set out below:
Note
Year ended 31 March 2016
Million
(Restated)
Year ended 31 March 2015
Million
Weighted average number of shares for basic earnings per share and adjusted basic earnings per share 373.5 330.1
Effect of dilution:
Employee share awards 4.1 3.2
Contingent consideration with option to settle in cash or shares1 27 2.2 -
Weighted average number of shares for diluted earnings per share and adjusted diluted earnings per
share 379.8 333.3 1. The Group hold an option to settle the contingent consideration payable in relation to the acquisitions of Renegade 83 and Last Gang Entertainment in shares or in cash. Refer to Note 27 for details.
As noted above, shares held by the EBT, classified as own shares, are excluded from earnings per share and adjusted earnings per share.
ADJUSTED EARNINGS PER SHARE
The directors believe that the presentation of adjusted earnings per share, being the fully diluted earnings per share adjusted for one-off
operating and finance items, share-based payment charge, one-off ‘tax, finance costs and depreciation’ related to joint ventures and
amortisation of acquired intangibles (net of any related tax effects), helps to explain the underlying performance of the Group. A
reconciliation of the earnings used in the fully diluted earnings per share calculation to earnings used in the adjusted earnings per share
calculation is set out below:
Year ended
31 March 2016
(Restated)
Year ended 31 March 2015
Note £m Pence per share £m Pence per share
Profit for the year attributable to the owners of the Company 36.5 9.6 41.8 12.5
Add back one-off items 9 16.6 4.4 17.9 5.4
Add back amortisation of acquired intangibles 16 27.4 7.2 22.2 6.7
Add back share-based payment charge 34 4.1 1.1 3.4 1.0
Add back one-off net finance costs 10 6.5 1.7 1.4 0.4
Deduct one-off tax, finance costs and depreciation related to joint
ventures 29 (0.5) (0.1) (0.1) -
Deduct net tax effect of above and other one-off tax items 11 (14.7) (3.9) (17.3) (5.2)
Deduct non-controlling interests’ share of above items (2.4) (0.6) - -
Adjusted earnings attributable to the owners of the Company 73.5 19.4 69.3 20.8

14. EARNINGS PER SHARE CONTINUED
Profit before tax (IFRS measure) of £47.9m (2015: £44.0m) is reconciled to adjusted profit before tax and adjusted earnings as follows:
Note
Year ended 31 March 2016
£m
Year ended 31 March 2015
£m
Profit before tax (IFRS measure) 47.9 44.0
Add back one-off items 9 16.6 17.9
Add back amortisation of acquired intangibles 16 27.4 22.2
Add back share-based payment charge 34 4.1 3.4
Add back/(deduct) tax, finance costs and depreciation related to joint ventures 29 1.6 (0.1)
Add back one-off net finance costs 10 6.5 1.4
Adjusted profit before tax 104.1 88.8
Adjusted tax charge 11 (22.4) (20.0)
Adjusted tax charge relating to joint ventures (2.1) -
(Deduct)/add-back (profit)/loss attributable to non-controlling interests (3.7) 0.5
(Deduct)/add back non-controlling interests’ share of adjusting items above (2.4) -
Adjusted earnings attributable to the owners of the Company 73.5 69.3
15. GOODWILL
Note Total
£m
Cost and carrying amount
At 1 April 2014 191.9
Acquisition of subsidiaries 27 21.7
Exchange differences (3.8)
At 31 March 2015 209.8
Acquisition of subsidiaries 27 137.8
Exchange differences 6.3
At 31 March 2016 353.9
Goodwill arising on a business combination is allocated to the cash generating units (CGUs) that are expected to benefit from that business
combination. As explained below, the Group’s CGUs are Television, The Mark Gordon Company (MGC), Family and Film.
IMPAIRMENT TESTING FOR GOODWILL
The Group tests goodwill annually for impairment, or more frequently if there are indications that goodwill might be impaired. An
impairment loss is recognised if the carrying value of a CGU exceeds its recoverable amount.
The recoverable amount of a CGU is determined from value-in-use calculations based on the net present value of discounted cash flows. In
assessing value-in-use, the estimated future cash flows are derived from the most recent financial budgets and plans and an assumed growth
rate. A terminal value is calculated by discounting using an appropriate weighted discount rate. Any impairment losses are recognised in the
consolidated income statement as an expense.
As a result of the acquisition of Astley Baker Davies Limited and MGC (see Note 27), the Group has created two additional CGUs during
the year ended 31 March 2016. The Group has four CGUs being the smallest identifiable group of assets that generate cash flows that are
largely independent of the cash flows from other groups of assets. The directors consider the CGUs to be Television, Family, Film and
MGC.
KEY ASSUMPTIONS USED IN VALUE-IN-USE CALCULATIONS
Key assumptions used in the value-in-use calculations for each CGU are set out below:
31 March 2016 31 March 2015
CGU
Pre-tax discount rate
%
Terminal growth rate
%
Period of specific cash
flows
Pre-tax discount rate
%
Terminal growth rate
%
Period of specific cash
flows
Television 10.0 3.0 3 years 10.6 3.0 5 years
The Mark Gordon Company 11.7 3.0 3 years N/a N/a N/a
Family 9.5 3.0 3 years N/a N/a N/a
Film 8.8 2.8 3 years 8.7 2.8 5 years
The calculations of the value-in-use for all CGUs are most sensitive to the operating profit, discount rate and growth rate assumptions.
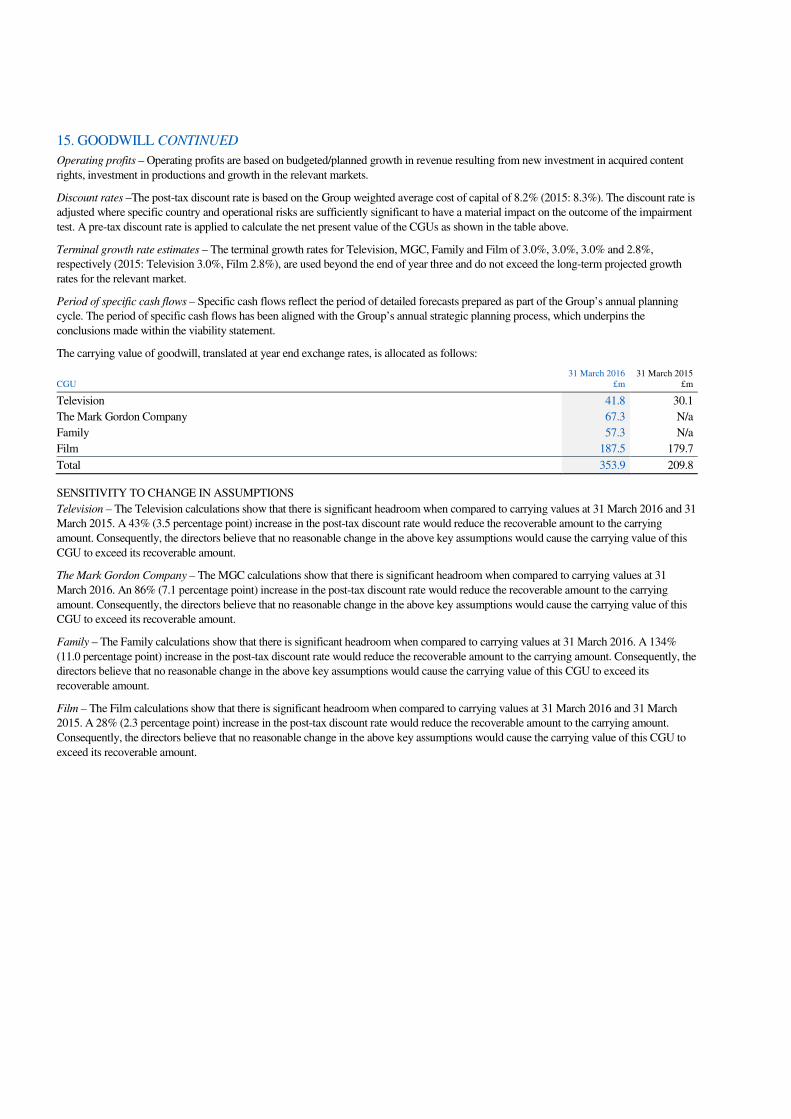
15. GOODWILL CONTINUED
Operating profits – Operating profits are based on budgeted/planned growth in revenue resulting from new investment in acquired content
rights, investment in productions and growth in the relevant markets.
Discount rates –The post-tax discount rate is based on the Group weighted average cost of capital of 8.2% (2015: 8.3%). The discount rate is
adjusted where specific country and operational risks are sufficiently significant to have a material impact on the outcome of the impairment
test. A pre-tax discount rate is applied to calculate the net present value of the CGUs as shown in the table above.
Terminal growth rate estimates – The terminal growth rates for Television, MGC, Family and Film of 3.0%, 3.0%, 3.0% and 2.8%,
respectively (2015: Television 3.0%, Film 2.8%), are used beyond the end of year three and do not exceed the long-term projected growth
rates for the relevant market.
Period of specific cash flows – Specific cash flows reflect the period of detailed forecasts prepared as part of the Group’s annual planning
cycle. The period of specific cash flows has been aligned with the Group’s annual strategic planning process, which underpins the
conclusions made within the viability statement.
The carrying value of goodwill, translated at year end exchange rates, is allocated as follows:
CGU 31 March 2016
£m 31 March 2015
£m
Television 41.8 30.1
The Mark Gordon Company 67.3 N/a
Family 57.3 N/a
Film 187.5 179.7
Total 353.9 209.8
SENSITIVITY TO CHANGE IN ASSUMPTIONS
Television – The Television calculations show that there is significant headroom when compared to carrying values at 31 March 2016 and 31
March 2015. A 43% (3.5 percentage point) increase in the post-tax discount rate would reduce the recoverable amount to the carrying
amount. Consequently, the directors believe that no reasonable change in the above key assumptions would cause the carrying value of this
CGU to exceed its recoverable amount.
The Mark Gordon Company – The MGC calculations show that there is significant headroom when compared to carrying values at 31
March 2016. An 86% (7.1 percentage point) increase in the post-tax discount rate would reduce the recoverable amount to the carrying
amount. Consequently, the directors believe that no reasonable change in the above key assumptions would cause the carrying value of this
CGU to exceed its recoverable amount.
Family – The Family calculations show that there is significant headroom when compared to carrying values at 31 March 2016. A 134%
(11.0 percentage point) increase in the post-tax discount rate would reduce the recoverable amount to the carrying amount. Consequently, the
directors believe that no reasonable change in the above key assumptions would cause the carrying value of this CGU to exceed its
recoverable amount.
Film – The Film calculations show that there is significant headroom when compared to carrying values at 31 March 2016 and 31 March
2015. A 28% (2.3 percentage point) increase in the post-tax discount rate would reduce the recoverable amount to the carrying amount.
Consequently, the directors believe that no reasonable change in the above key assumptions would cause the carrying value of this CGU to
exceed its recoverable amount.

16. OTHER INTANGIBLE ASSETS Acquired intangibles
Note
Exclusive content
agreements and libraries
£m
Trade names and brands
£m
Exclusive distribution agreements
£m
Customer relationships
£m
Non-compete agreements
£m Software
£m Total
£m
Cost
At 1 April 2014 103.4 31.4 23.7 34.8 13.6 7.8 214.7
Acquisition of subsidiaries 27 - 5.5 - 11.2 - 0.1 16.8
Additions - - - - 3.1 2.0 5.1
Exchange differences (1.1) (0.4) 1.1 (1.3) - (0.3) (2.0)
At 31 March 2015 102.3 36.5 24.8 44.7 16.7 9.6 234.6
Acquisition of subsidiaries 27 76.9 161.8 - - - - 238.7
Additions 16.8 - - - - 1.5 18.3
Disposals - - - - - (0.1) (0.1)
Exchange differences 7.1 0.7 0.4 0.4 0.2 0.1 8.9
At 31 March 2016 203.1 199.0 25.2 45.1 16.9 11.1 500.4
Amortisation
At 1 April 2014 (39.5) (26.3) (22.4) (20.4) (10.8) (3.8) (123.2)
Amortisation charge for the year 6 (11.6) (2.3) (0.3) (4.6) (3.4) (2.2) (24.4)
Exchange differences 0.5 0.5 (1.1) 0.6 - 0.1 0.6
At 31 March 2015 (50.6) (28.1) (23.8) (24.4) (14.2) (5.9) (147.0)
Amortisation charge for the year 6 (14.7) (6.1) (0.3) (4.6) (1.7) (2.3) (29.7)
Disposals - - - - - 0.1 0.1
Exchange differences (1.5) (0.6) (0.4) (0.4) (0.2) (0.2) (3.3)
At 31 March 2016 (66.8) (34.8) (24.5) (29.4) (16.1) (8.3) (179.9)
Carrying amount
At 31 March 2015 51.7 8.4 1.0 20.3 2.5 3.7 87.6
At 31 March 2016 136.3 164.2 0.7 15.7 0.8 2.8 320.5
The amortisation charge for the year ended 31 March 2016 comprises £27.4m (2015: £22.2m) in respect of acquired intangibles.
17. INVESTMENT IN PRODUCTIONS
Note
Year ended 31 March 2016
£m
Year ended 31 March 2015
£m
Cost
Balance at 1 April 386.1 282.3
Acquisition of subsidiaries 27 59.4 5.8
Additions 99.1 103.1
Exchange differences 4.8 (5.1)
Balance at 31 March 549.4 386.1
Amortisation
Balance at 1 April (300.6) (223.8)
Amortisation charge for the year 6 (110.6) (82.1)
Exchange differences (4.4) 5.3
Balance at 31 March (415.6) (300.6)
Carrying amount 133.8 85.5
Borrowing costs of £4.1m (2015: £2.5m) related to Television and Film production financing have been included in the additions during the
year.
Included within the carrying amount as at 31 March 2016 is £75.5m (2015: £47.5m) of productions in progress, which includes additions
from the acquisition of subsidiaries of £57.7m (2015: £3.8m).

18. PROPERTY, PLANT AND EQUIPMENT
Note
Leasehold improvements
£m
Fixtures, fittings and equipment
£m Total
£m
Cost
At 1 April 2014 3.9 10.8 14.7
Acquisition of subsidiaries 27 0.2 0.7 0.9
Additions 0.5 0.8 1.3
Disposals - (0.2) (0.2)
Exchange differences - 0.3 0.3
At 31 March 2015 4.6 12.4 17.0
Acquisition of subsidiaries 27 - 0.2 0.2
Additions 6.4 1.1 7.5
Disposals - (0.1) (0.1)
Exchange differences 0.4 0.2 0.6
At 31 March 2016 11.4 13.8 25.2
Depreciation
At 1 April 2014 (1.2) (8.0) (9.2)
Depreciation charge for the year 6 (0.5) (1.0) (1.5)
Disposals - 0.2 0.2
Exchange differences - (0.4) (0.4)
At 31 March 2015 (1.7) (9.2) (10.9)
Depreciation charge for the year 6 (0.9) (1.2) (2.1)
Disposals - 0.1 0.1
Exchange differences (0.1) (0.2) (0.3)
At 31 March 2016 (2.7) (10.5) (13.2)
Carrying amount
At 31 March 2015 2.9 3.2 6.1
At 31 March 2016 8.7 3.3 12.0
19. INVENTORIES
Inventories at 31 March 2016 comprise finished goods of £51.1m (2015: £52.0m).
20. INVESTMENT IN ACQUIRED CONTENT RIGHTS
Note
Year ended 31 March 2016
£m
Year ended 31 March 2015
£m
Balance at 1 April 221.1 230.1
Acquisition of subsidiaries 27 0.1 3.5
Additions 164.2 165.2
Amortisation charge for the year 6 (147.0) (165.3)
Impairment charge for the year 6 (3.4) (5.4)
Exchange differences 6.3 (7.0)
Balance at 31 March 241.3 221.1
The impairment charge recognised during the year ended 31 March 2016 of £3.4m was in respect of a write-off of the carrying value of
investment in acquired content rights on the closure of the Group’s Home Entertainment business, specifically relating to the closure of the
Group’s UK-based international home video business. The impairment charge recognised during the prior year of £5.4m was in respect to
the investment in acquired content rights previously made by the Group, as a result of a refocused US Film strategy following the acquisition
of Phase 4 Films (see Note 9 for further details).

21. TRADE AND OTHER RECEIVABLES
Current Note 31 March 2016
£m 31 March 2015
£m
Trade receivables 167.5 129.1
Less: provision for doubtful debts (2.3) (2.6)
Net trade receivables 32 165.2 126.5
Prepayments and accrued income 85.5 71.5
Amounts owed from joint ventures 0.7 -
Other receivables 89.7 81.6
Total 341.1 279.6
Non-current
Trade receivables 10.9 24.7
Prepayments and accrued income 35.7 20.2
Other receivables 1.5 0.9
Total 48.1 45.8
Trade receivables are generally non-interest bearing. The average credit period taken on sales, excluding the effect of acquisitions, is 70 days
(2015: 63 days).
Provisions for doubtful debts are based on estimated irrecoverable amounts, determined by reference to past default experience and an
assessment of the current economic environment.
Included within current other receivables at 31 March 2016 is £65.3m (2015: £57.9m) of government assistance (in the form of Canadian
and US tax credits). During the year £34.4m (2015: £29.4m) in government assistance was received.
As at 31 March 2016 and 2015 trade receivables are aged as follows:
31 March 2016
£m 31 March 2015
£m
Neither impaired nor past due 141.5 109.5
Less than 60 days 10.7 11.8
Between 60 and 90 days 3.9 2.0
More than 90 days 9.1 3.2
Total 165.2 126.5
Trade receivables that are past due and not impaired do not have a significant impact on the credit quality of the counterparty. All these
amounts are still considered recoverable. The Group does not hold any collateral over these balances.
The movements in the provision for doubtful debts in years ended 31 March 2016 and 2015 were as follows:
Year ended 31 March 2016
£m
Year ended 31 March 2015
£m
Balance at 1 April (2.6) (3.8)
Provision recognised in the year (1.0) (1.4)
Provision reversed in the year 0.7 0.3
Utilisation of provision 0.7 2.1
Exchange differences (0.1) 0.2
Balance at 31 March (2.3) (2.6)
In determining the recoverability of a trade receivable the Group considers any change to the credit quality of the trade receivable from the
date credit was initially granted up to the reporting date.

21. TRADE AND OTHER RECEIVABLES CONTINUED
Management has credit policies in place and the exposure to credit risk is monitored by individual operating divisions on an ongoing basis.
The Group has no significant concentration of credit risk, with exposure spread over a large number of counterparties and customers. Refer
to Note 32 for further details.
The table below sets out the ageing of the Group’s impaired receivables:
31 March 2016
£m 31 March 2015
£m
Less than 60 days (0.3) (0.1)
Between 60 and 90 days - -
More than 90 days (2.0) (2.5)
Total (2.3) (2.6)
Trade and other receivables are held in the following currencies at 31 March 2016 and 2015. Amounts held in currencies other than pounds
sterling have been converted at the respective exchange rate ruling at the balance sheet date.
Pounds sterling
£m Euros
£m
Canadian dollars
£m
US dollars
£m Other
£m Total
£m
Current 54.2 35.9 122.1 115.4 13.5 341.1
Non-current 9.3 4.2 7.0 27.2 0.4 48.1
At 31 March 2016 63.5 40.1 129.1 142.6 13.9 389.2
Current 32.8 25.8 115.9 93.9 11.2 279.6
Non-current 4.2 3.2 15.6 22.8 - 45.8
At 31 March 2015 37.0 29.0 131.5 116.7 11.2 325.4
The directors consider that the carrying amount of trade and other receivables approximates to their fair value.
22. CASH AND CASH EQUIVALENTS
Cash and cash equivalents are held in the following currencies at 31 March 2016 and 2015. Amounts held in currencies other than pounds
sterling have been converted at their respective exchange rate ruling at the balance sheet date.
Note 31 March 2016
£m 31 March 2015
£m
Cash and cash equivalents:
Pounds sterling 42.8 14.5
Euros 2.7 8.1
Canadian dollars 34.4 14.5
US dollars 25.8 31.7
Australian dollars 2.5 2.3
Other 0.1 0.2
Cash and cash equivalents per the consolidated balance sheet 32 108.3 71.3
Held repayable only for production financing 13.6 27.6
Other 94.7 43.7
Cash and cash equivalents 108.3 71.3
Cash and cash equivalents comprise only cash in hand and demand deposits. Included within cash and cash equivalents is £13.6m which can
only be used for repayment of certain production financing.
The Group had no cash equivalents at either 31 March 2016 or 2015. The credit risk with respect to cash and cash equivalents is limited
because the counterparties are banks with high credit ratings assigned by international credit rating agencies.

23. INTEREST-BEARING LOANS AND BORROWINGS
31 March 2016
£m 31 March 2015
£m
Bank borrowings - 275.8
Senior secured notes 285.0 -
Deferred finance charges (9.5) (7.2)
Total 275.5 268.6
Shown in the consolidated balance sheet as:
Non-current 275.5 248.7
Current - 19.9
The carrying amounts of the Group’s gross borrowings at 31 March 2016 and 2015 are denominated in the following currencies. Amounts
held in currencies other than pounds sterling have been converted at the respective exchange rate ruling at the balance sheet date.
Pounds sterling
£m Euros
£m
Canadian dollars
£m
US dollars
£m Total
£m
Senior secured notes 285.0 - - - 285.0
At 31 March 2016 285.0 - - - 285.0
Bank borrowings 148.9 5.4 68.2 46.1 268.6
At 31 March 2015 148.9 5.4 68.2 46.1 268.6
The weighted average interest rates on all bank borrowings are not materially different from their nominal interest rates. The weighted
average interest rate on all interest-bearing loans and borrowings is 5.6% (2015: 4.5%). The directors consider that the carrying amount of
interest-bearing loans and borrowings approximates to their fair value.
BANK BORROWINGS
Terms of borrowings at 31 March 2016 On 14 December 2015, the Group issued £285m in aggregate principal amount of 6.875% senior secured notes (Notes), due 2022, and
entered into a new super senior revolving credit facility (RCF) which matures in December 2020. Any amounts still outstanding at such date
must be repaid in full provided that some or all of the lenders under the RCF may elect to extend their commitments subject to terms and
conditions to be agreed among the relevant parties. The net proceeds from the offering have primarily been used to repay the Company's
previous credit facilities in full, and pay fees and expenses related to the Notes and the RCF.
The combination of this new non-amortising, fixed-rate debt financing and revolving credit facility provides the Company with a long-term
capital structure appropriate for its strategic ambitions. In addition, the re-financing permits greater flexibility by relieving constraints and
costs the Company historically incurred when undertaking acquisitions and other corporate activity, and allows the Company to react swiftly
to commercial opportunities, whilst also removing other restrictions typical of bank loan-based financing structures.
At 31 March 2016, the Group had available £106.1m of undrawn committed bank borrowings under the RCF.
During the year the Group paid £9.9m in respect of fees incurred for the issuance of the Group’s Notes and re-financing of the debt facility.
The fees were capitalised to the consolidated balance sheet to will be amortised on a straight line to the date of expiry.
The Notes and RCF are subject to a number of financial covenants including interest cover charge, gross debt against underlying EBITDA and
capital expenditure.
The Notes (2015: three term loans) are subject to mandatory repayments as follows:
Period
31 March 2016
£m
Within one year -
Between one year and five years -
Greater than five years 285.0
Total 285.0

23. INTEREST-BEARING LOANS AND BORROWINGS CONTINUED
Terms of borrowings at 31 March 2015 As at 31 March 2015 bank borrowings included a senior debt facility with a syndicate of banks managed by JP Morgan Chase N.A. The
Group had a US$504m multi-currency facility, which would have matured in January 2018, comprised:
(i) A US$344.5m revolving credit facility (RCF) (equivalent to £232.0m at 31 March 2015) which could be funded in US dollars, Canadian
dollars, pounds sterling and euros. At 31 March 2015, the Group had available US$94.6m (equivalent to £63.7m) of undrawn committed
bank borrowings under the RCF.
(ii) Three amortising term loans equivalent to US$159.5m, or £107.5m, comprising a Canadian dollar term loan and two pounds sterling
term loans. These borrowings were secured by certain assets of the Group (excluding television, family and film production assets). The
facility was with a syndicate of banks managed by JP Morgan Chase N.A.
During the year ended 31 March 2015, the Group paid £3.5m in respect of fees incurred for the amendments made to the Group’s senior debt
facility. £2.8m related to fees payable to the lenders which were capitalised to the consolidated balance sheet and amortised on a straight line
basis. £0.7m of fees incurred related to other legal and advisory costs which were expensed to the consolidated income statement in full.
£5.3m of costs previously capitalised and unamortised were expensed to the consolidated income statement in December 2015 upon re-
financing.
The three term loans were subject to mandatory repayments as follows:
Period 31 March 2015
Within one year £19.9m
Between one year and five years £87.6m
Greater than five years -
Total (£) £107.5m
Total (US$) US$159.5m
Canadian dollar amounts included in the above table have been converted at a GBP:CAD exchange rate of 1.8805 and US dollar amounts have been converted at a GBP:USD exchange rate of 1.4847.
24. PRODUCTION FINANCING
31 March 2016
£m 31 March 2015
£m
Production financing 130.6 116.9
Other loans 1.0 -
Total 131.6 116.9
Shown in the consolidated balance sheet as:
Non-current 33.6 47.2
Current 98.0 69.7
Production financing is used to fund the Group’s Television, Family and Film productions. The financing is arranged on an individual
production basis by special purpose production subsidiaries which are excluded from the security of the Group’s corporate facility. It is short-
term financing, typically having a maturity of less than two years, whilst the production is being made and is paid back once the production is
delivered and the government subsidies, tax credits, broadcaster pre-sales, international sales and/or home entertainment sales are received.
The Company deems this type of financing to be working capital and therefore timing based in nature. In connection with the production of a
television programme, we typically record initial operating cash outflows due to our investment in the production and concurrently record
initial positive cash inflow from financing activities due to the production financing we normally obtain.
Interest is charged at bank prime rate plus a margin. These facilities are secured by the assets and future revenue of the individual television,
family and film production subsidiaries and are non-recourse to other Group companies or assets. Interest payable on production financing
loans is capitalised and forms part of the cost of investment in productions. The weighted average interest rate on all production financing is
3.7% (2015:2.7%).
The Group has Canadian dollar and US dollar production credit facilities with various banks. Amounts held in currencies other than pounds
sterling have been converted at the respective exchange rate ruling at the balance sheet date. The carrying amounts of the Group’s production
financing at 31 March 2016 and 2015 are denominated in the following currencies.
Canadian dollars
£m
US dollars
£m Total
£m
At 31 March 2016 50.9 80.7 131.6
At 31 March 2015 51.8 65.1 116.9

25. TRADE AND OTHER PAYABLES
Current 31 March 2016
£m 31 March 2015
£m
Trade payables 117.4 86.7
Accruals and deferred income 304.7 271.9
Payable to joint ventures 0.1 -
Other payables 16.9 13.5
Total 439.1 372.1
Non-current
Accruals and deferred income 0.7 0.7
Other payables 50.4 15.8
Total 51.1 16.5
Trade and other payables principally comprise amounts outstanding for trade purchases and ongoing costs. For most suppliers no interest is
charged, but for overdue balances interest may be charged at various interest rates.
Included within current other payables at 31 March 2016 is £3.4m of contingent consideration in respect of the Alliance acquisition which
occurred during the year ended 31 March 2013 subsequently paid in April 2016 (2015: £6.1m within non-current other payables) and £9.2m
of contingent consideration in respect of acquisitions made during the year ended 31 March 2016. Refer to Note 27 for further detail.
Trade and other payables are held in the following currencies. Amounts held in currencies other than pounds sterling have been converted at
the respective exchange rate ruling at the balance sheet date.
Pounds sterling
£m Euros
£m
Canadian dollars
£m
US dollars
£m Other
£m Total
£m
Current 72.0 24.4 165.1 169.0 8.6 439.1
Non-current - - 1.8 49.1 0.2 51.1
At 31 March 2016 72.0 24.4 166.9 218.1 8.8 490.2
Current 61.8 22.8 147.0 135.5 5.0 372.1
Non-current - - 16.4 - 0.1 16.5
At 31 March 2015 61.8 22.8 163.4 135.5 5.1 388.6
The directors consider that the carrying amount of trade and other payables approximates to their fair value.
26. PROVISIONS
Onerous contracts
£m
Restructuring and redundancy
£m Total
£m
At 31 March 2015 2.7 0.4 3.1
Acquisitions of subsidiaries - 0.7 0.7
Provisions recognised in the year 2.3 3.3 5.6
Utilisation of provisions (3.4) (2.1) (5.5)
Exchange differences (0.1) 0.2 0.1
At 31 March 2016 1.5 2.5 4.0
Shown in the consolidated balance sheet as:
Non-current 0.3 - 0.3
Current 1.2 2.5 3.7
ONEROUS CONTRACTS
Onerous contracts principally represent provisions in respect of loss-making film titles and vacant leasehold properties. Provisions for
onerous contracts are recognised when the unavoidable costs of meeting the obligations under the contract exceed the economic benefits
expected to be received under it and the general recognition criteria of IAS 37 Provisions, Contingent Liabilities and Contingent Assets are
met.
Loss-making film titles These provisions represent future cash flows relating to film titles which are forecast to make a loss over their remaining lifetime at the
balance sheet date. As required by IFRS, before a provision for an onerous film title is recognised the Group first fully writes down any
related assets (generally these are investment in acquired content rights balances). These provisions are expected to be utilised within three
years (2015: three years) from the balance sheet date.
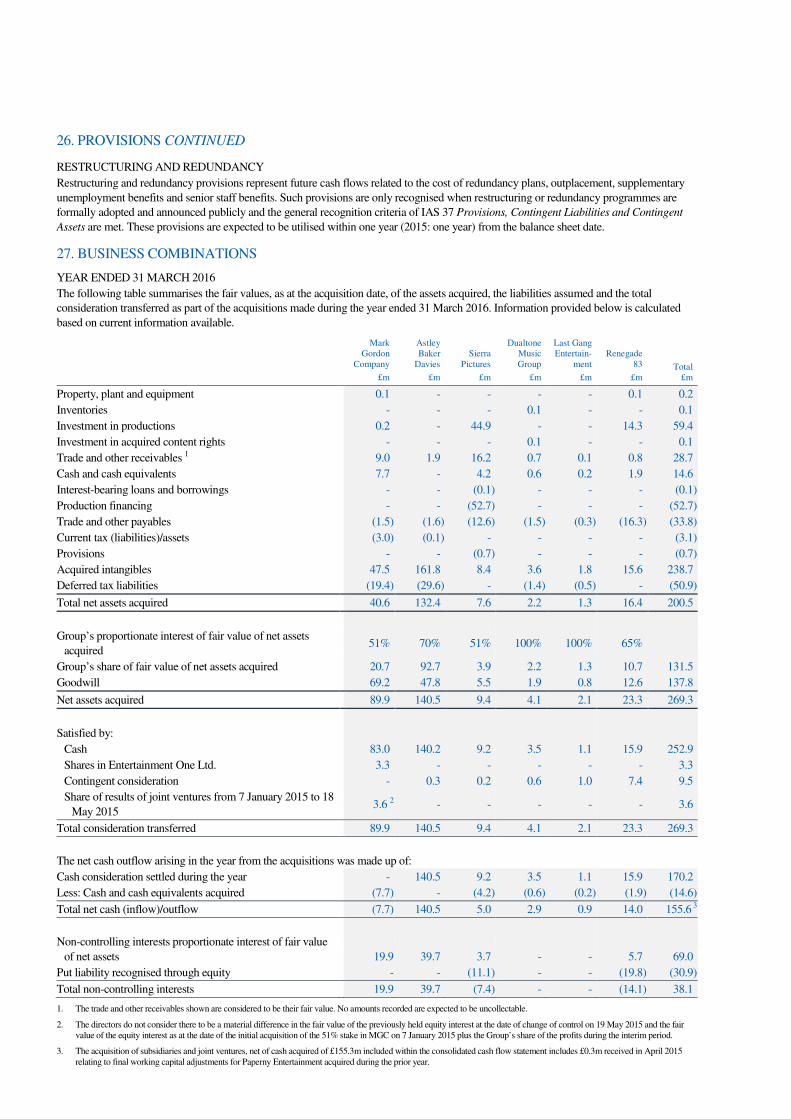
26. PROVISIONS CONTINUED
RESTRUCTURING AND REDUNDANCY
Restructuring and redundancy provisions represent future cash flows related to the cost of redundancy plans, outplacement, supplementary
unemployment benefits and senior staff benefits. Such provisions are only recognised when restructuring or redundancy programmes are
formally adopted and announced publicly and the general recognition criteria of IAS 37 Provisions, Contingent Liabilities and Contingent
Assets are met. These provisions are expected to be utilised within one year (2015: one year) from the balance sheet date.
27. BUSINESS COMBINATIONS
YEAR ENDED 31 MARCH 2016
The following table summarises the fair values, as at the acquisition date, of the assets acquired, the liabilities assumed and the total
consideration transferred as part of the acquisitions made during the year ended 31 March 2016. Information provided below is calculated
based on current information available.
Mark Gordon
Company
£m
Astley Baker
Davies
£m
Sierra Pictures
£m
Dualtone Music Group
£m
Last Gang Entertain-
ment
£m
Renegade 83
£m Total
£m
Property, plant and equipment 0.1 - - - - 0.1 0.2
Inventories - - - 0.1 - - 0.1
Investment in productions 0.2 - 44.9 - - 14.3 59.4
Investment in acquired content rights - - - 0.1 - - 0.1
Trade and other receivables 1 9.0 1.9 16.2 0.7 0.1 0.8 28.7
Cash and cash equivalents 7.7 - 4.2 0.6 0.2 1.9 14.6
Interest-bearing loans and borrowings - - (0.1) - - - (0.1)
Production financing - - (52.7) - - - (52.7)
Trade and other payables (1.5) (1.6) (12.6) (1.5) (0.3) (16.3) (33.8)
Current tax (liabilities)/assets (3.0) (0.1) - - - - (3.1)
Provisions - - (0.7) - - - (0.7)
Acquired intangibles 47.5 161.8 8.4 3.6 1.8 15.6 238.7
Deferred tax liabilities (19.4) (29.6) - (1.4) (0.5) - (50.9)
Total net assets acquired 40.6 132.4 7.6 2.2 1.3 16.4 200.5
Group’s proportionate interest of fair value of net assets
acquired 51% 70% 51% 100% 100% 65%
Group’s share of fair value of net assets acquired 20.7 92.7 3.9 2.2 1.3 10.7 131.5
Goodwill 69.2 47.8 5.5 1.9 0.8 12.6 137.8
Net assets acquired 89.9 140.5 9.4 4.1 2.1 23.3 269.3
Satisfied by:
Cash 83.0 140.2 9.2 3.5 1.1 15.9 252.9
Shares in Entertainment One Ltd. 3.3 - - - - - 3.3
Contingent consideration - 0.3 0.2 0.6 1.0 7.4 9.5
Share of results of joint ventures from 7 January 2015 to 18
May 2015 3.6 2 - - - - - 3.6
Total consideration transferred 89.9 140.5 9.4 4.1 2.1 23.3 269.3
The net cash outflow arising in the year from the acquisitions was made up of:
Cash consideration settled during the year - 140.5 9.2 3.5 1.1 15.9 170.2
Less: Cash and cash equivalents acquired (7.7) - (4.2) (0.6) (0.2) (1.9) (14.6)
Total net cash (inflow)/outflow (7.7) 140.5 5.0 2.9 0.9 14.0 155.6 3
Non-controlling interests proportionate interest of fair value
of net assets 19.9 39.7 3.7 - - 5.7 69.0
Put liability recognised through equity - - (11.1) - - (19.8) (30.9)
Total non-controlling interests 19.9 39.7 (7.4) - - (14.1) 38.1
1. The trade and other receivables shown are considered to be their fair value. No amounts recorded are expected to be uncollectable.
2. The directors do not consider there to be a material difference in the fair value of the previously held equity interest at the date of change of control on 19 May 2015 and the fair value of the equity interest as at the date of the initial acquisition of the 51% stake in MGC on 7 January 2015 plus the Group’s share of the profits during the interim period.
3. The acquisition of subsidiaries and joint ventures, net of cash acquired of £155.3m included within the consolidated cash flow statement includes £0.3m received in April 2015 relating to final working capital adjustments for Paperny Entertainment acquired during the prior year.

27. BUSINESS COMBINATIONS CONTINUED
Deluxe Pictures (The Mark Gordon Company) On 7 January 2015, the Group acquired a 51% stake in Deluxe Pictures (doing business as The Mark Gordon Company) (MGC). MGC is an
LA-based independent studio that develops and produces premium television and film content for the major US networks and international
distribution, including the production of studio films. Mark Gordon, who founded MGC in 1987, is an award-winning film and television
producer with an outstanding track record of hits. As part of the original acquisition in January 2015, Mark Gordon entered into a new long-
term employment agreement with MGC.
From 7 January 2015 to 18 May 2015 the Group’s interest in MGC was accounted for using the equity method in the consolidated financial
statements. As such £1.0m of acquisition-related costs were capitalised against the carrying value of the investment. For accounting
purposes, the fair value of the common shares issued in the Company was based on 1,082,568 common shares at the fair value of those
equity instruments at the date of exchange.
On 19 May 2015, the Group entered into an amendment to the shareholders agreement in respect of its shareholding in MGC. Under the
amendment, the Company now has control over certain key board and shareholder decisions of MGC, whereas previously all such decisions
were made on a joint control basis between the Company and The Mark Gordon Irrevocable Trust (the holder of the remaining 49%
interest).
As a result of this amendment to the shareholders agreement MGC has been fully consolidated into the Group's consolidated financial
statements as a subsidiary from 19 May 2015 and going forward, a change from the accounting treatment shown in the consolidated financial
statements for year ended 31 March 2015. Following this change and in line with IFRS, the acquisition costs previously recognised have
been written off to the consolidated income statement during the period as a one-off charge.
KEY TERMS
The Group purchased MGC for consideration of £86.3m, comprising £83.0m in cash and £3.3m in Entertainment One Ltd. common shares
all settled during the prior year, on 7 January 2015.
The Group hold an option to purchase the remaining 49% stake in The Mark Gordon Company after an initial seven-year term. The value of
which is to be based upon a commercially negotiated price at the time of purchase. No liability has been recorded within the consolidated
financial statements of the Group, as the decision to exercise the option will be determined by the commercial viability at the time and
therefore the probability of a payment being made is not known at the balance sheet date.
As part of the acquisition, the Group obtained the exclusive worldwide rights to distribute the film and television outputs of the Company.
PROVISIONAL ACQUISITION ACCOUNTING
Acquired intangibles of £47.5m have been identified and represent the value placed on current libraries. The resultant goodwill of £69.2m
represents the value placed on the opportunity to grow the content and formats produced by the company. None of the goodwill is expected
to be deductible for income tax purposes.
The Group has created a new CGU for MGC, being the smallest identifiable Group of assets that generates cash flows that are largely
independent of the cash flows from other groups of assets. Goodwill has been allocated between the MGC and Television CGUs.
The final fair values have been retrospectively adjusted from the provisional amounts disclosed in the Interim Results for the six months
ended 30 September 2015 to reflect new information obtained about facts and circumstances at the acquisition date, primarily being a true up
of income accrued on the opening balance sheet for profit participations received in December 2015.
MGC contributed £14.6m to the Group’s revenue and £5.4m to the Group’s profit before tax for the period from the date of the acquisition
on 19 May 2015 to 31 March 2016 and £3.1 to the Group’s profit before tax for the period from 1 April 2015 to 18 May 2015 whilst
accounted as a joint venture.
Astley Baker Davies Limited On 22 October 2015, the Group acquired a 70% stake in Astley Baker Davies Limited (ABD), which jointly owns the rights to Peppa Pig
with the Group. The Group has led the growth of revenues generated by the exploitation of Peppa Pig through its exclusive worldwide right
to exploit and license others to exploit Peppa Pig in all formats. Existing revenues are generated predominantly through royalties paid by
licensees across a number of categories including toys and clothing, as well as through sales of DVDs and other ancillary revenues. Net
earnings from these revenues were previously shared equally between the Group and ABD.
By virtue of the acquisition, the Group has increased its interest in the related share of earnings from the exploitation of Peppa Pig from 50%
to 85% and as ABD has become a subsidiary of the Company following completion: its financial statements have been fully consolidated
into the Group's consolidated financial statements.
KEY TERMS
The Group purchased a 70% share in ABD for consideration of £140.5m, funded through the net proceeds of a fully underwritten 4 for 9
rights issue with net proceeds of £194.5m. Initial consideration of £140.2m was paid on 22 October 2015, with a further £0.3m paid in
December 2015 representing final working capital adjustments.

27. BUSINESS COMBINATIONS CONTINUED
PROVISIONAL ACQUISITION ACCOUNTING
Acquired intangibles of £161.8m have been identified and represent the value placed on the brand. The resulting goodwill of £47.8m
represents the value placed on the opportunity to grow the content and formats produced by the company. None of the goodwill is expected
to be deductible for income tax purposes.
Acquisition-related costs amounted to £1.4m and have been charged to the consolidated income statement within one-off items (see Note 9
for further details).
ABD’s revenues are generated from royalties generated through the exclusive worldwide distribution agreement held by the eOne Group
which was previously included as a royalty expense in the Group’s consolidated income statement and as a result of the acquisition is now
eliminated upon consolidation of the Group’s consolidated income statement. As a result the acquisition of ABD contributed £nil to the
Group’s revenue but generated cost savings through a reduction in royalty expenses of £8.1m. The resultant contribution to the Group’s
profit before tax for the period from the date of the acquisition on 22 October 2015 to 31 March 2016 is £8.1m.
The acquired ABD business has been integrated into the Family CGU.
Sierra Pictures LLC On 22 December 2015 the Group acquired 51% of the share capital of Sierra Pictures LLC, a leading independent film production and
international sales company which aims to consistently deliver high-quality, commercially viable feature films for a global audience. Led by
Nick Meyer and Marc Schaberg , Sierra Pictures capitalises on the ever-evolving global film marketplace representing sales of third party
films and commercial films designed to appeal to both the North American marketplace as well as top markets globally.
KEY TERMS
The Group purchased a 51% share in Sierra Pictures for initial cash consideration of £9.2m, with contingent consideration payable based
upon performance to 31 March 2016. A liability of £0.2m has been recorded in the consolidated balance sheet representing the consideration
expected to be transferred in the future.
A put and call option has been granted over the remaining 49% share in Sierra Pictures, with the options being exercisable in five years. The
value of the put and call options in five years are dependent on future performance of the business. The Group considers these payments as
capital in nature, and have recorded a non-current other payable amounting to £11.1m (discounted) within the consolidated balance sheet
representing management’s best estimate of future cash outflow, with the debit recorded in equity against non-controlling interest.
PROVISIONAL ACQUISITION ACCOUNTING
Sierra Pictures’ balance sheet included within the consolidated financial statements is based upon provisional information and management’s
best estimate based upon facts and circumstances currently available. Acquired intangibles of £8.4m have been recorded resulting in
goodwill of £5.5m representing the value placed on the opportunity to grow the content and formats produced by the company. All the
goodwill is expected to be tax deductible for income tax purposes. The purchase price allocation exercise has not been finalised and the
identification and recognition of the acquired intangibles and the resultant goodwill have been estimated based upon past experience on
comparable acquisitions.
Acquisition-related costs amounted to £1.0m and have been charged to the consolidated income statement within one-off items (see Note 9
for further details).
Sierra Pictures contributed £20.2m to the Group’s revenue and £1.3m to the Group’s profit before tax for the period from the date of the
acquisition on 22 December 2015 to 31 March 2016. The acquired Sierra’s business has been integrated into the Film CGU.
Dualtone Music Group On 11 January 2016 the Group acquired 100% of the share capital of Dualtone Music Group, Inc. (Dualtone Music) a Nashville-based
independent record label, founded in 2001 by Scott Robinson, specialising in folk, singer/songwriter, Americana and indie rock which has a
catalogue of more than 292 albums, totalling more than 3,500 tracks.
Dualtone Music’s artists have been nominated for sixteen Grammy Awards, with wins for June Carter Cash, Jim Lauderdale and Guy Clark.
In 2012, Dualtone Music released the debut album from the Denver-based band The Lumineers – the album became a worldwide multi-
format hit selling more than 2.5 million albums and 7 million singles. eOne has become the exclusive distributor in North America.
KEY TERMS
The Group purchased 100% of the share capital in Dualtone Music for consideration of £3.5m with contingent consideration payable based
upon adjusted EBITDA performance to 31 December 2017. A liability of £0.6m has been recorded in the consolidated balance sheet
representing the consideration expected to be transferred in the future.
PROVISIONAL ACQUISITION ACCOUNTING
Acquired intangibles of £3.6m were identified, being the value placed on the company’s catalogue, resulting in goodwill of £1.9m which
represents the value placed on the opportunity to grow the content produced by the company. None of the goodwill is expected to be
deductible for income tax purposes.
Acquisition-related costs amounted to £0.2m and have been charged to the consolidated income statement within one-off items (see Note 9
for further details).

27. BUSINESS COMBINATIONS CONTINUED
Dualtone Music contributed £1.2m to the Group’s revenue and £0.2m to the Group’s profit before tax for the period from the date of the
acquisition on 11 January 2016 to 31 March 2016. The acquired Dualtone Music business has been integrated into the Television CGU.
Last Gang Entertainment On 7 March 2016, the Group acquired 100% of the share capital of Last Gang Management Inc. and Last Gang Publishing Inc., collectively
Last Gang Entertainment.
Established in 2003, Last Gang Entertainment is an independent recording, publishing and artist management company whose record label
roster includes Canadian alternative rock artists including Metric, Crystal Castles, Death From Above 1979 and MSTRKRFT among others,
and management clients Lights and Arkells. Last Gang Entertainment has sold over 2 million albums worldwide.
Last Gang Entertainment head Chris Taylor was appointed to the role of President, Entertainment One Music. Mr Taylor, whose legal
practice included recording artists such as Drake, Nelly Furtado and Avril Lavigne, brings more than 25 years of wide-ranging music
industry experience to eOne. In his new role, he will oversee music operations globally and will lead strategic growth initiatives across music
licensing, publishing, label and distribution. Last Gang Entertainment will continue to operate as a label of eOne.
KEY TERMS
The Group purchased 100% of the share capital in Last Gang Entertainment for cash consideration of £1.1m with contingent consideration
payable based upon adjusted EBITDA performance to 31 March 2018. A liability of £1.0m has been recorded in the consolidated balance
sheet representing the consideration expected to be transferred in the future. The contingent consideration can be settled, at the option of the
Group, in cash or shares of Entertainment One Ltd.
PROVISIONAL ACQUISITION ACCOUNTING
Acquired intangibles of £1.8m were identified representing the value placed on the company’s library. The resulting goodwill of £0.8m
represents the value placed on the opportunity to grow the content produced by the company. None of the goodwill is expected to be
deductible for income tax purposes.
Acquisition-related costs amounted to £0.2m and have been charged to the consolidated income statement within one-off items (see Note 9
for further details).
Last Gang Entertainment contributed £0.1m to the Group’s revenue and less than £0.1m to the Group’s profit before tax for the period from
the date of the acquisition on 7 March 2016 to 31 March 2016. The acquired Last Gang Entertainment business has been integrated into the
Television CGU.
Renegade 83 On 24 March 2016 the Group acquired a 65% controlling stake in Renegade Entertainment, LLC (Renegade 83), a reality television
production company. Based in Los Angeles, Renegade 83 was founded in 1994 by David Garfinkle and Jay Renfroe, and has gone on to
become a fast-growing and successful non-scripted television production company delivering multiple hit shows including Naked & Afraid,
Naked & Afraid XL, Fit to Fat, The 4400, The Kennedy Detail and Blind Date.
David Garfinkle and Jay Renfroe will continue to lead Renegade 83 and, as part of the transaction have entered into new, long-term
employment contracts. In addition, eOne has also entered into a distribution agreement with Renegade 83, which will provide the Group with
access to high quality, non-scripted programming for exploitation globally.
KEY TERMS
The Group acquired a 65% controlling stake in Renegade 83 for cash consideration of £15.9m with contingent consideration payable based
upon adjusted EBITDA performance to 31 December 2016. A liability of £7.4m has been recorded in the consolidated balance sheet
representing the consideration expected to be transferred in the future. The contingent consideration can be settled, at the option of the Group,
in cash or in a combination of 60% of such amount in cash and 40% in shares of Entertainment One Ltd.
Additionally, a put and call option has been granted over the remaining 35% share of Renegade 83, with the options both being exercisable
in five years. The value of the put and call options in five years are dependent on future performance of the business. The Group considers
these payments as capital in nature, and have recorded a non-current other liability amounting to £19.8m (discounted) within the
consolidated balance sheet with the debit recorded in equity against non-controlling interest.
PROVISIONAL ACQUISITION ACCOUNTING
Renegade 83’s opening balance sheet included within the consolidated financial statements is based upon provisional information and the
management’s best estimate based upon facts and circumstances currently available. Intangibles assets of £15.6m have been recorded
resulting in goodwill of £12.6m representing the value placed on the opportunity to grow the content and formats produced by the company.
All the goodwill is expected to be tax deductible for income tax purposes. The purchase price allocation exercise has not been finalised and
the identification and recognition of the acquired intangibles and the resultant goodwill have been estimated based upon past experience on
comparable acquisitions.
Renegade 83 contributed less than £0.1m to the Group’s revenue and less than £0.1m to the Group’s profit before tax for the period from the
date of the acquisition on 24 March 2016 to 31 March 2016.
The acquired Renegade 83 business has been integrated into the Television CGU.

27. BUSINESS COMBINATIONS CONTINUED
Other disclosures in respect of business combinations If the acquisitions of MGC, ABD, Sierra Pictures, Dualtone Music Group, Last Gang Entertainment and Renegade 83 had all been
completed on 1 April 2015, Group revenue for the year ended 31 March 2016 would have been £853.3m and Group adjusted EBITDA
would have been £136.6m.
YEAR ENDED 31 MARCH 2015
The following table summarises the fair values, as at the acquisition date, of the assets acquired, the liabilities assumed and the total
consideration transferred as part of this acquisition. Information provided below is calculated based on current information available.
Phase 4 Films Paperny Force Four Total
Property, plant and equipment 0.1 0.6 0.2 0.9
Inventories 3.4 - - 3.4
Investment in productions - 4.6 1.2 5.8
Investment in acquired content rights 3.5 - - 3.5
Trade and other receivables 9.1 4.0 4.0 17.1
Cash and cash equivalents 1.1 3.8 0.5 5.4
Interest-bearing loans and borrowings (3.7) (2.8) (2.2) (8.7)
Trade and other payables (15.6) (8.5) (2.6) (26.7)
Current tax assets/(liabilities) 0.6 (2.5) 0.3 (1.6)
(1.5) (0.8) 1.4 (0.9)
Acquired intangibles 6.0 8.1 2.7 16.8
Deferred tax liabilities (1.8) (2.1) (0.7) (4.6)
Total net assets acquired 2.7 5.2 3.4 11.3
Goodwill 9.2 9.9 2.6 21.7
Net assets acquired 11.9 15.1 6.0 33.0
Satisfied by:
Cash 7.2 6.3 2.3 15.8
Shares in Entertainment One Ltd. 4.3 8.8 3.0 16.1
Contingent consideration 0.4 - 0.7 1.1
Total consideration transferred 11.9 15.1 6.0 33.0
Phase 4 Films On 3 June 2014, the Group acquired 100% of the issued share capital of the Phase 4 Films group of companies (Phase 4) for a total
consideration of £11.9m, comprising £7.2m cash consideration, £0.4m contingent consideration and £4.3m share consideration. For
accounting purposes, the fair value of the common shares issued in the Company was based on 1,412,062 common shares at the fair value of
those equity instruments at the date of exchange. This purchase was accounted for as an acquisition.
Phase 4, a leading independent film and television distributor based in Canada and the US, specialises in the sales, marketing, licensing and
distribution of feature films, television and special-interest content across all media in the North American market. The acquisition provides
incremental scale, growth opportunities and synergies from consolidation for the Group's Film Division.
For the reasons outlined above, combined with the ability to hire the workforce of Phase 4, including the management team, the Group paid a
premium on the acquisition, giving rise to goodwill. None of the goodwill is expected to be deductible for income tax purposes.
Contingent consideration represented post-acquisition tax receipts that were received by Phase 4 which, under the terms of the transaction,
were payable to the vendors of Phase 4. This amount was settled in October 2014. Acquisition-related costs amounted to £0.5m and were
charged to the consolidated income statement within one-off items in the prior year (see Note 9 for further details).
Phase 4 contributed £30.0m to the Group’s revenue and £1.4m to the Group’s profit before tax for the period from the date of the acquisition
to 31 March 2015. The acquired Phase 4 business has been integrated into the Film CGU.
27. BUSINESS COMBINATIONS CONTINUED
Paperny Entertainment On 31 July 2014, the Group acquired 100% of the issued share capital of the Paperny Entertainment group of companies (Paperny) for a total
consideration of £15.1m, comprising £6.3m cash consideration and £8.8m share consideration. For accounting purposes, the fair value of the
common shares issued in the Company was based on 2,571,803 common shares at the fair value of those equity instruments at the date of
exchange. This purchase was accounted for as an acquisition.
Paperny, a leading independent television producer business based in Canada and the US, specialises in the development and production of
non-scripted television programming, including a range of character-driven documentaries, reality shows and comedies. In line with the
Group’s strategy of growing and diversifying its content rights portfolio, the acquisition expands the Group's non-scripted and factual
production slate, helping to supplement the Group's already diverse, multi-genre television production capabilities. The transaction also
provides a platform for further Group initiatives within non-scripted television programming across the North American market.
For the reasons outlined above, combined with the ability to hire the workforce of Paperny, including the management team, the Group paid
a premium on the acquisition, giving rise to goodwill. None of the goodwill is expected to be deductible for income tax purposes.
Acquisition-related costs amounted to £0.6m and were charged to the consolidated income statement within one-off items in the prior year
(see Note 9 for further details).
Paperny contributed £11.4m to the Group’s revenue and £1.6m to the Group’s profit before tax for the period from the date of the acquisition
to 31 March 2015. The acquired Paperny business has been integrated into the Television CGU.
Force Four Entertainment On 28 August 2014, the Group acquired 100% of the issued share capital of the Force Four Entertainment group of companies (Force Four)
for total consideration of £6.0m, comprising £2.3m cash consideration, £0.7m contingent consideration and £3.0m share consideration. For
accounting purposes, the fair value of the common shares issued in the Company was based on 886,277 common shares at the fair value of
those equity instruments at the date of exchange. This purchase was accounted for as an acquisition.
Force Four is one of Canada’s most successful and respected independent television production companies. Its television programmes
include lifestyle, reality and scripted programming that have sold and aired globally. This acquisition strengthens the Group’s activity in
scripted and non-scripted television and further enhances the Group’s international sales offering.
For the reasons outlined above, combined with the ability to hire the workforce of Force Four, including the management team, the Group
paid a premium on the acquisition, giving rise to goodwill. None of the goodwill is expected to be deductible for income tax purposes.
Contingent consideration represented an estimate of post-acquisition tax receipts that are receivable by the production companies of Force
Four post acquisition which, under the terms of the transaction, are payable to the vendors of Force Four. The amount recognised is the
maximum amount payable.
Acquisition-related costs amounted to £0.2m and were charged to the consolidated income statement within one-off items in the prior year
(see Note 9 for further details).
Force Four contributed £2.0m to the Group’s revenue and recorded a loss before tax for the period from the date of the acquisition to 31
March 2015 of £0.2m. The acquired Force Four business has been integrated into the Television CGU.
Other disclosures in respect of business combinations If the acquisitions of Phase 4, Paperny and Force Four had all been completed on 1 April 2014, Group revenue for the year ended 31 March
2015 would have been £793.5m and Group profit before tax would have been £44.4m.
JOINT VENTURE ACQUISITIONS
On 28 May 2014, the Group acquired 50% of the share capital of Secret Location, a Canadian digital agency, for cash consideration of
£2.5m.

28. SUBSIDIARIES
The Group’s principal subsidiary undertakings are as follows:
Name Country of incorporation Principal activity
Entertainment One Films Canada Inc. Canada Content ownership and distribution
Entertainment One Limited Partnership Canada Content ownership and distribution
Entertainment One Television International Ltd. Canada
Sales and distribution of films and television
programmes
Entertainment One Television Productions Ltd. Canada Production of television programmes
Videoglobe 1 Inc. Canada Content distribution
Entertainment One UK Limited England and Wales Content ownership
Alliance Films (UK) Limited England and Wales Content ownership
Entertainment One UK Holdings Limited England and Wales Holding company
Entertainment One US LP US Content ownership and distribution
Entertainment One Television USA Inc. US
Sales and distribution of films and television
programmes
All of the above subsidiary undertakings are 100% owned and are owned through intermediate holding companies. The proportion held is
equivalent to the percentage of voting rights held.
All of the above subsidiary undertakings have been consolidated in the consolidated financial statements under the acquisition method of
accounting.
29. INTERESTS IN JOINT VENTURES
Details of the Group’s joint ventures at 31 March 2016 are as follows:
Name Country of incorporation Proportion held Principal activity
Secret Location Inc. Canada 50% Film and television distribution
Suite Distribution Ltd England and Wales 50% Production of films
Squid Distribution LLC US 50% Production of films
Automatik Entertainment LLC US 40% Film development
The Girlaxy LLC US 50% Content ownership and distribution
LVK Distribution Limited England and Wales 50% Dormant company
Eat St. Digital Inc Canada 50% Production of television programmes
Creative England-Entertainment One Global
Television Initiative Limited England and Wales 50% Development of television shows
Contractual arrangements establish joint control over each joint venture listed above. No single venturer is in a position to control the
activity unilaterally.
The movements in the carrying amount of interests in joint ventures in the years ended 31 March 2016 and 2015 were as follows:
31 March 2016 31 March 2015
MGC
£m Other
£m MGC
£m Other
£m
Carrying amount of interests in joint ventures at 1 April 2015 87.8 3.2 - 1.2
Acquisition of joint ventures - - 86.3 2.5
Transfer from joint venture to fully consolidated subsidiary1 (89.9) - - -
Acquisition related costs (1.0) - 1.0 -
Group’s share of results of joint ventures for the period 2 3.1 0.3 0.5 (0.3)
Dividends received from joint ventures - (0.2) - (0.3)
Foreign exchange - (0.1) - 0.1
Carrying amount of interests in joint ventures at 31 March 2016 - 3.2 87.8 3.2
1. The acquisition of joint ventures for the year ended 31 March 2016 relate to the carrying value of equity in MGC on amendment of the accounting treatment on 19 May 2015 to fully consolidate MGC into the Group’s consolidated financial statements. See Note 27 for further details.
2. The Group’s share of results of joint ventures for the period of £3.4m (2015: £0.2m) includes a charge of £1.6m relating to the Group’s share of tax, finance costs and depreciation (2015: £0.1m credit).

29. INTERESTS IN JOINT VENTURES CONTINUED
The following presents, on a condensed basis, the effects of including joint ventures in the consolidated financial statements using the equity
method. Each joint venture in the other category is considered individually immaterial to the Group’s consolidated financial statements.
MGC
£m Other
£m
Total
Year ended 31 March
2016 £m
MGC £m
Other £m
Total
Year ended 31 March
2015 £m
Revenue 9.3 5.0 14.3 1.8 13.1 14.9
Profit/(loss) for the year 6.2 0.6 6.8 1.0 (0.7) 0.3
Profit/(loss) attributable to the Group 3.1 0.3 3.4 0.5 (0.3) 0.2
Dividends received from interests in joint ventures - 0.2 0.2 - 0.3 0.3
As a result of the amendment to the shareholders agreement, MGC has been fully consolidated into the Group's consolidated financial
statements as a subsidiary from 19 May 2015 and going forward, and as a result MGC is not presented in the table below.
31 March 2016
£m 31 March 2015
£m
Non-current assets 1.5 2.5
Current assets (including £0.2m (2015: £0.6m) of cash and cash equivalents) 6.9 7.7
Non-current liabilities - (0.2)
Current liabilities (5.8) (7.2)
Net assets of other joint ventures 2.6 2.8
30. INTERESTS IN PARTLY-OWNED SUBSIDIARIES
The Group’s principal subsidiaries that have non-controlling interests are provided below:
Name Country of incorporation Proportion held Principal activity
Astley Baker Davies Limited England and Wales 70% Ownership of IP
Deluxe Pictures (dba The Mark Gordon Company) US 51% Production of films and television programmes
Renegade Entertainment, LLC Canada 65% Production of television programmes
Sierra Pictures group companies
Sierra Pictures, LLC US 51% Production and international sales of films
999 Holdings, LLC US 51% Production of films
999 NY Productions, Corp US 51% Production of films
999 Productions, LLC US 51% Production of films
Blunderer Holdings, LLC US 51% Production of films
Blunderer NY Productions, Corp US 51% Production of films
Blunderer Productions, LLC US 51% Production of films
Coldest City Productions, LLC US 51% Production of films
Coldest City, LLC US 51% Production of films
LCOZ Holdings, LLC US 51% Production of films
LCOZ NY Productions, Corp. US 51% Production of films
LCOZ Productions Limited England and Wales 51% Production of films
Osprey Distribution, LLC US 51% Production of films
PPZ Holdings, LLC US 51% Production of films
PPZ NY Productions, Corp US 51% Production of films
PPZ Productions Canada Ltd. Canada 51% Production of films
PPZ Productions Ltd England and Wales 51% Production of films
Sierra Pictures Development, LLC US 51% Production of films
Sierra/Engine Television LLC US 51% Production of films
Sierra Licensing Inc. US 51% Ownership of IP

30. INTERESTS IN PARTLY-OWNED SUBSIDIARIES CONTINUED Name Country of incorporation Proportion held Principal activity
Television production companies
Westventures IV Productions Ltd * Canada 50% Production of television programmes
She-Wolf Season 1 Productions Inc * Canada 51% Production of television programmes
She-Wolf Season 2 Productions Inc * Canada 51% Production of television programmes
She-Wolf Season 3 Productions Inc * Canada 51% Production of television programmes
JCardinal Productions Inc * Canada 50% Production of television programmes
Oasis Shaftesbury Releasing Inc * Canada 50% Production of television programmes
Bon Productions (NS) Inc * Canada 49% Production of television programmes
Da Vinci Releasing Inc * Canada 49% Production of television programmes
Hope Zee One Inc * Canada 49% Production of television programmes
Hope Zee Two Inc * Canada 49% Production of television programmes
HOW S3 Productions Inc * Canada 49% Production of television programmes
Klondike Alberta Productions Inc * Canada 49% Production of television programmes
Leilah & Jen MB Productions Inc * Canada 49% Production of television programmes
Persuasion Productions Inc * Canada 49% Production of television programmes
Amaze Film + Televisions Inc * Canada 33% Production of television programmes
iThentic Canada Inc * Canada 33% Production of television programmes
K9 Productions Inc * Canada 30% Production of television programmes
FD Media 2 Inc. * Canada 50% Production of television programmes
FD Media Inc. * Canada 50% Production of television programmes
The Shopping Bags Media Inc * Canada 50% Production of television programmes
Seedling Productions 2 Inc * Canada 49% Production of television programmes
Union Station Media LLC * US 50% Production of television programmes
* These production companies within the Television Division have been classified as fully consolidated subsidiaries based on an assessment
that, under IFRS 10, the Group has power and control over the activities of the companies. Through these companies, the Group produces or
co-produces television programmes. These production companies are structured in such a way that the Group retains the risks and rewards of
ownership and has the ability to vary the return it receives from the production company. At the end of the co-production, the production
company has zero or minimal net income and zero or minimal tax and other obligations. As such the directors do not consider the production
companies to have a material effect on the consolidated financial statements. The impact of the non-controlling interests on the consolidated
income statement for the year ended 31 March 2016 for these entities is a £0.2m loss (31 March 2015: £0.5m loss).
The following presents, on a condensed basis, the effects of including other partly-owned subsidiaries in the consolidated financial
statements:
Astley Baker Davies Limited
£m
The Mark Gordon
Company
£m Sierra Pictures
£m
Renegade 83
£m
Revenue 12.8 14.6 20.2 -
Profit for the period from acquisition to 31 March 2016 6.5 2.9 1.3 -
Profit attributable to the Group 4.5 1.5 0.7 -
Dividends paid to non-controlling interests 0.8 - - -
Non-current assets 157.1 55.3 43.6 30.0
Current assets 10.2 15.7 16.8 2.6
Non-current liabilities (28.8) (19.3) - -
Current liabilities (2.2) (4.3) (51.5) (16.3)
Net assets of partly owned subsidiaries 136.3 47.4 8.9 16.3
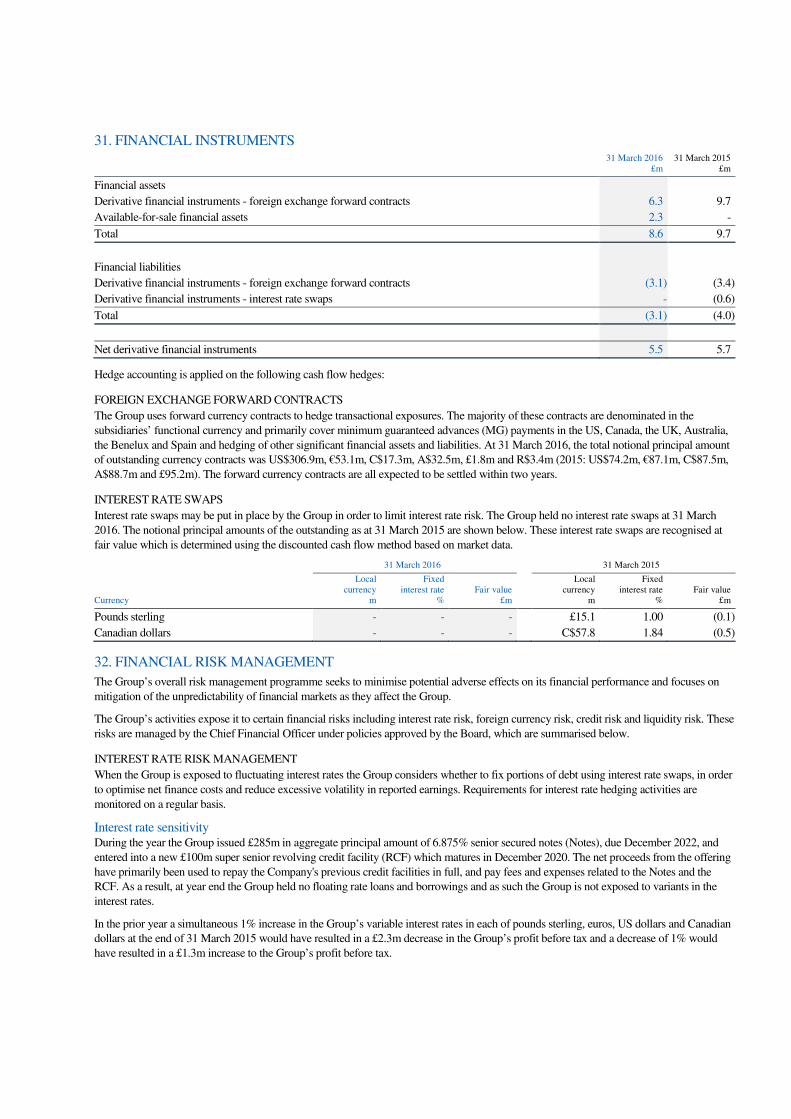
31. FINANCIAL INSTRUMENTS
31 March 2016
£m 31 March 2015
£m
Financial assets
Derivative financial instruments - foreign exchange forward contracts 6.3 9.7
Available-for-sale financial assets 2.3 -
Total 8.6 9.7
Financial liabilities
Derivative financial instruments - foreign exchange forward contracts (3.1) (3.4)
Derivative financial instruments - interest rate swaps - (0.6)
Total (3.1) (4.0)
Net derivative financial instruments 5.5 5.7
Hedge accounting is applied on the following cash flow hedges:
FOREIGN EXCHANGE FORWARD CONTRACTS
The Group uses forward currency contracts to hedge transactional exposures. The majority of these contracts are denominated in the
subsidiaries’ functional currency and primarily cover minimum guaranteed advances (MG) payments in the US, Canada, the UK, Australia,
the Benelux and Spain and hedging of other significant financial assets and liabilities. At 31 March 2016, the total notional principal amount
of outstanding currency contracts was US$306.9m, €53.1m, C$17.3m, A$32.5m, £1.8m and R$3.4m (2015: US$74.2m, €87.1m, C$87.5m,
A$88.7m and £95.2m). The forward currency contracts are all expected to be settled within two years.
INTEREST RATE SWAPS
Interest rate swaps may be put in place by the Group in order to limit interest rate risk. The Group held no interest rate swaps at 31 March
2016. The notional principal amounts of the outstanding as at 31 March 2015 are shown below. These interest rate swaps are recognised at
fair value which is determined using the discounted cash flow method based on market data.
31 March 2016 31 March 2015
Currency
Local currency
m
Fixed interest rate
% Fair value
£m
Local currency
m
Fixed interest rate
% Fair value
£m
Pounds sterling - - - £15.1 1.00 (0.1)
Canadian dollars - - - C$57.8 1.84 (0.5)
32. FINANCIAL RISK MANAGEMENT
The Group’s overall risk management programme seeks to minimise potential adverse effects on its financial performance and focuses on
mitigation of the unpredictability of financial markets as they affect the Group.
The Group’s activities expose it to certain financial risks including interest rate risk, foreign currency risk, credit risk and liquidity risk. These
risks are managed by the Chief Financial Officer under policies approved by the Board, which are summarised below.
INTEREST RATE RISK MANAGEMENT
When the Group is exposed to fluctuating interest rates the Group considers whether to fix portions of debt using interest rate swaps, in order
to optimise net finance costs and reduce excessive volatility in reported earnings. Requirements for interest rate hedging activities are
monitored on a regular basis.
Interest rate sensitivity During the year the Group issued £285m in aggregate principal amount of 6.875% senior secured notes (Notes), due December 2022, and
entered into a new £100m super senior revolving credit facility (RCF) which matures in December 2020. The net proceeds from the offering
have primarily been used to repay the Company's previous credit facilities in full, and pay fees and expenses related to the Notes and the
RCF. As a result, at year end the Group held no floating rate loans and borrowings and as such the Group is not exposed to variants in the
interest rates.
In the prior year a simultaneous 1% increase in the Group’s variable interest rates in each of pounds sterling, euros, US dollars and Canadian
dollars at the end of 31 March 2015 would have resulted in a £2.3m decrease in the Group’s profit before tax and a decrease of 1% would
have resulted in a £1.3m increase to the Group’s profit before tax.

32. FINANCIAL RISK MANAGEMENT CONTINUED
FOREIGN CURRENCY RISK MANAGEMENT
The Group is exposed to exchange rate fluctuations because it undertakes transactions denominated in foreign currency and it is exposed to
foreign currency translation risk through its investment in overseas subsidiaries.
The Group manages transaction foreign exchange exposures by undertaking foreign currency hedging using forward foreign exchange
contracts for significant transactions (principally MG payments). The implementation of these forward contracts is based on highly probable
forecast transactions and qualifies for cash flow hedge accounting. The Group further manages it exposure to fair value movements on
foreign currency assets and liabilities through using forward foreign exchange contracts for significant exposures. Further detail is disclosed
in Note 31.
The majority of the Group’s operations are domestic within their country of operation. The Group seeks to create a natural hedge of this
exposure through its policy of aligning approximately the currency composition of its net borrowings with its forecast operating cash flows.
Foreign exchange rate sensitivity The following table illustrates the Group’s sensitivity to foreign exchange rates on its derivative financial instruments. Sensitivity is
calculated on financial instruments at 31 March 2016 denominated in non-functional currencies for all operating units within the Group. The
sensitivity analysis includes only outstanding foreign currency denominated monetary items including external loans. The percentage
movement applied to each currency is based on management’s measurement of foreign exchange rate risk.
Percentage movement
31 March 2016 Impact on
consolidated income
statement +/- £m
31 March 2015 Impact on
consolidated income
statement +/- £m
10% appreciation of the US dollar 0.8 (0.3)
10% appreciation of the Canadian dollar (0.9) -
10% appreciation of the euro 1.2 1.0
10% appreciation of the Australian dollar 0.9 0.6
CREDIT RISK MANAGEMENT
Credit risk arises from cash and cash equivalents, deposits with banks and financial institutions, as well as credit exposures to customers,
including outstanding receivables and committed transactions. The Group manages credit risk on cash and deposits by entering into financial
instruments only with highly credit-rated, authorised counterparties which are reviewed and approved regularly by management.
Counterparties’ positions are monitored on a regular basis to ensure that they are within the approved limits and there are no significant
concentrations of credit risk. Trade receivables consist of a large number of customers spread across diverse geographical areas. Ongoing
credit evaluation is performed on the financial condition of counterparties.
As at 31 March 2016 the Group had three (2015: five) customers that owed the Group more than 5% of the Groups total amounts receivables
which accounting for approximately 30% (2015: 40%) of the total amounts receivable.
The Group considers its maximum exposure to credit risk as follows:
Note 31 March 2016
£m 31 March 2015
£m
Cash and cash equivalents 22 108.3 71.3
Net trade receivables 21 176.1 151.2
Total 284.4 222.5
LIQUIDITY RISK MANAGEMENT
The Group maintains an appropriate liquidity risk management position by having sufficient cash and availability of funding through an
adequate amount of committed credit facilities. Management continuously monitors rolling forecasts of the Group’s liquidity reserve on the
basis of expected cash flows in the short, medium and long-term. At 31 March 2016, the undrawn committed borrowings under the RCF was
£106.1m (2015: £63.7m). The facility was entered into in December 2015 (see Note 23) and matures in 2020.

32. FINANCIAL RISK MANAGEMENT CONTINUED
Analysis of the maturity profile of the Group’s financial liabilities including interest payments, which will be settled on a net basis at the
balance sheet date, is shown below:
Amount due for settlement at 31 March 2016
Trade and other
payables £m
Interest-bearing
loans and borrowings1
£m
Production financing
£m Total
£m
Within one year 134.3 19.6 98.0 251.9
One to two years 19.5 19.6 33.6 72.7
Two to five years - 58.8 - 58.8
After five years - 324.2 - 324.2
Total 153.8 422.2 131.6 707.6
Amount due for settlement at 31 March 2015
Within one year 100.2 34.3 69.7 204.2
One to two years - 13.9 47.2 61.1
Two to five years 9.7 267.8 - 277.5
Total 109.9 316.0 116.9 542.8
1. Amounts for interest-bearing loans and borrowings include interest payments.
CAPITAL RISK MANAGEMENT
The Group’s objectives when managing capital are to safeguard its ability to continue as a going concern in order to grow the business,
provide returns for shareholders, provide benefits for other stakeholders and optimise the weighted average cost of capital and optimise
efficiencies.
The objectives are subject to maintaining sufficient financial flexibility to undertake its investment plans. There are no externally imposed
capital requirements. The management of the Group’s capital is performed by the Board. In order to maintain or adjust the capital structure,
the Group may issue new shares or sell assets to reduce debt.
FINANCIAL INSTRUMENTS AT FAIR VALUE
Under IFRS, fair value measurements are grouped into the following levels:
Level 1 – Fair value measurements are derived from unadjusted quoted prices in active markets for identical assets or liabilities.
Level 2 – Fair value measurements are derived from inputs, other than quoted prices included within Level 1, that are observable for the
asset or liability, either directly (as prices) or indirectly (derived from prices).
Level 3 – Fair value measurements are derived from valuation techniques that include inputs for the asset or liability that are not based on
observable market data.
At 31 March 2016 the Group had the following derivative financial instrument assets and liabilities grouped into Level 2:
Level 2 31 March 2016
£m 31 March 2015
£m
Derivative financial instrument assets 6.3 9.7
Derivative financial instrument liabilities (3.1) (4.0)
Available-for-sale financial assets 2.3 -
The carrying value of the Group’s derivative financial instruments approximate to their fair value. See Note 31 for further details of the
Group’s derivative financial instruments.
At 31 March 2016 the Group had the following derivative financial instrument assets and liabilities grouped into Level 3:
Level 3 31 March 2016
£m 31 March 2015
£m
Put/call liabilities on partly owned subsidiaries 30.9 -

33. STATED CAPITAL, OWN SHARES AND OTHER RESERVES
STATED CAPITAL Year ended 31 March 2016 Year ended 31 March 2015
Number of shares
‘000 Value
£m
Number of shares
‘000 Value
£m
Balance at 1 April 295,682 305.5 289,165 286.0
Shares issued on exercise of share options 185 - 564 0.1
Shares issued as part-consideration for acquisitions - - 5,953 19.4
Shared issued as part of rights issue 131,476 194.5 - -
Balance at 31 March 427,343 500.0 295,682 305.5
At 31 March 2016 and 31 March 2015 the Company had common shares only.
On 20 October 2015, to fund the acquisition (and associated acquisition costs) of Astley Baker Davies Limited (see Note 27), the Group
completed a fully underwritten 4 for 9 rights issue of 131,476,173 new common shares at 153.0 pence per new common share. Net of
expenses, the total amount raised was £194.5m. The fees in relation to the equity raise of £6.7m have been capitalised to Equity.
During the year ended 31 March 2016, 185,044 common shares (2015: 564,579) were issued to employees (or former employees) exercising
share options granted under the Executive Share Plan (see Note 34). The total consideration received by the Company on the exercise of
these options was less than £0.1m (2015: less than £0.1m).
During the year ended 31 March 2015, a total of 5,952,710 common shares (equivalent to £19.4m) were issued as part-consideration for
three acquisitions of subsidiaries and the acquisition of the interest in The Mark Gordon Company made during the year. Further details of
these acquisitions are set out in Note 27.
In total, the net proceeds received by the Company during the year on the issue of new common shares was £194.5m (2015: less than
£0.1m).
Subsequent to these transactions, and at the date of authorisation of these consolidated financial statements, the Company’s stated capital
comprised 427,343,162 common shares (2015: 295,681,945).
OWN SHARES
At 31 March 2016, 3,463,706 common shares (2015: 3,463,706 common shares) were held as own shares by the Employee Benefit Trust
(EBT) to satisfy the exercise of future options under the Group’s share option schemes (see Note 34 for further details). The book value of
own shares at 31 March 2016 was £3.6m (2015: £3.6m).
OTHER RESERVES
Other reserves comprise the following:
– a cash flow hedging reserve at 31 March 2016 of credit balance £1.4m (2015: credit balance of £4.4m).
– a permanent restructuring reserve of £9.3m at 31 March 2016 and 2015 which arose on completion of the Scheme of Arrangement
in 2010 and represents the difference between the net assets and share capital and share premium in the ultimate parent company
immediately prior to the Scheme.
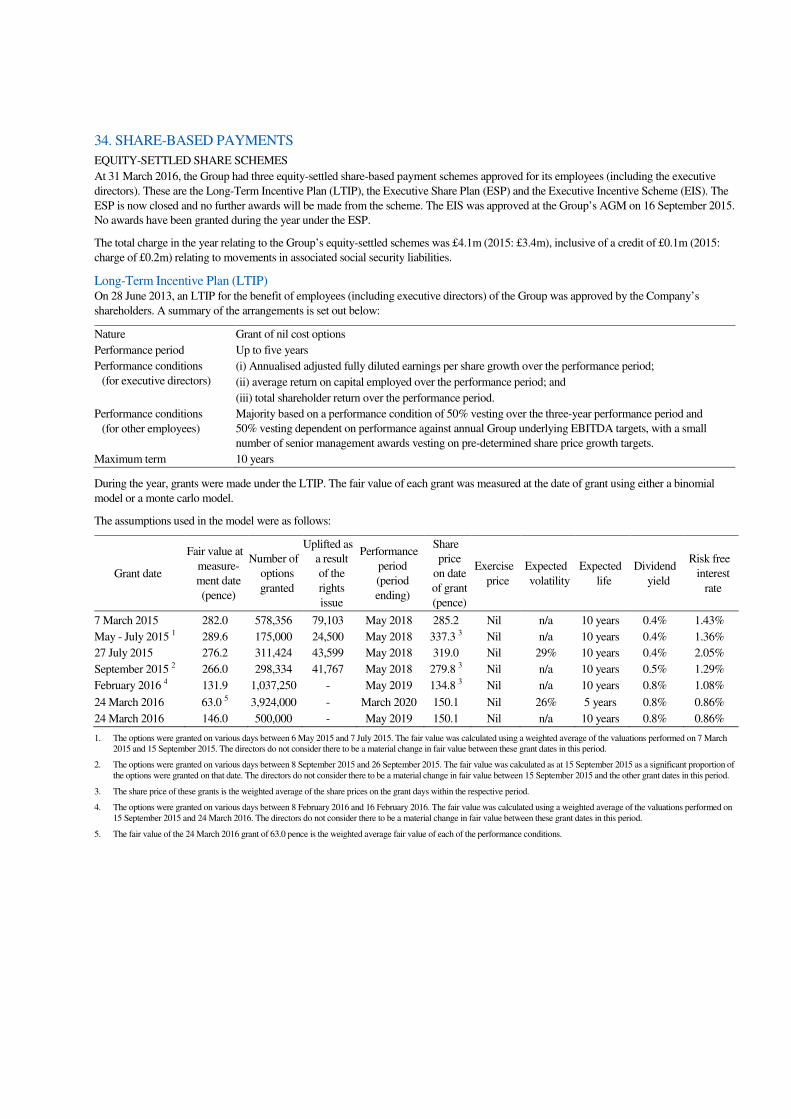
34. SHARE-BASED PAYMENTS
EQUITY-SETTLED SHARE SCHEMES
At 31 March 2016, the Group had three equity-settled share-based payment schemes approved for its employees (including the executive
directors). These are the Long-Term Incentive Plan (LTIP), the Executive Share Plan (ESP) and the Executive Incentive Scheme (EIS). The
ESP is now closed and no further awards will be made from the scheme. The EIS was approved at the Group’s AGM on 16 September 2015.
No awards have been granted during the year under the ESP.
The total charge in the year relating to the Group’s equity-settled schemes was £4.1m (2015: £3.4m), inclusive of a credit of £0.1m (2015:
charge of £0.2m) relating to movements in associated social security liabilities.
Long-Term Incentive Plan (LTIP) On 28 June 2013, an LTIP for the benefit of employees (including executive directors) of the Group was approved by the Company’s
shareholders. A summary of the arrangements is set out below:
Nature Grant of nil cost options
Performance period Up to five years
Performance conditions
(for executive directors)
(i) Annualised adjusted fully diluted earnings per share growth over the performance period;
(ii) average return on capital employed over the performance period; and
(iii) total shareholder return over the performance period.
Performance conditions
(for other employees)
Majority based on a performance condition of 50% vesting over the three-year performance period and
50% vesting dependent on performance against annual Group underlying EBITDA targets, with a small
number of senior management awards vesting on pre-determined share price growth targets.
Maximum term 10 years
During the year, grants were made under the LTIP. The fair value of each grant was measured at the date of grant using either a binomial
model or a monte carlo model.
The assumptions used in the model were as follows:
Grant date
Fair value at
measure-
ment date
(pence)
Number of
options
granted
Uplifted as
a result
of the
rights
issue
Performance
period
(period
ending)
Share
price
on date
of grant
(pence)
Exercise
price
Expected
volatility
Expected
life
Dividend
yield
Risk free
interest
rate
7 March 2015 282.0 578,356 79,103 May 2018 285.2 Nil n/a 10 years 0.4% 1.43%
May - July 2015 1 289.6 175,000 24,500 May 2018 337.3 3 Nil n/a 10 years 0.4% 1.36%
27 July 2015 276.2 311,424 43,599 May 2018 319.0 Nil 29% 10 years 0.4% 2.05%
September 2015 2 266.0 298,334 41,767 May 2018 279.8 3 Nil n/a 10 years 0.5% 1.29%
February 2016 4 131.9 1,037,250 - May 2019 134.8 3 Nil n/a 10 years 0.8% 1.08%
24 March 2016 63.0 5 3,924,000 - March 2020 150.1 Nil 26% 5 years 0.8% 0.86%
24 March 2016 146.0 500,000 - May 2019 150.1 Nil n/a 10 years 0.8% 0.86%
1. The options were granted on various days between 6 May 2015 and 7 July 2015. The fair value was calculated using a weighted average of the valuations performed on 7 March 2015 and 15 September 2015. The directors do not consider there to be a material change in fair value between these grant dates in this period.
2. The options were granted on various days between 8 September 2015 and 26 September 2015. The fair value was calculated as at 15 September 2015 as a significant proportion of the options were granted on that date. The directors do not consider there to be a material change in fair value between 15 September 2015 and the other grant dates in this period.
3. The share price of these grants is the weighted average of the share prices on the grant days within the respective period.
4. The options were granted on various days between 8 February 2016 and 16 February 2016. The fair value was calculated using a weighted average of the valuations performed on 15 September 2015 and 24 March 2016. The directors do not consider there to be a material change in fair value between these grant dates in this period.
5. The fair value of the 24 March 2016 grant of 63.0 pence is the weighted average fair value of each of the performance conditions.

34. SHARE-BASED PAYMENTS CONTINUED
The expected volatility is based on the Company’s share price from the period since trading first began, adjusted where appropriate for
unusual volatility. Actual future dividend yields may be different from the assumptions made in the above valuations. Details of share
options granted and outstanding at the end of the year are as follows:
2016 Number Million
2016 Weighted
average exercise price
Pence
2015 Number Million
2016 Weighted
average exercise price
Pence
Outstanding at 1 April 4.0 - 2.8 -
Exercised - - (0.2) -
Granted 6.8 - 1.8 -
Granted (rights issue uplift) 0.8 - - -
Forfeited (0.2) - (0.1) -
Lapsed - - (0.3) -
Outstanding at 31 March 11.4 - 4.0 -
Exercisable - - - -
The weighted average contractual life remaining of the LTIP options in existence at the end of the year was 7.4 years (2015: 9.0 years).
Executive Share Plan (ESP) A summary of the arrangements is set out below:
Nature Grant of options, generally with an exercise price of C$0.01
Performance period Three years
Performance conditions Majority based on a performance condition of 50% vesting over the three year service period and 50% vesting
dependent on performance against annual Group underlying EBITDA targets.
Maximum term Five years
Details of share options exercised, lapsed and outstanding at the end of the year are as follows:
2016 Number Million
2016 Weighted
average exercise price
Pence
2015 Number Million
2015 Weighted
average exercise price
Pence
Outstanding at 1 April 0.2 0.5 0.6 0.5
Exercised (0.2) 0.5 (0.4) 0.5
Outstanding at 31 March - - 0.2 0.5
Exercisable - - 0.2 0.5
35. COMMITMENT AND CONTINGENCIES
OPERATING LEASE COMMITMENTS
The Group operates from properties in respect of which commercial operating leases have been entered into.
At the balance sheet date, the Group had outstanding commitments for future minimum lease payments under non-cancellable operating
leases, which fall due as follows:
31 March 2016
£m 31 March 2015
£m
Within one year 10.2 8.6
Later than one year and less than five years 21.9 20.7
After five years 29.0 21.2
Total 61.1 50.5
FUTURE COMMITMENTS
31 March 2016
£m 31 March 2015
£m
Investment in acquired content rights contracted for but not provided 254.2 218.4

35. COMMITMENT AND CONTINGENCIES CONTINUED
CONTINGENT LIABILITIES
The Group hold an option to purchase the remaining 49% stake in The Mark Gordon Company after an initial seven-year term. The value of
which is to be based upon a commercially negotiated price at the time of purchase. No liability has been recorded within the consolidated
financial statements of the Group, as the decision to exercise the option will be determined by the commercial viability at the time and
therefore the probability of a payment being made is not known at the balance sheet date.
36. RELATED PARTY TRANSACTIONS
Transactions between the Company and its subsidiaries, which are related parties, have been eliminated on consolidation and are not
disclosed in this Note.
James Corsellis who is a partner of Marwyn Capital LLP, partner of Marwyn Investment Management LLP, director of Marwyn Partners
Limited and director of Marwyn Investments Group Limited stepped down from the Board of the Company on 15 July 2015. As a result
these entities are no longer deemed to be related parties of Entertainment One Ltd. as there are no common directors or members.
Marwyn Value Investors L.P. sold their entire holding of common shares in the Company during the year ended 31 March 2016. As at 31
March 2015, 79,424,894 common shares were held, amounting to 26.9% of the issued share capital of the Company. As a result Marwyn
Value Investors L.P. are no longer deemed a related party of Entertainment One Ltd.
During the period from 1 April 2015 to the date Marwyn Capital LLP ceased to be a related party of the Group, the Company paid fees of
less than £0.1m (£0.2m during the year ended 31 March 2015) to Marwyn Capital LLP for corporate finance advisory services. The
agreement under which these services were provided was terminated on 15 July 2015.
Canada Pension Plan Investment Board (CPPIB) held 84,597,069 common shares in the Company at 31 March 2016 (2015: nil), amounting
to 19.8% of the issued share capital of the Company. CPPIB are deemed a related party of Entertainment One Ltd. by virtue of their
significant shareholding. The Group pays CPPIB an annual fee equivalent to the annual fee paid by the Group to its other non-executive
directors in consideration for CPPIB allowing Scott Lawrence to allocate time to his role as a non-executive director of the Company. The
fee payable to CPPIB in respect of Scott Lawrence's services for the year ended 31 March 2016 was C$22,500.
With the exception of the items noted above, the nature of related parties disclosed in the consolidated financial statements for the Group as
at and for the year ended 31 March 2015 has not changed.