Embed Size (px)
Citation preview

SANDIA REPORT
8
*
SAND97-0805 ● UC-706Unlimited Release
* Printed April 1997
F
Hazards of Falling Debris to People,Aircraft, and Watercraft
J. Kenneth Cole, Larry W. Young, Terry Jordan-Culler
Prepared bySandia National LaboratoriesAlbuquerque, New Mexico &7f85 and Livermore, California 94550 , :. ,
.,’
‘,.,;Sandia is a multiprogtdm #aboratory operated by Sandia Corporation,
,,
a Lockheed Martin Company, for the United States Department of ,,Energy under Contract DE-AC04-94AL85000. ,>,’
“. ,,.,;!
SF2900Q(8-81 )
,
Issued by Sandia National Laboratories, operated for the United StatesDepartment of Energy by Sandia Corporation.NOTICE: This report was prepared as an account of work sponsored by anagency of the United States Government. Neither the United States Govern-ment nor any agency thereof, nor any of their employees, nor any of theircontractors, subcontractors, or their employees, makes any warranty,express or implied, or assumes any legal liability or responsibility for theaccuracy, completeness, or usefulness of any information, apparatus, prod-uct, or process disclosed, or represents that its use would not infringe pri-vately owned rights. Reference herein to any specific commercial product,process, or service by trade name, trademark, manufacturer, or otherwise, doesnot necessarily constitute or imply its endorsement, recommendation,or favoring by the United States Government, any agency thereof, or any oftheir contractors or subcontractors. The views and opinions expressedherein do not necessarily state or reflect those of the United States Govern-ment, any agency thereof, or any of their contractors.
Printed in the United States of America. This report has been reproduceddirectly from the best available copy.
Available to DOE and DOE contractors hornOffice of Scientific and Technical InformationP.O. BOX 62Oak Ridge, TN 37831
Prices available horn (615) 576-8401, FTS 626-8401
Available to the public fromNational Technical Information ServiceU.S. Department of Commerce5285 Port Royal RdSpringfield, VA 22161
NTIS price codesPrinted copy: A03Microfiche copy AOI
.

SAND97-0805Unlimited Release
Printed April 1997
DistributionCategory UC-706
Hazards of Falling Debris toPeople, Aircraft, and Watercraft*
J. Kenneth Cole,Larry W. Young andTerry Jordan-Culler
Aerosciences and CompressibleFluid Mechanics DepartmentSandia National Laboratories
P. O. Box 5800Albuquerque, NM 87185-0825
Abstract
This report is a collection of studies performed at Sandia National Laboratories in support ofPhase One (inert debris) for the Risk And Lethality Commonality Team. This team was created bythe Range Safety Group of the Range Commander’s Council to evaluate the safety issues fordebris generated during flight tests and to develop debris safety criteria that can be adopted by thenational ranges.
Physiological data on the effects of debris impacts on people are presented. Log-normal curvesare developed to relate the impact kinetic energy of fragments to the probability of fatality forpeople exposed in standing, sitting, or prone positions. Debris hazards to aircraft resulting fromengine ingestion or penetration of a structure or windshield are discussed. The smallest massfragments of aluminum, steel, and tungsten that maybe hazardous to current aircraft are defined.Fragment penetration of the deck of a small ship or a pleasure craft is also considered. Thesmallest mass fragments of ahuminum, steel, or tungsten that can penetrate decks are calculated.
* The work described in this report was performed for the White Sands Missile Range under U.S.Army MIPR Nos. W43STM96385AR, W43STM97 127NV, and W43STM97 196AR.
3

Acknowledgments
The authors wish to thank the following people:
Mr. Jerry Haber for clarifying the use of log-normal functions,ACTA maximum likelihood fits of probability of fatality
data, and suggestions which improved the shiphazard section.
Mr. Tom Pfitzer for promoting the log-normal function to describeAPT-Research, Inc. the probability of fatality vs. kinetic energy data.
Dr. Paul Jaramillo for providing information on aircraft constructionAPT-Research, Inc. typical of small business jets.
Mr. Brad Hill for suggestions which improved the description ofMr. Scott Price the log-normal functions and a quick method for
TYBRIN Corporation applying them.
A sub-group of the Risk And Lethality Commonality Team was formed to study the available dataon human impact vulnerability and to recommend how this information should be presented to bereadily used by safety personnel. The members of this sub-group were:
Mike Meehan, White Sands Missile Range,Brad Hill, TYBRIN Corporation,Jerry Esquibel, USAKA/Kwajalein Missile Range,Tom DeLong U. S. Army Space & Strategic Defense CommandKen Cole, Sandia National Laboratories.
4

Table of Contents
1 Introduction .......................................................................................................................8
2 Debris Hazardous To People .............................................................................................9
2.1 Development Of Probability Of Fatality Curves .....................................................9
2.2 Other Studies Of Debris Impacts On People .........................................................l7
3 Debris Hazardous To Aircraft .........................................................................................22
3.1 Fragment Penetration .............................................................................................22
3.2 Fragment Ingestion By An Aircraft Engine ...........................................................25
3.3 Debris Encounter Model ........................................................................................27
3.4 Engine Capture Area ..............................................................................................3O
4 Debris Hazardous To Ships Or Boats .............................................................................33
4.1 FATEPEN2 Penetration Predictions ......................................................................33
4.2 Stanford Equation ..................................................................................................33
5 Summary and Recommendations ...................................................................................36
6 Bibliography ...................................................................................................................37
5

Fig~~~ 2.1
Figure 2.2
Figure 2.3
Figure 2.4
Figure 2.5
Figure 2.6
Figure 2.7
Figure 2.8
Figure 2.9
Figure 2.10
Figure 3.1
Figure 3.2
Figure 3.3
Figure 3,4
Figure 3.5
List of Figures
Kill probability from debris impacts to the head ...................................................lO
Kill probability from debris impacts to the thorax ................................................ 10
Kill probability from debris impacts to the abdomen& limbs .............................. 11
Illustration of region used to define average kinetic energy ..................................12
Probability of fatality from debris impacts to different body parts ....................... 14
Sketch of a standard man .......................................................................................l5
Probability of fatality from debris impacts for different body positions ............... 16
Average probability of fatality from debris impacts .............................................. 17
Probability curves for skin penetration ..................................................................l8
Blunt trauma liver fracture discriminant lines .......................................................l8
Typical construction of an aerodynamic structure for a light aircraft ....................25
Simple model of space through which debris falls ................................................28
Temporal number density of debris between the altitudes of 40 and 50kilofeet for various annular spaces (bands) ...........................................................29
Aircraft trajectories through the debris space ........................................................29
Schematic of subsonic airflow into engine inlet ...................................................3O
6

List of Tables
Table 2.1 Characteristics of fragment impact injuries, according to Feinstein et al ...................9
Table 2.2 Area weighings for different body positions ...........................................................l5
Table 2.3 Injury characteristics for some common objects ......................................................2O
Table 2.4 Energy levels associated with personnel injury from fragments,according to Fugelso et al .........................................................................................2O
Table 2.5 Log normal fatality curves recommended by Janser ................................................2l
Table 3.1 Comparison of THOR and FATEPEN2 penetration predictions ..............................23
Table 3.2 FATEPEN2 predictions of smallest penetrating fragment ........................................24
Table 3.3 FATEPEN2 predictions for penetration of light aircraft wing front section. ............24
Table 3.4 Smallest potentially lethal fragments for aircraft ......................................................27
Table 3.5 Results for two sample flights through debris encounter model ...............................30
Table 3.6 Area parameters for different aircraft classes ...........................................................32
Table 4.1 Smallest debris fragment that can penetrate deck materials .....................................35
7

1 Introduction
The Risk And Lethality Commonality Team (RALCT) was formed in February 1996 at thedirection of the Range Safety Group of the Range Commander’s Council. The team consisted ofrepresentatives from the national test ranges as well as technical consultants from industry andgovernment agencies. Weston Wolff, Chief of the Flight Safety Office, White Sands MissileRange, was the chairman for the Phase One effort which addressed inert debris. RALCT’S initialpurpose was to evaluate the safety issues of intentional or accidental generation of inert debris byflight tests at national test ranges. This debris can vary from hardware shed during normal missileoperation to fragments generated by explosion, hypervelocity collision, aerothermal breakup, or aflight termination system. The second purpose of the RALCT was to review the safety criteria forinert debris currently being used by each range and to recommend debris safety standards thatcould be adopted by all of the national ranges.
This report is a collection of the studies that were performed for the RALCT by Sandia NationalLaboratories. Some of the topics presented here were not included in the proposed Standard or theSupplement published by the team. Section 6, Bibliography, contains many more entries,particularly for debris hazards to personnel, than are referred to in this report. They are groupedaccording to topic and alphabetically by author. It is hoped that providing the reader with a morecomplete overview of these subjects will encourage future studies to better quantify the rangesafety criteria used. Note that mixed units are intentionally used in this report to be compatiblewith those more frequently used by practicing safety personnel.

2 Debris Hazardous To People
2.1 Development Of Probability Of Fatality Curves
Debris generated by exe- and endo-atmospheric tests can be hazardous to people that are in theareas where the debris reaches the earth’s surface. The amount of land and sea area that must becontrolled to minimize danger to people from falling debris depends upon the levels of debrismass, momentum, and energy required to cause injury or death.
Feinstein, Heugel, Kardatzke, and Weinstockl 3 reported in a 1968 Illinois Institute of Technology(IIT) Research Institute publication on the effects of blast, debris, and thermal and nuclearradiation on sheltered and unsheltered personnel. The physiological data upon which they basedtheir analyses were obtained from experiments that had been performed for the Department ofDefense on live animals, human cadavers, and skin and gelatin models. They found that theseverity of cutting and penetrating injuries correlated best with the impacting fragment’s energy
times velocity squared, mv4, crushing and tearing with energy, mv2, and impulse loading withmomentum, mv. Table 2.1 summarizes these different types of injuries with judgments byFeinstein et al as to their possible severity and mortality rate, i.e., the probability that an injurywill result in death.
Table 2.1: Characteristics of fragment impact injuries,according to Feinstein et al.
Severity Types of InjuryDose Mortality
Relationship Rate
Superficial Glass andother lacerations mv4 10%
Unilaterallung hemorrhage mv
Rib fractures mv
Incapacitating Glassandothermissilepenetrations mv4 30%
Boneabrasionsand cracking mv2
Internallacerationsfromfracturedribs mv2
Nearlethal Bilateralhemorrhage mv4 Toy.
Skull fracture mv2
Passage through abdomen or other lethal areas mv4
Lethal Passagethroughthorax(Fatalwithin lhr) mv4 100%
Feinstein divided the body into three parts: the head, the thorax, and the abdomen and limbs. Thenusing the injury data, curves for each body part were defined for the threshold of serious injuryand kill probabilities of 0.1, 0.5 and 0.9. Figures 2.1-2.3 show these curves as solid lines. Also,
9

103
~~’”-
............ “%
.......----.-”...............-.-.TcrminaIVeloeity*for Tungsten“-”-”-”’.....-.----”-”-”-..-~.........-.-~
...........- ....----....... ......- .--------
. .. .----- ........... ---’steel ,-------.............”.. .......... .. .. --”.-.-’-.---+....-----Aluminum........... ..... - .. ........... .............. ....- -----
102 .....--.---”-”-...............--- .”-.-”.....-.-----’
Kill Probability
SeriousInjuryThreshold
\0.5
0.9
0. I
10’II * For solidspheresat an altitude
of 10,000ft
J
I*f)”L_u_u.A~ “
10”3 10-2 10-’ 10°
DebrisMass, lbs
Figure 2.1: Kill probability from debris impacts
10’ 10’
to the head.
103
102~s’’’””:* J. .
. . . . ---------------------
Termin~Velocity*for Tung~t~n.--..”..”j--.........----.”-”.... ........
...........- steel..........-.....r--
.. ... ------- ...........- ........-.-----”.....- ------ .. .. -“------- Ahmrinum
............--”-. .....- ------ ...........-.. ................... ....---------- ..---------------........- ........-
............-...-----.....-.
KillProbability
0.50.9
SeriousInjuryThreshold
\
o.i
“w 10”‘g
& 1* For solid spheresat an altitudeof 10,030ft
10°1 I I I I10-3 10-2
J10-’ 10° 10‘ 102
DebrisMass,lbs
Figure 2.2: Kill probability from debris impacts to the thorax.
included in these figures are dotted-line curves for the speed that an aluminum, steel, or tungstensolid spherical fragment would possess on reaching terminal velocity at an altitude of 10,000 ft.Only fragments that have dart or cone like shapes and are aerodynamically stable can have greaterterminal velocities for a given mass. It is extremely unlikely that such stable shapes would be
10

103
TerminalVeloeity*fo~ Tungsten.“””-..,.......--..----..”. -m...,:
“--”-.: steel ---:.......---...-.-”.””--”.”.
I * For solidspheresatsnaltitudeof10,OOOft ‘7
,00~10-3 10-2 10-’ 10° 10’ 102
DebrisMass,lbs
Figure 2.3: Kill probability from debris impacts to the abdomen& limbs.
created in most debris generation processes. The altitude of 10,000 ft was used to be conservative.Most human habitation occupies lower altitudes where the terminal velocities are less.
Smaller mass fragments which lie to the left of the intersection of a terminal velocity curve with aFeinstein curve represent a lower kill probability since they cannot attain the higher velocityrequired. This method of terminal velocity screening does not apply when the fragments have nottraveled a sufficient distance through the atmosphere to decelerate to a terminal condition beforeimpact.
The center portion of each Feinstein kill probability curve is that part between its intersection witha terminal velocity curve on the left and the abrupt shift to zero slope on the right. For the headand for the abdomen & limbs, this portion has a slope which represents nearly constant kinetic
2 For the thorax, the center portion has a slightly greater slope and is closer to nzvl.5.energy, mv .
Translation casualty data was used by Feinstein to define the kill probability curves for thefragments with mass greater than 2-8 lb where the curves have zero slope, i.e., constant velocity.These data were based partially upon fatality data from urban automobile accidents where peoplewere thrown forward by the deceleration. In the region of zero slope the fragment kinetic energyincreases linearly with mass. Thus, the kinetic energies represented by the center portion of eachkill probability curve are the lowest that can produce that kill probability. Using these kineticenergies for the larger fragments, therefore, give conservative results. If lethality data or analysesbecome available for the larger debris, they should be used in lieu of the analysis that follows.
S-curves for the probability of fatality were constructed as a function of the fragment kineticenergy. To do so required that an effective kinetic energy be determined for each Feinstein

probability of fatality curve for each body part. Figure 2.4 shows a typical Feinstein probability of
fatality curve whose central portion is represented by mv~ = k. An effective average kinetic
energy was calculated first as an unweighed average between points 1 and 2. Point 1 is theintersection of the terminal velocity curve and the Feinstein curve and point 2, the place where theslope of the Feinstein curve changes to zero. The equation for this unweighed average is:
\
KE =1
r2(KE)dm
(~@q) l’n,(2.1)
where: KE = average kinetic energy,
KE = fragment kinetic energy,mi = fragment mass at point i, i= 1,2.
4Debris Terminal
/:/,0
*mvb=ky Feinstein curve
-Y
II
log mE-
Figure 2.4: Illustration of region used to define average kinetic energy.
From hypervelocity collisions, 48”9 it has been observed that the number of fragments increasesrapidly as the mass of the fragments becomes smaller. Hence, it was decided that an averageweighted toward the more numerous, lower mass, fragments should be used. This wasaccomplished with a log-weighted average. The log-weighted average reduces to:
1 f’y_+KEweighted = (logm2 – log~l ) ml (2.2)
12

For the head and abdomen & limbs, the weighted and unweighed averages of kinetic energy arenearly identical. However, for the thorax, the weighted average gives a slightly larger value thanthe unweighed average.
Feinstein et al employed log-normal distributions to relate the severity of each type of injury tothe impact dose. In this analysis, the log-normal relationship was adopted to describe theprobability of fatality versus the effective kinetic energy for impacts to the head, thorax, andabdomen & limbs. Figure 2.5 shows log-normal S-curves for each body part and includes a tablewhich lists the kinetic energy at 10, 50 and 90% probability of fatality as well as the log-normalparameters.
The form of the natural log-normal equation used to calculate these curves is:
{
-(lnX-ln(Xi)2
}Pi(Fatality/KE < K) = j’~xp l&ne
2~i2dx
i
(2.3)
where: K = fragment impact kinetic energy, ft-lbf,
ai = scale parameter, the median for log-normal, ft-lbf,
pi= shape parameter for log-normal.
This equation can be evaluated for different values of kinetic energy through numericalintegration. A simpler technique is to correlate an impact kinetic energy to a probability offatality. This process starts with the equation:
ln(KE) - ln(CXi)z=
Pi(2.4)
Assuming a cumulative normal distribution, Z is the number of standard deviations that ln(KE) isremoved from ln(~i). Once a Z is calculated for a given kinetic energy, the probability of fatality
can be determined by using a normal distribution table. These tables are found in most statisticstextbooks and mathematical and engineering handbooks.
For example, if ~i =55 ft-lbf and ~i = 0.2802, a kinetic energy of 78.8 ft-lbf will result in a value
of Z = 1.28. In a normal distribution table, this Z value corresponds to a probability of 90%. Akinetic energy of 38.4 ft-lbf will result in a value of Z = -1.28, which corresponds to a probabilityof 10%. A kinetic energy of 55 ft-lbf produces Z = 0.0, which corresponds to a probability of50%.
In everyday circumstances, the body part impacted by an inert debris fragment will not be knowna priori. Hence, the probabilities derived for the three body parts must be combined to handle
13

,,, ,, !,>
Probabilityof Fatality0.9----- Body
!,,
Part10% so% 90% (i (Klbll
0.8- - . . . Head 3 55 79 55Throax 28 44 72 44Abdomen 55 96 167 96
0.7 - ---- & Llmbah
~ ,,! !! !!,>
d ‘ usingnaturaltcgarithms ~ ~ ~ :!,,
0.6. . . . .,!,
. . . . ...!... . . . . . . . . . . . . . ...+. . . ..-.%
,,
h,,! ,!, ,,,,
:!!! ,,%
,,, ,,
h Abdoman & Limbs : : : ; : :.= ,,
E
sg
,, ,,, ,,,
,, ,,, ,,, !,), ,,,>,, ,., .,
,4 !,,,,, ,,,
:!:! ,,,,,, ,,,,,, ,,,
,! !,, ,1, ,,. :,,
0.1 --!,, ,,, ,:
. . . . . . . .. . . . . . . . . . . . . . . . . , . . . . . . . . . . . . . ., ...!.,,,,,, ,: :::,,, ,!,
,,, ,!, .::,, ::, ,
:,, ,:, ,
1 10 100 1000
Fragment Impact Kinetic Energy, ft-lbf
Figure 2.5: Probability of fatality from debris impactsto different body parts.
more general situations. Given that a person is hit, the conditional probability of hitting aparticular body part is equal to the ratio of the area that part presents to the total area presented bythe person. The more general probabilities of fatality curves were obtained by combining theprobability of fatality curves for the three body parts through the use of standard-man dimensions.In doing this an implicit assumption was made that each fragment was sufficiently small that itstruck only one body part. Further, it was assumed that a body part was equally vulnerable whenimpacted from any direction. No benefit was taken for the distribution of bony and muscular
mass. Figure 2.6 shows the standard man which was obttined from Janser. 21 The bodyproportions of the sketch do not exactly correspond to the dimensions included with the sketch. A
detailed body description with corrected proportional areas was made by Bradley Hill,20 ofTYBRIN Corporation. The weighting given to each body part was defined as the ratio of the areathat body part presents to the area the total body presents for impact. This weighting changes as afunction of the person’s position and the angle the debris velocity vector makes to the person.Body positions selected were standing, sitting, and prone. Table 2.2 lists the area ratios for thethree body parts when the debris is falling nearly vertically.
A composite curve was generated for each of the three body positions based on the equation:
3
Pj(KE) = ~ AijPi(KE) (2.5)
i=l
14

.
where Pi =
Pj =
KE =A; =
Probability of fatality for body part (i), derived from log-normal curve,
Probability of fatality for body position (’j),
Kinetic energy of impacting debris in ft-lbf,Weighting of body part (i) for body position (j), see columns 3-5 of
Table 2.2.
Aco b k--270A
Figure 2.6: Sketch of a standard man.
Table 2.2: Area weighings for different body positions.
Total AreaBody
Head Thorax AbdomenPresented
Position& Limbs
(ft*) Alj A2j A3j,
Standing 1.0 0.29 0.43 0.28
Sitting 2.9 0.10 0.14 0.76I
Prone 5.1 0.09 0.23 0.68
Log-normal curves were fit to these composite curves by the method of maximum likelihood. The
resulting log-normal curves are shown in Figure 2.7 along with a table listing the kinetic energy at10, 50 and 90% probability of fatality and the log-normal parameters. The curves for the proneand sitting positions are nearly identical because the weighting of the body parts are very similar.
15

1.0
0.9
0.8
0.7
0.6
0.5
0.4
0,3
0.2
0.1
0.0
!1!, ,!, ,!
,,.,,. ,,
Standing 1.0 31 58 109 58 ,1!, ,,,
Sining 2.9 41 81 159 81 0.5230 ,:: ,,, ,,,
---- Prone 5.1 3 76 152 76
Average 3.0 36 76 150 76 0.5380,,, ,,
>,, ,,, ,,, ,,,
1 10 100 1O(X)
Fragment Impact Kinetic Energy, ft-lbf
Figure 2.7: Probability of fatality from debris impactsfor different body positions.
The probability of fatality for the three body positions was averaged assuming that equal numbersof the exposed population were standing, sitting, and prone. This average was weighted by thetotal body area presented by each position. The resulting curve is shown in Figure 2.8 as well as inAppendix A of the Standard 321-97.
The equation for achieving the average is:
(2.6)
k=l
where: Pj = probability of fatality due to fragment impact when in body position j,
bj = total area presented by the body in position j, see column 2 of Table 2.2.
To calculate expected fatalities (EF) from impact by a given debris’ kinetic energy, it is necessary
to multiply the probability of being struck by the probability of fatality. The probability of being
16

.
.. . . . ... . ;..:..:.!,,
::, ,,
:: ::;,,, ,
- .---,-... . .. . .
,! 1!,
:’::,, :!,!4, ,,
. . . . . . . . . . . . .
,,, ,,
.
. .
. .,,,,,,,,
,,,::!!,,,
. . .. . . . . . . .. . .,,!,
!::’:,,, .,,,, ,,,1,,. :!,
. . . . . . . . .. . .. . .
. . . . . . . . .. . . . .
. . . . . . . . . .. ----
:’ ,,. . ...!.. . . . . .,,
:’!,,,!
. . . . . . ...!... .,)
:! ;:,,!,,, ,
. . . . . . . . . . . . .:’,,!
,:,,!!
:,!,. . . . . . . . . .. . .
:; :!,,!:,
-
,,:;!:.,
.L ...: .,,
,,:,::
. . ...!.>,,
:::
,,,,,,
.! -...!.$,!,,!.,<,,!!,
.,.. .!.,,,,
,,,
;::
—
1 10 100 1000
Fragment Impact Kinetic Energy, ft-lbf
Figure 2.8: Average probability of fatality from debris impacts.
struck relates directly to the body’s presented area. The prone position has a presented area that ismore than five times the presented area for a standing person and nearly twice that for a seatedperson.
The angle that the falling debris makes with the vertical also affects the body’s presented area.It is estimated that the majority of the impacts will be with debris falling almost vertically.However, it is possible through a combination of high winds, low ballistic parameter, and largerdebris mass to have hazardous debris impacts at acute angles from the vertical that approach 90degrees. If the larger presented area of the prone position is used, then regardless of the debrisimpact angle, a very conservative, EF will result. Even when the impact area is a beach, this
approach is conservative because many of the occupants will not be prone. In most cases where amajority of the people are prone. they will be within structures which provide considerably moreprotection from fragment impacts.
2.2 Other Studies Of Debris Impacts On People
There have been many studies into the effects of projectiles impacting the human body since thepaper by Feinstein et al. A majority of this work has been sponsored by the U.S. Army ResearchLaboratory, USARL, at the Aberdeen Proving Ground, MD. The emphasis of most of thesestudies has been to understand the physiological effects of high velocity projectiles and weaponfragments and to quantify the physical capabilities lost by the person hit. Probability of fatalityhas not been a primary interest. An example of more recent studies is the information of Neades
and Rudolph28 on the probability of skin penetration and liver fracture which was presented at aDoD Explosive Safety Board (ESB) meeting in 1984. Figure 2.9 is a plot for skin penetration for
17

,8,8 9+6 10,4 1[92 tz.o
ln(mv2/A)
Figure 2.9: Probability curves for skin penetration.
the cases of bare skin, skin covered with two layers of warm weather military clothing, and skincovered with six layers of cold weather military clothing. Figure 2.10 is a plot for liver fracture.This study was performed by Edgewood Arsenal. Note that skin penetration is a function of thekinetic energy per unit of area presented by the fragment at impact and that liver fracture is a
=<@-@P
*O
m - fragment mass (gin)v - fragment velocity (m/s)w - person’s mass (kg)D- fragment size (cm)
Ii !2 13 14In (mF)
Figure 2.10: Blunt trauma liver fracture discriminant lines.
18

function of fragment kinetic energy. Also liver fracture depends upon the body mass, a largerbody mass being less susceptible. This information is certainly applicable, but these types of dataneed to be assimilated by qualified analysts into a more usable form for the safety community.Table 2.3 applies the Neades and Rudolph’s information to impacts by some common objects,originally characterized by Thomas Pfitzer of APT-Research Inc.
Fugelso, Weiner, and Schiffmanl 8 presented a paper in 1972 at an ESB meeting in which kineticenergy values for impacting fragments were stated for 10, 50 and 90% probability of fatality.These values were more conservative, i.e. lower energies, than those derived from the Feinstein etal study. Fugelso referenced Feinstein’s work, but did not show how the stated energy values wereobtained. These results were considered by the RALCT, but not used in the development of the Scurves for this report. Table 2.4 contains the Fugelso et al recommendations.
Janser21 also presented a paper in 1982 to the ESB on the lethality of fragments to unshelteredpeople. In it, he recommended log-normal curves for the probability of fatality from fragmentimpacts on four body parts: head, thorax, abdomen, and limbs. He based his study on Feinstein’swork as well as more recent studies, but did not explain how his curves were generated. Table 2.5contains the log-normal parameters for the curves he recommended. Compare the values of u and~ in this table with those in figures 2.5 and it can be readily seen that Janser’s fragment energylevels for a given probability of fatality are much greater than those recommended in the presentstudy.
USARL has been developing a computer code called, “ORCA’, for Operational ~equirements-Based casualty ~ssessment which is scheduled for beta release in 1997. It will be able to assessphysical insults such as, blast oveq?ressure, penetration, blunt trauma, abrupt acceleration, burns,toxic gases/agents, and electromagnetic energy. ORCA considers the orientation and position of aperson relative to an incoming projectile as well as its mass, momentum and energy. It calculatesthe projectile’s trajectory within the body and outputs the person’s loss of mental and physicalcapabilities with time, assuming no medical attention for up to three days after the injury. Thiscode or some derivative of it promises a means for improving the method presented here forevaluating the probability of fatality from fragment impact.
19

Table 2.3: Injury characteristics for some common objects.*
KineticProbability
Mass Velocity AreaObject Impacting Energy
of Bare
(gin) (fps) (in2) (ft-lbf)Skin
Penetration
Warhead Canister 2600 279 9.0 6936 1.000
Cable (6ft x 1 in) 1590 77 71.3 323 0.002
38 Cal. Bullet I 16 I 432 I 0.11 I 102 I 1.000
2 30 Cal. Bullet 12 473 0.07 92 1.000.*u~ Warhead Fragment 70 174 0.62 73 0.966+$ Basebal~ 145 109 6.5 59 0.015
“E Golf Ball 46 106 2.2 18 0.011G
22 Cal. Bullet 3 329 0.037 11 1.000
Penny 3 309 0.42 9.8 1.000
Nut & Bolt 14 93 0.44 4.1 0.018
~ 22 Cal. Bullet 3 1476 0.037 224 1.000n& Golf Ball 46 249 2.2 98 0.6320~ 90 mph Fast Ball 145 132 6.5 87 0.045
Likelihoodof Liver
Fracture+
Large
Some
Large
Large
Some
No
No
Some
Some
No
Large
Some
Some
* Probability of bare skin penetration and liver fracture based on data of Neades and Rudolph.28
+ Assuming a body mass around 68 kg (150 lbs).
Table 2.4: Energy levels associated with personnel injury from fragments,according to Fugelso et al.
Injury Level Energy (ft-lbf)
Threshold 11
90% Injury (10% Fatal) 40
50% Injury (50% Fatal) 58
10% Injury (90% Fatal) 85
20

Table 2.5: log-normal fatality curves recommended by Janser.
I log.normal paramet~r~IBody Part
(ft-;bf) P*
Head 75
E
0.299
Thorax 173 0.591
Abdomen 214 0.425
Limbs 457 0.608
* Based on natural logarithms
Until more recent data on the effects of fragment impacts on people have been analyzed andassembled into a form readily used by safety personnel, it is recommended that the probability offatality curves, Figures 2.7 and 2.8, be used to make the expected fatality calculations. Theaverage Iog-normal curve can be used to make quick estimates of potential safety problems. Whenmore detailed safety analyses are needed, statistics on the distribution of body positions can beused or credible assumptions made about the numbers of people standing, sitting, and prone. Thenthe more specific curves of Figure 2.7 can be used.
21

3 Debris Hazardous to Aircraft
A piece of debris is considered to be potentially lethal to an aircraft if it is capable of producingsufficient damage to cause loss of life or necessitate emergency response by the crew to avoid acatastrophic consequence. The two principal ways that debris can be hazardous to aircraft are: (a)fragment penetration of a critical aircraft structure or the windshield and (b) fragment ingestionby an engine.
3.1 Fragment Penetration
Business jets are more at risk from fragment penetration than other classes of aircraft, becausethey fly relatively fast and are constructed of relatively thin materials. For a jet aircraft cruising at450 kts and 50,000 ft, the relative velocity between the aircraft and a 10 mm-diameter, solid steelspherical fragment in terminal velocity is about 830 fps.
Initially, a study was made using the THOR equations3g3 39 to determine the size fragments thatcould penetrate wing leading edges and windshields. These empirical equations were developedby the Ballistics Analysis Laboratory of Johns Hopkins University for the U.S. Army BallisticResearch Laboratory. However, goodness of fit information published in reference 38, indicatedthat the THOR empirical equations had standard deviations in residual velocities greater than 350fps for steel and aluminum projectiles impacting aluminum targets. These translate into predictiveuncertainties for the THOR equations as great as A 50-100% when the impact speed range ofinterest is less than 1000 fps.
The recently completed penetration code, FATEPEN2,40141 was subsequently obtained from theNaval Surface Warfare Center (NSWC), Dahlgren, VA. It is being used at NSWC to evaluate thevulnerability of aircraft to impacts by high speed fragments from various types of warheads.Inquiries were made concerning this code’s predictive accuracy. The code developers providedseveral plots which showed that the empirical equations fit experimental penetration data forLexan, Kevlar, and fiberglas reasonably well down to impact speeds below 1000 fps. No overallaccuracies were stated for the code. Note that the experimental data used to develop the THORequations were a subset of the data used to develop the FATEPEN2 equations.
Table 3.1 compares the penetration predictions of the THOR and FATEPEN2 equations forimpacting solid spherical fragments. Windshields typically used for light aircraft were assumed tobe one piece constructions of Lexan, cast acrylic, stretched acrylic, or bullet resistant glass, 0.50
inch thick with a 40° rearward rake. The impact velocity was set at 800 fps. FATEPEN2 predictsthat larger fragments are required to penetrate plastic windshield materials than THOR. Foraluminum and glass targets, FATEPEN2 predicts that smaller steel fragments are required.
Short solid cylinders impacting end-on are more effective penetrators than solid spheres of thesame diameter because of their greater mass to presented area. Table 3.2 presents onlyFATEPEN2 predictions for solid, short, cylindrical fragments, L/D-1 of aluminum, steel andtungsten, penetrating a 0.06 inch thick leading edge or a 0.5 inch thick windshield. Aircraft wind-shields were generally predicted to be more resistant to penetration than wing leading edges.
22

Table 3.1: Comparison of THOR and FATEPEN2 penetration predictions.
MaterialThickness Rake Angle
(in) (deg)
Aluminum 0.06 0
0.06 0
Lexan 0!50 40
0.5 40
Cast Acrylic 0.5 40
0.5 40
Stretched Acrylic
+-1++
BulletResistantGlass 0.5 40
0.5 40
Smallest Penetrating Solid Spherical FragmentTHoR/FATEPEN2
MaterialDiameter Mass
(mm) (gin)
Steel 513 0.5/0. 1
Aluminum 12/18 2.4/8.’7
Steel 3/23 O.1/46.7
Aluminum 10/49 1.4/168.5
Aluminum 18/34 8.1/58.0
Steel 11/10 5.1/4.0
Aluminum 28/13 30.4/3.3
The 0.09 gm steel fragment predicted to penetrate a 0.06 inch (O.15 cm) aluminum leading edge isimpractically small for range safety to have to consider. So light aircraft construction was exam-ined in more detail. Figure 3.1 shows a typical light aircraft front wing section. A penetratingfragment would encounter, at a minimum, the leading edge, a baffle, and the front wing spar, allconstructed of aluminum with thickness of about 0.05, 0.025 and 0.071 inches, respectively. Thespace in the forward portion of the wing could also contain tubing for a warm air deicing system,but critical components, such as hydraulic lines, electrical cables, or control mechanisms, are usu-ally not located there. It is undesirable for a fragment to penetrate the leading edge and the baffle,but significant damage could result from a fragment actually penetrating the front wing sparwhich normally forms one wall of a fuel tank. Table 3.3 shows the smallest fragments thatFATEPEN2 predicts could penetrate the leading edge, baffle and front wing spar of a light aircraftwing to puncture the fuel tank. These fragments are assumed to be a short solid cylinders, L/D-1.If the debris does not contain very dense fragments like tungsten, the smallest fragment mass forconcern is 1.9 gm. The predicted aluminum fragment mass is much larger than for the steel ortungsten. Since aluminum has lower mechanical strength it tends to mushroom in shape muchmore during impact. This greatly increases the fragment area presented for impact and the massrequired for penetration.
23

Table 3.2: FATEPEN2 predictions of smallest penetrating fragment.
Target Smallest Penetrating Fragment*
i I I I
MaterialThickness Rake Angle
(in) (deg)
Aluminum I 0.06 I o
I 0.06 I o
I 0.06 I o
Steel I 0.06 I o
MaterialSize Mass
(mm) (gin)
Aluminum 10.7 2.7
Steel 2.4 0.09
Tungsten 1.9 0.09
Aluminum 16.1 9.1
0.06 0 Steel 10.1 6.3
0.06 0 Tungsten 7.1 4.9
Lexan 0.50 40 Aluminum 36.1 102.3
0.50 40 Steel 16.6 28.1
0.50 40 Tungsten 9.2 10.6
Cast & Stretched Acrylic 0.50 40 Aluminum 27.9 47.2
0.50 40 Steel 16.6 28.1
0.50 40 Tungsten 11.2 19.1
Bullet Resistant Glass 0.50 40 Aluminum 11.8 3.6
0.50 40 Steel 8.9 4.3
0.50 40 Tungsten 7.2 5.1
* Fragments are shon solid cylinders (L/D-l) impacting end-on.
Table 3.3: FATEPEN2 predictions for penetration of light aircraft wing front section.
Target Smallest Penetrating Fragment *
MaterialRake Angle
MaterialSize Mass
(deg) (mm) (gin)
Aluminum o Aluminum 20.9 19.8
Aluminum o Steel 6.8 1.9
Aluminum o Tungsten 3.1 0.4
* Fragments are short solid cylinders (L/D-1) impacting end-on.
24

Front Wing Spar
Leading Edge
7 ‘a”e7 \Impacting Fragment
/+ ---
Leading edge, baffle, and spar are assumed to be constructed of 0.05,0.025 and 0.071 inch– thick aluminum, respectively.
Figure 3.1 Typical construction of an aerodynamic structure for a light aircraft.
3.2 Fragment Ingestion By An Aircraft Engine
Aircraft and helicopters flying in a region through which debris is falling could possibly ingestfragments into their engines. Piston engines were considered, but were not pursued because theirphysical construction with intake filters and manifolding make it difficult for fragments to getinside to affect moving parts. Debris clogging the air filters can become a serious problem whenflying through an extensive cloud of volcanic dust, but should not be a problem with debris from amissile test.
Aircraft gas turbine engines can be divided into three categories: turbojet, turboshaft and
turbofan 43 Only a part of the air processed through a turbofan engine actually goes through theengine core which contains the compressors, burners and turbines. The rest passes only throughthe fan. The ratio of the air mass passed through the fan to that passed through the core is definedas the “bypass ratio”. Turbojet and turboshaft engines have zero bypass ratios. Turbofan enginescan have bypass ratios up to and exceeding eight.
25

Any fragment ingested into an engine with zero bypass will have to pass through the engine core,if it does not become lodged somewhere within the engine. In turbofan engines, an ingestedfragment is likely to be centrifuged outward to pass only through the fan and not enter the enginecore. The greater the bypass ratio, the smaller, the chance that a fragment will enter the enginecore.
Engine damage can result from solid fragment ingestion, almost independently of the fragment’srelative speed. Damage is primarily a function of the fragment’s physical size and mechanicalstrength relative to those of the engine’s compressor blade materials. Material density whichexerts so much influence in penetration is of secondary importance for ingestion. It is reasonableto expect an engine to tolerate larger aluminum than steel fragments and about the same size tung-sten fragments since their tensile strengths are, respectively, less than and about the same as steel
One of the worst objects that an engine can ingest is a piece of cloth, e.g. a shop rag. Wheningested, a rag can become entangled between rotor and stator blades causing them to bend andinterfere. The rag when caught on the face of a rotor or stator can also disrupt the air flow throughthe engine causing a stall or flameout. Thin plastic sheets and quilted pads sometimes used onmissile and space vehicles for thermal protection could become part of the falling debris and actsomewhat like a rag if ingested.
Thus, a low, slow flying airplane or helicopter can be at risk as well as a high, fast flying one. Amore important parameter for ingestion hazards is the size of the engine. Smaller engines tend tobe more vulnerable to fragment ingestion than larger ones. Also, engines with axial flowcompressors tend to be more vulnerable than those with centrifugal compressors.
The Federal Aviation Administration requires manufacturers of gas turbine engines todemonstrate through testing that their engines can withstand ingestion of prescribed masses ofbirds, ice, and sand. There is no requirement for ingestion tests of other foreign objects and,consequently, the information is sparse and mostly anecdotal.
The U.S. Army Research Laboratory (ARL), has overviewed foreign object ingestion by military
44’45 They consider some of the smaller turboshaft engines withaircraft for a number of years.axial flow compressors to be the most vulnerable to foreign object ingestion. Such engines powersome small aircraft and small helicopters. Personnel at ARL estimate that engine damage couldoccur if one of these small engines ingested a 1-gram compact fragment of steel or tungsten. Asomewhat larger compact fragment mass of aluminum would be required to cause the samedamage because it is mechanically weaker and less dense. At this time there is no experimentaldata to confirm this.
Table 3.4 provides a list of the smallest fragments masses that can be potentially lethal to the morevulnerable aircraft and helicopters. If there are no high density fragments, e.g., tungsten, it isrecommended that one gram be used as the smallest fragment mass that can be potentially lethalto an aircraft from structural penetration or engine ingestion.
26

Table 3.4: Smallest potentially lethal fragments for aircraft.
EventFragment
Smallest
MaterialFragment Mass
(gin)
Penetration of Structure Aluminum 3.5or Windshield
Steel 2.0
Tungsten 0.5
Engine Ingestion Aluminum >1
Steel -1
Tungsten <1
3.3 Debris Encounter Model
A study was made to assess the magnitude of the probability that an aircraft would encounter apiece of debris. An exoatmospheric intercept between an incoming target missile and an
interceptor was modeled with the debris generation model, FASTT49 which was developed byKaman Sciences through the sponsorship of the Defense Nuclear Agency. NASA, the U.S. AirForce and the U.S. Army have also developed computer models for predicting debris generationfor various events, e.g., hypervelocity impact, and explosive disassembly. Only fragments thatwere 10 mm or greater in size were considered in this example, to limit the number of fragmenttrajectories that had to be calculated. Still, FASTT predicted the generation of more than 20,000fragments. Figure 3.2 presents a spatial model for falling debris from an exoatmospheric eventassuming no atmospheric wind. In this example, the debris was monitored over time in six annularregions. At one second intervals a count was made of the number of fragments that occupied eachannular region between the altitudes of 40 and 50 kft. It was assumed that the fragments wereuniformly distributed within each region. Figure 3.3 shows the number density for the differentregions versus time from the debris generating event. Aircraft were assumed to be flying straightand level at cruise speed and a constant altitude of 45 kilofeet and to pass through the debris cloudwhen the fragment number densities were near their maximum. Figure 3.3 shows Flight A passingdirectly through the center of the debris cloud and Flight B skirting all, but the outermost region.The cross sectional area of each aircraft was approximated by multiplying its wingspan by itsoverall height, designated here as the maximum frontal area, AfrOnr
27

FASIT debris model used
Debris size decreasesas radius increases
Debris uniformlydistributed withina ring
No atmosphericwind
Altitude(kft)
300
/“
50
40
0
Figure 3.2: Simple model of space through which debris falls.
The probability of fragments impacting an aircraft, PI, was calculated using the equation:
KR
z‘I = ‘front ‘iNii=l
where: Si = distance aircraft travelled in passing through annular region i,
Ni = fragment number density in annular region i at time ~.,
~. = average of entering and exiting time for annular region i,
KR = number of annular regions flown through, (for Flight
Table 3.5 presents the results for a Lear Jet and a Boeing 747. A moreaircraft cross sectional area would decrease the probability of impact.
A,K~= 11).
refined estimate
(3.1)
of the
28

10”’0~ I I I I......Band 1, 154Kft R
---- Band2, 308Kft R,.’.......... ............... - Band 3, 462Kft R
,..”‘ ..,., ...,., Band 4, 616Kfl R.....
...“’ ... —– [land 5. 7-K)KII [<
,? ,z-----.s-~ ~..,/ --- ,.:
,.,‘“ / -.\ I=!wE!v,’ .,\-.+ ,;;’,.. , ‘\,‘s,,;.’ ...........,,..,,.....................-
{“:;,’1 /’--J ]Y,~---T-----------------.
----- . .. ‘L-.. ”:.: ::.--”..-::::———
0 250 500 750 1(DO 1250 150a
Time fromIntercept(WC)
Figure 3.3: Temporal number density of debris between the altitudesof 40 and 50 kilofeet for various annular spaces (bands).
Flight
I
Debris Hazard Regions ~
Figure 3.4: Aircraft trajectories through the debris space.
29

Table 3.5: Results for two sample flights through debris encounter model.
Time From Debris Generation Probability Of Debris(see) Impact
I I
Zxits OuterReuinn I Lear 35A I Boeing 747 I
EntersFlight Outer
Nearest E
Region The Center . .-a. ”..I I I
A -592 625 1843 7.1 x 10⁻⁴ 1.8 X10⁻²
I B I -47 I 625 I 1297 I 4.9 x 10⁻⁷ I 1.2 x 10⁻⁵ I
3.4 Engine Capture Area
When a propeller or jet propelled aircraft is flying subsonically, its engines draw air from anupstream region whose cross sectional area is greater than the actual area of the engine inlet.Figure 3.5 illustrates this effect.
Air Flow——— — -—=--. .,___,
A cCaptureArea
—=—-----+
f\
I “r– –’-- ‘----- Gas Turbine
--t-”-lEngine Inlet Engine
/
~\ ~k
~— ——
----~—
— ———— ~
Figure 3.5: Schematic of subsonic air flow into engine inlet.
30
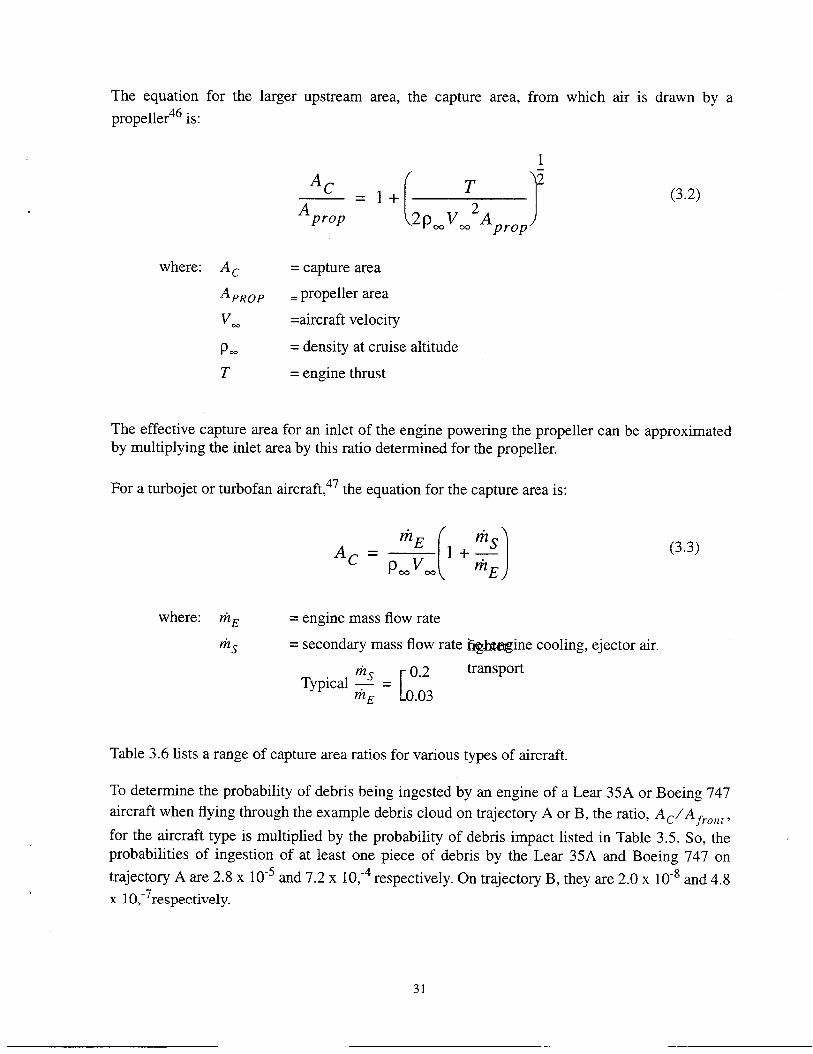
The equation for the larger upstream area, the capture area, from which air is drawn by a
prope11er46 is:
where: A ~
A PROPv=
PCOT
‘prop @3mVmLA ,)prop
= capture area
= propeller area
=aircraft velocity
= density at cruise
= engine thrust
altitude
(3.2)
The effective capture area for an inlet of the engine powering the propeller can be approximatedby multiplying the inlet area by this ratio determined-for the propefier.-
.-
For a turbojet or turbofan aircraft, 47 the equation for the capture area is:
m. ( m.)
niE )where: rn~
rn~
= engine mass flow rate
= secondary mass flow rate
Typical ~ =[
0.2
m~ 0.03
(3.3)
fig.imagine cooling, ejector air.
transport
Table 3.6 lists a range of capture area ratios for various types of aircraft.
To determine the probability of debris being ingested by an engine of a Lear 35A or Boeing 747
aircraft when flying through the example debris cloud on trajectory A or B, the ratio, Ac/A frOnf,
for the aircraft type is multiplied by the probability of debris impact listed in Table 3.5. So, theprobabilities of ingestion of at least one piece of debris by the Lear 35A and Boeing 747 on
trajectory A are 2.8x 10⁻⁵ and 7.2x 10,-4 respectively. On trajectory B, they are 2.0x 10⁻⁸ and 4.8
x 10,-7respectively.
31

In summary, steel fragments as small as 2 gm and tungsten as small as 0.5 gm could be apenetration hazard to aircraft. Steel or tungsten fragments as small as 1 gm could be an ingestionhazard for the smallest gas turbine engines. Aluminum being mechanically weaker and less denseis not a hazard in these small masses.
Table 3.6: Area Parameters for different aircraft classes.
Inlet Area MaximumCruise per Frontal
Type Speed Engine Area, Afront(fps)
(ftz) (ftz)
CommercialTurbofan - 700-800 40-45 8000-14000
BusinessTurbofan 700-800 4-5 450-650
MilitaryTurbofan 700-950 5-7 500-600
Turboprop 300-520 0.4-2.2 700-5000
Helicopter 170-200 1.5-3 300-500Turbo shaft
TotalCapture
Area, ~ ‘WAfront
[ftz)
250-450 I 0.02-0.04
14-18 0.02-0.04I
15-25 I 0.03-0.04
0.5-11 / 0.001-0.002
2-4 0.006-0.008
The low probability of impact and ingestion results calculated for a worst case trajectory througha debris cloud suggest that these risks may be satisfactorily managed through small modificationto the timing and routing of commercial and privates flights. -
32

4 Debris Hazardous to Ships or Boats
Falling inert debris can be hazardous to the occupants of a ship or boat in two ways. A fragmentcan directly impact a person exposed on the deck or it can penetrate the structure and causeproblems below deck that could lead to the ship or boat being seriously damaged or destroyed.The concerns for an exposed person onboard are the same as for an exposed person on land and
. have already been addressed. Fragment impacts on a ship or boat are addressed here.
4.1 FATEPEN2 Penetration Predictions
A potentially lethal fragment for a ship or boat was defined as one which can penetrate a deck or
weather covering. The FATEPEN2 code40>41 was used to quantify the sizes of aluminum, steel,and tungsten fragments which could just penetrate decks made of 0.25 inch thick aluminum, steel,or Doron, or 0.50 inch thick oak. Doron is a laminated panel made from bonded woven-rovingfiberglass. The material thicknesses used in the calculations are those more typically found onsmaller ships and pleasure craft, e.g. sailboats. Note that sailboat decks are frequently constructedof 0.50 inch thick balsa wood laminated between 0.12 inch thick fiberglass. If no penetrationstrength is assumed for the balsa wood this deck can be represented in FATEPEN2 calculations as0.25 inch thick fiberglass. Each fragment was assumed to be a compact solid cylinder with L/D- 1falling in a tumbling mode at its terminal velocity for sea level conditions.
The FATEPEN2 calculations indicate that penetration of 0.25 inch fiberglass requires the leastfragment mass for aluminum and steel fragments, that is 14 and 5 kg, respectively. While thesmallest mass of tungsten, 0.4 kg, is defined by the penetration of 0.25 inch aluminum. Table 4.1presents these results which are assumed to have an uncertainty of ~50%.
If mission essential ships all have steel decks and high density materials like tungsten are notpresent in significant quantities in the debris, then range safety can make probability of impactcalculations considering only fragments with mass greater then 6 kg. If high density materials arepresent, fragments with mass down to 3 kg must be considered.
For non-mission essential watercraft with no high density materials present in the debris,fragments with mass down to 5 kg must be considered. If high density materials are present, itwill be necessary to included fragments with mass down to 0.4 kg.
4.2 Stanford Equation
The fragment velocities required for deck penetration are mostly below those of the penetrationdata that was used to develop the empirical penetration equations used in FATEPEN2. Thus, a
second independent predictive method was sought. The Stanford equation42 was reported to givereasonable predictions of penetration of steel and concrete by steel missiles in the velocity rangeof interest.
33

The equation is:
where: EDsTww~
Note that this equation
E s= 46,500 (
16, OOOT+ 1, 500;T5 s )
(4.1)
= critical kinetic energy required for perforation (ft-lbf),= missile or fragment diameter (inches),= ultimate tensile strength of the target (steel plate) (psi),= target plate thickness (inches),= length of a square side between rigid supports (inches),= length of a standard width (4 inches)
takes into account the distance between the supports of the target plate.FATEPEN2 does not. The range of applicability for this equation is:
0.1< T/D< 0.80.002< T/L< 0.05
10< L/D <505< WID<88<w/T< 100
70 c v~ <400
FATEPEN2 predicted that a 6.35 kg (14 Ibm) steel fragment, D = 4 in., falling with a terminalvelocity of 320 fps could just penetrate a 0.25 inch thick steel plate. Assuming W = 24 in. and S =110,000 psi, the Stanford equation predicts that this fragment will require a velocity of 375 fps. Inthis particular case the results from the two methods compare reasonably well, differing by only17% in velocity. However, T/D, L/D and W/D were all below the stated range of applicability forthe Stanford equation.
These penetration predictions need to be revisited when applicable experimental data and/orbetter predictive equations become available.
34

.
Table 4.1: Smallest debris fragment that can penetrate deck materials.
Smallest PenetratingFragment*
Deck Thickness Fragment MassMaterial (inch) Material (kilograms)
Aluminum 0.25 Aluminum 15
0.25 Steel 5
0.25 Tungsten 0.4
Steel I 0.25 I Aluminum I 17 I
0.25 Steel 6
0.25 Tungsten 3
Doron 0.25 Aluminum 14(Fiberglass)
I I
0.25 Steel 5
0.25 Tungsten 2
Oak 0.50 Aluminum 66
0.50 Steel 23
I 0.50 I Tungsten I 2
* Fragment is a short solid cylinder, L/D-l. impacting end-on.
35

5 Summary and Recommendations
. L~g-normal curves which relate the impact kinetic energy of a fragment to the probability of
fatality have been developed for people in standing, sitting, and prone positions. An averagecurve was also calculated assuming equal numbers of people in the three positions. It showedthat a fragment kinetic energy of 76 ft-lbf would have a 50% probability of killing the personstruck. The physiological basis for these curves was obtained from studies reported in 1968 byFeinstein et al. Results from other investigators were also presented.
● It is recommended that the log-normal curves presented in this report be used by range safetyanal ysts until better predictive tools become available. The average log-normal curve can beused to make quick estimates of potential safety problems. When more detailed safetyanalyses are done, statistics on the distribution of body positions can be used or credibleassumptions can be made about the numbers of people standing, sitting, and prone in thedebris fall area. Then the curves specific to those body positions can be used.
● Steel fragments as small as 2 gm and tungsten as small as 0.5 gm could represent a penetrationhazard to aircraft. Steel or tungsten fragments as small as 1 gm could be an ingestion hazardfor the smaller gas turbine engines. Aluminum, being mechanically weaker and less dense, isnot a hazard in these small masses.
● The low probability of impact and ingestion results calculated for a worst case trajectorythrough a debris cloud suggest that aircraft risks may be satisfactorily controlled with onlysmall changes in timing and routing of commercial and privates flights.
● If mission essential ships have steel decks and high density materials, like tungsten, are notpresent in significant quantities in the debris, then range safety can make probability of impactcalculations considering only fragments with mass greater then 6 kg. If high density materialsare present, fragments with mass down to 3 kg must be considered.
● For non-mission essential watercraft with aluminum or fiberglass decks, fragments with massdown to 5 kg must be considered when no high density materials are in the debris. If highdensity materials are present, it will be necessary to included fragments with mass down to 0.4kg.
● The considerable physiological data base that currently exists concerning impacts on peopleneeds to be assimilated by qualified analysts into a form readily used by the safety community.
D Fragment penetration prediction methods need to be further developed and validated for thelower impact velocity regime, <300 m/s.
● A data base on the effects of debris ingestion by gas turbine engines needs to be greatlyexpanded.
36

6 Bibliography
Impact Hazards To People
1. Abstracts of the Explosive Safety Seminars 1959-1992, AD-A302396.
2. Ahlers, Edward B., Debris Hazards, a Fundamental Study, Report No. DASA- 1362, IITResearch Institute, June 1, 1966.
3. Ahlers, Edward B., Fragment Hazard Study, IIT Research Institute, Chicago, IL, Presentedat the Armed Services 1lth Explosive Safety Seminar, September 1969, AD-862 868.
4. Ahlers, E. B., Fragment Hazard Study, Minutes of the 1lth Exrdosive Safetv Seminar, Vol.1, Armed Service Explosives Safety Board, Washington, DC, September 1969.
5. Ahlers, E. B., Fragment Hazard Study (U), ITT Research Institute, Lanham, MD,September 1969, AD-A956 255.
6. Air to Surface Target Vulnerability, Book 1 of 2, JTCG/ME 6 lA1-3-9 (U.S. Army FM 101-50- 19), Joint Munitions Effectiveness Manual (JMEM), November 1979.
7. A Manual for the Prediction of Blast and Fragment Loadings on Structures, DOEAlbuquerque Operations Office, Febrih-y 1992.
8. Beverly, William B., A Human Ballistic Mortality Model, U.S. Army Ballistic ResearchReport ARBRL-TR-02088, Aberdeen, MD, July 1978.
9. Beverly, William B., A Monte Carlo Solution of the Human Ballistic llortali~ Model, U.S.Army Ballistic Research Report ARBRL-TR-02098, Aberdeen, MD, August 1978.
10. Clemenson, C. J., Hellstrom, G. and Lingren, S., The Relative Tolerance of the Head,Thorax, and Abdomen to Blunt Trauma, Annuals of the New York Academy of Sciences,Vol. 152, Art. 1, pp. 187+, October 1968.
11. Dziemian, A. J., A Provisional CasualQ Criterion for Fragments and Projectiles, CWLR2391, May 1960.
12. Fackler, Martin L., MD, Wound Ballistics, A Review of Common Misconceptions, Journal ofthe American Medical Association, Vol. 259, No. 18, May 13, 1988.
13. Feinstein, D. I., Haugel, W. F., Kardatzke, M. L., and Weinstock, A., Personnel CasualtyStudy, Illinois Institute of Technology Research Institute Project No. J6067, July 1968, AD842573.
37
14. Feinstein, D. I., Nagaoka, H. H., Fragmentation Hazards to Unprotected Personnel, IITResearch Institute, Chicago, IL, Presented at the Armed Services 13th Explosives SafetySeminar, September 1971, AD 890544.
15. Feinstein, D. I., Fragment Hazard Criteria, IIT Research Institute, Chicago, IL, Presented atthe Armed Services 13th Explosive Safety Seminar, September 1971.
16. Feinstein, D. I., Fragmentation Hazard Evaluations and Experimental Verification, IITResearch Institute, Chicago, IL, Presented to the Armed Services 14th Explosive SafetyBoard, November, 1973.
17. Feuchtwanger, Moshe M., MD, FACS, High VelociQ Missile Injuries: A Review, The RoyalSociety of Medicine, Vol. 75, December 1982.
18. Fugelso, L. M., Weiner, L. M., and Schiffman, T. H., Explosive E#ects Computation Aids,Final Report GARD Project No. 1540, General American Research Division, GeneralAmerican Transportation Corp, Niles, IL.
19. Gurdjian, E. S., J. E. Webster and H. L. Lissner, Studies on Skull Fracture with ParticularReference to Engineering Factors, Amer. J. Sur~., ~: 736-742, 1949.
20. Hill, B. D. and Mills, J., Personnel Injury Probability: Human Vulnerability To Inert Debris,TYBRIN Corporation Report TYBRIN-40-29000, April 1997.
21. Janser, P. W., Lethality of Unprotected Persons due to Debris and Fragments, Prepared forpresentation at the Armed Services 20th Explosive Safety Seminar, August 1982.
22. Katz, B. S. and Egner D. O., Los Angles County District Attorney’s Less-Lethal WeaponsTask Force, U.S. Army Human Engineering Laboratory, Aberdeen Proving Ground, MD,June 1976.
23. Kokinakis, W., A Note on Fragment Injury Criteria, U.S. Army Ballistic Research Lab,Aberdeen, MD, Presented at the Armed Services 13th Explosives Safety Seminar,September 1971, AD 890544.
24. Kokinakis, W., A New Methodology for Wounding and Safety Criteria, Proceedings of theArmed Services 16th DDESB Explosive Seminar, September 1974, pp. 1209-1226.
25. McCleskey, Frank, Drag Coe#icients for Zrregular Fragments, Naval Surface WeaponsCenter, Dahlgren, VA, August 1986, AD PO05 364.
26. McCleskey, F., Neades, D. N., Rudolph, R. R., A Comparison of Two Personnel InjuryCriteria Based on Fragmentation, Kilkeary Scott and Associates Inc, King George, VA, ADA235005. Presented at the Explosives Safety Board Meeting, August, 1990.
38

27.
28.
29.
30.
31.
32.
33.
34.
35.
36.
37.
McMillan, J. H. and Gregg, J. R., The Energy Mass and Velocity Which is Required toProduce a Casualty, OSRD Missile Casualty Report No. 12, November 1945.
Neades, D. N. and Rudolph, R. R., An Examination of Injury Criteria for PotentialApplication to Explosive Safety Studies, Prepared for presentation to the Explosive SafetyBoard (DDESB) in 1983-84.
Rich, Norman M., MD, FACS, COL, MC, USA, Missile Injuries, The American Journal ofSurgery, Vol. 139., March 1980.
Richmond, D. R., Yelverton, J. T., Fletcher, E. R., New Airblast Criteria for Man, LosAlamos National Laboratory, Los Alamos, NM, Presented at the 22th Explosives SafetySeminar, August 1986.
Rudolph, R. R., Fragment Injury Criteria Investigation (U), Ketron, Inc. Report No. KFR469-84 for the US Army Ballistic Research Laboratory, February 1984.
Sperrazza, J. and Kokinakis, W., Ballistic Limits of Tissue and Clothing, Technical Note No.1645, Army Ballistic Research Laboratories, RDT&E Project No. 1P025601A027, BallisticResearch Laboratories, January 1967.
Swan, Kenneth G., COL, MC USAR, Reiner, Dan S., MD, and Blackwood, James M., MD,Missile Injuries: Wound Ballistics and Principles of Management, Military Medicine, Vol.152, k?illuary 1987.
Wargovich, M. J., Egner, D. O., Busey, W. M., Thein, B. K., and Shank, E. B., Evaluation ofthe Physiological E#ects of a Rubber Bullet, a Baseball, and a Flying Baton, U.S. ArmyHuman Engineering Laboratory, Aberdeen Proving Ground, MD, September 1975.
White, C. S., The Nature of the Problems Involved in Estimating the Immediate Casualtiesfrom Nuclear Explosions, CEX-71. 1. Civil Effects, U.S. Atomic Energy Commission, DR-1886, July 1971.
Zaker. T. A., Lauer, J., Feinstein, D. I., and Ahlers, E. B., Fragmentation Hazard Study,Phases I and IZ, HT Research Institute Final Report, April 1970, Contract DAHC-04-69-C-0056, AD-869009.
Zaker, T. A., Fragment and Debris Hazards, Technical Paper No. 12, Department ofDefense Explosives Safety Board, July 1975, AD-A013 634. -
Fragment Penetration
38. Ballistic Analysis Laboratory, Johns Hopkins University, A Comparison of the Performance
of Fragments of Four Materials Impacting on Various Plates (U), Baltimore, Institute forCooperative Research, May 1959, (Project THOR, Technical Report No. 41).
39

39. Ballistic Analysis Laboratory, Johns Hopkins University, The Resistance of Various Non-Metallic Materials to Perforation by Steel Fragments: Empirical Relationships forFragments Residual Velocity and Tesidual Weight (U), Baltimore, Institute of CooperativeResearch, BAL/JHU, April 1963, (Project THOR, Technical Report No. 51.)
40. Yateau, J. D., Zernow, R. H., and Recht, R. F., Compact Fragmen~ Multiple PlatePenetration Model (FATEPEN2) Volume 1 - Model Description, Applied ResearchAssociates, Inc., prepared for the Naval Surface Warfare Center, Dahlgren, VA, January1991.
41. Yateau, J. D., Zernow, R. H., and Recht, R. F., Compact Fragment Multiple PlatePenetration Model (FATEPEN2) Volume 2 - Computer Code User’s Manual, AppliedResearch Associates, Inc., prepared for the Naval Surface Warfare Center, Dahlgren, VA,January 1991.
42. Gwaltney, R. C., Missile Generation and Protection in Light-Water-Cooled Power ReactorPlants, ORNL, NSIC-22, Oak Ridge National Laboratory, Oak Ridge, TN, for the U. S.Atomic Energy Commission, September 1968.
En~ine Inpestion
43. Treager, I. E., Aircraft Gas Turbine Engine Technology, McGraw-Hill Book Company, NewYork, 1970.
44. Thompson, W. S., Vulnerability Study of the J57 Non-Afterburner Turbojet Engine (U),Ballistic Research Laboratory Memorandum Report No. 1867, August 1967.
45. Thompson, Walter S. and Wheeler, Raymond E., Vulnerability Analysis of the J79Augmented Turbojet Engine (U), Ballistic Research Laboratories Memorandum Report No.2082, December 1970.
46. McCormick, Jr., Aerodynamics of V/STOL Fligh~, Academic Press, New York, 1967.
47. Seddon J. and Goldsmith, E. L., Intake Aerodynamics, AIAA Education Series, New York,1985.
Debris Generation
48.
49.
Serge, M. E. and Johnson, C. G., Space Debris Hazard Software: Program Impact Version
2.0 User’s Guide, Aerospace Report No. TOR-92(2909)- 1, November 1991.
McKnight, Darren, Maher, Robert, and Nagl, Larry, Refined Algorithms for StructuralBreakup Due to Hypervelocity Impact, Hypervelocity Impact Society Symposium, Santa Fe,NM, October 16-20, 1994, paper 082.
40

.
Overview
50. Cole, J. K. and Wolfe, W. P., Hazards to People and Aircraft from Flight Test DebrisGenerated at High Altitudes, Sandia National Laboratories Report SAND94- 1723, August1994.
41

Distribution:
Commander, White Sands Missile Range
STEWS-NRO-CF
Attn: Weston Wolff
WSMR, NM 88002-5113
Commander, White Sands Missile Range
STEWS-NRO-CF
Attn: Mike MeehanWSMR, NM 88002-5113
Commander, White Sands Missile Range
STEWS-NRO-CF
Attn: Dave DonaheWSMR, NM 88002-5113
45 SWISEOO
Attn: Mike Campbell
1201 Minuteman Street
Patrick AFB, FL 32925-3239
45 SW/SEOO
Attn: Juri Kaevats1201 Minuteman Street
Patrick AFB, FL 32925-3239
30 SWISEYBldg. 7015, Section 3C
806 13th St. Suite 3
Attn: Martin KinnaVandenberg AFB, CA 93439-5230
Commander, USAKA
Attn: Steve LaPoint
P. O. Box 1003
APO AP 96555
USASSDC
CSSD-KH-SSAttn: Jerry EsquibelP. O. Box 1500
Huntsville, AL 35807
USASSDC
CSSD-TC-WS
Attn: Tom DeLong
P. O. Box 1500
Huntsville, AL 35807
NAWCWPN
Code 521300EAttn: John Rogers
Point Mugu, CA 93042-5000
AFDTC/SEU
Attn: Ron Knight
505 N. Barrancas Ave., Suite 303Eglin Am, FL 32542-6817
NASA/Goddard Space Flight Center
Wallops Flight Facility (Code 821)
Attn: Dean Balach
Wallops Island, VA 23337
412 TWITSRO
Attn: Steve Cronk306 E. Popson Avenue
Edwards AFB, CA 93524-6680
ACTA, Inc.
23430 Hawthorne Blvd.
Skypark Bldg. 3, Suite 300
Attn: Jon Collins
Torrance, CA 90505
ACTA, Inc.
23430 Hawthorne Blvd.
Skypark Bldg. 3, Suite 300
Attn: Jerry HaberTorrance, CA 90505
BMDO/AQT
7100 Defense Pentagon
The Pentagon, Room lE-180Attn: Tom GlennWashington, DC 20301-7100
42

Distribution: (Con’t)
SRS Technologies
Attn: Jon Forst
1401 Wilson Blvd., Suite 1200
Arlington, VA 22209
Department of TransportationFANAST-200400 7th Street SW, Room 5402A
Attn: Carole Flores
Washington, DC 20590
APT Research, Inc.
Attn: Tom Pfitzer
555 Spar@an Drive, Suite 440
Huntsville, AL 35816-3421
APT Research, Inc.
Attn: Alice Correa
555 Sparkman Drive, Suite 440
Huntsville, AL 35816-3421
APT Research, Inc.Attn: Dr. Paul Jaramillo222 Bartlett #507
El Paso, TX 79912
TYBRIN Corporation
Attn: Brad Hill
4900 University Square
Suite 28Huntsville, AL 35806
NAWC
Pacific Ranges and Facilities Dept.
Code 52131OD
Attn: Everett Long
China Lake, CA 93555-6001
U.S. Army Test and Evaluation Command
AMSTE-TM-A
Attn: Doug Barrington
Aberdeen Proving Ground, MD 21005-5055
Internal Distribution:
MS 9005MS 0301
MS 0303MS 0313MS 0308MS 0312MS 0307MS 0309MS 0315MS 0314
MS 0842MS 0841MS 0828MS 0441MS 0828MS 0826MS 0834MS 0835MS 0827
MS 0825MS 0825MS 0825MS 0825MS 0836MS 0443MS 0437MS 0631
MS 0461
2200
2400
2411
2412
2413
2414
2417
2418
2419
2425
2500
9100
9102
9103
91049111
9112
9113
9114
9115
9115
9115
9115
91169117
9118
12300
14700
1 MS 9018
5 MS 08992 MS 0619
NAWCADCode 511200A, Mail Stop 3Bldg. 1406Attn: Mike Patterson
Patuxent River, MD 20670-5304
43
J. B. Wright
D. J. Rigali
J. L. McDowell
D. L. Keese
G. J. Hochrein
W. E. Williamson
E. W. ReeceA. K. Miller
R. G. Hay
E. J. Schindwolf
C. M. Hart
P. J. Hommert
R. D. Skocypec
J. H. Biffle
E. D. Gorham
S. N. Kempka, Actg.A. C. Ratzel
T. Bickel
A. S. Geller, Actg.
W. H. Rutledge
J. K. Cole (10)
T. M. Jordan-Culler (2)
L. W. Young (2)
C. W. PetersonH. S. Morgan
R. K. Thomas
W. C. Nickel]
C. A. Yarnall
Central Technical Files, 8940-2
Technical Library, 4414
Review & Approval Desk, 12690For DOE/OSTI