Embed Size (px)
Citation preview

F A Q’s Section 1: What is Autochartist?
1.1 What is Autochartist? 1.2 Benefits 1.3 Historical Data
Section 2: Getting Started with Autochartist 2.1 How do I access the Autochartist Application? 2.2 How do I register on Autochartist’s website? 2.3 The Autochartist Application Interface 2.4 Language 2.5 Timezone 2.6 Basic New Search 2.7 New Pattern Alerts 2.8 Price Graph Information 2.9 Quality Indicators 2.10 Advanced New Search 2.11 Adding Symbols to Searches 2.12 Fibonacci Quality Indicators 2.13 Forecast Zone Section 3: Autochartist Product Suite Information 3.1 Markets 3.2 Instruments 3.3 Chart Pattern Types 3.4 Fibonacci Pattern Types 3.6 Autochartist vs buy/sell signals 3.9 Time Delays 3.10 MT4 Plugin Section 4: Autochartist Educational Resource Centre Information 4.1 Autochartist User Manual & Intro Guide 4.2 Autochartist Introductory Videos 4.3 Autochartist Webinar Information 4.4 Difference: Emerging vs Complete Chart Patterns 4.5 Trading Emerging Patterns 4.6 Stop-loss and Take-Profit Levels Section 5: Autochartist Technical and Account Support 5.1 Contact Us 5.2 Mobile & MAC Compatability 5.3 Operating Systems 5.4 Connection Requirements 5.5 Autochartist on Multiple Computers 5.6 Third Party Trading Platforms 5.7 E-mail & SMS Alerts 5.8 Alert Function Down 5.9 Alert Function Components 5.10 Alert ON/OFF 5.11 “Unknown Error” 5.12 Clearing Browser Cache
Section 1: What is Autochartist?
1.1 What is Autochartist?
Autochartist is a trading tool which automatically identifies chart and Fibonacci pattern formations. These patterns are distributed to traders in real time via a web interface. Autochartist monitors thousands of financial instruments 24 hours per day automatically uncovering trade opportunities, and alerting users to these opportunities as they occur. This saves traders time. Autochartist scans Forex markets from 15 minutes to the daily chart timeframes. The Autochartist interface is highly customizable whereby traders can filter out any unwanted data to only look at the markets and timeframes of interest. 1.2 What do I get from Autochartist that I cannot get in my standard MetaTrader 4 Platform?
Automatic notification via audio and visual alerts of emerging and completed Chart and Fibonacci Patterns. Completed patterns are accompanied by a unique Forecast Zone which highlights potential price targets that the
breakouts may achieve with a 70% accuracy rate. Autochartist saves traders time and effort. Pre-drawn charts are easily understood as support and resistance levels are clearly illustrated. Autochartist allows newer traders to incorporate technical analysis into their trading plans, while offering experienced
traders the scanning functionality which saves time and highlights trade opportunities
1.3 Can I use Autochartist to Analyse Historical Data?
Autochartist cannot be used to analyze historical data. It can still be used when the market is closed and you also have the ability to look at Chart Patterns from a month prior to the current date.

Section 2: Getting Started with Autochartist
2.1 How do I access the Autochartist Application? The Autochartist technology is included in all new BESTDirect MT4 downloads. So anyone that downloads the platform from today forward already has it. For those that already downloaded the platform, they can click on the this link to install it. http://pfgbest.autochartist.com/AutochartistPFGBESTMT4Setup.exe 2.3 What do the areas on the web interface represent? The layout of the web interface consists of 8 separate areas:
A: Analysis Toolbar E: Results Pane (Emerging Patterns) B: Pattern Display C: Search Pane G: Research, Education & Product Support Pane D: Results Pane (Completed Patterns) H: Sound Switch 2.4 What languages does Autochartist support? English German
G
ED
C
B
A
H

Japanese French Simple Chinese Spanish Russian Portuguese Swedish Arabic Italian Greek 2.5 What Timezone is the Autochartist Application in? Please note that the Autochartist Application can be adjusted to your preferred timezone here:
2.6 How do I search for a new pattern? In the search pane (C ) you will find a list of default searches when you login for the first time. Each new search you make is created specifically either for Chart or Fibonacci patterns. To perform a basic “New Search” click on the “New Search”
button in the Search Pane . A separate window will pop up in which to define your search.
Search Type: This section allows users to choose a Group by clicking on the drop down list. You may either choose a pre-defined group of symbols, or you can select a custom list of symbols for your search. For groups, simply select the “Group” option from the radio button and choose from the drop down list of groups. To search for specific symbols choose the
“Symbol” option, add your preferred symbols and select the relevant time granularities you would like to view. Click “Add” after entering each symbol. Search Name: Your search name should be given a meaningful name, just as you would give a descriptive file name to an important document when saving it. The name of the search will be displayed under the relevant pattern heading in the Search Pane. 2.7 How do I know when a new pattern has been found? When new patterns are found, this icon appears next to the search name, as well as next to the analysis type (Chart
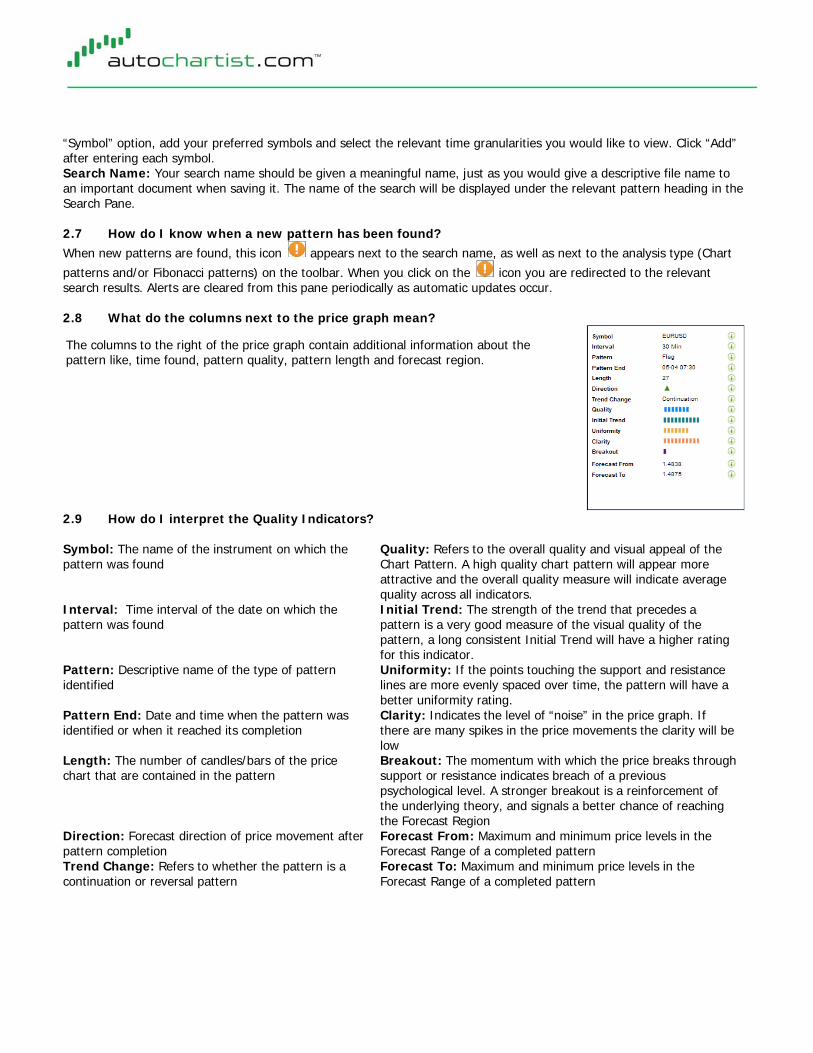
patterns and/or Fibonacci patterns) on the toolbar. When you click on the icon you are redirected to the relevant search results. Alerts are cleared from this pane periodically as automatic updates occur. 2.8 What do the columns next to the price graph mean?
2.9 How do I interpret the Quality Indicators? Symbol: The name of the instrument on which the pattern was found
Quality: Refers to the overall quality and visual appeal of the Chart Pattern. A high quality chart pattern will appear more attractive and the overall quality measure will indicate average quality across all indicators.
Interval: Time interval of the date on which the pattern was found
Initial Trend: The strength of the trend that precedes a pattern is a very good measure of the visual quality of the pattern, a long consistent Initial Trend will have a higher rating for this indicator.
Pattern: Descriptive name of the type of pattern identified
Uniformity: If the points touching the support and resistance lines are more evenly spaced over time, the pattern will have a better uniformity rating.
Pattern End: Date and time when the pattern was identified or when it reached its completion
Clarity: Indicates the level of “noise” in the price graph. If there are many spikes in the price movements the clarity will be low
Length: The number of candles/bars of the price chart that are contained in the pattern
Breakout: The momentum with which the price breaks through support or resistance indicates breach of a previous psychological level. A stronger breakout is a reinforcement of the underlying theory, and signals a better chance of reaching the Forecast Region
Direction: Forecast direction of price movement after pattern completion
Forecast From: Maximum and minimum price levels in the Forecast Range of a completed pattern
Trend Change: Refers to whether the pattern is a continuation or reversal pattern
Forecast To: Maximum and minimum price levels in the Forecast Range of a completed pattern
The columns to the right of the price graph contain additional information about the pattern like, time found, pattern quality, pattern length and forecast region.

2.10 I’d like to further refine my search how do I go about it? The “Advanced Search” function is located just below the Basic Search Area:
To create an “Advanced Search” click on the Advanced Search link. After completing the same steps as in the basic “New Search” section, further refine your search by selecting from an existing list of criteria: Price Range, Direction, Trend Change, Minimum Pattern Length and several Quality Indicators. 2.11 How do I add Symbols to a search? - On the home screen click on new search - Then click on the drop-down menu next to symbol and choose your preference - In the textbox next to symbol type in the currency pair you would like to see (i.e. EUR CAD) - Click on the drop-down menu next to symbol and choose your time period - Click on add - Then click on create search A new screen will appear with your specified requirements. 2.12 What do the Fibonacci Quality Indicators represent? Clarity: indicates the level of “noise” in the price graph. Time Symmetry: refers to the degree to which time differences between turning points follow the same Fibonacci ratios found in price levels. Price Symmetry: refers to the degree to which the identified ratios match the theoretical Fibonacci ratios, within some margin of error.

2.13 Why is the Forecast Zone missing for Emerging Patterns? Emerging patterns provide traders with early notification of potential trading opportunities – a pro-active set-up. A Chart Pattern is defined as being completed when the price has broken through the identified support or resistance level. This type of movement is more suited for the breakout trader. A pattern is defined as emerging if it has not yet fulfilled the criteria to be regarded as complete. These patterns provide a useful early indication of potential trend trading opportunities but are more suited for traders who want to take advantage of support and resistance levels. Only complete patterns have a Forecast Zone – a re-active trading set up. Section 3: Autochartist Product Suite Information
3.1 Which markets are supported by Autochartist? Autochartist currently supports Forex.
3.2 Which Groups of Instruments does Autochartist support? The groups included are listed on your dealing platform. 3.3 What Chart Pattern Types does Autochartist alert to? Autochartist alerts to 16 different chart pattern types:

3.4 Which Fibonacci Patterns does Autochartist find? There are 6 types of Fibonacci Patterns that Autochartist alerts to:
3.6 Does Autochartist provide buy/sell signals? Autochartist does not tell you whether to buy or sell. The system alerts traders to emerging and complete chart and Fibonacci patterns. In addition, forecast zones are plotted automatically on complete patterns. These forecast zones are drawn as grey areas on complete patterns and are based on the attributes of the pattern, together with the predicate of the underlying theory. 3.9 Why is there a delay in receiving some Chart Pattern alerts? Autochartist works with a minimum candle length of 15 minutes (and 30 minute minimum for some instruments), there is a potential 15 or 30 minute delay (or longer, depending on the candle length) for ticks occurring at the "start" of the candle, as we can only process a candle when it completes. There is also a further maximum delay of about 5~6 minutes (though this is usually about 2~3 minutes) for all the processing to run once the candle completes (e.g processes to identify and deliver the new patterns). 3.10 Where and how can I download the Autochartist MT4 Plugin? Step 1: Download the MT4 Plug-in from this link:
http://pfgbest.autochartist.com/AutochartistPFGBESTMT4Setup.exe
The plug-in is available in the following languages: English, Spanish, French, Indonesian, Turkish or Russian.

Step 2: Log in with the username and password e-mailed to you upon registration on the Autochartist website Step 3: In MT4 go to: Tools | Options | Expert Advisors Step 4: Check “Allow DLL Imports” Step 5: Do NOT check “Confirm DLL Function Call” Step 6: Check “Allow External Expert Imports” Step 7: Click OK Step 8: In the Navigator window, under Custom Indicators you will see the following:
Step 9: To apply one of the three indicators above, drag and drop the indicator onto a graph of one of the following time
granularities: 15mins; 30mins; 1hr; 4hrs; Daily
Select the Metatrader folder you would like to install the plug-in to:
- Autochartist Chart Patterns - Autochartist Fibonacci
Patterns

Section 4: Autochartist Educational Resource Centre Information
4.1 Where can I find an Autochartist User Manual? The Autochartist User Manual is available on the web application, alternatively click on the link below: http://direct.autochartist.com/aclite_static_files/Autochartist_User_Guide.pdf To view the Autochartist User Manual in Russian which is also available on the web application please click on the link below: http://direct.autochartist.com/aclite_static_files/Autochartist_User_Guide_RU.pdf For the Intro Guide – a comprehensive tutorial which takes traders of all levels through educational articles with examples of how to apply the Autochartist service to your day to day trading click here: http://direct.autochartist.com/aclite_static_files/Autochartist_Intro_Guide.pdf To view the Autochartist Intro Guide in Russian which is also available on the web application please click on the link below: http://direct.autochartist.com/aclite_static_files/Autochartist_Intro_Guide_RU.pdf 4.2 Where can I find information to teach me how to use the Autochartist Application? Tutorial Videos are located at www.pfgbest.com/autochartist 4.3 Where do I find a recording/video of the webinars held? Kindly go to: http://www.pfgbest.com/webinar/archive.asp 4.4 What is the difference between an emerging and complete Chart Pattern? A pattern is identified as emerging if it has not yet fulfilled the criteria to be regarded as complete. These patterns provide a useful early indication of potential trading opportunities. They represent partially complete pattern formations that, once completed, would adhere to the underlying theory. Most emerging patterns do not complete, however, this means that the price moved in such a way that the graph no longer represents the valid pattern. Emerging Chart Patterns are detected when the price is trading between support and resistance levels, but has not yet broken out in the direction anticipated by the pattern.

A Chart Pattern is defined as being completed when the price has broken through the identified support or resistance level.
In emerging Fibonacci Patterns, the price level of the final turning point of the pattern has not been reached yet. This is because it is only a theoretical possibility when the pattern is recognized. If the price graph does not make a turning point at the same price as the theoretical turning point, the Fibonacci Pattern will no longer be valid.
4.5 How do I trade Emerging Patterns? Emerging pattern traders – pro-active trade set up traders are provided with opportunities to select the best setup that suits their risk profile and trading style. To be successful in trading Emerging Patterns you must learn the characteristics of the various Chart Patterns such as Channels and Triangles. Become familiar with the support and resistance lines that create the Channel and that they are parallel, thereby allowing the swings inside the Channel to move in more uniform size. Facts like the support and resistance lines of a Triangle are converge is beneficial, it means that the swings from support and resistance will be smaller and therefore offer limited price movement. http://www.autochartist.com/discussion-of-the-benefits-of-emerging-patterns-%e2%80%93-proactive-trade-set-ups/ 4.6 Where should I set my Limits and Stops?

In completed Chart Patterns a Forecast Region is plotted automatically which provides a potential range for the price to reach. This is displayed visually on the Autochartist Application in a grey block on the chart. It remains the responsibility of the trader to decide whether the pattern is of a high enough quality to enable it to reach the forecast price range.
Section 5: Autochartist Technical & Account Support
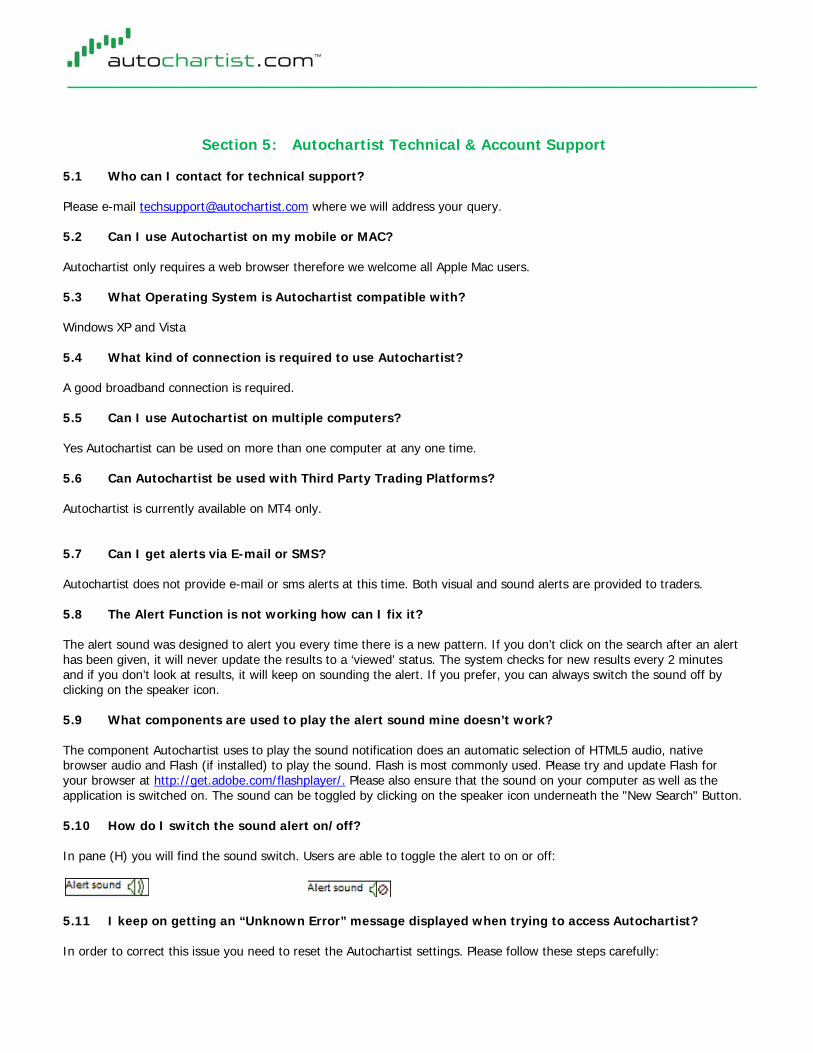
5.1 Who can I contact for technical support? Please e-mail [email protected] where we will address your query. 5.2 Can I use Autochartist on my mobile or MAC? Autochartist only requires a web browser therefore we welcome all Apple Mac users. 5.3 What Operating System is Autochartist compatible with? Windows XP and Vista 5.4 What kind of connection is required to use Autochartist? A good broadband connection is required. 5.5 Can I use Autochartist on multiple computers? Yes Autochartist can be used on more than one computer at any one time. 5.6 Can Autochartist be used with Third Party Trading Platforms? Autochartist is currently available on MT4 only. 5.7 Can I get alerts via E-mail or SMS? Autochartist does not provide e-mail or sms alerts at this time. Both visual and sound alerts are provided to traders. 5.8 The Alert Function is not working how can I fix it? The alert sound was designed to alert you every time there is a new pattern. If you don’t click on the search after an alert has been given, it will never update the results to a ‘viewed’ status. The system checks for new results every 2 minutes and if you don’t look at results, it will keep on sounding the alert. If you prefer, you can always switch the sound off by clicking on the speaker icon. 5.9 What components are used to play the alert sound mine doesn’t work? The component Autochartist uses to play the sound notification does an automatic selection of HTML5 audio, native browser audio and Flash (if installed) to play the sound. Flash is most commonly used. Please try and update Flash for your browser at http://get.adobe.com/flashplayer/. Please also ensure that the sound on your computer as well as the application is switched on. The sound can be toggled by clicking on the speaker icon underneath the "New Search" Button. 5.10 How do I switch the sound alert on/off? In pane (H) you will find the sound switch. Users are able to toggle the alert to on or off:
5.11 I keep on getting an “Unknown Error” message displayed when trying to access Autochartist? In order to correct this issue you need to reset the Autochartist settings. Please follow these steps carefully:

1) Start | Run 2) Type the word "regedit" into the space provided 3) In the tree on the left, browse to HKEY_CURRENT_USER | Software | ChartPatterns | Searches 4) On the right panel, select all the keys and delete them 5) Then restart Autochartist. 5.12 How do I clear my Browser cache? Internet Explorer: Tools | Delete Browsing History Select "Temporary Files" and "Cookies"
Firefox: Tools | Clear Recent History Select "Everything" under the period option, then select "Cookies" and "Cache"
Google Chrome: Options | Under the hood | Clear Browsing Data Select "Empty Cache", "Delete cookies", and "Everything" under the period option.
Safari: Click on Settings | Reset Safari | Clear History | Empty Cache
5.13 What is the difference between the trial and paid version of the Autochartist Application? The demo version is delayed up to 5 candles.