Embed Size (px)
Citation preview

oceanservice.noaa.gov/education 1
Estuaries Eyes on the Estuaries | Lesson Plan
ESTUARY LESSON PLAN
Eyes on the Estuaries
FocusMonitoring Living Resources in Estuaries
Grade Level9-12
Focus Question How can we monitor and compare living resources in U.S. estuaries?
Learning Objectives • Students will retrieve and interpret data on the distribution
of selected estuarine animals at various stages in the life his-tory of these animals and relate these distributions to salinity conditions.
• Students will compare the distribution of selected species in two or more estuaries, and to draw inferences about the ecol-ogy of these estuaries.
Materials Needed • copies of “ELMR Database Worksheet,” one copy for each
student group• (optional) Computers with internet access; if students do
not have access to the internet, download copies of materials cited under “Learning Procedure” and provide copies of these materials to each student or student group
• a spreadsheet program such as Microsoft Excel®
Audio/Visual Materials Needed None
Teaching Time One or two 45-minute class periods, plus time for student research

Eyes on the Estuaries | Lesson Plan Estuaries
2 oceanservice.noaa.gov/education oceanservice.noaa.gov/education 3
Estuaries Eyes on the Estuaries | Lesson Plan
Seating Arrangement Groups of 3 - 4 students
Maximum Number of Students 30
Key WordsEstuary
Background Information Coastal ecosystems provide many benefits to human com-munities, including food, ports, recreational opportunities, habitats for diverse plant and animal life, and minerals. More than half of the U.S. population lives near a coast, and about one of every six jobs in the U.S. is related to coastal or marine resources. Because these systems are vulnerable to stress from natural processes and human activity, the National Ocean Service (NOS) has a variety of programs designed to protect coastal resources and the opportunities they provide. Two of the basic requirements for providing this protection are:
• The ability to recognize change in coastal resources; and • The ability to distinguish normal variations from changes
that may signal significant problems. Coastal monitoring programs provide the information needed to recognize and interpret changes in coastal resources.
“Coastal monitoring” refers to periodic measurements of physical, chemical, biological, and meteorological factors that may affect the use and quality of coastal resources. For example, such factors may include temperature, salinity, pres-ence of chemical contaminants, biological species, life stages of these species (eggs, juveniles, adults, etc.), rainfall, and storm events. NOS supports 28 different monitoring systems to provide key pieces of information needed to protect marine resources and control the ways in which they are used. These programs fall into four classes that represent different geo-graphic scales.
The first class includes measurements of environmental fea-tures over large geographic areas using sensors or instruments on airplanes, satellites, and ships. These features include dis-tribution of habitat types or land cover, algal blooms, water

Eyes on the Estuaries | Lesson Plan Estuaries
2 oceanservice.noaa.gov/education oceanservice.noaa.gov/education 3
Estuaries Eyes on the Estuaries | Lesson Plan
depth, shoreline location, and land topography. The second class includes physical, chemical, biological, and meteorological measurements at specific sites. These measure-ments are made periodically and are usually intended to pro-vide information on specific resources or environmental stress-es. Measurements include currents, water quality and weather in 26 National Estuarine Research Reserves, contaminants in sediments and bivalve molluscs at 250 sites, and water level measurements used to predict tides.
The third class includes intensive and frequent measurements of environmental conditions at a few locations of particular importance. These include coral reef ecosystems, 13 National Marine Sanctuaries, sites where there is a high potential for substantial environmental degradation (Narragansett Bay, Chesapeake Bay, and San Francisco Bay are among more than 280 sites being monitored) and real-time measurements of water levels, currents, and other oceanographic conditions in 10 U.S. ports including New York/New Jersey Harbor, Houston/Galveston Bay, Los Angeles/Long Beach, and the Port of Anchorage.
The fourth class includes monitoring activities that are focussed on a single physical location, ecosystem, or oil spill sites. The Everglades, Chesapeake Bay, and the M/V Selendang Ayu oil spill site in Alaska are among the areas included in this part of the NOS monitoring program.
This activity focuses on information contained in the NOS Estuarine Living Marine Resources (ELMR) Database. The ELMR Program was established to develop baseline informa-tion on ecologically and economically important fishes and invertebrates in U.S. estuaries. The database includes informa-tion on the distribution, relative abundance, and life history characteristics of 153 species found in 122 estuaries and coastal embayments on the Pacific, Atlantic, and Gulf of Mexico coasts. In this lesson, students will use the ELMR Database to com-pare characteristics of selected species in two or more estuaries, and to draw inferences about the ecology of these estuaries.

Eyes on the Estuaries | Lesson Plan Estuaries
4 oceanservice.noaa.gov/education oceanservice.noaa.gov/education 5
Estuaries Eyes on the Estuaries | Lesson Plan
Learning Procedure 1. Decide which estuaries and which species within these estuar-ies will be assigned to each student group. If the same estuar-ies and species are assigned to each group, it will be easier for students to compare their results with those of other groups. On the other hand, assigning each group a different set of estuaries and species will provide greater variety, as well as ensure that each group does their own work; but this will also require more advance preparation by the teacher.
The key consideration is that the assigned species must be present in both assigned estuaries to permit comparison between the two sites. If the assigned estuaries are from differ-ent regions (Mid-Atlantic, South Atlantic, etc.) there is greater likelihood that there will be noticeable differences in the eco-logical characteristics of at least some of the species found in both locations. The best way to make these decisions is to visit the ELMR Database at http://www8.nos.noaa.gov/biogeo_public/elmr.aspx, and scan through the data for estuaries that you think may be suitable to get an idea of the species for which data are available. You may want to include one or two invertebrate species as well as fishes for each student group. For example, the following species are among those that could be compared in the Winyah Bay and Chesapeake Bay estuaries:
AlewifeAmerican EelAmerican ShadAtlantic CroakerAtlantic MenhadenAtlantic SturgeonBay AnchovyBlack DrumBlue CrabBrown ShrimpDaggerblade Grass ShrimpEastern OysterPinfishQuahogRed DrumSpot

Eyes on the Estuaries | Lesson Plan Estuaries
4 oceanservice.noaa.gov/education oceanservice.noaa.gov/education 5
Estuaries Eyes on the Estuaries | Lesson Plan
Summer FlounderWeakfish
2. Discuss the importance of living estuarine resources and some of the sources of stress that may threaten these resources. Students should realize that stress may result from natural pro-cesses (such as storms, drought, or disease) as well as human activity such as coastal development, heavy industry, or oil spills. Be sure students understand that many organisms are adapted to withstand natural stresses, but may not be able to tolerate these stresses if they are also exposed to stress from human activities. Discuss the importance of being able to rec-ognize change in populations of estuarine organisms and of being able to separate normal variability from unusual change. Both of these capabilities depend upon having “baseline” information about species of interest that can be compared with new information from periodic monitoring of these species.
Tell students that their assignment is to prepare a written report in which they summarize baseline information about selected species in two (or more) estuaries, and use this infor-mation to draw inferences about the ecology of these species. Be sure students understand that the primary purpose of the ELMR Database is to provide a reference point for each estu-ary that can be used to analyze future monitoring data from the SAME estuary. These reference data, though, can also provide information about variations in the life history of individual species in different estuaries.
3. Assign each student group at least three species in at least two different estuaries, and provide each group with a copy of the “ELMR Database Worksheet.”
4. Have each student group present an oral summary of their analyses and inferences based on steps 7 and 8 on the Worksheet. Students should understand that a defining charac-teristic of all estuaries is variable salinity, and that this charac-teristic can offer advantages to species that can tolerate a range of salinities. At a minimum, student analyses should accurate-

Eyes on the Estuaries | Lesson Plan Estuaries
6 oceanservice.noaa.gov/education oceanservice.noaa.gov/education 7
Estuaries Eyes on the Estuaries | Lesson Plan
ly summarize abundance data for each of the five life stages, as well as the salinity ranges in which these stages were found. Inferences should include ideas about how these data may reflect reproductive strategies.
In a discussion of the Winyah Bay alewife data, for example, students should recognize that this species spawns through-out the spring, so eggs and spawning adults are most com-mon during March, April, and May. As the eggs develop, lar-vae appear and are abundant through June. Juveniles appear somewhat later and remain abundant through November. Students may infer that eggs and larvae do not tolerate salini-ties above 0.5 ppt, or may hypothesize that these life stages inhabit low-salinity waters to avoid predators that require higher salinities. The latter hypothesis is supported by the observation that spawning adults were found only in waters with salinity of 0 - 0.5 ppt, even though non-spawning adults were equally abundant in all three salinity ranges. In addition, juveniles appear to expand their salinity range as they grow older. The absence of any life stages during December through February may suggest that alewife use estuaries primarily as spawning and nursery areas, and live in farther from shore during the winter months.
Severe storms or prolonged droughts may alter the salinity distribution within an estuary. Reductions in freshwater flow caused by droughts or seawater driven into estuaries by storm winds could both cause higher-than-normal salinities. This could be fatal for life stages of species that are confined to low salinity waters (such as the eggs, larvae, and young juveniles of alewife).
These patterns will vary, depending upon the estuary and species. White shrimp adults and juveniles, for example, are found in the Winyah Bay estuary throughout the year, though larvae of this species are only present from May through September. No eggs or spawning adults of this species were observed in any month, which might mean that spawning occurs elsewhere or more likely that these stages were missed by the sampling program that produced the data.

Eyes on the Estuaries | Lesson Plan Estuaries
6 oceanservice.noaa.gov/education oceanservice.noaa.gov/education 7
Estuaries Eyes on the Estuaries | Lesson Plan
The Bridge Connection http://www.vims.edu/bridge/ – In the “Site Navigation” menu on the left, click on “Ocean Science Topics,” then “Habitats,” then “Estuary” for links to resources about estuaries.
The Me Connection Have students write a brief essay describing a monitoring pro-gram for an ecosystem in their own community that is person-ally important. Essays should include an explanation of why this system is important (reasons could include ecological, economic, or aesthetic values, or a combination of these), what factors would be monitored, and how frequently monitoring should be done.
Extensions Visit http://www.epa.gov/owow/estuaries/monitor/ for an online manual for Volunteer Estuary Monitoring, as well as informa-tion on the ecology of estuaries and how they are threatened.
Resources http://www.epa.gov/owow/estuaries/kids/ – Games and activities
about estuaries produced through the National Estuary Program
http://www.onr.navy.mil/focus/ocean/ – Oceanography site from the Office of Naval Research including online quizzes and activities. See the “Habitats” section for information and activities about estuaries.
http://www.ncnerr.org/education/estnet/index.html – “Estuary-Net Project;” an online project for grades 9-12 to help solve non-point source pollution problems in estuaries and their watersheds
National Science Education Standards Content Standard A: Science as Inquiry
• Abilities necessary to do scientific inquiry• Understandings about scientific inquiry
Content Standard C: Life Science• Interdependence of organisms• Behavior of organisms

Eyes on the Estuaries | Lesson Plan Estuaries
8 oceanservice.noaa.gov/education oceanservice.noaa.gov/education 9
Estuaries Eyes on the Estuaries | Review
Content Standard E: Science and Technology • Abilities of technological design• Understandings about science and technology
Content Standard F: Science in Personal and Social Perspectives
• Personal and community health• Natural resources• Environmental quality• Natural and human-induced hazards• Science and technology in local, national, and global chal-
lenges

oceanservice.noaa.gov/education �
estuarine researchreserves
Estuaries Eyes on the Estuaries | Review
ESTUARY WORKSHEET
ELMR Data Base Worksheet The ELMR Data Base includes data on selected fish and inver-tebrate species in 122 estuaries along the coastlines of the United States. Each estuary is divided into one to five salinity zones. In each zone, data are provided for the relative abun-dance of five life stages for each of the selected species that are present. These life stages are adults, eggs, juveniles, larvae, and spawning adults. Data for each life stage for each species are provided for each of twelve months. Relative abundance is represented by a scale from 0 to 5: 0 = not present 2 = rare 3 = common 4 = abundant 5 = highly abundantAn entry of “.” means that no data are available.
Your assignment is to compare data for certain species in two or more estuaries assigned by your teacher. For each assigned species, you should find out:
• In what months is each of the five life stages present, and in what months is each stage most abundant?
• In what salinity range is each of the five life stages found during the months that it is most abundant?
The easiest way to make these comparisons is to download the necessary data, and import these data into a spreadsheet program that will allow you to sort, summarize, and graph them. Here’s how to retrieve ELMR data and import them into Microsoft Excel® using the Winyah Bay estuary as an example:
1. Open the ELMR Data Base at http://www8.nos.noaa.gov/biogeo_public/elmr.aspx/.
2. Select the “Region” that includes the estuary you are inter-ested in (SOUTHEAST), then the appropriate estuary name in the “Estuary” window (WINYAH BAY). You can confine your search to specific Species, Life Stages, and Salinity Zones, or just leave “All” selected in these windows. For

10 oceanservice.noaa.gov/education
Eyes on the Estuaries | Review Estuaries
now, leave “All” selected. Click the “Save As Text” but-ton. The file will be saved onto your hard drive as a “zip” archive.
3. Unzip the downloaded data file, and open it in Microsoft Excel®. You will get the Text Import Wizard. Step 1. Select “Delimited,” “Start Import at Row: 1,” and
the operating system you are using next to “File Origin.” Click “Next.”
Step 2. Select “Delimiters: Tab” and “Text Qualifier: “. ” Click “Next.”
Step 3. Click the “General” button under “Column Data Format.” Click “Finish.”
4. You now have a spreadsheet with all of the data for Winyah Bay. Now, you need to make a few adjustments to this spreadsheet to make it easier to analyze:a. Highlight columns B and C. Under the “Format” menu,
select “Column” and then “Width.” Change the width of columns B and C to “20” or 2 inches.
b. Highlight columns E through P. Under the “Format” menu, select “Column” and then “Width.” Change the width of columns E through P to 5 or 0.5 inch.
c. Highlight all cells by clicking on the empty cell in the upper left corner. Under the “Data” menu click “Sort.” Check the box next to “Header Row” under “My list has.” Under “Sort By” select “Common Name.” Under “Then by” select “LifeStage.” Click “OK.
5. Prepare data summary graphs for each of your assigned spe-cies as follows:a. Highlight all cells in columns C through P for all Life
Stages of the species you are analyzing. For this example, suppose “Alewife” is one of your assigned species; so you would highlight cells C2 through P16
b. Click on the Chart Wizard icon. Select “Column” under “Chart type” and the upper left icon under “Chart sub-type.” Click “Next.”
c. Click the button next to “Rows” under “Series in.” Click the “Series” tab, and remove all life stages except

oceanservice.noaa.gov/education 11
Estuaries Eyes on the Estuaries | Review
“Adults” and “Spawning.” Click “Next.” Click “Next.”d. Click the “Titles” tab. Enter a title for your chart (such as
“Alewife Adults and Spawning”). Enter “Month” in the “Category (X) axis:” box and “Abundance” in the “Value (Y) axis:” box. Click “Next.”
e. Click the button next to “As new sheet” and enter the name that you want to appear on the tab for your chart in the spreadsheet workspace. Click “Finish.” You now have a column chart that shows the relative abundance of ale-wife adults, and spawning adults in each salinity zone for each month.
f. If you want to print your chart and do not have a color printer, you may want to change the column fills to black and white patterns. To do this, double click on one of the columns on your chart. The “Format Data Series” dia-logue box will open. Click on the “Patterns” tab, then the “Fill Effects” button under “Area.” Click the “Pattern” tab. Select black in the window under “Foreground:” and white in the window under “Background:” Windows con-taining the various pattern options should appear under “Pattern:” Select the pattern you want, be sure it looks OK in the “Sample” box, then click “OK.” Click “OK” in the “Format Data Series” dialogue box. The column on your chart should now contain a black-and-white fill pat-tern. Repeat these steps for the other columns.
g. Repeat steps a. and b. Click the button next to “Rows” under “Series in.” Click the “Series” tab, and remove “Adults” and “Spawning” life stages. Click “Next,” and repeat steps d. and e. You now have a second column chart that shows the relative abundance of alewife eggs, larvae, and juveniles in each salinity zone for each month. Adjust the column fills if necessary.
6. Use your chart to find out:a. When are spawning adults most abundant?b. When are eggs most abundant?c. When are larvae most abundant?d. When are juveniles most abundant?e. When are adults most abundant?f. Are any of these life stages more abundant in certain salin-
ity zones?

12 oceanservice.noaa.gov/education
Eyes on the Estuaries | Review Estuaries
For the Winyah Bay alewife example, adults and spawn-ing adults are most abundant in March, April and May; eggs are most abundant in March, April and May; larvae are most abundant in March, April, May and June; juve-niles are abundant from April through November. Notice that all life stages of alewife are absent from December through February. Different life stages of alewife appear to have different salinity preferences. Alewife eggs and larvae are found only in salinities of 0 - 0.5 ppt. Juveniles are also confined to this salinity zone during April, May, June, and July; but are found in the 0.5 - 25 ppt salinity zone between August and November, and in the >25 ppt zone between September and November. Alewife adults are found in all three salinity zones, but spawning adults are only found in the 0 - 0.5 ppt zone.
7. Discuss possible reasons for seasonal variations in the abundance of different life stages. What effect could severe storms or prolonged drought have on your assigned spe-cies?

ESTUARY SELF TEST
Crossword Puzzle No. 1
Estuaries Self Test | Crossword
oceanservice.noaa.gov/education 13
4
7 8
3
9 10
5
2
6
1
11
12
1716
18
13
15
14
19
21
23 24
22
20
25 26
30
27
28
29
31
32
33
14 oceanservice.noaa.gov/education
Self Test | Crossword Estuaries
oceanservice.noaa.gov/education 15
Estuaries Self Test | Crossword
ESTUARY SELF TEST
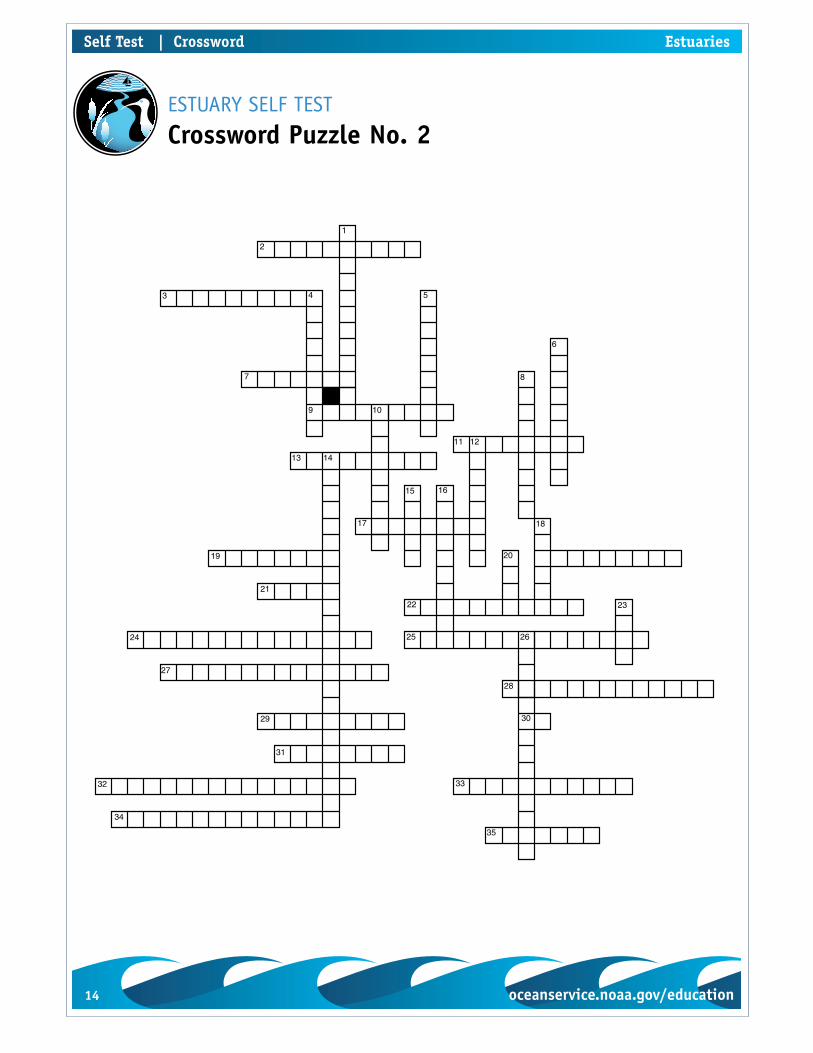
Crossword Puzzle No. 2
1
2
3 4 5
7
9 10
8
6
11 12
13 14
15 16
17 18
20
2322
21
19
24
27
29
31
32 33
34
35
30
28
25 26

14 oceanservice.noaa.gov/education
Self Test | Crossword Estuaries
oceanservice.noaa.gov/education 15
Estuaries Self Test | Crossword
Crossword Puzzle 1:Across
4. A __________ estuary occurs when river flow is low and tidally generated currents are moderate to strong. [two words]
7. Estuaries and their surrounding wetlands act as __________ that stabilize shorelines and protect coastal areas from floods, storm surges, and excessive erosion.
9. Estuaries with a sill are found in areas that were once cov-ered with __________.
13. __________ estuaries occur when a rapidly-flowing river discharges into the ocean where tidal currents are weak. [two words]
14. Estuaries filter out __________ from rivers and streams before they flow into the oceans
15. One reason that estuaries are so productive is that the water filtering through them brings in __________ from the surrounding watershed.
17. __________ estuaries are formed when the earth’s tectonic plates run into or fold-up underneath each other
19. __________ are a major influence on many estuaries.22. Estuaries formed by rivers or streams entering massive
lakes are called __________ estuaries.23. A __________ is characterized by large flat fan-shaped
deposits of sediment at the mouth of a river.26. An __________ is a partially enclosed body of water and its
adjancent habitats where saltwater from the ocean mixes with freshwater from rivers or streams.
27. __________ are areas in water that have equal salt concen-trations.
30. __________ estuaries are formed when rising sea levels flood existing river valleys. [two words]
31. __________ beaches and islands are formed by the accumu-lation of sand or sediments deposited by ocean waves.
32. __________ estuaries are characterized by barrier beaches or islands that form parallel to the coastline and separate the estuary from the ocean. [two words]
33. In the ocean the concentration of salts, or __________, averages about 35 parts per thousand
Down1. __________ are fundamental life support processes upon
which all organisms depend. [two words]

16 oceanservice.noaa.gov/education
Self Test | Crossword Estuaries
oceanservice.noaa.gov/education 17
Estuaries Self Test | Crossword
2. Estuaries are often called __________ of the sea.3. Estuaries are typically classified based on how saltwater
and freshwater mix in the estuary and on their __________.5. Because freshwater flowing into the estuary is less ________
than water from the ocean, it often floats on top of the heavier seawater.
6. Tides at broad mudflats might appear to be __________ than tides at the end of a long, narrow inlet.
8. The first stage in the formation of a tectonic estuary typically occurs during __________.
10. The __________ determines the rate of freshwater that flows into an estuary from rivers and streams. [two words]
11. When a sill prevents deep waters in an estuary from mix-ing with deep waters of the sea, poor water exchange causes __________ (low oxygen) water to build up on the bottom of the estuary.
12. The shape of the isohalines indicates the amount of ______ that is occurring, and may provide clues about the estuary’s geology.
16. Estuaries provide habitat for more than 75 percent of the __________ harvested in the United States.
17. Salt marshes are a mosaic of snaking channels called _________________. [two words]
18. Most coastal plain estuaries in North America were formed at the end of the last __________. [two words]
20. __________ is a spongy matrix of live roots, decomposing organic material, and soil that helps filter pollutants out of the water.
21. Salt __________ are shallow depressions that contain very high concentrations of salt.
22. __________ are steep-walled river valleys created by advancing glaciers that later became flooded with seawater as the glaciers retreated.
24. Of the 32 largest cities in the world, 22 are located on __________.
25. A protected area of calm water between the coast and a barrier island is called a __________.
28. Estuaries provide critical __________ for many birds, fish, amphibians, insects, and other wildlife.
29. Waters whose salt content is between that of freshwater and that of seawater are called __________.

16 oceanservice.noaa.gov/education
Self Test | Crossword Estuaries
oceanservice.noaa.gov/education 17
Estuaries Self Test | Crossword
Crossword Puzzle 2:Across
2. Plants and animals that can tolerate a wide range of salini-ties are called __________.
3. Salt marshes are covered with salt-tolerant plants called __________.
7. In estuaries, salinity levels are generally ___________ near the mouth of a river where the ocean water enters.
9. __________ is related to the amount of sediment and other solids suspended in water.
11. During low tides, oysters close up their shells, stop feed-ing, and switch to __________ respiration.
13. As water temperature increases, the amount of oxygen that can dissolve in the water __________.
17. As they develop, blue crabs eventually return to the estu-ary as young crabs called __________.
19. __________ trees grow at tropical and subtropical latitudes, and can grow in anoxic soils where slow moving waters allow fine sediments to accumulate.
20. Plants and animals that can tolerate only slight changes in salinity are called __________.
21. __________ is a partnership program between NOAA and U.S. coastal states that protects more than one million acres of estuarine land and water.
22. Scientists can determine the density of phytoplankton and the amount of primary productivity by measuring ________.
24. __________ is one of the main components of peat and dominates the low marsh all the way up to the estuary’s edge. [two words]
25. The amount of __________ in an estuary’s waters is the major factor that determines the type and abundance of organisms that can live there. [two words]
27. Oxygen enters the water through two natural processes: diffusion from the atmosphere, and __________.
28. Bacteria, fungi, and other decomposer organisms reduce DO levels in estuaries because they consume oxygen while breaking down __________. [two words]
29. The amount of oxygen that can dissolve in water _________ as salinity decreases.
30. The chemical components in seawater resist large changes to __________.
31. Burrowing organisms such as clams, mussels, oysters, fiddler

18 oceanservice.noaa.gov/education
Self Test | Crossword Estuaries
oceanservice.noaa.gov/education 19
crabs, sand shrimp, and blood worms are typical of ________.32. __________ is a process through which toxic substances can
accumulate in the tissues of organisms that consume these substances.
33. The __________ colonizes the seaward side of mangals. [two words]
34. Many species of mangrove trees have aerial roots called __________ that take up oxygen from the air for the roots.
35. The zone where white mangrove and buttonwood trees grow is almost never __________.
Down1. Non-native species are often introduced to estuaries in the
__________ of ships. [two words]4. Some toxic substances become attached to __________ that
flow down rivers and get deposited in estuaries.5. Many mangals can be recognized by their dense tangle of
__________ that make the trees appear to be standing on stilts above the water. [two words]
6. A common natural disturbance to estuaries in non-tropical regions is __________. [two words]
8. __________ are disease-causing organisms.10. __________ are plants and animals that have found their
way into areas outside their normal range.12. __________ pollution is the single largest pollution prob-
lem effecting coastal waters of the United States.14. In most estuaries, the largest contributor of bacteria and
viruses is probably __________. [three words]15. A natural disturbance in salt marshes caused by the burial
of vegetation by rafts of dead floating plant material, called __________.
16. Mangrove seeds that begin growing while still attached to the parent plant are called __________.
18. It requires a lot of __________ to adapt to constantly chang-ing salinities.
20. The health of every National Estuary Reserve is continu-ously monitored by the __________.
23. Blue crab larvae called __________ require water with a salinity over 30 ppt for optimal development.
26. __________ is a type of pollution in which excess nutrients stimulate an explosive growth of algae which depletes the water of oxygen when the algae die and are eaten by bacteria.

18 oceanservice.noaa.gov/education
Self Test | Crossword Estuaries
oceanservice.noaa.gov/education 19
ESTUARY SELF TEST
Fill-in-the-Blank
1. An __________ is a partially enclosed body of water and its adjacent habitats where saltwater from the ocean mixes with freshwater from rivers or streams.
2. Waters whose salt content is between that of freshwater and that of seawater are called __________.
3. Of the 32 largest cities in the world, 22 are located on __________.
4. In the ocean the concentration of salts, or __________, aver-ages about 35 parts per thousand.
5. The salinity of estuarine water is __________ from one day to the next.
6. __________ are a major influence on many estuaries.
7. Most areas of the earth experience __________ high and low tides each day.
8. Tides at broad mudflats might appear to be __________ than tides at the end of a long, narrow inlet.
9. Every estuary is __________.
10. Estuaries are typically classified based on how saltwater and freshwater mix in the estuary and on their __________.
11. Estuaries formed by rivers or streams entering massive lakes are called __________ estuaries.
12. Estuaries are often called __________ of the sea.
13. Estuaries filter out __________ from rivers and streams before they flow into the oceans.
Estuaries Self Test | Fill-in-the-Blank

20 oceanservice.noaa.gov/education oceanservice.noaa.gov/education 21
14. Estuaries provide critical __________ for many birds, fish, amphibians, insects, and other wildlife.
15. Estuaries provide habitat for more than 75 percent of the __________ harvested in the United States.
16. __________ are fundamental life support processes upon which all organisms depend. [two words]
17. __________ is a spongy matrix of live roots, decomposing organic material, and soil that helps filter pollutants out of the water.
18. One reason that estuaries are so productive is that the water filtering through them brings in __________ from the surrounding watershed.
19. The entire land area that drains into a particular body of water, like a lake, river or estuary is called a drainage basin or __________.
20. Estuaries are some of the most fertile ecosystems on earth, yet they may also be one of the most __________.
21. Estuaries and their surrounding wetlands act as _______ that stabilize shorelines and protect coastal areas from floods, storm surges, and excessive erosion.
22. The __________ determines the rate of freshwater that flows into an estuary from rivers and streams. [two words]
23. __________ estuaries are formed when rising sea levels flood existing river valleys. [two words]
24. __________ estuaries are characterized by barrier beaches or islands that form parallel to the coastline and separate the estuary from the ocean. [two words]
25. __________ beaches and islands are formed by the accumu-lation of sand or sediments deposited by ocean waves.
Self Test | Fill-in-the-Blank Estuaries

20 oceanservice.noaa.gov/education oceanservice.noaa.gov/education 21
26. A __________ is characterized by large flat fan-shaped deposits of sediment at the mouth of a river.
27. __________ estuaries are formed when the earth’s tectonic plates run into or fold-up underneath each other.
28. __________ are steep-walled river valleys created by advancing glaciers that later became flooded with seawater as the glaciers retreated.
29. Most coastal plain estuaries in North America were formed at the end of the last__________. [two words]
30. A protected area of calm water between the coast and a barrier island is called a __________.
31. Bar-built estuaries and deltas both have large deposits of
__________.
32. The first stage in the formation of a tectonic estuary typi-cally occurs during __________.
33. __________ tend to have a moderately high input of fresh-water, but very little inflow of seawater.
34. When a sill prevents deep waters in an estuary from mix-ing with deep waters of the sea, poor water exchange causes __________ (low oxygen) water to build up on the bottom of the estuary.
35. Estuaries with a sill are found in areas that were once cov-ered with __________.
36. __________ create saltwater currents that move seawater into estuaries. [two words]
37. The daily mixing of freshwater and saltwater in estuaries leads to variable and dynamic chemical conditions, espe-cially __________.
Estuaries Self Test | Fill-in-the-Blank

22 oceanservice.noaa.gov/education oceanservice.noaa.gov/education 23
38. Because freshwater flowing into the estuary is less __________ than water from the ocean, it often floats on top of the heavier seawater.
39. The difference between the average low tide and the aver-age high tide is the __________. [two words]
40. __________ are areas in water that have equal salt concen-trations.
41. The shape of the isohalines indicates the amount of __________ that is occurring, and may provide clues about the estuary’s geology.
42. __________ estuaries occur when a rapidly-flowing river discharges into the ocean where tidal currents are weak. [two words]
43. In __________ estuaries, saltwater and freshwater mix at all depths. [two words]
44. A __________ estuary occurs when river flow is low and tid-ally generated currents are moderate to strong. [two words]
45. Freshwater estuaries are driven by __________.
46. Salt marshes are a mosaic of snaking channels called __________.
47. Salt __________ are shallow depressions that contain very high concentrations of salt.
48. Burrowing organisms such as clams, mussels, oysters, fid-dler crabs, sand shrimp, and blood worms are typical of __________.
49. Salt marshes are covered with salt-tolerant plants called __________.
50. __________ is one of the main components of peat and dominates the low marsh all the way up to the estuary’s edge. [two words]
Self Test | Fill-in-the-Blank Estuaries

22 oceanservice.noaa.gov/education oceanservice.noaa.gov/education 23
51. __________ trees grow at tropical and subtropical latitudes, and can grow in anoxic soils where slow moving waters allow fine sediments to accumulate.
52. Many mangals can be recognized by their dense tangle of __________ that make the trees appear to be standing on stilts above the water. [two words]
53. The __________ colonizes the seaward side of mangals. [two words]
54. The zones where white mangrove and buttonwood trees grow are almost never __________.
55. Plants and animals living in estuaries must be able to respond quickly to drastic changes in __________.
56. Plants and animals that can tolerate only slight changes in salinity are called __________.
57. Plants and animals that can tolerate a wide range of salini-ties are called __________.
58. It requires a lot of __________ to adapt to constantly chang-ing salinities.
59. Many species of mangrove trees have aerial roots called __________ that take up oxygen from the air for the roots.
60. Mangrove seeds that begin growing while still attached to the parent plant are called __________.
61. During low tides, oysters close up their shells, stop feed-ing, and switch to __________ respiration.
62. Blue crab larvae called __________ require water with a salinity over 30 ppt for optimal development.
63. As they develop, blue crabs eventually return to the estu-ary as young crabs called __________.
64. __________ disturbances are caused by humans.
Estuaries Self Test | Fill-in-the-Blank

24 oceanservice.noaa.gov/education oceanservice.noaa.gov/education 25
65. Large __________ are especially destructive to estuaries.
66. A common natural disturbance to estuaries in non-tropical regions is __________. [two words]
67. A natural disturbance in salt marshes caused by the burial of vegetation by rafts of dead floating plant material, is called __________.
68. The greatest human-caused threat to estuaries is their large-scale __________.
69. __________ is probably the most important threat to water quality in estuaries.
70. __________ is a process through which toxic substances can accumulate in the tissues of organisms that consume these substances.
71. Some toxic substances become attached to __________ that flow down rivers and get deposited in estuaries.
72. __________ is a type of pollution in which excess nutrients stimulate an explosive growth of algae which depletes the water of oxygen when the algae die and are eaten by bacte-ria.
73. __________ pollution is the single largest pollution prob-lem affecting coastal waters of the United States.
74. __________ are disease-causing organisms.
75. In most estuaries, the largest contributor of bacteria and viruses is probably __________. [three words]
76. __________ are plants and animals that have found their way into areas outside their normal range.
77. Non-native species are often introduced to estuaries in the __________ water of ships.
Self Test | Fill-in-the-Blank Estuaries

24 oceanservice.noaa.gov/education oceanservice.noaa.gov/education 25
78. __________ is a partnership program between NOAA and U.S. coastal states that protects more than one million acres of estuarine land and water.
79. The health of every National Estuary Reserve is continu-ously monitored by the __________.
80. As water temperature increases, the amount of oxygen that can dissolve in the water __________.
81. In estuaries, salinity levels are generally ___________ near the mouth of a river where the ocean water enters.
82. The amount of oxygen that can dissolve in water _________as salinity decreases.
83. The amount of __________ in an estuary’s waters is the major factor that determines the type and abundance of organisms that can live there. [two words]
84. Oxygen enters the water through two natural processes: diffusion from the atmosphere, and __________.
85. Bacteria, fungi, and other decomposer organisms reduce DO levels in estuaries because they consume oxygen while breaking down __________. [two words]
86. __________ is related to the amount of sediment and other
solids suspended in water.
87. The chemical components in seawater resist large changes to __________.
88. Scientists can determine the density of phytoplankton and the amount of primary productivity by measuring ________.
Estuaries Self Test | Fill-in-the-Blank

oceanservice.noaa.gov/education 27
ESTUARY SELF TEST
Word Bank
Estuaries Self Test | Word Bank
WORD BANKstenohalineeuryhalineenergypneumatophorespropagulesanaerobiczoeamegalopeanthropogenicstormswinter iceanoxicglaciershigh tidesbar builtbarrierdeltatectonicsmalleruniquegeologyestuarybrackishestuariessalinityvariabletidestwo freshwater nurseriespollutantshabitatfishecosystem servicesice agedecreases lagoons
sediment earthquakesfjordstidal creekspannesmudflatsnutrientswatershedSWMPpollutedbufferscoastal elevation coastal plain halophytessmooth cordgrassmangroveprop rootssalinitydensetidal rangeisohalineshighest mixingsalt wedgeslightly stratifiedvertically-mixed stormspeatred mangrovefloodedsalinitywrackconversionpollutionbiomagnificationsedimentseutrophication
nutrientpathogenscombined sewage overflows invasivesNERRSincreasesdissolved oxygenphotosynthesisorganic matterturbiditypHchlorophyll
26 oceanservice.noaa.gov/education