Embed Size (px)
Citation preview
Kon Wai SengMarine Lubricants Field EngineerAsia Pacific South
March 2017
ExxonMobilMarine Lubricants

• Cylinder Lubrication Basics• Industry Trends• OEM Guidelines• Cylinder Condition Monitoring
(CCM)
Agenda
2
Cylinder Lubrication Basics

• Reduce friction
• Reduce wear
• Reduce temperature
• Carry away contaminants and debris
• Reduce corrosion
Function of Cylinder Lubrication
4

Sulfur(from Fuel)
Reducing Corrosion
5
Sulfur Oxides (SO2, SO3)
Water
Oxygen
Sulfurous and Sulfuric Acid
Base Number (BN)• Ability to neutralize acid
↑ Sulfur
↑ Oxygen
↑ Water
↑ Cylinder lube oil BN

Industry Trends

Regulatory emissions changes – All shipsSulfur oxide (SOx) emissions directly linked to fuel sulfur content:• Emission Control Areas (ECA) regulation• IMO Global Sulfur Cap regulations
Source ExxonMobil
2008 2010 2015
1.00
0.10ECA
2012 2020
3.50
0.50
4.50
GlobalFuelSulfur %
Year
Buy compliant fuel:
• MGO / MDO – 0.10 and 0.50% sulfur
• Residual fuel oil – 0.50% sulfur
Install Scrubbers (Exhaust Gas Cleaning System, EGCS):
• High Sulfur Fuel Oil (HSFO) ≤ 3.50% sulfur
2020 Options – All ships
8

MAN view of future fuels
Source:

Fuels and Lubes Mix
10
25 - 40 BN
0.1% ECA 0.5%
70 - 100 BN
≤ 3.5%Fuels S range
Lubes BN range

Regulatory emissions changes – New ShipsNitrogen oxide (NOx) emissions:• Tier I and Tier II apply to global waters • Tier III apply to new ships operating in North America and US Caribbean Sea
Carbon dioxide (CO2) emissions• Energy Efficiency Design Index (EEDI) apply to new ships

New Engine Design
• Longer Stroke (up to 4.2 meters)
• Larger Propeller
• Higher air flow, higher pressures in cylinder
• Electronic control of fuel injection and exhaust valve timing
1
1
2
23
3
4
4

Operational change:
• Higher air flow• More fuel burned per stroke
• Higher pressures• Dew point (temperature below which
water begins to condense) increases • Water condensation on cylinder liner
Impact on Engine Operation
13

• Slow steaming introduced in 2009 – 2010 to reduce fuel consumption
• Drag increases quadratically with increase in speed
• Lower speed leads to lower fuel consumption
Low / Part Load Operation (Slow Steaming)
14

Liner Temperature VS Dew Point
Small area with water condensation issue
Large area with water condensation issue
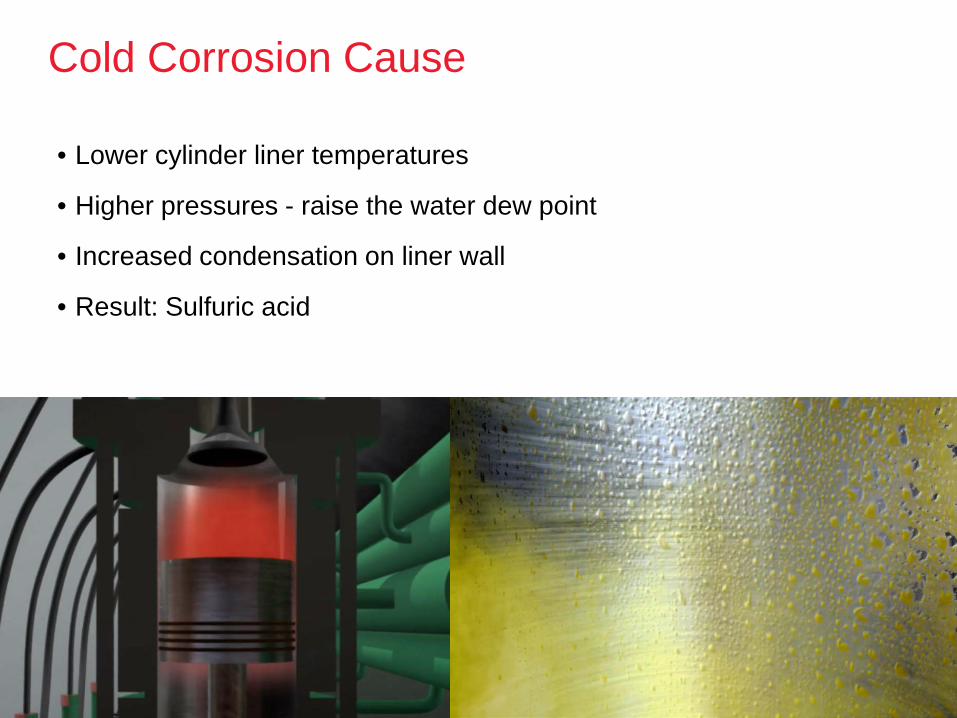
Cold Corrosion Cause
• Lower cylinder liner temperatures
• Higher pressures - raise the water dew point
• Increased condensation on liner wall
• Result: Sulfuric acid
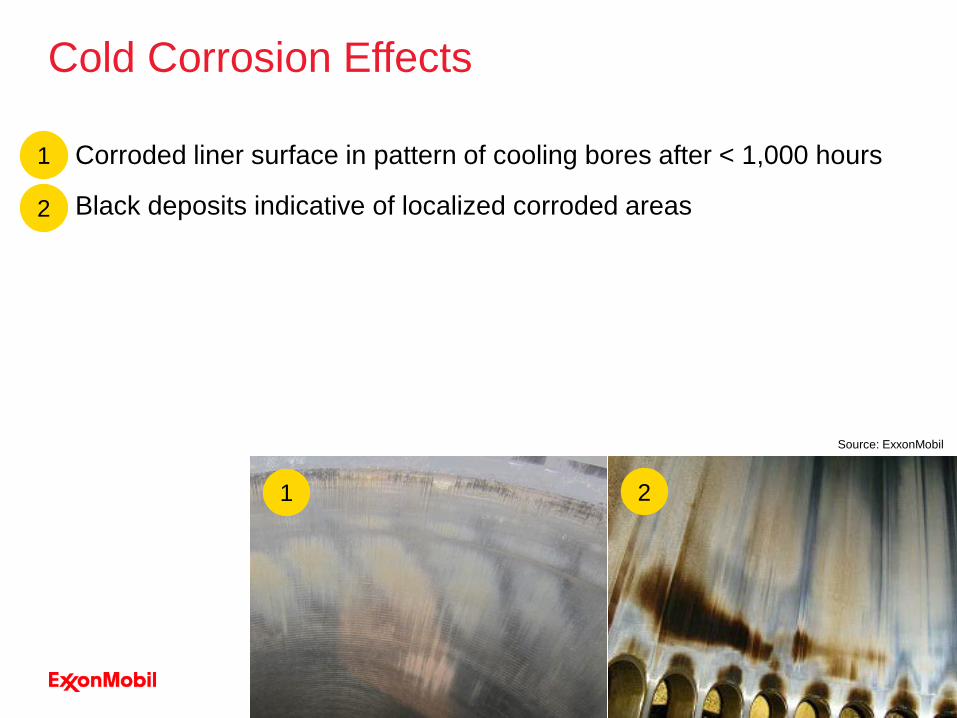
Cold Corrosion Effects
• Corroded liner surface in pattern of cooling bores after < 1,000 hours
• Black deposits indicative of localized corroded areas
1
1
2
2
Source: ExxonMobil

Cold Corrosion Video
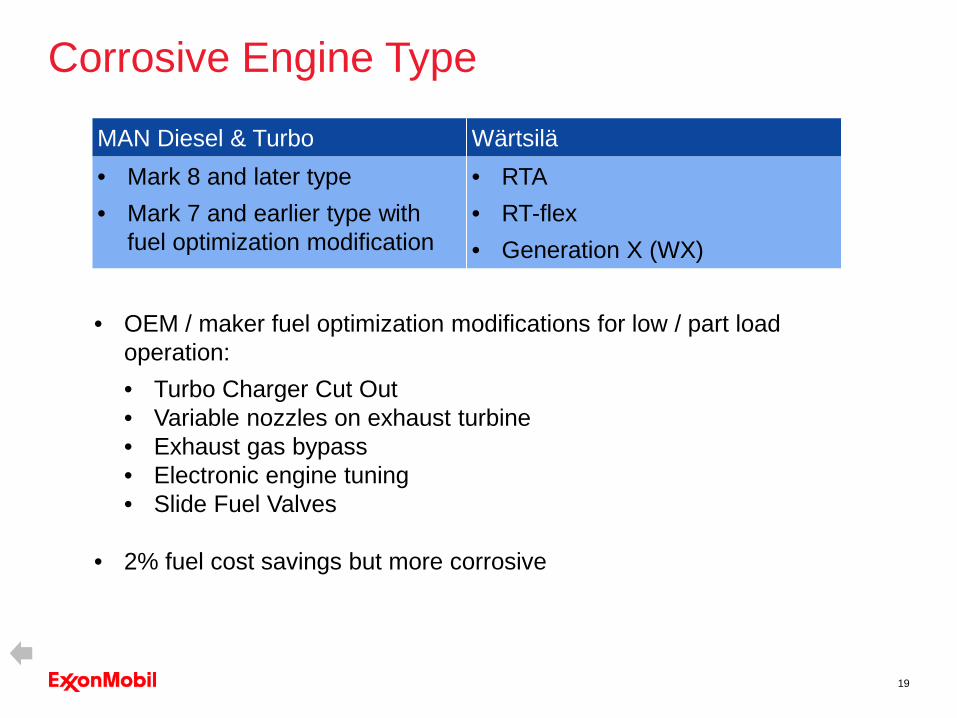
Corrosive Engine Type
MAN Diesel & Turbo Wärtsilä• Mark 8 and later type• Mark 7 and earlier type with
fuel optimization modification
• RTA• RT-flex• Generation X (WX)
19
• OEM / maker fuel optimization modifications for low / part load operation:• Turbo Charger Cut Out• Variable nozzles on exhaust turbine• Exhaust gas bypass• Electronic engine tuning• Slide Fuel Valves
• 2% fuel cost savings but more corrosive

Test your Understanding
20

What is the lubricants BN range for operating in Heavy Fuel Oil (HFO) between 1.5%S and 3.5%S ?
Answer: BN 70 - 10021
What is the name of the problem in engines caused by lower liner temperatures, increased dew point, and increased condensation on liner walls.
Answer: Cold Corrosion22

OEM Guidelines

MAN’s Requirements
24
Source: MAN Diesel & Turbo Service Letter SL2015-604/DOJA
Source: MAN Diesel & Turbo Service Letter SL2014-587/JAP

ExxonMobil’s MAN Recommendations
25
Source: ExxonMobil
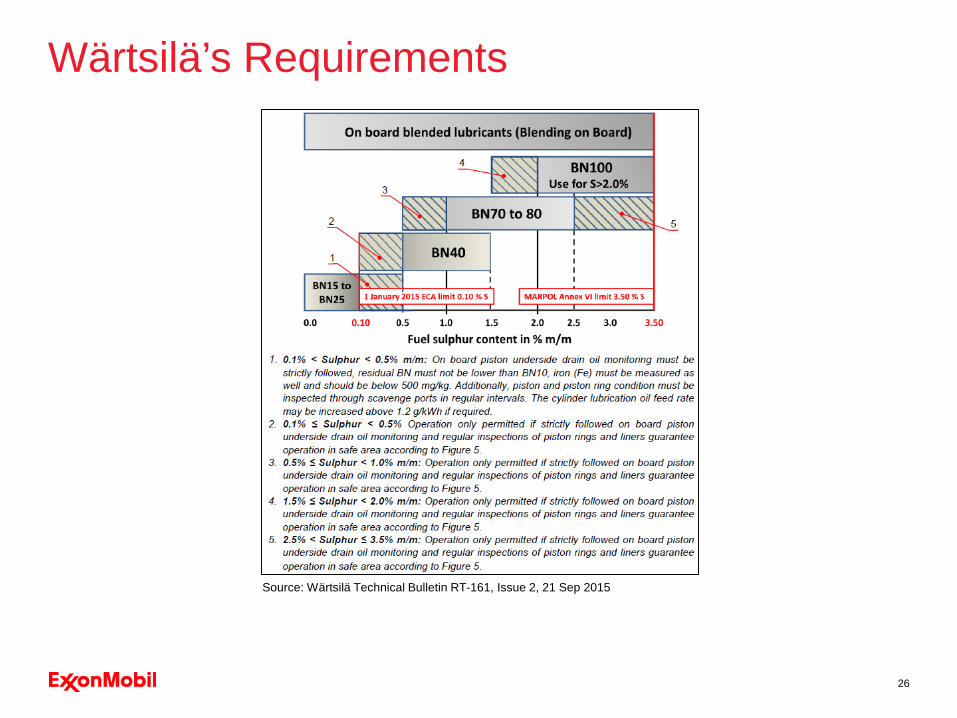
Wärtsilä’s Requirements
26
Source: Wärtsilä Technical Bulletin RT-161, Issue 2, 21 Sep 2015

ExxonMobil’s Wärtsilä Recommendations
27
Source: ExxonMobil

Sweep Test (MAN Guidelines)
28
Source: ExxonMobil
Goal: Shorten feed rate familiarization period
• Start at feed rate of 1.4 g/kWh
• Take scrapedown samples after 24 hours
• Reduce feed rate in steps of 0.2 g/kWh
• Repeat process until 0.6 g/kWh if results allow
• Operate in steady load and 2.8%-3.5% sulfur fuel

0
5
10
15
20
25
30
35
40
45
50
0
100
200
300
400
500
600
700
0.6 0.8 1.0 1.2 1.4
Sweep Test (MAN Guidelines)
29
Iron (ppm)Residual TBN (mg/KOH/g)
Feed Rate (g/kWh)Suitable feed rate factor
What’s next?Continue drain oil analysis
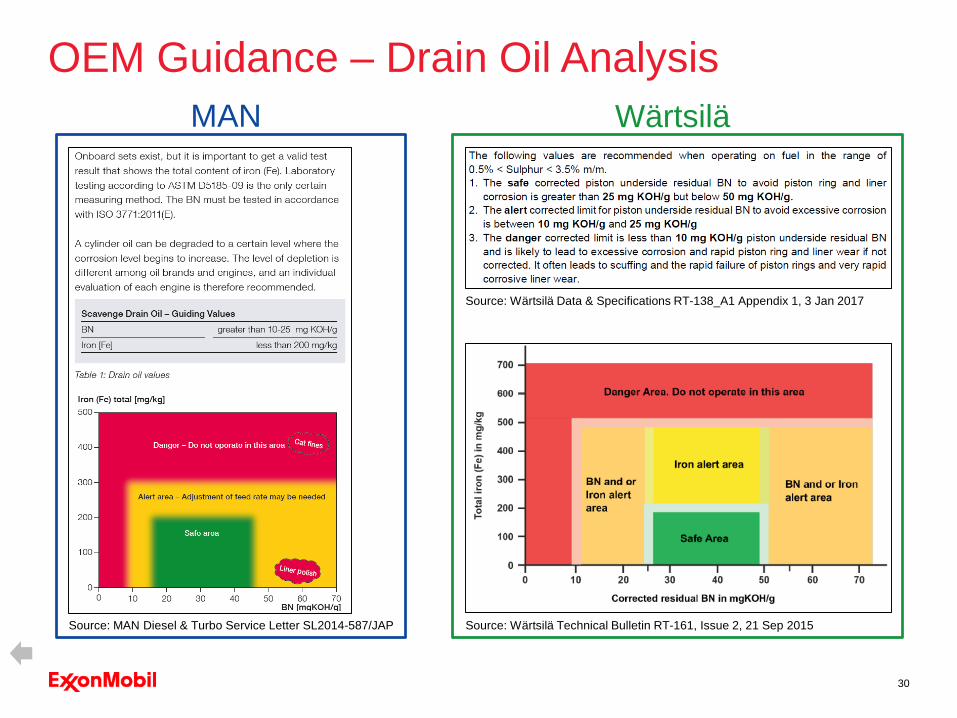
OEM Guidance – Drain Oil Analysis
30
Source: MAN Diesel & Turbo Service Letter SL2014-587/JAP
Source: Wärtsilä Data & Specifications RT-138_A1 Appendix 1, 3 Jan 2017
Source: Wärtsilä Technical Bulletin RT-161, Issue 2, 21 Sep 2015
MAN Wärtsilä

Test your Understanding
31
What is ExxonMobil’s cylinder lubricant recommended for an RT Flex engine operating with fuel between 1.5%S and 3.5%S ?
Answer: MobilGard 510032

What is recommended to be performed on an ongoing basis to monitor the cylinder condition?
Answer: Drain oil analysis33

Cylinder Condition Monitoring (CCM)

Cylinder Condition Monitoring
35
Main Engine Cylinders
Used Cylinder Oil Samples
ExxonMobil’s database
Corrosion Check Kit (Onboard
Corrosive Iron)
MobilGard Monitor (Onboard Abrasive
iron)
DIGI Cell(onboard TBN)
SIGNUM Laboratory
(Full Analysis)
Ship’s Engineer Input• Engine Hours• Feed Rate• Engine Load• Fuel Sulphur• Fuel Cat Fines• Lube Oil Consumption
CCM Report

Scrapedown Oil Sampling Procedure
36
1. Close the drain valves
2. Open sampling line briefly to blow out remaining oil or sludge
3. Close drain and sampling line for minimum of about one hour
1
1
2 2
3
3

Scrapedown Oil Sampling Procedure
37
1. Open sampling valve briefly to drain off a small amount of oil from the sampling line. Dispose of this oil.
2. Collect samples from each cylinder in clean containers to prevent contamination between cylinders
3. Close sampling valve
4. Reopen drain valve
4
5
4
6
7
67

MobilGard Monitor (Onboard Abrasive Iron)
38
Avoid Wind / DraftAvoid Sunlight, lamps, heat source
2 metersMagnetic objects
(metal, large power cables, electrical machinery, power
transformers)
Sample at ambient temperature

DIGI Cell (Onboard TBN)
39
Calibration / Check Calibration TBN Test
Add Reagent TBN to lower line Add Reagent TBN to lower line
Add fresh oil Add used oil
Replace lid and start Replace lid and start
Pressure X buildup in Cell Pressure Y buildup in Cell
Difference between Pressure X and Pressure Y determines TBN results
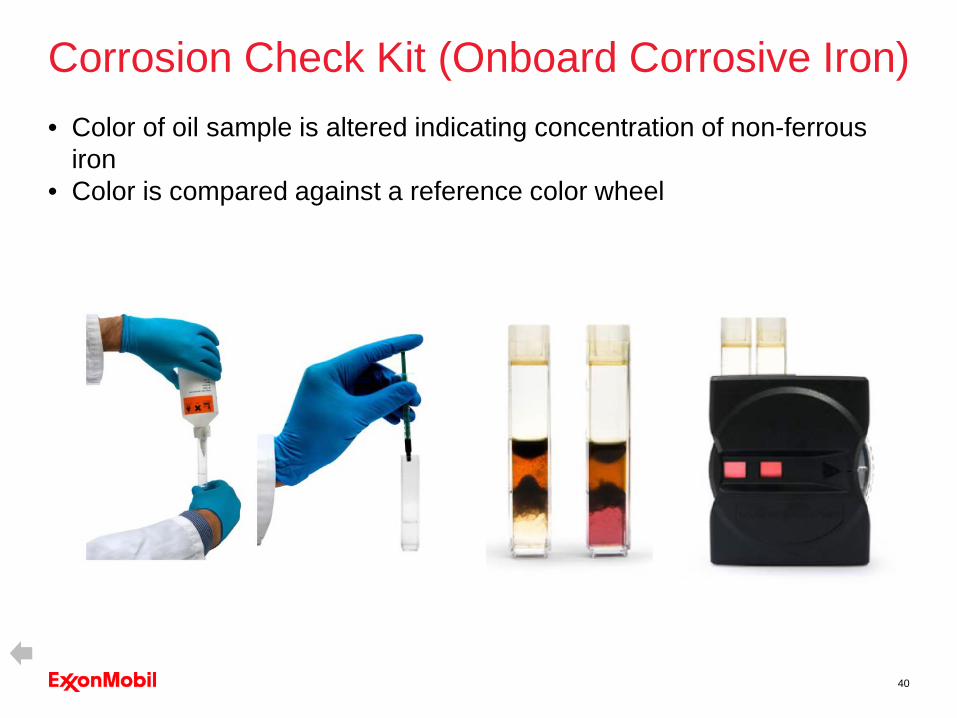
• Color of oil sample is altered indicating concentration of non-ferrous iron
• Color is compared against a reference color wheel
Corrosion Check Kit (Onboard Corrosive Iron)
40
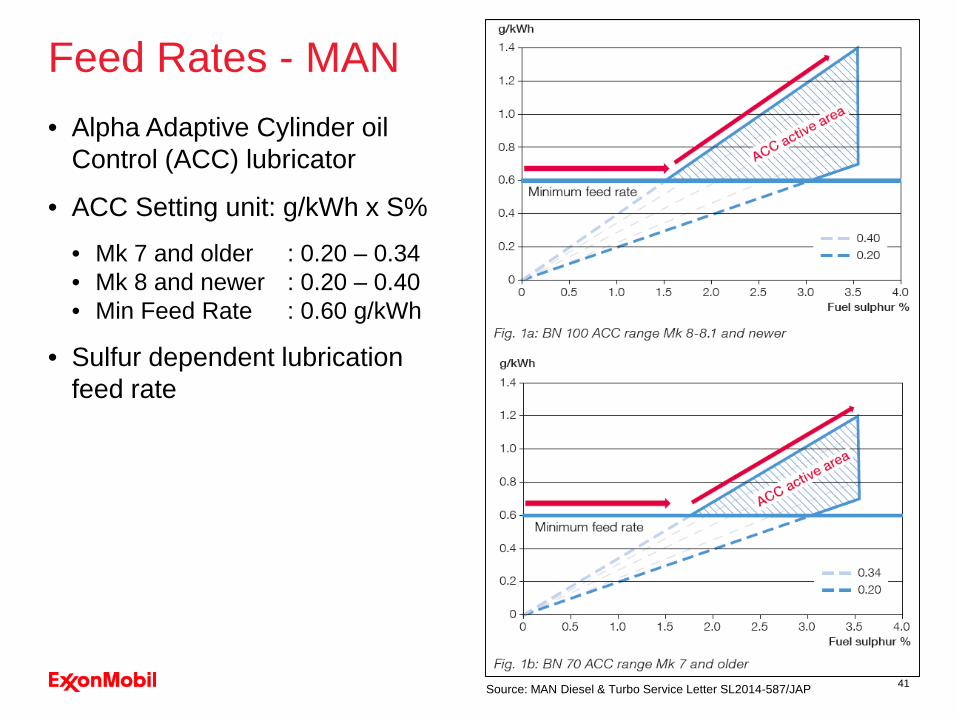
• Alpha Adaptive Cylinder oil Control (ACC) lubricator
• ACC Setting unit: g/kWh x S%• Mk 7 and older : 0.20 – 0.34• Mk 8 and newer : 0.20 – 0.40• Min Feed Rate : 0.60 g/kWh
• Sulfur dependent lubrication feed rate
Feed Rates - MAN
41Source: MAN Diesel & Turbo Service Letter SL2014-587/JAP

Measurement / settings to submit for
• Better trending• Better feed rate optimization determination
Feed Rates - MAN
42
Actual Feed Rate (g/kWh)
ACC Setting (g/kWhS%)

• Load dependent lubrication feed rate
Feed Rates - Wärtsilä
43
Engine LoadSpec
ific
Feed
Rat
e as
% o
f Act
ual F
eed
Rat
e
Actual feed rate at 100% CMCR
Max allowed: 1.2 g/kWh
Min allowed: 0.6 g/kWh
Pulse Lubricating System (PLS)CLU1 Lubricator Panel
Measurement / setting to submit• Better trending • Better feed rate
optimization determination
Source: Tekomar Engineering Ltd
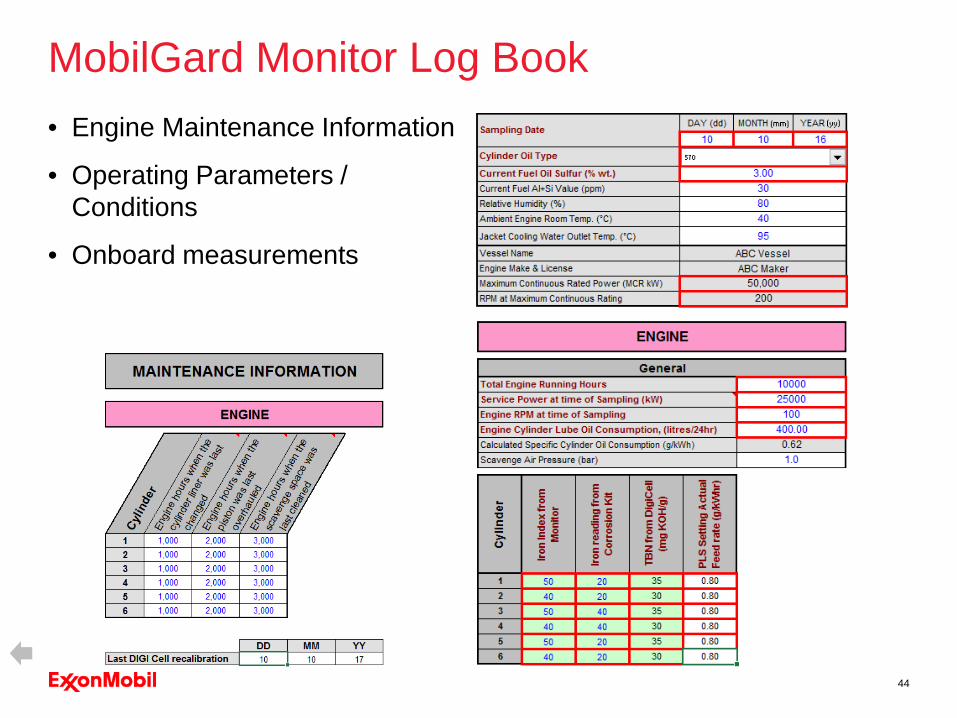
MobilGard Monitor Log Book
44
• Engine Maintenance Information
• Operating Parameters / Conditions
• Onboard measurements

Test your Understanding
45
When collecting scrapedownsamples, what needs to be done after first closing the drain valve?
Answer: Open sampling line briefly to blow out remaining oil or sludge
46

List the three onboard monitoring equipment and what it measures.
Answer: MobilGard Monitor – Abrasive IronDIGI Cell – Residual TBNCorrosion Check Kit – Corrosive Iron
47

CCM Report
48
Contains observations, and recommendations
Iron vs TBN (onboard) for overview of current condition of engine
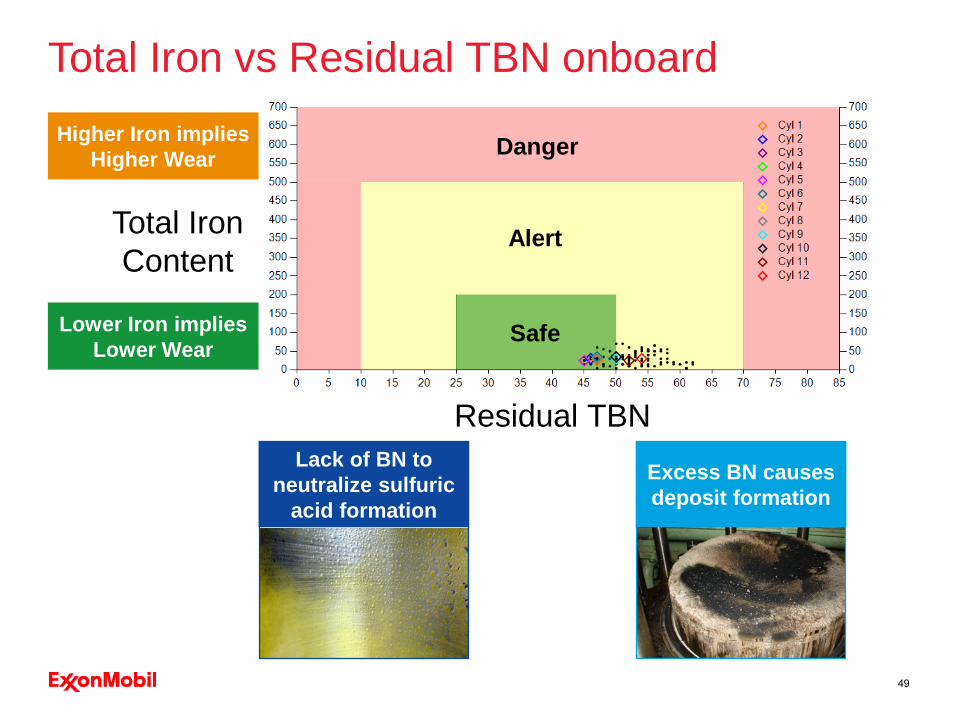
Total Iron vs Residual TBN onboard
49
Residual TBN
Total Iron Content
Lack of BN to neutralize sulfuric
acid formation
Excess BN causes deposit formation
Higher Iron implies Higher Wear
Lower Iron implies Lower Wear
Safe
Alert
Danger

Impact of Excessive BN
50
Source: MAN Diesel & Turbo Source: MAN Diesel & Turbo
Severe Top Land Deposits
Source: MAN Diesel & Turbo
Source: MAN Diesel & Turbo
Liner Polish / Hard Contact Marks
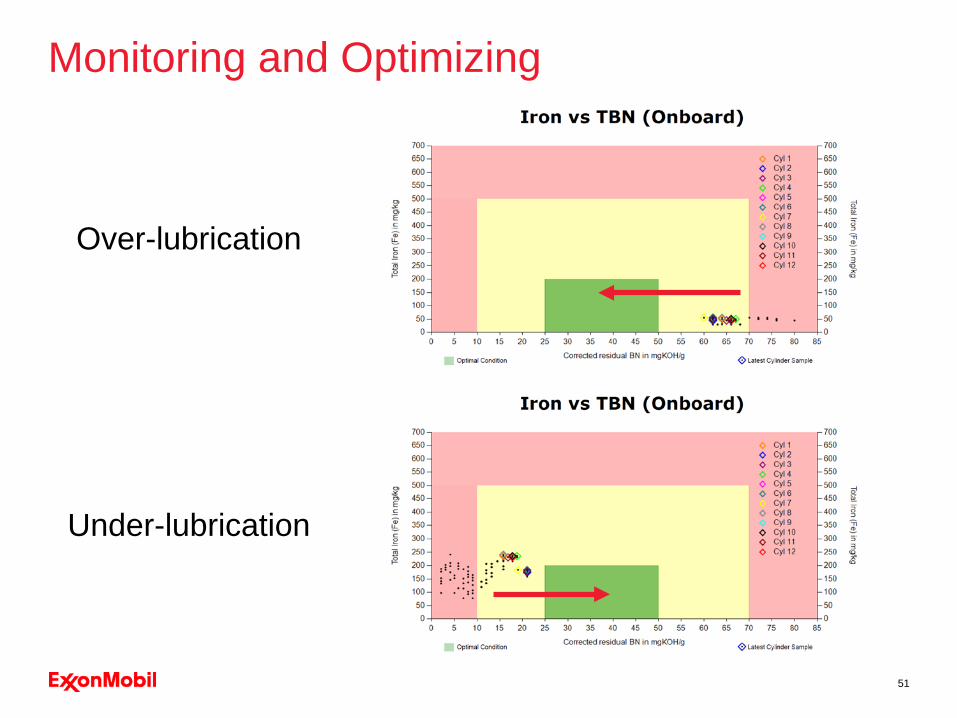
Monitoring and Optimizing
51
Over-lubrication
Under-lubrication

Cat Fines (Al + Si)
52
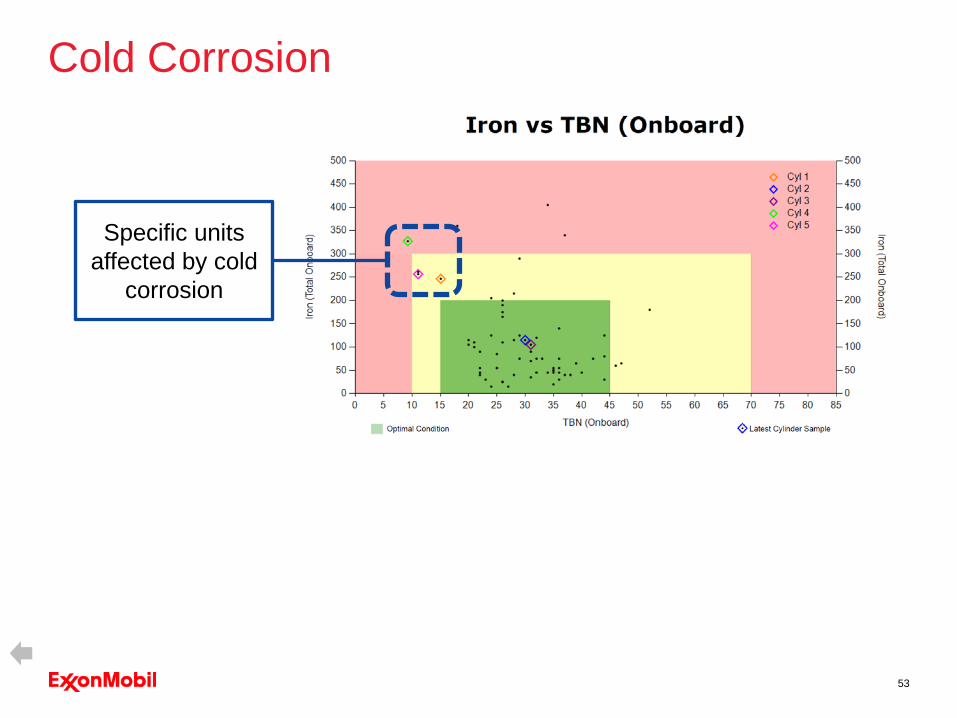
Cold Corrosion
53
Specific units affected by cold
corrosion

5432 67
90
1222
2
2580
0
0
0.1
0.2
0.3
0.4
0.5
0.6
0.7
0
5000
10000
15000
20000
25000
30000
35000
40000
100 150 200 250 300 500 1000
Liner Hours SpentIncremental Maintenance CostLiner Wear Rate / 1000 hours
Correlation Between Iron Content and Liner Life
54
Line
r Wea
r Rat
e (m
m /
1000
hou
rs)
Line
r Hou
rs S
pent
(Hou
rs
Incr
emen
tal m
aint
enan
ce c
ost /
100
0 ho
urs
(USD
)
Per cylinder for a 700mm bore MAN engine
Iron Content (ppm)

• Feed rate optimization
• Extend liner life and time between overhauls
• Arrest cold corrosion
• Detect and mitigate effects of high cat-fines in fuels
Key Benefits of CCM
55
Operators of
700+Vessels have trustedMobilGard CCM
Excess of
200,000scrapedown test results since 2002 to compare a customer’s sample
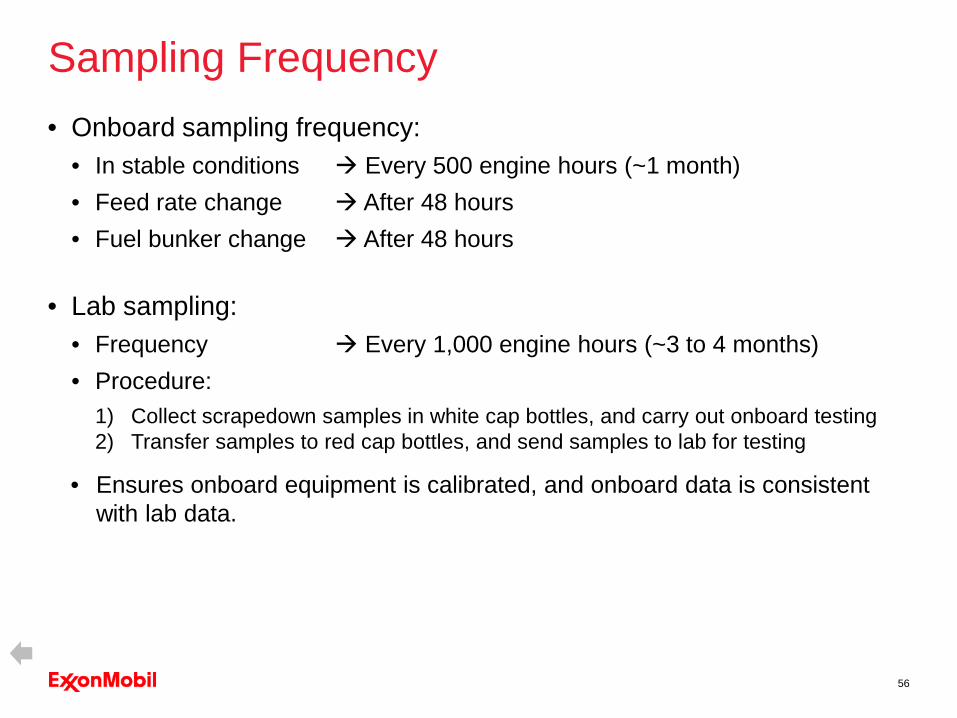
• Onboard sampling frequency:• In stable conditions Every 500 engine hours (~1 month)• Feed rate change After 48 hours• Fuel bunker change After 48 hours
• Lab sampling:• Frequency Every 1,000 engine hours (~3 to 4 months)• Procedure:
1) Collect scrapedown samples in white cap bottles, and carry out onboard testing2) Transfer samples to red cap bottles, and send samples to lab for testing
• Ensures onboard equipment is calibrated, and onboard data is consistent with lab data.
Sampling Frequency
56

Test your Understanding
58

What could be the result if feed rates remain high, and residual TBN are also high?
Answer: Deposit formation
59
In stable conditions, what is the recommended sampling frequency for onboard testing?
Answer:Every 500 engine hours(~ once/month)
60

When collecting samples for lab testing, is it still necessary to perform onboard testing on the same samples before sending to the lab?
Answer: Yes61
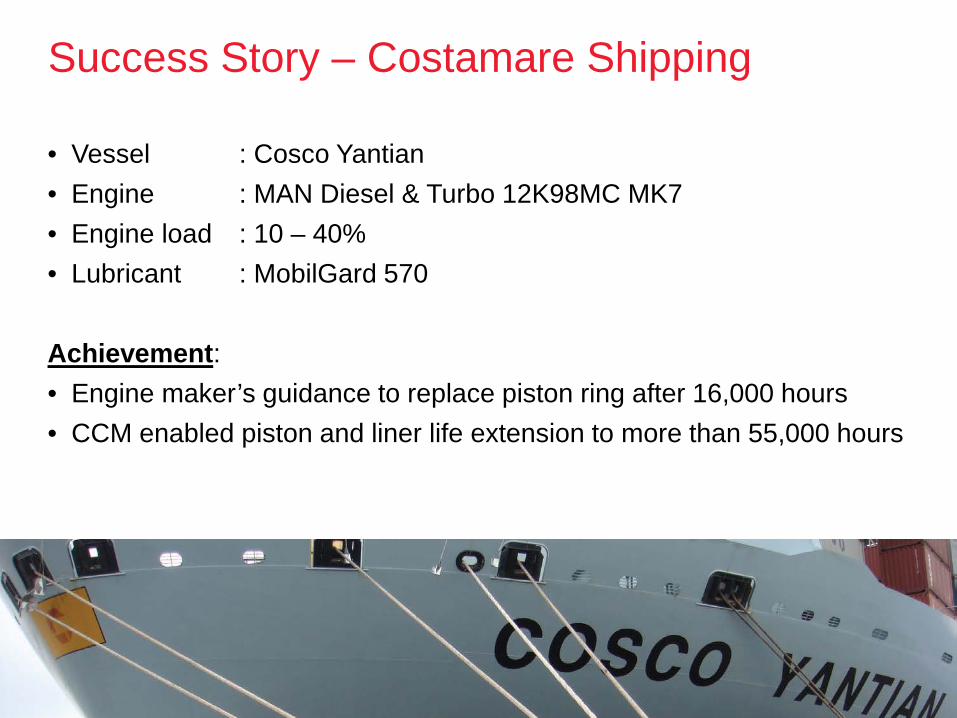
Success Story – Costamare Shipping
• Vessel : Cosco Yantian• Engine : MAN Diesel & Turbo 12K98MC MK7• Engine load : 10 – 40%• Lubricant : MobilGard 570
Achievement:• Engine maker’s guidance to replace piston ring after 16,000 hours• CCM enabled piston and liner life extension to more than 55,000 hours
Success Story – JPO Tucana
• Vessel : JPO Tucana• Engine : Wärtsilä 7RT-flex96C• Engine load : 30 - 48%• Fuel Sulfur : 2.50 – 2.81%
Achievement:• Mobilgard 570 Feed Rate of 1.10 g/kWh• Mobilgard 5100 Feed Rate of 0.65 g/kWh

Success Story – Pacific International Lines
• Vessel : Kota Sabas• Engine : Wärtsilä W6X72• Engine load : 35 - 65%• Fuel Sulfur : 2.30 – 2.80%
Achievement:• Mobilgard 570 Feed Rate of 1.30 g/kWh• Mobilgard 5100 Feed Rate of 0.70 g/kWh

Success Story – Hapag-Lloyd
• Vessel : Colombo Express• Engine : MAN Diesel & Turbo 12K98ME• Engine load : 20 - 30%
Achievement:• Mobilgard 570 ACC Factor of 0.27 – 0.30• Mobilgard 5100 ACC Factor of 0.20
Success Story – HTM Shipping
• Vessel : M/V Jia Da• Engine : MAN Diesel & Turbo 5S60MC MK6• Lubricant : MobilGard 570
Achievement:• Feed Rate reduction : 1.06 to 0.72 g/kWh• No increase in engine wear rates

Questions?

Thank you