Embed Size (px)
Citation preview
Page 1/16
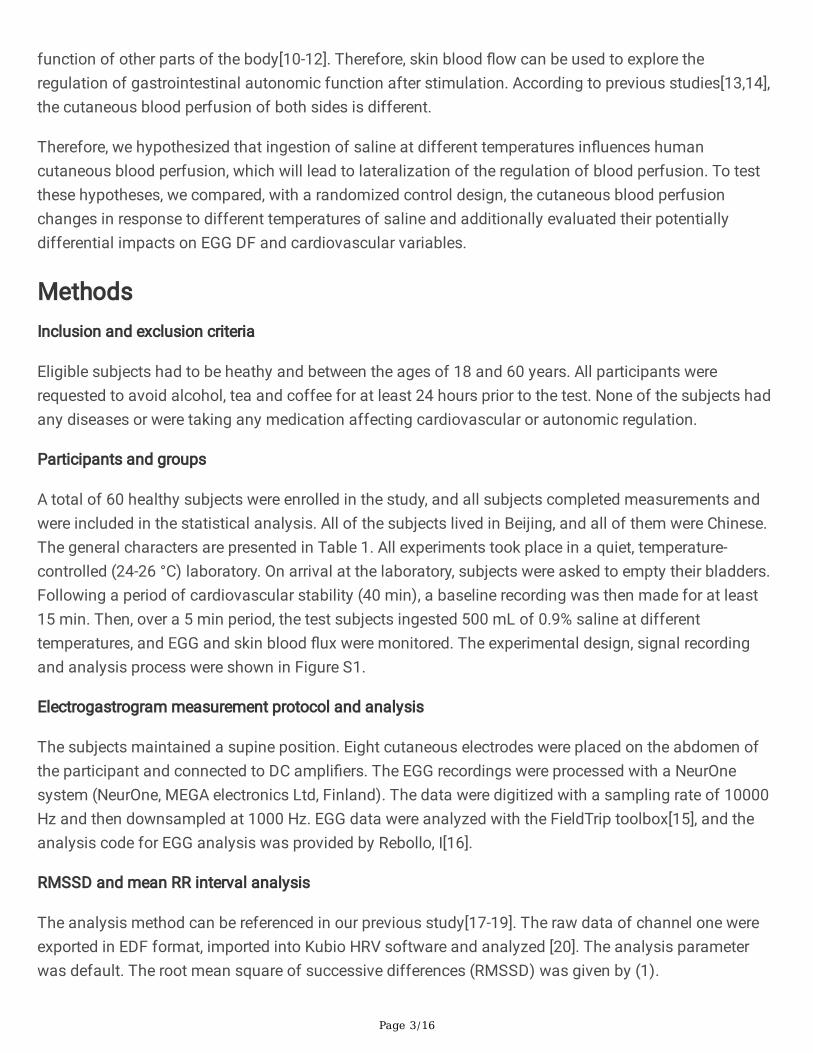
Laterality of Blood Perfusion in the LowerExtremities after Drinking Saline at DifferentTemperaturesShuyong Jia
Institute of Acupuncture and MoxibustionQizhen Wang
Institute of Basic Research in Clinical MedicineHongyan Li
Institute of Acupuncture and MoxibustionXiaojing Song
Institute of Acupuncture and Moxibustion, China Academy of Chinese Medical SciencesShuyou Wang
Institute of Acupuncture and Moxibustion, China Academy of Chinese Medical SciencesWeibo Zhang
Institute of Acupuncture and MoxibustionGuangjun Wang ( [email protected] )
Institute of Acupuncture and Moxibustion https://orcid.org/0000-0001-5344-4594
Article
Keywords: Laser Doppler blood perfusion, laterality, wavelet analysis, saline, EGG, ECG, dominantfrequency, RMSSD
Posted Date: April 20th, 2021
DOI: https://doi.org/10.21203/rs.3.rs-112441/v4
License: This work is licensed under a Creative Commons Attribution 4.0 International License. Read Full License

Page 2/16
AbstractBackground: Skin blood �ux (SkBF) changes caused by drinking cold water are generally associated withvagal tone and osmotic factors in the digestive system. However, the distribution and regulation ofbilateral blood �ow are not symmetrical but exhibit a certain laterality. The aim of this study was toanalyze the laterality of skin blood �ux after drinking saline (0.9%) at different temperatures bymonitoring blood �ux in the bilateral lower extremities.
Methods: A total of 60 subjects were recruited for this study, and all subjects completed allmeasurements. Subjects were randomly divided into a 4 °C group, 10 °C group and 30 °C group. For everysubject, skin blood perfusion of bilateral Zusanli acupoints (ST 36) was recorded simultaneously beforeand after drinking 500 ml of 0.9% saline using a PeriFlux System 5000. The electrogastrogram (EGG) wasalso monitored, and the dominant frequency of the EGG and heart rate variability were analyzed.
Results: The results indicated that after drinking saline at different temperatures, the laterality index ofskin blood �ux at the lower extremities was different. Drinking 30 °C saline can increase the lateralityindex of the lower extremities. The results of wavelet analysis showed that the laterality index changes ofskin blood �ux were mainly re�ected in the frequency interval V (0.4-1.6 Hz). Stimulation at 4 °C and 10°C resulted in a decrease in the dominant frequency (DF) of the electrogastrogram and an increased rootmean square of successive differences (RMSSD) of the RR interval. There was a weak negativecorrelation between the laterality index of frequency interval I or II and root mean square of successivedifferences.
Conclusion: There was laterality of blood perfusion in the lower extremities after drinking saline atdifferent temperatures.
BackgroundAlthough people prefer to drink cold water[1], few reports have studied the effects of water temperatureon healthy humans[2-4]. Especially, studies about the effect of water temperature on blood �ux arescarce. Scientists have suggested that the water effect does not depend on gastric distension, but on thewater osmolality, which could cause an autonomic cardiovascular response in humans through osmoticsensing nerve �bers in the intestinal or portal circulation[5,6]. On the other hand, the results shown thatwater intake activates distinct gastrointestinal vagal afferent in a temperature-dependent pattern andmight affect cardiac vagal tone[7].
A previous work suggested that oral glucose intake inhibits hypothalamic neuronal activity thanintravenous (IV) glucose administration more effectively[8], but oral intake saline results in minimalvariations in serum albumin, hematocrit, and hemoglobin compared to IV infusion[9]. These studiesindicated that, in addition to osmotic pressure and temperature mechanisms, the different autonomicresponses of digestive tract might result in systemic regulation of peripheral blood perfusion.Furthermore, some works have indicated that the cutaneous microvasculature mirrors the vascular
Page 3/16
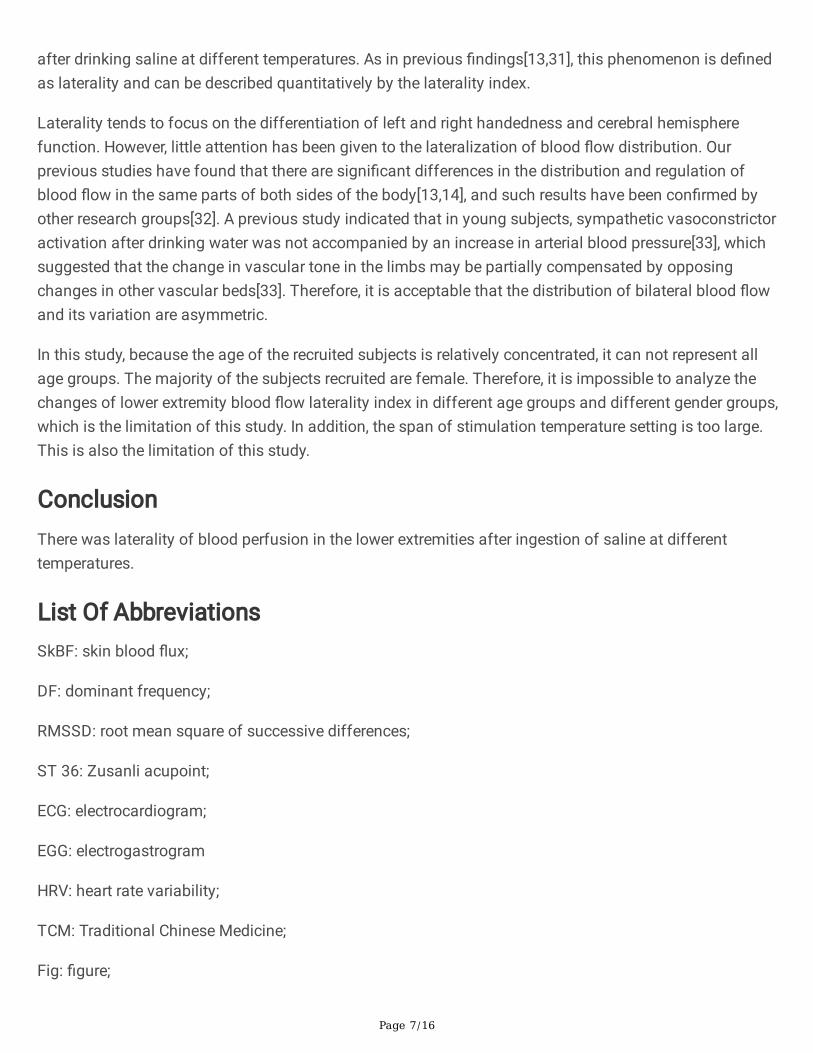
function of other parts of the body[10-12]. Therefore, skin blood �ow can be used to explore theregulation of gastrointestinal autonomic function after stimulation. According to previous studies[13,14],the cutaneous blood perfusion of both sides is different.
Therefore, we hypothesized that ingestion of saline at different temperatures in�uences humancutaneous blood perfusion, which will lead to lateralization of the regulation of blood perfusion. To testthese hypotheses, we compared, with a randomized control design, the cutaneous blood perfusionchanges in response to different temperatures of saline and additionally evaluated their potentiallydifferential impacts on EGG DF and cardiovascular variables.
MethodsInclusion and exclusion criteria
Eligible subjects had to be heathy and between the ages of 18 and 60 years. All participants wererequested to avoid alcohol, tea and coffee for at least 24 hours prior to the test. None of the subjects hadany diseases or were taking any medication affecting cardiovascular or autonomic regulation.
Participants and groups
A total of 60 healthy subjects were enrolled in the study, and all subjects completed measurements andwere included in the statistical analysis. All of the subjects lived in Beijing, and all of them were Chinese.The general characters are presented in Table 1. All experiments took place in a quiet, temperature-controlled (24-26 °C) laboratory. On arrival at the laboratory, subjects were asked to empty their bladders.Following a period of cardiovascular stability (40 min), a baseline recording was then made for at least15 min. Then, over a 5 min period, the test subjects ingested 500 mL of 0.9% saline at differenttemperatures, and EGG and skin blood �ux were monitored. The experimental design, signal recordingand analysis process were shown in Figure S1.
Electrogastrogram measurement protocol and analysis
The subjects maintained a supine position. Eight cutaneous electrodes were placed on the abdomen ofthe participant and connected to DC ampli�ers. The EGG recordings were processed with a NeurOnesystem (NeurOne, MEGA electronics Ltd, Finland). The data were digitized with a sampling rate of 10000Hz and then downsampled at 1000 Hz. EGG data were analyzed with the FieldTrip toolbox[15], and theanalysis code for EGG analysis was provided by Rebollo, I[16].
RMSSD and mean RR interval analysis
The analysis method can be referenced in our previous study[17-19]. The raw data of channel one wereexported in EDF format, imported into Kubio HRV software and analyzed [20]. The analysis parameterwas default. The root mean square of successive differences (RMSSD) was given by (1).

Page 4/16
Protocol for measurement of blood perfusion
Both legs were exposed, and bilateral Zusanli acupoints (ST 36) were marked by senior acupuncturedoctors. The acupuncture point ST 36 is located in the tibialis anterior muscle, 4 �ngerbreadths below thekneecap and 1 �ngerbreadth lateral from the anterior crest of the tibia[21]. Blood perfusion signals wererecorded using a PeriFlux System 5000 (Perimed AB, Stockholm, Sweden) with a 64 Hz sample rate and0.2 s time constant. An optical �ber probe connected with a Peri�ux 5000 was used to illuminate andcollect the scattered light from the skin tissue. The probe was attached to the surface of interest with two-sided adhesive tape.
Mean blood perfusion analysis and wavelet analysis
The recorded �le of each subject was opened in PeriSoft (version 2.5.5, Perimed AB, Stockholm, Sweden)for Windows. The detailed data were exported in txt format and then imported into MATLAB software andanalyzed. The laterality index of blood �ux every 10 min on both sides of ST36 was calculated as (1).
Previous studies indicated that blood �ux oscillations at frequencies from 0.0095 to 1.6 Hz might re�ectdifferent physiological rhythms[22], which can be separated into �ve frequency bands in the frequencydomain[23-26]. In the present study, wavelet analysis was performed on the blood �ux signal (10 min)using a Morlet wavelet (The Mathworks Inc., Natick, MA, USA). For every frequency interval, the lateralityindex was also calculated as (2).
Statistical analysis
Data are presented as the mean±SE. Mixed repeated-measures ANOVA was used to analyze between-subject factors with R software[27] and fdrtool package[28] . All correlation analyses were conductedusing MATLAB software (MathWorks, Natick, Massachusetts, USA). All reported P values were two-sided,and the level of signi�cance was de�ned as P<0.05.
Results

Page 5/16
In this study, a total of 60 subjects were recruited, and all subjects were included in the �nal statisticalanalysis. The order of stimulations was randomly generated for each subject. Detailed information on thesubjects is summarized in Table 1 (4 °C, N=20; 10 °C, N=20 and 30 °C, N=20).
Table 1. Subject's sex composition and average age, height and weightGroup n Sex
(female/male)Age(years, mean±SD)
Height(cm, mean±SD)
Weight(kg, mean±SD)
4 °C 20 17/3 27±3 165.0±7.2 59.6±9.3 10 °C 20 18/2 25±3 163.6±5.6 56.2±10.7 30 °C 20 17/3 26±1 161.9±6.1 54.6±13.6
EGG and ECG results
The results of EGG analysis are shown in Figure 1, the recording electrode position is shown in Figure 1A,and the raw data of 8-channel gastrointestinal electrical signals recorded are shown in Figure 1B. Thespectral analysis of each signal is shown in Figure 1C. The statistical results of the main frequencycorresponding to the maximum power in each subject's 8-channel gastrointestinal electrical signals areshown in Figure 1D. In the resting state, there was no signi�cant difference in the dominant frequency ofthe subjects.
Cold stimulation of the digestive tract will not only cause a change in the electrogastrogram but also beaccompanied by systemic reactions. The raw data of ECG and RR interval signal are shown in Figure 2Aand Figure 2B, respectively. The changes in the RR interval and RMSSD were also analyzed. The resultsshowed that the RR interval (Figure 2C) and RMSSD (Figure 2D) were increased with both 4 °C or10 °C stimulation compared with 30 °C stimulation.
Skin blood �ux
The average responses of blood perfusion to stimulation at different temperatures over time are shown inFigure 3. The recording position of both sides for blood perfusion is shown in Figure 3A, the raw data ofbilateral blood perfusion are shown in Figure 3B, the absolute value of bilateral blood �ow difference isshown in Figure 3C, and the laterality change in bilateral blood perfusion under different temperaturestimulation conditions is shown in Figure 3D. In the �rst 10 min after stimulation, there was a signi�cantdifference between the changes induced by 30 °C stimulation and 4 °C stimulation. At the second andthird 10 min after stimulation, there were signi�cant differences between the changes induced by30 °C stimulation and those caused by 4 °C and 10 °C. However, there were no signi�cant changes in thechanges induced by 4 °C and 10 °C.
Because the blood �ow signal is composed of many components, bilateral blood �ow was transformedby wavelet (Figure 4A), and the laterality index in different frequency intervals was calculated. The results

Page 6/16
showed that the difference was mainly re�ected in frequency V (0.4-1.6 Hz) (Figure 4F). There was nosigni�cant difference between other frequency intervals (Figure 4B-E).
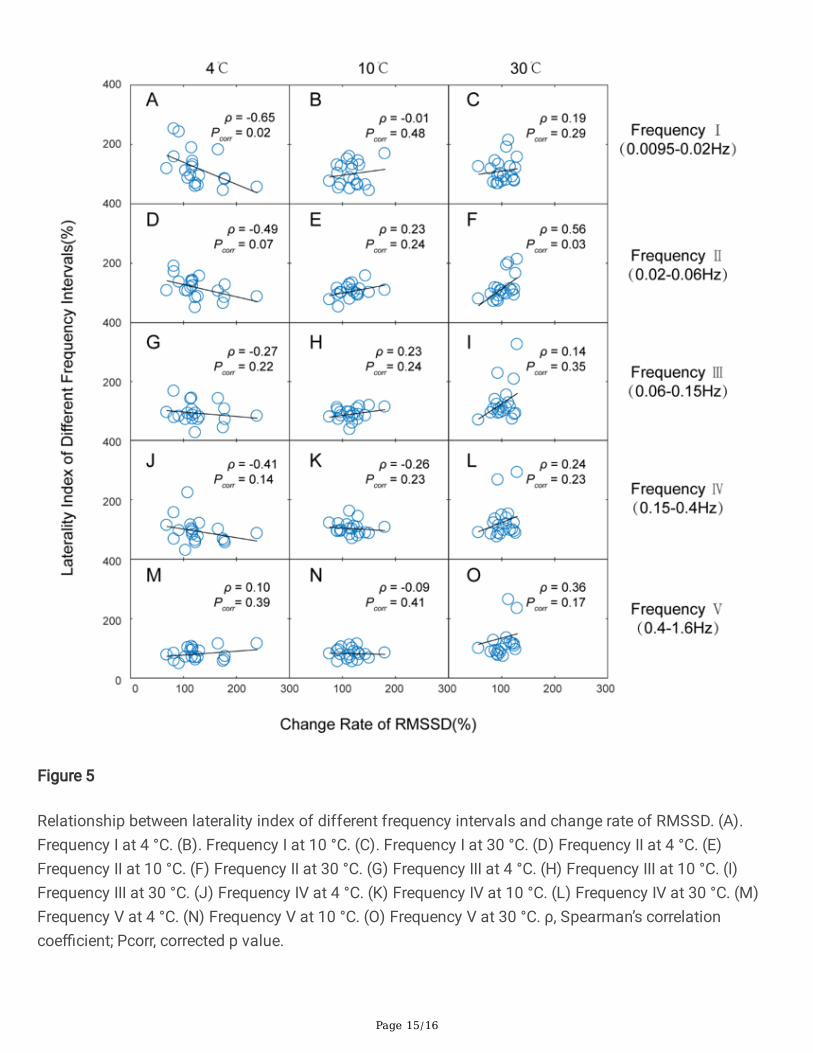
To further analyze the possibility of blood �ow laterality, we analyzed the correlation between theseparameters. First, we con�rmed that there was no correlation between the DF and RMSSD (Figure S2) atdifferent temperature stimulation. There was also no apparent correlation between the laterality indexand the DF (Figure S3A-C) or RMSSD (Figure S3D-F). After wavelet transformation, we found that therewas a negative correlation between RMSSD and the laterality index of frequencies I at 4 °C stimulation(Figure 5A and D), which was independent of other frequency intervals (Figure 5G, J and M). There was apositive correlation between RMSSD and the laterality index of frequency II (Figure 5F), rather than otherfrequencies (Figure 5C, I, L and O) at 30 °C stimulation. There was no correlation between the lateralityindex of each frequency and RMSSD at 10 ℃ (Figure 5B, E, H, K and N). However, there is no correlationbetween the laterality index and DF in any frequency interval (Figure S4).
DiscussionAs Figure 6 shows, the main signi�cance of current work is that there was response laterality of bloodperfusion in the lower extremities after drinking saline at different temperatures, which means thatautonomic nerve function is different between left and right in the process of blood �ow regulation. Thepresent study demonstrated that drinking saline at different temperatures produced the changes ofcutaneous vascular movement, which means that regulation of cutaneous vascular might play animportant role in water temperature digestion.
A previous study[5] indicated that the water effect does not depend on gastric distension, but on the waterosmolality, which could cause an autonomic cardiovascular response in humans through osmoticsensing nerve �bers in the intestinal or portal circulation[5,6]. However, in the current study, osmoticpressure of saline at different temperatures is same, it is di�cult to conclude that the change insympathetic tone is caused by osmolality.
In peripheral, small changes in cutaneous vascular blood perfusion can shift cardiovascular control. Adecrease in the skin blood perfusion can lead to relative changes of sympathetic activation inperipheral[29]. Which can be explained by the activation of temperature sensitive vagal afferent �bersfound in the digestive tract[30]. Water intake seems to activate different gastrointestinal vagal afferent�bers in a temperature dependent manner and may affect subsequent cardiac vagal tone[7]. Our resultsdemonstrated that different water temperatures not only decreased the DF of EGG but also wereassociated with a change in the mean RR interval and RMSSD. However, as shown in Fig 6, there is nodirect linear relationship between bilateral blood �ow laterality and RMSSD, but after decomposing theblood �ow components, it is found that there is a linear relationship between speci�c components andRMSSD. It is suggested that the regulation of peripheral blood �ow induced by stimulation at differenttemperatures is selective. In the present study, the change trend of SkBF at bilateral ST 36 was different
Page 7/16
after drinking saline at different temperatures. As in previous �ndings[13,31], this phenomenon is de�nedas laterality and can be described quantitatively by the laterality index.
Laterality tends to focus on the differentiation of left and right handedness and cerebral hemispherefunction. However, little attention has been given to the lateralization of blood �ow distribution. Ourprevious studies have found that there are signi�cant differences in the distribution and regulation ofblood �ow in the same parts of both sides of the body[13,14], and such results have been con�rmed byother research groups[32]. A previous study indicated that in young subjects, sympathetic vasoconstrictoractivation after drinking water was not accompanied by an increase in arterial blood pressure[33], whichsuggested that the change in vascular tone in the limbs may be partially compensated by opposingchanges in other vascular beds[33]. Therefore, it is acceptable that the distribution of bilateral blood �owand its variation are asymmetric.
In this study, because the age of the recruited subjects is relatively concentrated, it can not represent allage groups. The majority of the subjects recruited are female. Therefore, it is impossible to analyze thechanges of lower extremity blood �ow laterality index in different age groups and different gender groups,which is the limitation of this study. In addition, the span of stimulation temperature setting is too large.This is also the limitation of this study.
ConclusionThere was laterality of blood perfusion in the lower extremities after ingestion of saline at differenttemperatures.
List Of AbbreviationsSkBF: skin blood �ux;
DF: dominant frequency;
RMSSD: root mean square of successive differences;
ST 36: Zusanli acupoint;
ECG: electrocardiogram;
EGG: electrogastrogram
HRV: heart rate variability;
TCM: Traditional Chinese Medicine;
Fig: �gure;
Page 8/16
SD: standard deviation;
SE: standard error;
ANOVA: analysis of variance
Declarations
Data availabilityThe majority of supporting data are presented within this article and its Supplement. Raw data areavailable from the corresponding author upon reasonable request.
Ethics approvalThis study was approved by the Institutional Research Ethics Boards of Acupuncture & Moxibustion,China Academy of Chinese Medical Sciences. In accordance with the Declaration of Helsinki eachsubject provided informed consent and had an adequate understanding of the procedure and purpose ofthis study.
Competing interestsThe authors declare that they have no competing interests.
References1. Burdon, C.A.; Johnson, N.A.; Chapman, P.G.; O'Connor, H.T. In�uence of beverage temperature on
palatability and �uid ingestion during endurance exercise: a systematic review. Int J Sport Nutr ExercMetab 2012, 22, 199-211.
2. Boschmann, M.; Steiniger, J.; Hille, U.; Tank, J.; Adams, F.; Sharma, A.M.; Klaus, S.; Luft, F.C.; Jordan, J.Water-induced thermogenesis. J Clin Endocrinol Metab 2003, 88, 6015-6019, doi:10.1210/jc.2003-030780.
3. Brown, C.M.; Dulloo, A.G.; Montani, J.P. Water-induced thermogenesis reconsidered: the effects ofosmolality and water temperature on energy expenditure after drinking. J Clin Endocrinol Metab2006, 91, 3598-3602, doi:10.1210/jc.2006-0407.
4. Wang, G.; Jia, S.; Li, H.; Wang, Z.; Tian, Y.; Zhang, W. Response of Blood Perfusion at ST 36 Acupointafter Drinking Cold Glucose or Saline Injection. Evidence-based complementary and alternativemedicine : eCAM 2017, 2017, 4212534, doi:10.1155/2017/4212534.
5. May, M.; Jordan, J. The osmopressor response to water drinking. Am J Physiol Regul Integr CompPhysiol 2011, 300, R40-46, doi:10.1152/ajpregu.00544.2010.
Page 9/16
�. Brown, C.M.; Barberini, L.; Dulloo, A.G.; Montani, J.P. Cardiovascular responses to water drinking: doesosmolality play a role? Am J Physiol Regul Integr Comp Physiol 2005, 289, R1687-1692,doi:10.1152/ajpregu.00205.2005.
7. Girona, M.; Grasser, E.K.; Dulloo, A.G.; Montani, J.P. Cardiovascular and metabolic responses to tapwater ingestion in young humans: does the water temperature matter? Acta physiologica 2014, 211,358-370, doi:10.1111/apha.12290.
�. Smeets, P.A.; Vidarsdottir, S.; de Graaf, C.; Sta�eu, A.; van Osch, M.J.; Viergever, M.A.; Pijl, H.; van derGrond, J. Oral glucose intake inhibits hypothalamic neuronal activity more effectively than glucoseinfusion. Am J Physiol Endocrinol Metab 2007, 293, E754-758, doi:10.1152/ajpendo.00231.2007.
9. de Aguilar-Nascimento, J.E.; Valente, A.C.; Oliveira, S.S.; Hartmann, A.; Slhessarenko, N. Changes inbody composition, hematologic parameters, and serum biochemistry after rapid intravenous infusionor oral intake of 2 liters of 0.9% saline solution in young healthy volunteers: randomized crossoverstudy. World J Surg 2012, 36, 2776-2781, doi:10.1007/s00268-012-1756-0.
10. Holowatz, L.A.; Thompson-Torgerson, C.S.; Kenney, W.L. The human cutaneous circulation as amodel of generalized microvascular function. J. Appl. Physiol. 2008, 105, 370-372,doi:10.1152/japplphysiol.00858.2007.
11. Stewart, J.; Kohen, A.; Brouder, D.; Rahim, F.; Adler, S.; Garrick, R.; Goligorsky, M.S. Noninvasiveinterrogation of microvasculature for signs of endothelial dysfunction in patients with chronic renalfailure. Am. J. Physiol.-Heart Circul. Physiol. 2004, 287, H2687-H2696,doi:10.1152/ajpheart.00287.2004.
12. Rossi, M.; Bradbury, A.; Magagna, A.; Pesce, M.; Taddei, S.; Stefanovska, A. Investigation of skinvasoreactivity and blood �ow oscillations in hypertensive patients: effect of short-termantihypertensive treatment. J. Hypertens. 2011, 29, 1569-1576,doi:10.1097/HJH.0b013e328348b653.
13. Wang, G.; Han, J.; Litscher, G.; Zhang, W. System identi�cation algorithm analysis of acupunctureeffect on mean blood �ux of contralateral hegu acupoint. Evidence-based complementary andalternative medicine : eCAM 2012, 2012, 951928, doi:10.1155/2012/951928.
14. Wang, G.; Tian, Y.; Jia, S.; Wang, Z.; Zhang, W. Laterality and coherence analysis of Laser DopplerFlowmetry signals in bilateral Nèi guān(PC6 ): a potential non-invasive method to assessmicrocirculatory changes in different ages. World Journal of Acupuncture-Moxibustion 2017, 27, 47-52.
15. Oostenveld, R.; Fries, P.; Maris, E.; Schoffelen, J.M. FieldTrip: Open Source Software for AdvancedAnalysis of MEG, EEG, and Invasive Electrophysiological Data. Comput Intel Neurosc 2011, Artn15686910.1155/2011/156869, doi:Artn 15686910.1155/2011/156869.
1�. Wolpert, N.; Rebollo, I.; Tallon-Baudry, C. Electrogastrography for psychophysiological research:Practical considerations, analysis pipeline, and normative data in a large sample. Psychophysiology2020, 57, e13599, doi:10.1111/psyp.13599.
Page 10/16
17. Wang, G.; Tian, Y.; Jia, S.; Zhou, W.; Zhang, W. Acupuncture regulates the heart rate variability. JAcupunct Meridian Stud 2015, 8, 94-98, doi:10.1016/j.jams.2014.10.009.
1�. Guangjun, W.; Yuying, T.; Shuyong, J.; Wenting, Z.; Weibo, Z. Bilateral hegu acupoints have the sameeffect on the heart rate variability of the healthy subjects. Evidence-based complementary andalternative medicine : eCAM 2014, 2014, 106940, doi:10.1155/2014/106940.
19. Wang, G.; Tian, Y.; Jia, S.; Zhou, W.; Zhang, W. Pilot study of acupuncture point laterality: evidencefrom heart rate variability. Evidence-based complementary and alternative medicine : eCAM 2013,2013, 476064, doi:10.1155/2013/476064.
20. Niskanen, J.P.; Tarvainen, M.P.; Ranta-Aho, P.O.; Karjalainen, P.A. Software for advanced HRV analysis.Comput Methods Programs Biomed 2004, 76, 73-81, doi:10.1016/j.cmpb.2004.03.004.
21. Hui, K.K.; Liu, J.; Marina, O.; Napadow, V.; Haselgrove, C.; Kwong, K.K.; Kennedy, D.N.; Makris, N. Theintegrated response of the human cerebro-cerebellar and limbic systems to acupuncture stimulationat ST 36 as evidenced by fMRI. Neuroimage 2005, 27, 479-496,doi:10.1016/j.neuroimage.2005.04.037.
22. Bernardi, L.; Rossi, M.; Fratino, P.; Finardi, G.; Mevio, E.; Orlandi, C. Relationship between phasicchanges in human skin blood �ow and autonomic tone. Microvasc Res 1989, 37, 16-27.
23. Hsiu, H.; Hsu, W.C.; Hsu, C.L.; Huang, S.M. Assessing the effects of acupuncture by comparingneedling the hegu acupoint and needling nearby nonacupoints by spectral analysis ofmicrocirculatory laser Doppler signals. Evid-Based Compl Alt 2011, 2011, 435928,doi:10.1093/ecam/neq073.
24. Thorn, C.E.; Matcher, S.J.; Meglinski, I.V.; Shore, A.C. Is mean blood saturation a useful marker oftissue oxygenation? Am. J. Physiol.-Heart Circul. Physiol. 2009, 296, H1289-H1295,doi:10.1152/ajpheart.01192.2008.
25. Bernjak, A.; Clarkson, P.B.; McClintock, P.V.; Stefanovska, A. Low-frequency blood �ow oscillations incongestive heart failure and after beta1-blockade treatment. Microvasc Res 2008, 76, 224-232,doi:10.1016/j.mvr.2008.07.006.
2�. Kvandal, P.; Landsverk, S.A.; Bernjak, A.; Stefanovska, A.; Kvernmo, H.D.; Kirkeboen, K.A. Low-frequency oscillations of the laser Doppler perfusion signal in human skin. Microvasc Res 2006, 72,120-127, doi:10.1016/j.mvr.2006.05.006.
27. R Core Team. R: A Language and Environment for Statistical Computing. R Foundation for StatisticalComputing, Vienna, Austria. https://www.R-project.org/. 2020.
2�. Klaus, B.; Strimmer, K. fdrtool: Estimation of (Local) False Discovery Rates and Higher Criticism. Rpackage version 1.2.16. https://CRAN.R-project.org/package=fdrtool. 2021.
29. Eicke, B.M.; Milke, K.; Schlereth, T.; Birklein, F. Comparison of continuous wave Doppler ultrasound ofthe radial artery and laser Doppler �owmetry of the �ngertips with sympathetic stimulation. J Neurol2004, 251, 958-962, doi:10.1007/s00415-004-0471-7.
30. Gupta, B.N.; Nier, K.; Hensel, H. Cold-sensitive afferents from the abdomen. P�ugers Arch 1979, 380,203-204.

Page 11/16
31. Wang, G.; Litscher, D.; Tian, Y.; Gaischek, I.; Jia, S.; Wang, L.; Zhang, W.; Litscher, G. Acupuncture PointLaterality: Evidence and Perspective. Integrative Medicine International 2014, 1, 102-107.
32. Mezentseva, L.V.; Pertsov, S.S. Correlation-and-Spectral Analysis of Time Series for MicrocirculatoryParameters in Vessels of Symmetrical Organs. Bull Exp Biol Med 2019, 166, 301-305,doi:10.1007/s10517-019-04337-y.
33. Scott, E.M.; Greenwood, J.P.; Stoker, J.B.; Gilbey, S.G.; Mary, D.A. Water drinking and sympatheticactivation. Lancet 2000, 356, 2013, doi:10.1016/S0140-6736(05)72987-1.
Figures
Figure 1
EGG power spectra changes. (A) Cutaneous electrode position, red indicates recording electrodes, greenindicates reference electrode; black indicates ground electrode; (B) raw data of EGG; (C) power spectra ofEGG; (D) EGG peak frequency before and after stimulation. Before stimulation, F(2,57)=0.38, P=0.6884;after stimulation, F(2,57)=6.45, P=0.003; for 4 °C stimulation, t=3.9819 Pcorr <0.001 (Pre VS Post, paired ttest); for 10 °C stimulation, t=4.9807 Pcorr <0.001 (Pre VS Post, paired t test); for 30 °C stimulation,t=1.8492 Pcorr =0.24 (Pre VS Post, paired t test). Pcorr: corrected p value.

Page 12/16
Figure 2
Change in HRV. (A) ECG signal from channel 1. (B) RR intervals of ECG. (C) Change rate of mean RR,F(2,57)=8.73, P =0.0005, **, Pcorr <0.01 (4 °C VS 30 °C); ##, Pcorr <0.01 (10 °C VS 30 °C ). (D) Changerate of RMSSD, F(2,57)=3.75, P =0.029. *, Pcorr <0.05, (4 °C VS 30 °C). Pcorr: corrected p value. All valuesare reported as the mean±SE.

Page 13/16
Figure 3
Blood perfusion in both sides. (A) Recording position at ST 36. (B) Raw data of blood �ux in both sides.(C) The absolute value of the difference between two sides. (D) Laterality index of blood perfusion. Maineffect of stimulates: F(2,57)=5.749, P=0.0053; main effect of time: F(3,171)=5.268, P=0.00169;interaction effect: F(6,171)=5.8, P<0.0001. Post hoc analysis revealed a signi�cant increase at 30 °Cgroup from the �rst session *, Pcorr<0.05, **, Pcorr<0.01 (4 °C VS 30 °C); #, Pcorr<0.05, ##, Pcorr<0.01 (10°C VS 30 °C). Pcorr: corrected p value. All values are reported as the mean±SE.

Page 14/16
Figure 4
Change rate of different frequency intervals transformed by wavelet. (A) Wavelet analysis of blood �ux.(B) Frequency interval I (0.0095-0.02 Hz), main effect of stimulates: F(2,57)=0.723, P=0.49; main effect oftime: F(3,171)=7.923, P<0.01; interaction effect: F(6,171)=0.954, P=0.458. (C) Frequency interval II (0.02-0.06 Hz), main effect of stimulates: F(2,57)=0.952, P =0.392; main effect of time: F(3,171)=9.371, P<0.01;interaction effect: F(6,171)=0.696, P=0.653. (D) Frequency interval III (0.06-0.15 Hz), main effect ofstimulates: F(2,57)=3.288, P =0.0445; main effect of time: F(3,171)=2.485, P=0.0624; interaction effect:F(6,171)=2.7, P=0.0157. (E) Frequency interval IV (0.15-0.4 Hz), main effect of stimulates: F(2,57)=2.746,P =0.0727; main effect of time: F(3,171)=2.392, P=0.07036; interaction effect: F(6,171)=3.172, P=0.0056.(F) Frequency interval V (0.4-1.6 Hz), main effect of stimulates: F(2,57)=6.085, P =0.00403; main effect oftime: F(3,171)=3.159, P=0.0261; interaction effect: F(6,171)=5.1, P<0.001. Post hoc analysis revealed asigni�cant increase at 30 °C group from the �rst session *, Pcorr <0.05, **, Pcorr <0.01 (4 °C VS 30 °C); #,Pcorr <0.05, ##, Pcorr <0.01 (10 °C VS 30 °C). Pcorr: corrected p value. All values are reported as themean±SE.
Page 15/16
Figure 5
Relationship between laterality index of different frequency intervals and change rate of RMSSD. (A).Frequency I at 4 °C. (B). Frequency I at 10 °C. (C). Frequency I at 30 °C. (D) Frequency II at 4 °C. (E)Frequency II at 10 °C. (F) Frequency II at 30 °C. (G) Frequency III at 4 °C. (H) Frequency III at 10 °C. (I)Frequency III at 30 °C. (J) Frequency IV at 4 °C. (K) Frequency IV at 10 °C. (L) Frequency IV at 30 °C. (M)Frequency V at 4 °C. (N) Frequency V at 10 °C. (O) Frequency V at 30 °C. ρ, Spearman’s correlationcoe�cient; Pcorr, corrected p value.

Page 16/16
Figure 6
General illustration of the relationship. There was no signi�cant correlation between the laterality index oflower extremity blood �ow and DF or RMSSD. Under the condition of 4 °C stimulation, there was a weaknegative correlation between the laterality index of frequency interval I and RMSSD after wavelettransform. There was a weak positive correlation between the laterality index of interval II and RMSSDunder the 30 °C stimulation. Red line indicates Pcorr> 0.05; while green line indicates Pcorr< 0.05.
Supplementary Files
This is a list of supplementary �les associated with this preprint. Click to download.
supplementary.docx