Embed Size (px)
Citation preview

Extremes and marine stormsin the Mediterranean Sea
P.Lionello, Univ. of Lecce, Italy
1 Intro: GEV and generalities examples from RON and sea level in Venice2 some insight I): Storm surge trends for Venice3 generalities on waves and wave modeling4 some insight II): futures scenarios for storminess and implications for waves and surges...


Data gathering: long homogeneous series of data from observations or models
Event definition: a set of independent event, the set should contain many items, but few of them are used
EXTREME VALUE ANALYSIS is well established common paradigm
return values for relatively long periods
But many of other aspects are in practice mostly specific tothe problem, and only general guidelines are available

4 NOV. 1966 event
SLP and U10 Surge and waves
Cyclones (winds) , waves and surges

alghero crotone
pescara
monopolimazara
ponza la spezia
=0.30±0.14 =0.43±0.15 =0.07±0.28 =-0.10±0.22
=0.17±0.16 =0.02±0.17 =-0.10±0.19=4.740.15=4.820.18=4.290.14
=3.700.11=4.760.16=4.660.14=7.420.21

alghero
crotone
pescara
monopoli
mazara
ponza
la spezia

1940 to 1969 1970 to 2000
1940 to 1969
1970 to 2000
GEV distribution
Venice surge:Extreme values distribution

EXTREMES WAVES, SURGES IN THE ADRIATIC SEA IN A 2xCO2 SCENARIO
P.Lionello, F.Dalan, E.Elvini, A.Nizzero

The common element of wave and surges is WIND
More intense cyclones
Higher wind speeds
Higher waves and storm surges
Loss of lives, loss of properties, loss of economic resources, cultural and
environmental heritages, increased costs of coastal defences

CONSEQUENCES ON WAVE FIELDS AND STORM SURGE
A DOWNSCALING PROCEDURE APPLIED TO THE ADRIATIC SEA

SIMULATED PREDICTOR
DYNAMICAL MODELS OF OCEAN WAVES AND
STORM SURGES
STATISTICALMODEL
SIMULATED WAVES AND SURGES
2) The surge level and the wave field are computed from the wind field using a barotropic (single layer) circulation model and a spectral wave model (WAM)
The downscaling procedure consists of two steps.
1) A regional wind field is derived from the sea level pressure field (available every 6 hours) by CCA of the PCA prefiltered fields
PREDICTOR: SLP
PREDICTAND: U10
SIMULATED PREDICTAND: U10

downscaling
downscaling
T106
T106Observations
downscaling
T106
Observations
The downscaling procedure has been tested applying it to the ERA-15 SLP data. The same period has also been simulated using directly the T106 winds. The downscaling produces a large improvement in the simulated Significant Wave Height and surge levels. However, levels during peak events remain underpredicted.

scenario max 100 years depth
OBS
CO2 4.5 5.60.3
CTR 5.6 6.10.4
6.750.65.1
RESULTS: SIGNIFICANT WAVE HEIGHT

CO2
CTR
CO2
CTR
CO2
CTR
MAX FREQUENCY 100-YEAR RETURN VALUES

STORM SURGE

800 2000
Venice:Frequency of surges
East coast of England:Frequency of surges
Figs from D.Camuffo, (1993)Theor.Appl.Climatol.47,1-14
Are the surges in Venice a result of recent climate changes?
Is their frequency related to global processes?

Source: Report by P.Canestrelli
Surges above 110cm level(reference: fixed reference level)
Sea level rise
Surges above 110cm level(reference: annual mean sea level)
1865 2000
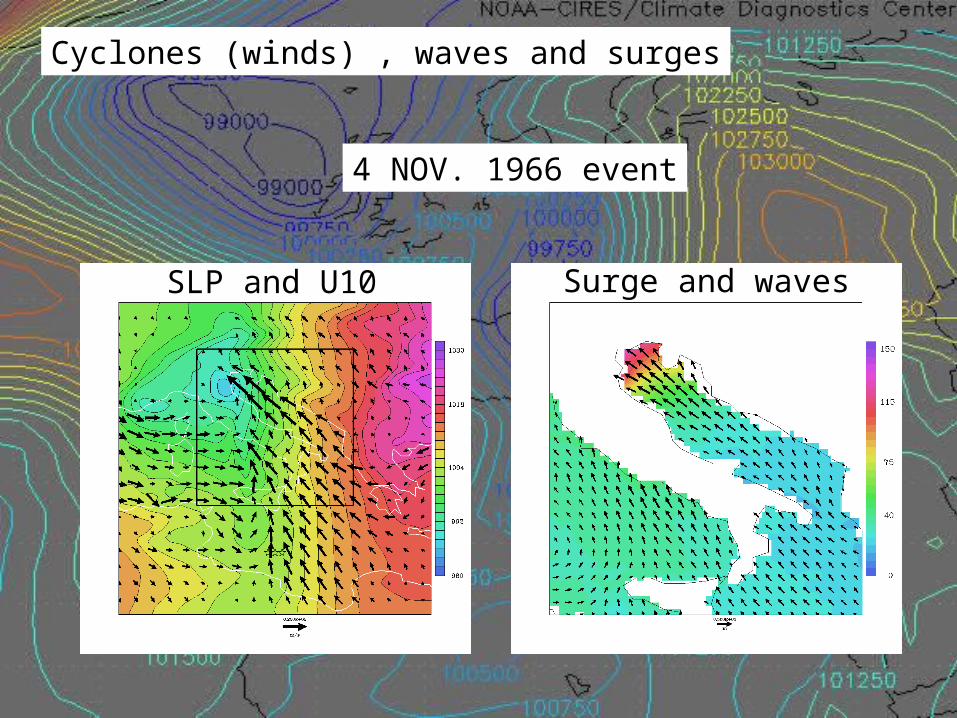
Trend in frequency/intensity of storm surges?
Trend in frequency/intensity of storm surges?
The observed trend is mostly produced by loss of ground level. This has no relation with more intense storms in a changed climate… however, a smaller trend could be present.
Is this small trend an indication of what could be expected in a 2XCO2 CLIMATE?

scenario max 100 years depth
OBS
CO2 119 1258
CTR 109 128 8
1841508129
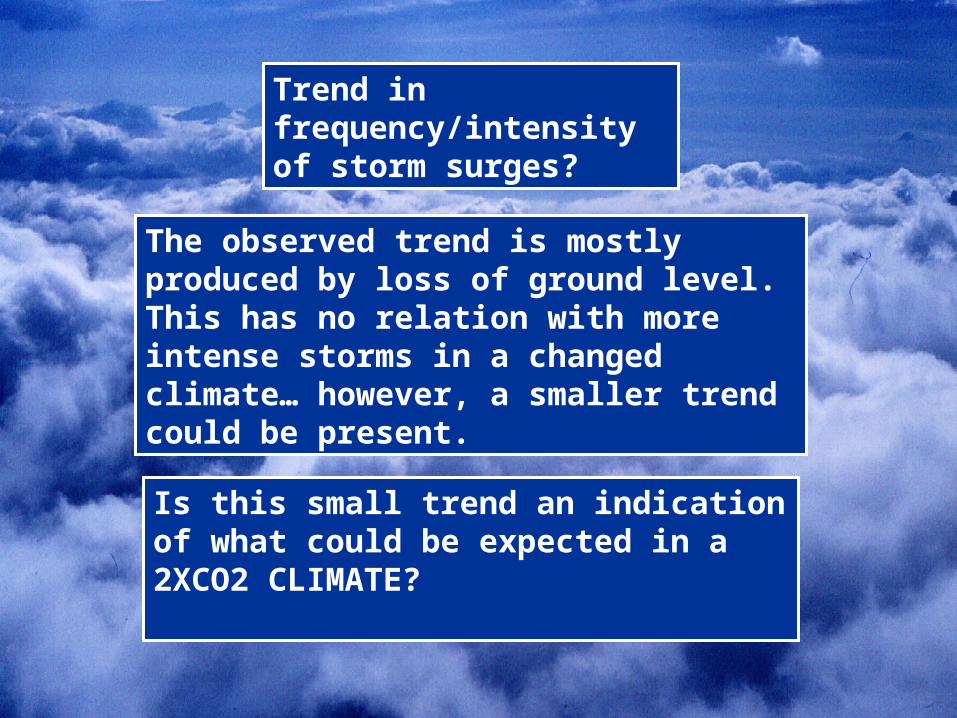
RESULTS: SURGE
CO2
CTR
CO2
CTR
CO2
CTR
MAX FREQUENCY 100-YEAR RETURN VALUES

The CO2 scenario presents a marginally diminished wave activity in the southern Adriatic.
The two scenarios present substantially equivalent extreme surge levels. There is a minor increase in the CO2 scenario.
The doubled CO2 simulation is characterized with more extreme weather events, but the (significant) difference between the two scenarios is small, and not fully significant for Mediterranean region
THE END
Clim. Res. (2002), 22, 147-159,Clim. Res. (2003) 23,217-231