Embed Size (px)
Citation preview

Accepted Manuscript
Extremely high aerosol loading over Arabian Sea during June 2008: the specific roleof the atmospheric dynamics and Sistan dust storms
D.G. Kaskaoutis, A. Rashki, E.E. Houssos, D. Goto, P.T. Nastos
PII: S1352-2310(14)00359-8
DOI: 10.1016/j.atmosenv.2014.05.012
Reference: AEA 12956
To appear in: Atmospheric Environment
Received Date: 19 March 2014
Revised Date: 3 May 2014
Accepted Date: 6 May 2014
Please cite this article as: Kaskaoutis, D.G., Rashki, A., Houssos, E.E., Goto, D., Nastos, P.T.,Extremely high aerosol loading over Arabian Sea during June 2008: the specific role of theatmospheric dynamics and Sistan dust storms, Atmospheric Environment (2014), doi: 10.1016/j.atmosenv.2014.05.012.
This is a PDF file of an unedited manuscript that has been accepted for publication. As a service toour customers we are providing this early version of the manuscript. The manuscript will undergocopyediting, typesetting, and review of the resulting proof before it is published in its final form. Pleasenote that during the production process errors may be discovered which could affect the content, and alllegal disclaimers that apply to the journal pertain.

MANUSCRIP
T
ACCEPTED
ACCEPTED MANUSCRIPT
1
Extremely high aerosol loading over Arabian Sea during June 2008: the 1
specific role of the atmospheric dynamics and Sistan dust storms 2
3
D.G. Kaskaoutis1*, A. Rashki2, E.E. Houssos3, D. Goto4, P.T. Nastos5 4
5
1School of Natural Sciences, Department of Physics, Shiv Nadar University, Tehsil Dadri, – 6
203207, India 7
2Natural Resources and Environment College, Ferdowsi University of Mashhad, Mashhad, Iran 8
3Laboratory of Meteorology, Department of Physics, University of Ioannina, 45110 Ioannina, 9
Greece 10
4National Institute for Environmental Studies (NIES), Tsukuba, Ibaraki 305-8506, Japan 11
5Laboratory of Climatology and Atmospheric Environment, Faculty of Geology and 12
Geoenvironment, University of Athens, 15784 Zografou, Greece 13
14
*Corresponding author: Dimitris G. Kaskaoutis: [email protected], 15
[email protected] Tel-Fax: +911202663801 16
17
Abstract 18
This study focuses on analyzing the extreme aerosol loading and the mechanisms, source areas 19
and meteorological conditions that favored the abnormal dust exposure towards Arabian Sea 20
during June 2008. The analysis reveals that the spatial-averaged aerosol optical depth (AOD) 21
over Arabian Sea in June 2008 is 0.5 (78.2%) higher than the 2000-2013 mean June value and is 22
mostly attributed to the enhanced dust activity and several (18) dust storms originated from the 23
Sistan region (Iran-Afghanistan borders). Landsat images show that the marshy lakes in Sistan 24
basin got dried during the second half of June 2008 and the alluvial silt and saline material got 25
easily eroded by the intense Levar winds, which were stronger (>15-20 ms-1) than the 26
climatological mean for the month of June. These conditions led to enhanced dust exposure from 27
Sistan that strongly affected the northern and central parts of the Arabian Sea, as forward air-28
mass trajectories show. The NCEP/NCAR reanalysis reveals an abnormal intensification and 29
spatial expansion of the Indian low pressure system towards northern Arabian Sea in June 2008. 30

MANUSCRIP
T
ACCEPTED
ACCEPTED MANUSCRIPT
2
This suggests strengthening of the convection over the arid southwest Asia and exposure of 31
significant amount of dust, which can reach further south over Arabian Sea favored by the 32
enhanced cyclonic circulation. MODIS imagery highlighted several dust storms originated from 33
Sistan and affecting Arabian Sea during June 2008, while the SPRINTARS model simulations of 34
increased AOD and dust concentration over Sistan and downwind areas are in agreement with 35
ground-based and satellite observations. 36
37
Keywords: Arabian Sea; severe AOD; dust storms; remote sensing; synoptic meteorology; 38
SPRINTARS 39
40
1. Introduction 41
The aerosol field over Arabian Sea is strongly influenced by the Asian pollution outflow during 42
the post-monsoon and winter seasons and by dust storms originated from Middle East, Arabia 43
and southwest Asia during pre-monsoon and monsoon seasons (Tindale and Pease, 1999; Dey 44
and di Girolamo, 2010), resulting in the highest annual aerosol optical depth (AOD) of about 0.6-45
0.8 during June - August (Kaskaoutis et al., 2011). Satellite observations have shown a strong 46
south-to-north gradient in AOD, with values above 1.0-1.2 in the northernmost part associated 47
with larger contribution of aerosols of desert origin (Satheesh et al., 2010; Prijith et al., 2013). 48
The vertical profile of aerosols also revealed the significant continental dust outflow, which 49
progressively increases in altitude (>2-3 km) along its transport over central and southern 50
Arabian Sea (Prijith et al., 2013). The dominance of the dust aerosols over central and northern 51
parts of the Arabian Sea was also revealed from ship-cruise campaigns (ARMEX, ICARB) 52
during the pre-monsoon (Kalapureddy et al., 2009) and monsoon (Moorthy et al., 2005) seasons. 53
The aerosol field over Arabian Sea, its variations and the dusty clouds that are usually formed 54
are interlinked with the southwest Indian summer monsoon (Rahul et al., 2008; Manoj et al., 55
2011, 2013; Vinoj et al., 2014), while previous studies have shown some teleconnections with 56
El-Nino Southern Oscillation (ENSO) (Gadgil et al., 2003; Abish and Mohanakumar, 2013). 57
Furthermore, the seasonal change of the Inter-Tropical Convergence Zone (ITCZ) controls the 58
meteorological and atmospheric dynamics over Arabian Sea (Krishnamurthi et al., 1998), while 59
Satheesh et al. (2006) found large negative aerosol radiative forcing at surface associated with an 60
overall top of the atmosphere cooling. 61

MANUSCRIP
T
ACCEPTED
ACCEPTED MANUSCRIPT
3
The Sistan region, which is located in the southeastern Iran along the Afghanistan and Pakistan 62
borders, has been considered as a major dust source in southwest Asia (Middleton, 1986; 63
Prospero et al., 2002; Léon and Legrand, 2003; Ginoux et al., 2012; Goudie et al., 2013) due to 64
the extreme intensity of the northerly Levar or “120-day” wind during the June-September 65
period (McMahon, 1906). Several papers have investigated the dust activity, outflows and 66
relation with the Levar wind over the region (Rashki et al., 2012, 2013a, b, 2014; Alizadeh 67
Choobari et al., 2013; Ekhtesasi and Gohari, 2013; Rezazadeh et al., 2013). The dust outbreaks 68
originated from Sistan take place in the northernmost lowland of the region, which is covered by 69
shallow (<4 m in depth), marshy and ephemeral lakes (Hamouns, approximately 160 km long 70
and 8–25 km wide with nearly 4,500 km2 surface area) that are fed from the discharge of the 71
Helmand river in Afghanistan. Rashki et al. (2013c) and Sharifikia (2013) revealed the strong 72
linkage between the dust activity and water coverage in the Hamoun dry-bed lakes. Due to 73
extreme hot-dry conditions during the summer months and, depending on the snowfall and 74
snowmelt in southern Hindu Kush mountains and on the precipitation variability over the region, 75
the lakes usually get dried, as occurred in several years during the last decade (Rashki et al., 76
2013c). When the lakes get dried, a saline alluvial clay material is left at the dried beds, which is 77
easily eroded by the strong Levar wind (>15 ms-1), thus forming intense dust storms that cover 78
Sistan and downwind areas, also affecting Karachi (Alam et al., 2011) and northern part of the 79
Arabian Sea. 80
The dust-storm occurrence over Sistan has a significant inter-seasonal and intra-annual 81
variability due to the reasons mentioned above, thus contributing to significant fluctuation in the 82
aerosol loading over the downwind areas, one of which is the northern Arabian Sea. In the 83
present study, we highlight the significant role that the Sistan dust storms play in the aerosol 84
loading over Arabian Sea, focusing on June 2008, when an extremely high aerosol loading 85
covered its northern and central parts. This work supplements the results obtained by Prijith et al. 86
(2013), who analyzed the atmospheric and meteorological conditions over Arabian Sea during 87
June 2008 providing some reasons for the exceptionally high AOD, but without reporting the 88
main dust source region, the topographic and meteorological dynamics that favored the 89
enhancement in dust activity. Thus, the role of the Sistan basin and the associated dust storms in 90
the aerosol loading over Arabian Sea remain unexplored. These issues are analyzed and 91
discussed in the current work by the synergy of ground-based (Zabol station) meteorological 92

MANUSCRIP
T
ACCEPTED
ACCEPTED MANUSCRIPT
4
data, synoptic meteorological reanalysis (NCEP/NCAR), satellite (Landsat, MODIS) remote 93
sensing, HYSPLIT air-mass trajectories and model (SPRINTARS) simulations. 94
95
2. Dataset 96
The dataset used in the current work consists of meteorological observations of surface wind at 97
10 m above ground level (agl) and horizontal visibility (vis) taken at Zabol meteorological 98
station located ~10-20 km away from the Hamoun lakes (Rashki et al., 2012). This dataset is 99
used in order to reveal the intensity of the northerly Levar wind and the frequency of occurrence 100
of dust-storms (vis<1 km, WMO 2005) over Sistan during June 2008. These observations are 101
compared with the climatological means reported elsewhere (Rashki et al., 2012) in order to 102
highlight the specific meteorological/atmospheric conditions over Sistan during June 2008 103
having as a consequence the significant dust aerosol outflow and the high loading over Arabian 104
Sea. 105
Level 3 collection 5 (C005.1) Terra MODIS AOD550 values using the dark target approach (Levy 106
et al., 2010) were obtained over Arabian Sea (8-26oN, 54-75oE) in order to reveal the high 107
abnormal AOD during June 2008 and the anomalies (spatially and temporally averaged) from the 108
long-term (2000-2013) AOD550 mean. Cloud-screening has been performed in the used MODIS 109
dataset via the procedure described in Levy et al. (2007). The dataset underlines the extreme 110
aerosol loading over Arabian Sea during June 2008, the source of which is worth to be examined. 111
Furthermore, MODIS imagery of certain dust storms originated from Sistan is provided as well 112
as Landsat ETM+ L1T (Enhanced Thematic Mapper plus) false color composite images over 113
Sistan focusing on land use – land cover changes and dryness of the Hamoun lakes during June 114
2008. 115
5-days forward air-mass trajectories were obtained via the HYSPLIT model (Draxler and Rolph, 116
2003) in order to reveal the transport pathways of the dusty air masses originated from the Sistan 117
basin (31.5oN, 61.5oE) at 500 m agl during 18 dust-storm events (vis< 1km) that were identified 118
during June 2008. This analysis helps in understanding the pathways and the altitudinal variation 119
of the dust plume along its transport, and to identify the downwind areas that are mostly affected 120
by the Sistan dust storms during June 2008. 121
Composite means of the geopotential heights at 1000 hPa, 850 hPa and 700 hPa were obtained 122
from the National Center for Environmental Prediction/National Center for Atmospheric 123
Research (NCEP/NCAR) re-analysis project (Kalnay et al., 1996) aiming to identify the synoptic 124

MANUSCRIP
T
ACCEPTED
ACCEPTED MANUSCRIPT
5
meteorological conditions that prevailed over southwest Asia during June 2008 as well as the 125
composite anomalies from the mean climatology (1981-2010) in June. This analysis reveals the 126
important role of the atmospheric circulation on the excessive dust outflow from southwest Asia 127
towards Arabian Sea during June 2008. The NCEP/NCAR maps cover a broad region of south-128
central Asia (40o to 120o E and 0o to 50o N) with 2.5o x 2.5o spatial resolution. 129
Finally, the SPRINTARS (Spectral Radiation-Transport Model for Aerosol Species) model was 130
used to simulate the AOD550 and dust concentration over south Asia during June 2008 and to 131
reveal differences from the long-term (2001-2010) means. SPRINTARS simulates AOD for 132
various aerosol components (black carbon, organic carbon, sulfate, soil dust and sea salt) with 133
prescribed optical properties and meteorological fields from NCEP/NCAR reanalysis (wind 134
field, water vapor and temperature) with the T106 horizontal resolution (1.1°x1.1°) (Nakajima et 135
al., 2000; Takemura et al., 2009). The dust emission processes are online-calculated at 6 bins 136
(from 0.1 to 10 µm) according to an empirical relation by Gilletee (1978), depending on near-137
surface wind speed above 6.5 ms-1, vegetation cover, leaf area index, soil moisture and snow 138
amount (Goto et al., 2011). The sea-salt emissions over the oceanic environment are also online-139
calculated at 4 bins (from 0.1 to 10 µm) as a function of wind speed using Monahan’s (Monahan 140
et al., 1986) parameterization. The SPRINTARS AODs have been compared with various 141
satellites, including MODIS, under AeroCom (http://aerocom.met.no/) project (Kinne et al., 142
2006), while the dust loading, which dominates in the current simulations, was also compared to 143
various measurements under the same project (Huneeus et al., 2011), revealing that SPRINTARS 144
simulations are well within the uncertainty of the other global aerosol models and have 145
satisfactory agreement with observations. 146
147
3. Results and Discussion 148
3.1 The anomalous high AOD over Arabian Sea in June 2008 149
Figure 1 shows the spatial-averaged monthly mean AOD550 values over Arabian Sea (8o – 26oN, 150
54o – 74oE) in June during the period 2000-2013 in box & whisker view. The Terra MODIS 151
AOD550 over the region ranges from 0.4 to 0.75 on monthly-mean basis exhibiting a mean of 152
0.59±0.13. However, during June 2008 an abnormal high AOD550 of 1.09±0.49 is observed over 153
the marine environment, which is 0.50 (72.8%) above than the 14-years (2000-2013) mean or 154
97% higher than the 2000-2010 mean according to Prijith et al. (2013). Detailed discussions 155

MANUSCRIP
T
ACCEPTED
ACCEPTED MANUSCRIPT
6
about the wind field, continental outflow, vertical aerosol structure and possible reasons favoring 156
the extreme aerosol loading in June 2008 are included in Prijith et al. (2013). 157
The mean MODIS-AOD550 distributions over Arabian Sea during June 2000-2013 and June 2008 158
are shown in Fig. 2a, b, respectively for comparison purposes. The spatial distribution of the 159
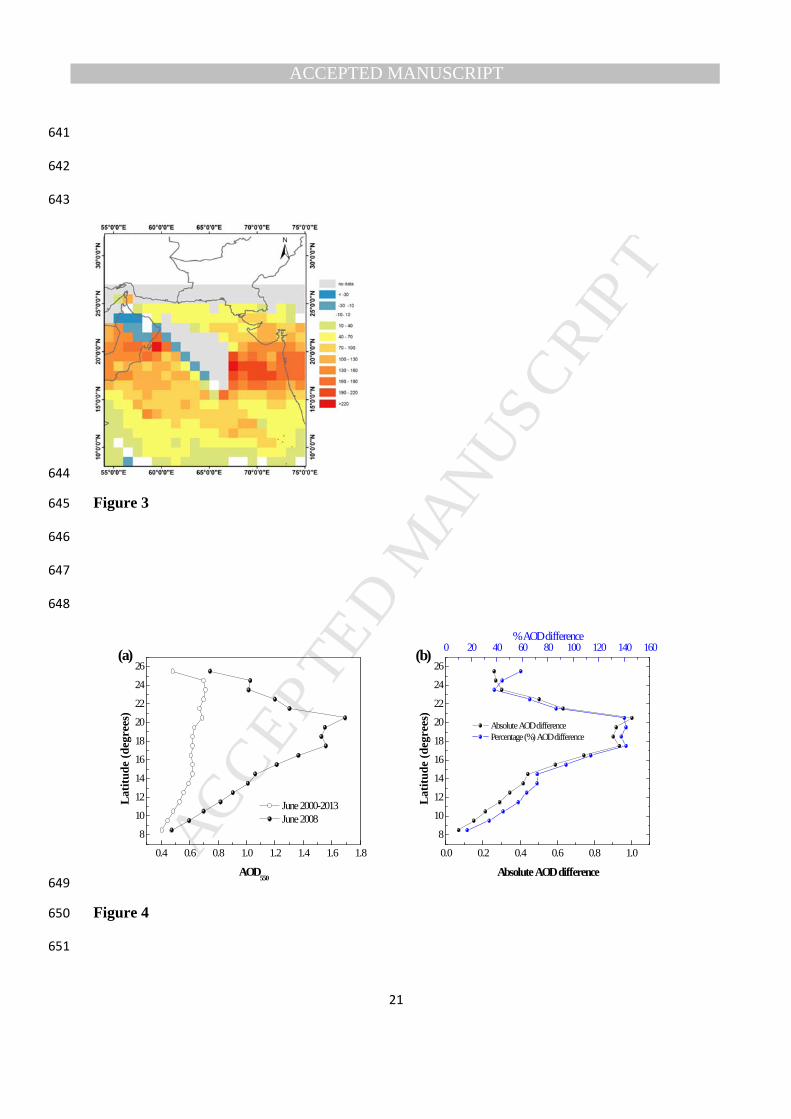
AOD550 anomalies in June 2008 with respect to the long-term mean is shown in Fig. 3. The June 160
2000-2013 AOD spatial distribution (Fig. 2a) shows enhanced values over northernmost eastern 161
Arabian Sea along the Pakistan coast and over the Oman Sea at the western part. The AODs over 162
these areas are in the range of 0.8-1.0 and are strongly influenced by the nearby desert regions. 163
More specifically, the high AOD along the Pakistan coast is mostly attributed to dust outbreaks 164
primarily from Sistan and secondarily from dust-source regions located in valleys (Dasht-e Lut) 165
and from salt/dry lakes along the coastal Makran Mountains (e.g. Hamun-e-Jaz Murian, 1087 166
km2, http://commons.wikimedia.org/wiki/File:Dasht-e_Lut_Dust_Storm_Iran_TMO_2010023_lrg.jpg). 167
The high aerosol loading along the Oman coast is associated with dust exposure from the Oman 168
and Rub Al Khali deserts, which are the most active dust sources in Arabian Peninsula (Najafi et 169
al., 2013; Rezazadeh et al., 2013). The aerosol loading is significantly lower over the central part 170
of the Arabian Sea, while the southern part can be characterized as moderate-polluted marine 171
environment, with AOD around 0.4. This long-term aerosol field is strongly altered in June 2008 172
(Fig. 2b), when very high (>2) AOD550 values are observed over the northeastern coast and along 173
the Oman coast. However, the extreme aerosol loading is not limited only over these areas, but 174
covers nearly the whole Arabian Sea northern than 12oN, with anomalies from the 14-year mean 175
as high as 1-1.5 in absolute AOD550 values corresponding to ~150-200% (Fig. 3). The spatial-176
averaged AOD550 was found to range from 0.36 (5 June) to 2.95 (19 June), while its mean value 177
was above 0.9 from 8 to 30 June 2008, except of 25 June, revealing the intensity and permanency 178
of the phenomenon. 179
The latitudinal-mean gradient of AOD550 over Arabian Sea in June shows a progressively 180
increasing trend from south-to-north (Fig. 4a), which is analytically investigated along with 181
radiative forcing values in Satheesh et al. (2010). On long-term basis, the AOD550 increases from 182
0.4 at 8oN to about 0.7 at the northernmost Arabian Sea (23o - 24oN). This pattern is drastically 183
changed during June 2008, when the nearly similar AOD550 at 8o increases to 1.6-1.7 at 18o – 184
21oN corresponding to a mean difference of about 1.0 or 140% (Fig. 4b) from the long-term 185
mean. It is characteristic that the AOD exhibits its highest increase about 4o-6o southern from the 186
north Arabian Sea coast suggesting extensive continental outflow and accumulation of dust at 187

MANUSCRIP
T
ACCEPTED
ACCEPTED MANUSCRIPT
7
about 400-500 km south of the Pakistan coast. In synopsis, the analysis revealed that the very 188
high aerosol loading during June 2008 is associated with enhanced values over nearly the whole 189
Arabian Sea and not only limited over its northern part. This suggests a large dynamic for long-190
range transport of the dusty continental air masses from the northern arid regions, which was not 191
seen in the other years. 192
193
3.2 Sistan meteorology and dust storms during June 2008 194
The Landsat ETM+L1T false color composite images (bands 4, 3, and 2) show a small water 195
coverage in the Hamoun lakes on 5 June 2008 (Fig. 5), which have been absolutely dried by the 196
end of June (right image). The dry-bed lakes are then composed by a saline clay alluvial material 197
(Rashki et al., 2013c), which is easily eroded by the strong Levar wind, resulting in significant 198
dust uplift and massive dust outbreaks, especially during the second half of June 2008. 199
Therefore, one of the critical reasons for the high aerosol loading over southwest Asia and the 200
consequent outflow over Arabian Sea during June 2008 is the dryness of the Hamoun lakes and 201
the enhancement in dust activity over the Sistan basin. The visibility recordings at Zabol 202
meteorological station showed that 18 out of the 30 days in June 2008 were considered as dust 203
storms with horizontal visibility less than 1 km. More specifically, from 16 June to 1 July the 204
visibility was always below 1 km and on some days (16-17, 27-30 June), it fell down to 100 m 205
corresponding to severe dust/sand storms, as the station is very close to the dust-source region. 206
Aqua-MODIS true color images over Arabian Sea on several days during the second half of June 207
2008 (Fig. 6) reveal high turbid atmospheres and significant amount of dust transported over the 208
marine environment. The Sistan/Hamoun basin seems to be very active in dust-storm outflows 209
on all days, except 24 June. The dust plumes follow an anti-clockwise direction forming a giant 210
“U” (see the arrows), which has been highlighted in previous studies (Alam et al., 2011; Rashki 211
et al., 2012, 2013b, c). The dust storms originated from Sistan are initially moving southwards 212
driven by the strong northern Levar wind and, then, are progressively shifting towards east-213
northeast affecting mostly the northernmost eastern part of Arabian Sea and south-central 214
Pakistan. Furthermore, the MODIS observations show that the dust plumes from the northern 215
arid continents strongly affect a large part of the Arabian Sea, while another significant dust 216
pathway is revealed along the Indus basin, affecting the northeastern part of the Arabian Sea and 217
the northwestern Indian coast (see arrows on 16-19 June and 28-30 June). On several cases, the 218
strong Levar wind seems to activate (but in a much lesser degree) other dust sources along the 219

MANUSCRIP
T
ACCEPTED
ACCEPTED MANUSCRIPT
8
Makran mountains affecting Oman Sea, while the contribution of the southern Arabian Peninsula 220
could not be ignored (dust storms on 17-21 June). A strong SW flow dominates over central-221
western parts of the Arabian Sea along the southern edge of the Arabian Peninsula and the horn 222
of Africa, which also contributes to dust transport over Arabian Sea, as the arrows show. The 223
dust-plume pathways and travelling altitude over Arabian Sea are controlled by the concurrent 224
flow of the north Levar and the southwesterly monsoonal winds (Rashki et al., 2014). In general, 225
these two oppose wind regimes shift the dusty air masses originated from Sistan towards eastern 226
directions after reaching the northernmost part of the Arabian Sea. The Indian summer thermal 227
low and its variations in turbulence, vorticity, convergence, may also affect the long-range 228
transport and the altitudinal variation of the dust plumes over Arabian Sea (Aloysius et al., 2011; 229
Prijith et al., 2013). 230
However, during June 2008 the dusty air masses originated from Sistan, except of the 231
northernmost eastern part of the Arabian Sea, seem to affect the central and western parts as 232
well, and considering the numerous (18) dust storms during that month, the high dust-aerosol 233
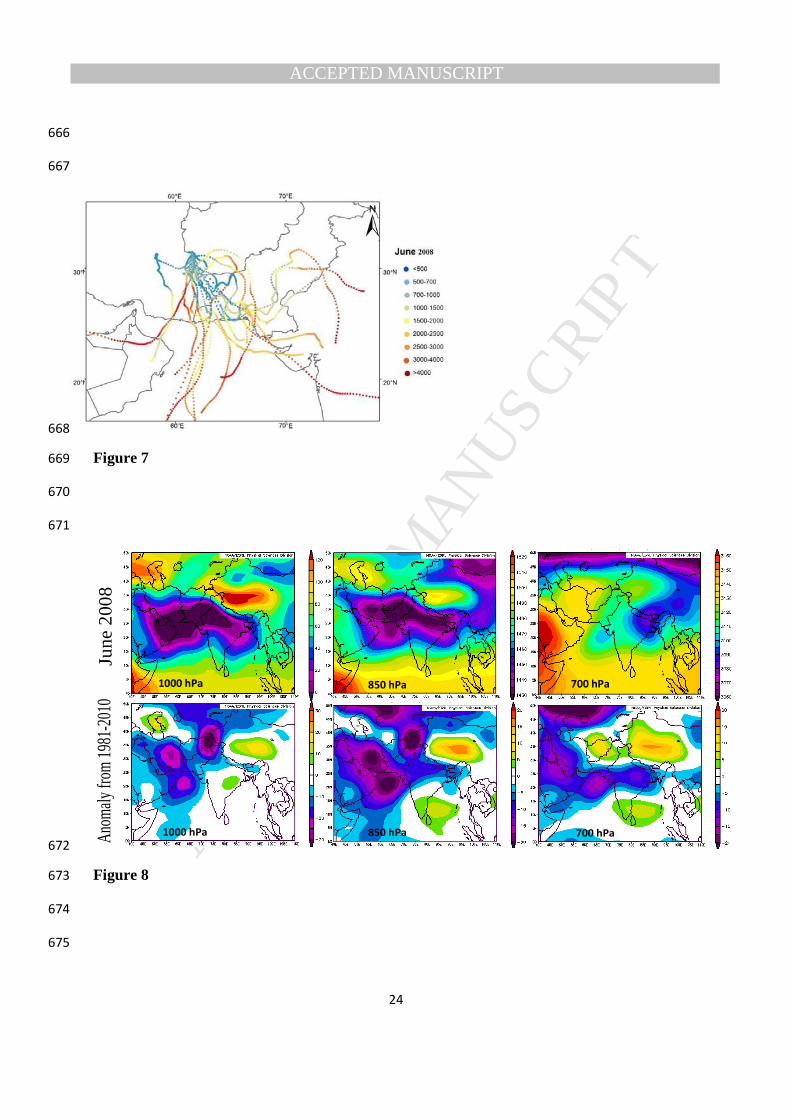
loading over Arabian Sea can be explained. Figure 7 shows that the dusty air masses originated 234
from Sistan are mostly transported within the lower boundary layer over the arid terrain in 235
southwestern Pakistan and when they reach over Arabian Sea they are progressively increasing 236
in altitude to above 2-3.5 km. CALIPSO profiles of extinction coefficient and volume 237
depolarization ratio revealed increased dust occurrence at this altitude over northern part of 238
Arabian Sea progressively decreasing in intensity towards the south (Prijith et al., 2013). In 239
synopsis, the current analysis reveals that the abnormal high dust-aerosol loading over Arabian 240
Sea during June 2008 is attributed to intense dust activity and several dust-storm exposures from 241
Sistan basin. The absolute dryness of the Hamoun lakes during the second-half of June 2008 242
favored the occurrence of intense and persistent dust storms, which lowered the visibility over 243
the source region at less than 1 km for 17 consecutive days (16 June – 1 July 2008). The soil 244
moisture at 0-10 cm, which is a crucial parameter for dust erosion (Goudie and Middleton, 245
2001), was found to be lower (11.2 kgm-2; MERRA 2D observations over Sistan basin) during 246
June 2008 compared to the summer (June-September 2000-2013) mean of 11.6 kgm-2. The 247
dryness of the soil was continued during July-September 2008 (10.8 kgm-2), but the dust activity 248
was much lower (less than 8 dust storms per month) due to weakening of the Levar. During 16 – 249
30 June the intensity of the Levar wind over Hamoun dry-bed lakes was significantly increased 250
(mean of 22.5±4.3 ms-1), which is much larger than the climatological (1963-2010) June mean of 251
MANUSCRIP
T
ACCEPTED
ACCEPTED MANUSCRIPT
9
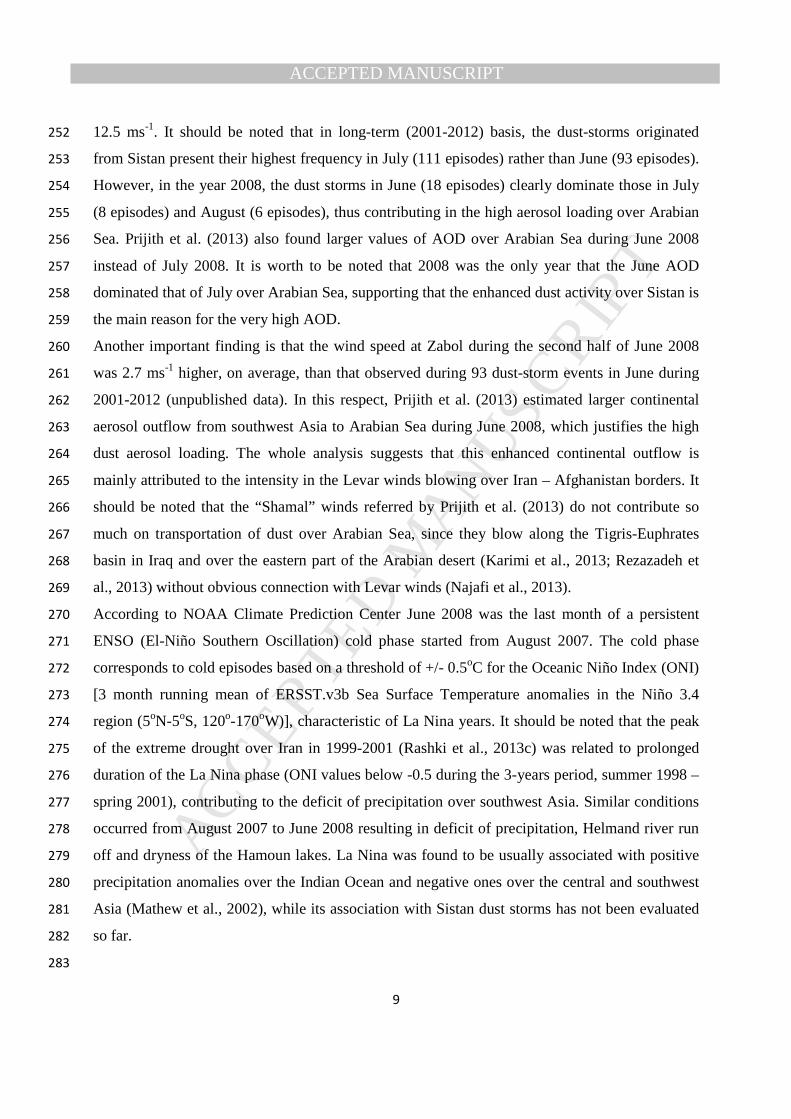
12.5 ms-1. It should be noted that in long-term (2001-2012) basis, the dust-storms originated 252
from Sistan present their highest frequency in July (111 episodes) rather than June (93 episodes). 253
However, in the year 2008, the dust storms in June (18 episodes) clearly dominate those in July 254
(8 episodes) and August (6 episodes), thus contributing in the high aerosol loading over Arabian 255
Sea. Prijith et al. (2013) also found larger values of AOD over Arabian Sea during June 2008 256
instead of July 2008. It is worth to be noted that 2008 was the only year that the June AOD 257
dominated that of July over Arabian Sea, supporting that the enhanced dust activity over Sistan is 258
the main reason for the very high AOD. 259
Another important finding is that the wind speed at Zabol during the second half of June 2008 260
was 2.7 ms-1 higher, on average, than that observed during 93 dust-storm events in June during 261
2001-2012 (unpublished data). In this respect, Prijith et al. (2013) estimated larger continental 262
aerosol outflow from southwest Asia to Arabian Sea during June 2008, which justifies the high 263
dust aerosol loading. The whole analysis suggests that this enhanced continental outflow is 264
mainly attributed to the intensity in the Levar winds blowing over Iran – Afghanistan borders. It 265
should be noted that the “Shamal” winds referred by Prijith et al. (2013) do not contribute so 266
much on transportation of dust over Arabian Sea, since they blow along the Tigris-Euphrates 267
basin in Iraq and over the eastern part of the Arabian desert (Karimi et al., 2013; Rezazadeh et 268
al., 2013) without obvious connection with Levar winds (Najafi et al., 2013). 269
According to NOAA Climate Prediction Center June 2008 was the last month of a persistent 270
ENSO (El-Niño Southern Oscillation) cold phase started from August 2007. The cold phase 271
corresponds to cold episodes based on a threshold of +/- 0.5oC for the Oceanic Niño Index (ONI) 272
[3 month running mean of ERSST.v3b Sea Surface Temperature anomalies in the Niño 3.4 273
region (5oN-5oS, 120o-170oW)], characteristic of La Nina years. It should be noted that the peak 274
of the extreme drought over Iran in 1999-2001 (Rashki et al., 2013c) was related to prolonged 275
duration of the La Nina phase (ONI values below -0.5 during the 3-years period, summer 1998 – 276
spring 2001), contributing to the deficit of precipitation over southwest Asia. Similar conditions 277
occurred from August 2007 to June 2008 resulting in deficit of precipitation, Helmand river run 278
off and dryness of the Hamoun lakes. La Nina was found to be usually associated with positive 279
precipitation anomalies over the Indian Ocean and negative ones over the central and southwest 280
Asia (Mathew et al., 2002), while its association with Sistan dust storms has not been evaluated 281
so far. 282
283

MANUSCRIP
T
ACCEPTED
ACCEPTED MANUSCRIPT
10
3.4 Synoptic meteorological conditions during June 2008 284
Previous studies (Alizadeh Choobari et al., 2013; Rashki et al., 2014) highlighted the major role 285
of the local and regional topography and meteorological dynamics in controlling the dust activity 286
over southwest Asia. However, when studying dust storms, the synoptic conditions cannot be 287
ignored, since they can be associated to meso-scale or even micro-scale atmospheric phenomena 288
(Kaskaoutis et al., 2012a; Nastos, 2012). 289
Apart of the important role of the local-scale meteorological dynamics discussed in the previous 290
section, the synoptic conditions over south Asia in June 2008 are also examined. The 291
NCEP/NCAR composite means of geopotential heights (gpm) at lower tropospheric levels (1000 292
hP, 850 hPa, 700 hPa) over south Asia in June 2008 (Fig. 8, upper graphs) reveal the presence of 293
a cyclonic circulation at 1000 hPa and 850 hPa extended from northwestern arid India to 294
Pakistan, southern Afghanistan, Iran and eastern Arabian Peninsula. Furthermore, the northern 295
Arabian Sea is under the strong influence of the cyclonic circulation. These synoptic conditions 296
imply a strong SW air flow pattern towards Arabian Sea, reaching 15 ms-1 to 18 ms-1 at the 297
southwestern parts, with respect to the isobaric levels at 1000 hPa and 850 hPa, respectively (Fig. 298
9, composite mean winds). In this point, it is worthy to mention that the SW air flow has been 299
enriched by continental air masses advected from northern arid regions towards northern Arabian 300
Sea. At the 700 hPa level a ridge is extending from east Africa through the Arabian Peninsula, up 301
to Iran and Afghanistan, while a trough is dominant over India, extending over northeastern 302
Arabian Sea. At this isobaric level the air flow comes from west directions (11 ms-1) at the 303
southern parts of Arabian Sea against north air stream over the northern Arabian Sea (6 ms-1). At 304
a first glance this situation resembles the typical atmospheric circulation over south Asia during 305
the Indian summer monsoon. However, the anomalies patterns are characterized by pronounced 306
negative anomalies in the geopotential height field from 1000 hPa up to 700 hPa, reaching up -20 307
to -30 gpm over southeastern Iran and northern Arabian Sea (Fig. 8, lower graphs). The negative 308
anomalies imply that during June 2008 the Indian Low was deeper than usual and expanded 309
towards the northern Arabian Sea. This resulted in the enhancement of the turbulent conditions 310
over the study region, which favored increased dust entrainment into the atmosphere. On the 311
other hand, the expansion of the cyclonic circulation over northern Arabian Sea led to the 312
reinforcement of the dusty continental air masses outflow towards this region, which in 313
combination with the dryness of the Hamoun lakes and the enhancement of the Levar wind, 314
resulted to frequent dust-storms over Arabian Sea. The negative composite anomalies of 315
MANUSCRIP
T
ACCEPTED
ACCEPTED MANUSCRIPT
11
geopotential heights at 1000 hPa and 850 hPa practically form an enhancement of the trough that 316
allows the continental air masses to move further to the south, thus affecting central Arabian Sea. 317
This was evident from the air-mass trajectories (Fig. 7), which travel more to the south allowing 318
Sistan dust storms to affect central and western parts of the Arabian Sea and not only the 319
northernmost eastern part as shown from previous studies (e.g. Alam et al., 2011). Furthermore, 320
the negative composite anomalies of geopotential heights mostly at 850 hPa are linked with the 321
level (~1500 m) of higher dust presence over north Arabian Sea as observed via CALIPSO 322
profiles (Prijith et al., 2013). In synopsis, the abnormal atmospheric circulation over south Asia 323
in June 2008, characterized by the deeper and more expanded Indian low, enhances the 324
continental outflow and the movement of dusty air-masses far within the marine environment of 325
Arabian Sea. 326
327
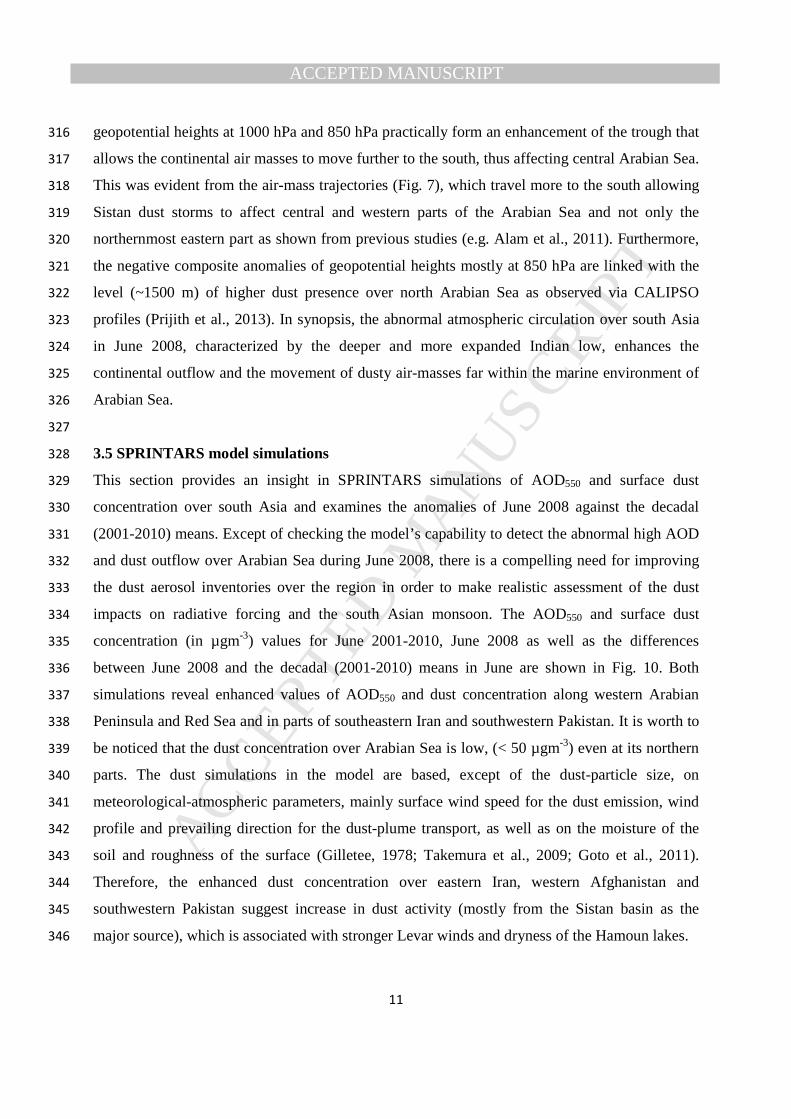
3.5 SPRINTARS model simulations 328
This section provides an insight in SPRINTARS simulations of AOD550 and surface dust 329
concentration over south Asia and examines the anomalies of June 2008 against the decadal 330
(2001-2010) means. Except of checking the model’s capability to detect the abnormal high AOD 331
and dust outflow over Arabian Sea during June 2008, there is a compelling need for improving 332
the dust aerosol inventories over the region in order to make realistic assessment of the dust 333
impacts on radiative forcing and the south Asian monsoon. The AOD550 and surface dust 334
concentration (in µgm-3) values for June 2001-2010, June 2008 as well as the differences 335
between June 2008 and the decadal (2001-2010) means in June are shown in Fig. 10. Both 336
simulations reveal enhanced values of AOD550 and dust concentration along western Arabian 337
Peninsula and Red Sea and in parts of southeastern Iran and southwestern Pakistan. It is worth to 338
be noticed that the dust concentration over Arabian Sea is low, (< 50 µgm-3) even at its northern 339
parts. The dust simulations in the model are based, except of the dust-particle size, on 340
meteorological-atmospheric parameters, mainly surface wind speed for the dust emission, wind 341
profile and prevailing direction for the dust-plume transport, as well as on the moisture of the 342
soil and roughness of the surface (Gilletee, 1978; Takemura et al., 2009; Goto et al., 2011). 343
Therefore, the enhanced dust concentration over eastern Iran, western Afghanistan and 344
southwestern Pakistan suggest increase in dust activity (mostly from the Sistan basin as the 345
major source), which is associated with stronger Levar winds and dryness of the Hamoun lakes. 346

MANUSCRIP
T
ACCEPTED
ACCEPTED MANUSCRIPT
12
Despite the different spatial resolution between SPRINTARS and MODIS, and the different 347
periods that considered for the retrieval of the anomalies (Figs. 4 and 10), the model simulations 348
are in general agreement with satellite observations. The simulated AOD550 is larger during June 349
2008 over nearly the whole Arabian Sea and most regions of southwest Asia with the larger 350
positive anomalies (60 - 120%) to be detected over the downwind to Sistan regions, like 351
southeastern Iran and gulf of Oman, suggesting increase in dust activity during June 2008. 352
According to SPRINTARS, the AOD550 over Arabian Sea was about 75% higher during June 353
2008 compared to the decadal-mean June value, which is in agreement with the MODIS 354
observations. Similarly, the dust concentration in June 2008 is shown to be much higher (~50 355
µgm-3) than the decadal mean over the arid regions of Iran and Afghanistan confirming the 356
Prijith et al.’s (2013) approach of enhanced continental outflow over Arabian Sea from northern 357
directions. However, some areas in southern Pakistan show decrease in dust concentration in 358
June 2008, while the model does not simulate pronounced differences (only a slight increase) 359
over the northern parts of the Arabian Sea. 360
361
4. Association between Sistan dust storms and Arabian Sea aerosols 362
The current analysis showed that the air masses originated from Sistan during the dust-storm 363
days were transporting further to the south affecting central Arabian Sea on certain days. Long-364
term investigation (not shown) of numerous (356) dust storms over Sistan during the summer 365
months (June-September) of the period 2001-2012 revealed that the dusty air masses originated 366
from Sistan affect the northernmost eastern part of the Arabian Sea in the vast majority (>80-367
85%) of the cases. In this respect, many studies (Alam et al., 2011; Rashki et al., 2012, 2013b; 368
Ekhtesasi and Gohari, 2013) revealed that the dust outflow from Sistan/Hamoun basin follows a 369
giant “U” affecting mostly the arid-land areas of southwest Asia. This dust-transport pathway is 370
strongly affected by the Indian summer monsoon, and the southwesterly flow over Arabian Sea 371
prevents the northern dusty air masses to significantly affect the central and southern parts of the 372
Arabian Sea, shifting them to northeastern directions. 373
The more southward movement of the Sistan dusty air masses and the wider spreading of the 374
dust plumes over central-south Arabian Sea during June 2008 (Figs. 6, 7) is an important factor 375
that explains the high-abnormal AOD over the oceanic region on that month. In this respect, 376
Prijith et al. (2013) noted enhanced continental outflow at lower tropospheric levels from the arid 377
regions northerly of Arabian Sea within the marine environment. The composite anomalies of the 378

MANUSCRIP
T
ACCEPTED
ACCEPTED MANUSCRIPT
13
synoptic weather patterns (Fig. 8) favor the dusty air masses to travel further to the south over 379
Arabian Sea and to significantly affect its northwestern part as well. Strong variations in aerosol 380
loading over Arabian Sea maybe associated with changes in monsoon circulation and intensity 381
(Vinoj et al., 2014). The study by Rahul et al. (2008) showed that higher aerosol loading over 382
Arabian Sea in July occurred during periods with normal-to-surplus of rainfall over India, while 383
the weakening of the Indian summer monsoon and the drought conditions in 2002 and 2004 were 384
associated with lower dust loading over Arabian Sea, limited over the northernmost eastern part. 385
Satellite observations showed that the abnormal high AOD in June 2008 was not limited only 386
over Arabian Sea, but expanded over the Indo-Gangetic Plains (Gautam et al., 2009; Kaskaoutis 387
et al., 2011), which seem to be mostly affected by Thar rather than Sistan dust storms. However, 388
it has not been examined if the dust activity over Sistan and Thar deserts can be associated or 389
even interlinked, since each region has its own characteristics, wind regimes and weather 390
conditions. 391
The current analysis revealed that the statement by Prijith et al. (2013) “the abnormal 392
enhancement in the observed AOD during June 2008 was primarily caused by a distinct increase 393
in dust storms over the northern continents and subsequent transport into the Arabian Sea” 394
corresponds to enhanced dust activity and numerous (18) dust-storm exposures from the 395
Sistan/Hamoun dry-bed basin. Furthermore, the SPRINTARS simulations of AOD and surface 396
dust concentration justified and supports the Prijith et al.’s (2013) notification that “The 397
anomalously large increase in aerosol loading over the Arabian Sea observed in June 2008 is 398
found to be mainly controlled by the enhanced mineral dust loading at the continental regions in 399
the NoAS (e.g., Iran, Afghanistan and the northwestern parts of the Indian subcontinent) and the 400
aerosol transport through the northern boundary of the Arabian Sea”. 401
402
4. Conclusions 403
The present study examined the factors that favored the abnormal high aerosol loading over 404
Arabian Sea during June 2008. Long-term MODIS observations showed an increase of 97% 405
(78.2%) of the AOD550 over Arabian Sea in June 2008 compared to the monthly mean during 406
2000-2010 (2000-2013). Prijith et al. (2013) attributed this increase to enhanced outflow of 407
continental aerosols (dust) from the arid and semi-arid regions located northerly of the Arabian 408
Sea, without emphasizing on a specific source or on the meteorological conditions favored the 409
dust exposure. The present work covered these issues by providing analysis of satellite imagery 410
MANUSCRIP
T
ACCEPTED
ACCEPTED MANUSCRIPT
14
and dataset (Landsat, MODIS), meteorological regimes (Zabol meteorological records, 411
NCEP/NCAR database), air-mass trajectories (HYSPLIT model) and model (SPRINTARS) 412
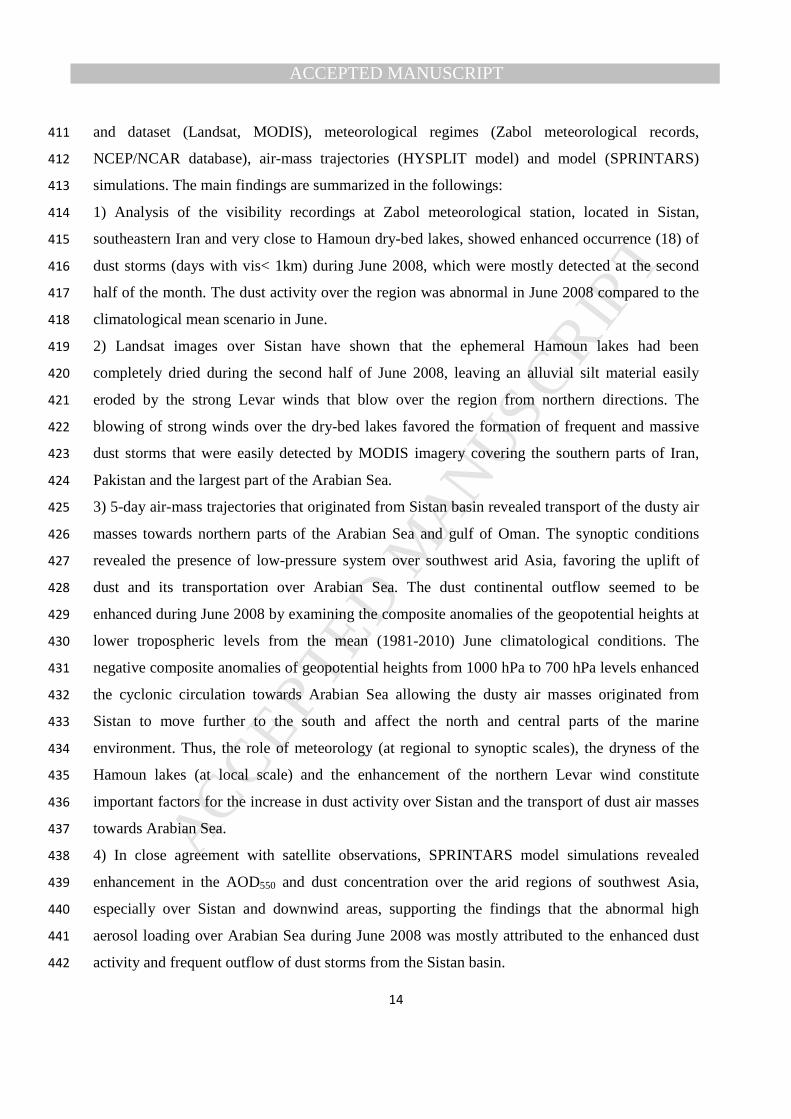
simulations. The main findings are summarized in the followings: 413
1) Analysis of the visibility recordings at Zabol meteorological station, located in Sistan, 414
southeastern Iran and very close to Hamoun dry-bed lakes, showed enhanced occurrence (18) of 415
dust storms (days with vis< 1km) during June 2008, which were mostly detected at the second 416
half of the month. The dust activity over the region was abnormal in June 2008 compared to the 417
climatological mean scenario in June. 418
2) Landsat images over Sistan have shown that the ephemeral Hamoun lakes had been 419
completely dried during the second half of June 2008, leaving an alluvial silt material easily 420
eroded by the strong Levar winds that blow over the region from northern directions. The 421
blowing of strong winds over the dry-bed lakes favored the formation of frequent and massive 422
dust storms that were easily detected by MODIS imagery covering the southern parts of Iran, 423
Pakistan and the largest part of the Arabian Sea. 424
3) 5-day air-mass trajectories that originated from Sistan basin revealed transport of the dusty air 425
masses towards northern parts of the Arabian Sea and gulf of Oman. The synoptic conditions 426
revealed the presence of low-pressure system over southwest arid Asia, favoring the uplift of 427
dust and its transportation over Arabian Sea. The dust continental outflow seemed to be 428
enhanced during June 2008 by examining the composite anomalies of the geopotential heights at 429
lower tropospheric levels from the mean (1981-2010) June climatological conditions. The 430
negative composite anomalies of geopotential heights from 1000 hPa to 700 hPa levels enhanced 431
the cyclonic circulation towards Arabian Sea allowing the dusty air masses originated from 432
Sistan to move further to the south and affect the north and central parts of the marine 433
environment. Thus, the role of meteorology (at regional to synoptic scales), the dryness of the 434
Hamoun lakes (at local scale) and the enhancement of the northern Levar wind constitute 435
important factors for the increase in dust activity over Sistan and the transport of dust air masses 436
towards Arabian Sea. 437
4) In close agreement with satellite observations, SPRINTARS model simulations revealed 438
enhancement in the AOD550 and dust concentration over the arid regions of southwest Asia, 439
especially over Sistan and downwind areas, supporting the findings that the abnormal high 440
aerosol loading over Arabian Sea during June 2008 was mostly attributed to the enhanced dust 441
activity and frequent outflow of dust storms from the Sistan basin. 442

MANUSCRIP
T
ACCEPTED
ACCEPTED MANUSCRIPT
15
443
444
Acknowledgements 445
Analyses and visualizations used in this study were produced with the Giovanni online data 446
system, developed and maintained by the NASA GES DISC. We also acknowledge the MODIS 447
mission scientists and associated NASA personnel for the production of the data used in this 448
research effort. The authors gratefully acknowledge the NOAA Air Resources Laboratory (ARL) 449
for the provision of the HYSPLIT transport and dispersion model and/or READY website 450
(http://www.ready.noaa.gov) used in this publication as well as the Landsat scientific team for 451
providing the imagery. The NCEP/NCAR Reanalysis team is also gratefully acknowledged for 452
providing the meteorological maps, as well as the NOAA Climate Prediction Center for the 453
Oceanic Niño Index values. 454
455
456
References 457
Abish, B., Mohanakumar, K., 2013. Absorbing aerosol variability over the Indian subcontinent 458
and its increasing dependence on ENSO. Global Planet. Change, 106, 13-19. 459
Alam, K., Trautmann, T., Blaschke, T., 2011. Aerosol optical properties and radiative forcing 460
over mega-city Karachi. Atmos. Res., 101, 773-782. 461
Alizadeh Choobari, O., Zawar-Reza, P., Sturman, A., 2013. Low level jet intensification by 462
mineral dust aerosols. Ann. Geophys., 31, 625–632. 463
Aloysius, M., Prijith, S.S., Mohan, M., Parameswaran, K., 2011. Role of dynamics in the 464
advection of aerosols over the Arabian Sea along the west coast of peninsular India during pre-465
monsoon season: A case study based on satellite data and Regional Climate Model. J. Earth Syst. 466
Sci., 120, 269-279. 467
Dey, S., di Girolamo, L., 2010. A climatology of aerosol optical and microphysical properties 468
over the Indian subcontinent from 9 years (2000-2008) of Multiangle Imaging Spectroradiometer 469
(MISR) data. J. Geophys. Res., 115, D15204, doi:10.1029/2009JD013395 470
Draxler, R.R., Rolph, G.D., 2003. HYSPLIT (Hybrid single-particle Lagrangian Integrated 471
Trajectory) model, http://www.arl.noaa. gov/ready/hysplit4.html, NOAA Air Resources 472
Laboratory, Silver, Spring, MD, 2003. 473
Ekhtesasi, M.R., Gohari, Z., 2013. Determining area affected by dust storms in different wind 474
speeds, using satellite images (case study: Sistan plain, Iran). Desert, 17, 193-202. 475
Gadgil, S., Vinayachandran, P.N., Francis, P.A., 2003. Droughts of the Indian summer monsoon: 476
Role of clouds over the Indian Ocean. Curr. Sci., 85, 1713-1719. 477

MANUSCRIP
T
ACCEPTED
ACCEPTED MANUSCRIPT
16
Gautam, R., Liu, Z., Singh, R.P., Hsu N.C., 2009. Two contrasting dust-dominant periods over 478
India observed from MODIS and CALIPSO data. Geophys. Res. Lett., 36, L06813, 479
doi:10.1029/2008GL036967. 480
Gillette, D., 1978. A wind tunnel simulation of the erosion of soil: Effect of soil texture, 481
sandblasting, wind speed and soil consolidation on dust production. Atmos. Environ., 12, 1735–482
1743. 483
Ginoux, P., Prospero, J.M., Gill, T.E., Hsu, N.C., Zhao, M., 2012. Global-scale attribution of 484
anthropogenic and natural dust sources and their emission rates based on MODIS Deep Blue 485
aerosol products. Rev. Geophys., 50, RG3005. doi:10.1029/2012RG000388 486
Goto, D., Nakajima, T., Takemura, T., Sudo, K., 2011. A study of uncertainties in the sulfate 487
distribution and its radiative forcing associated with sulfur chemistry in a global aerosol model. 488
Atmos. Chem. Phys., 11, 10889-10910. 489
Goudie, A.S., 2013. Desert dust and human health disorders. Environ. Intern., 63, 101–113. 490
Goudie, A.S., Middleton, N.J., 2001. Saharan dust storms: nature and consequences. Earth Sci. 491
Rev., 56, 179–204. 492
Huneeus, N., Schulz, M., Balkanski, Y., Griesfeller, J., et al. 2011. Global dust model 493
intercomparison in AeroCom phase I. Atmos. Chem. Phys., 11, 7781-7816. 494
Kalnay, E., Kanamitsu, M., Kistler, R., Collins, W., Deaven, D., Gandin, L., Iredell, M., Saha, 495
S., White, G., Woollen, J., Zhu, Y., Leetmaa, A., Reynolds, R., Chelliah, M., Ebisuzaki, W., 496
Higgins, W., Janowiak, J., Mo, K.C., Ropelewski, C., Wang, J., Roy, J., Dennis, J., 1996. The 497
NCEP/NCAR 40-year reanalysis project. Bull. Amer. Meteor. Soc., 77, 437-470. 498
Kalapureddy, M.C.R., Kaskaoutis, D.G., Ernest Raj, P., Devara, P.C.S., Kambezidis, H.D., 499
Kosmopoulos, P.G., Nastos, P.T., 2009. Identification of aerosol type over the Arabian Sea in the 500
pre-monsoon season during the Integration Campaign for Aerosols, Gases and Radiation Budget 501
(ICARB). J. Geophys. Res., 114, D17203, doi:10.1029/2009JD011826. 502
Kaskaoutis, D.G., Kharol, S.K., Sinha, P.R., Singh, R.P., Badarinath, K.V.S., Mehdi, W., 503
Sharma, M., 2011. Contrasting aerosol trends over South Asia during the last decade based on 504
MODIS observations. Atmos. Measur. Techn. Discuss., 4, 5275-5323. 505
Kaskaoutis, D.G., Nastos, P.T., Kosmopoulos, P.G., Kambezidis, H.D., 2012a. Characterizing 506
the long-range transport mechanisms of different aerosol types over Athens, Greece during 2000-507
2005. Intern. J. Climatol., 32, 1249-1270. 508
Karimi, N., Moridnejad, A., Golian, S., Samani, J.M.V., Karimi, D., Javadi, S., 2012. 509
Comparison of dust source identification techniques over land in the Middle East region using 510
MODIS data. Canad. J. Rem. Sens., 38, 586-599. 511
Kinne, S., Schulz, M., Textor, C., Guibert, S., et al, 2006. An AeroCom initial assessment – 512
optical properties in aerosol component modules of global models. Atmos. Chem. Phys., 6, 513
1815-1834. 514
Krishnamurthi, T.N., Jha, B., Prospero, J., Jayaraman, A., Ramanathan, V. 1998. Aerosol and 515
pollutant transport and their impact on radiative forcing over the tropical Indian Ocean during the 516
January–February 1996 pre-INDOEX cruise. Tellus B, 521–542. 517

MANUSCRIP
T
ACCEPTED
ACCEPTED MANUSCRIPT
17
Léon, J.F., Legrand, M., 2003. Mineral dust sources in the surroundings of the north Indian 518
Ocean. Geophys. Res. Lett., 30(6), 1309, doi:10.1029/2002GL016690. 519
Levy, R.C., Remer, L.A., Dubovik, O., 2007. Global aerosol optical properties and application to 520
Moderate Resolution Imaging spectroradiometer aerosol retrieval over land. J. Geophys. Res., 521
112, D13210, doi:10. 1029/2006JD007815. 522
Levy, R.C., Remer, L.A., Kleidman, R.G., Mattoo, S., Ichoku, C., Kahn, R., Eck, T.F., 2010. 523
Global evaluation of the Collection 5 MODIS dark-target aerosol products over land. Atmos. 524
Chem. Phys., 10, 10399-10420. 525
Manoj, M.G., Devara, P.C.S., Safai, P.D., Goswami, B.N., 2011. Absorbing aerosols facilitate 526
transition of Indian monsoon breaks to active spells. Clim. Dyn., 37, 2181-2198. 527
Manoj, M.G., Devara, P.C.S., Jaya Rao, Y., Sonbawne, S.M., 2013. Lidar investigation of 528
aerosol–cloud–precipitation interactions over a tropical monsoon environment: Recharging of 529
atmosphere. J. Atmos. Solar-Terr. Phys., 93, 80–86. 530
Mathew, B., Cullen, H., Lyon, B., 2002. Drought in Central and Southwest Asia: La Niña, the 531
Warm Pool, and Indian Ocean Precipitation. J. Clim., 15, 697-700. 532
McMahon, H., 1906. Recent survey and exploration in Seistan, Geogr. J., 28, 209–228. 533
Middleton, N.J., 1986. Dust storms in the Middle East. J. Arid Environ. 10, 83-96. 534
Moorthy, K.K., Babu, S.S., Satheesh, S.K. 2005. Aerosol characteristics and radiative impacts 535
over the Arabian Sea during the intermonsoon season: Results from ARMEX field campaign. J. 536
Atmos. Sci., 62, 192–206. 537
Monahan, E.C., Spiel, D.E., Davidson, K.L., 1986. A model of marine aerosol generation via 538
whitecaps and wave disruption. In: Oceanic Whitecaps, edited by: Monahan E, Niocaill GM, 539
Reidel D, Norwell, Mass., USA, 167–174. 540
Najafi, M.S., Khoshakhllagh, F., Zamanzadeh, S.M., Shirazi, M.H., Samadi, M., Hajikhani, S., 541
2013. Characteristics of TSP Loads during the Middle East Springtime Dust Storm (MESDS) in 542
Western Iran. Arab. J. Geosci., (in press), doi: 10.1007/s12517-013-1086-z. 543
Nakajima, T., Tsukamoto, M., Tsushima, Y., Numaguti, A., Kimura, T., 2000. Modeling of the 544
radiative process in an atmospheric general circulation model. Appl. Opt., 39, 4869–4878. 545
Nastos, P.T., 2012. Meteorological Patterns Associated with Intense Saharan Dust Outbreaks 546
over Greece in Winter. Adv. Meteorol., Article ID 828301. 547
Prijith, S.S., Rajeev, K., Thampi, B.V., Nair, S.K., Mohan, M., 2013. Multi-year observations of 548
the spatial and vertical distribution of aerosols and the genesis of abnormal variations in aerosol 549
loading over the Arabian Sea during Asian Summer Monsoon Season. J. Atmos. Solar-Terr. 550
Phys., 105-106, 142-151. 551
Prospero, J.M., Ginoux, P., Torres, O., Nicholson, S.E., Gill, T.E., 2002. Invironmental 552
characterization of global sources of atmospheric soil dust identified with the Nimbus 7 Total 553
Ozone Mapping Spectrometer (TOMS) absorbing aerosol product. Rev. Geophys., 40(1), 1002, 554
doi:10.1029/2000RG000095. 555
Rahul, P.R.C., Salvekar, P.S., Devara, P.C.S., 2008. Aerosol optical depth variability over 556
Arabian Sea during drought and normal years of Indian monsoon. Geophys. Res. Lett., 35, 557
L22812, doi:10.1029/2008GL035573. 558

MANUSCRIP
T
ACCEPTED
ACCEPTED MANUSCRIPT
18
Rashki A., Kaskaoutis, D.G., Rautenbach, C.J.W., Eriksson, P.G., Qiang, M., Gupta, P., 2012. 559
Dust storms and their horizontal dust loading in the Sistan region, Iran. Aeolian Res., 5, 51–62. 560
Rashki, A., Rautenbach, C.J.deW., Eriksson, P.G., Kaskaoutis, D.G., Gupta, P., 2013a. Temporal 561
changes of particulate concentration in the ambient air over the city of Zahedan, Iran. Air Qual. 562
Atmos. Health, 6, 123-135. 563
Rashki, A., Eriksson, P.G., Rautenbach, C.J.deW., Kaskaoutis, D.G., Grote, W., Dykstra, J., 564
2013b. Assessment of chemical and mineralogical characteristics of airborne dust in the Sistan 565
region, Iran. Chemosphere, 90, 227-236. 566
Rashki, A., Kaskaoutis, D.G., Goudie, A.S., Kahn, R.A. 2013c. Dryness of ephemeral lakes and 567
consequences for dust activity: the case of the Hamoun drainage basin, southeastern Iran. Sci. 568
Total Environ., 463–464, 552–564. 569
Rashki, A., D.G., Kaskaoutis, Rautenbach, C.J.deW., Flamant, C., Abdi Vishkaee, F., 2014. 570
Spatio-temporal variability of dust aerosols over the Sistan region in Iran based on satellite 571
observations. Nat. Hazards, 71, 563-585. 572
Rezazadeh, M., Irannejad, P., Shao, Y., 2013. Climatology of the Middle East dust events. Aeol. 573
Res., 10, 103-109. 574
Satheesh, S.K., Moorthy, K.K., Kaufman, Y.J., Takemura, T. 2006. Aerosol optical depth, 575
physical properties and radiative forcing over the Arabian Sea. Meteorol. Atmos. Phys., 91, 45–576
62. 577
Satheesh, S.K., Vinoj, V., Krishnamoorthy, K., 2010. Assessment of Aerosol Radiative Impact 578
over Oceanic Regions Adjacent to Indian Subcontinent Using Multisatellite Analysis. Adv. 579
Meteorol., Article ID 139186. 580
Sharifikia, M., 2013. Environmental challenges and drought hazard assessment of Hamoun 581
Desert Lake in Sistan region, Iran, based on the time series of satellite imagery. Nat Hazards, 65, 582
201-217. 583
Takemura, T., Egashira, M., Matsuzawa, K., Ichijo, H., O’ishi, R., Abe-Ouchi, A., 2009. A 584
simulation of the global distribution and radiative forcing of soil dust aerosols at the Last Glacial 585
Maximum. Atmos. Chem. Phys., 9, 3061–3073. 586
Tindale, N.W., Pease, P.P., 1999. Aerosols over the Arabian Sea: Atmospheric transport 587
pathways and concentrations of dust and sea salt. Deep Sea Research Part III: Topical Studies in 588
Oceanography, 46, 1577-1595 589
Vinoj, V., Rasch, P.J., Wang, H., Yoon, J.-H., Ma, P.-L., Landu, K., Singh, B., 2014. Short-term 590
modulation of Indian summer monsoon rainfall by West Asian dust. Nature Geosci., (in press), 591
doi: 10.1038/NGEO2107 592
WMO, 2005. Climate and land degradation. World Meteorological Organization, Switzerland 593
594
595
596
597
598

MANUSCRIP
T
ACCEPTED
ACCEPTED MANUSCRIPT
19
599
Figure Captions 600
Figure 1: Terra MODIS AOD550 values in June over Arabian Sea (8-26oN, 54-75oE) during the 601
period 2000-2013 in box and whisker chart show. Each box contains the 50% of the values (from 602
25% to 75%), the mean value is defined by the solid line and the median by the square. 603
Figure 2: Spatial distribution of Terra-MODIS AOD550 over Arabian Sea during June 2000-2013 604
(a) and June 2008 (b). 605
Figure 3: Spatial distribution of the AOD550 anomalies (%) over Arabian Sea in June 2008 with 606
respect to the long-term means (2000-2013). 607
Figure 4: Latitudinal cross section of the longitude-averaged (54-75oE) AOD550 values over 608
Arabian Sea during June 2008 and long-term (2000-2013) June mean (a). Latitudinal cross 609
section of the absolute and percentage (%) AOD550 anomalies in June 2008 with respect to the 610
long-term mean (2000-2013) (b). 611
Figure 5: Landsat (path/row: 157/38) images over Sistan region and Hamoun dry-bed lakes on 5 612
June 2008 and 21 June 2008. 613
Figure 6: Aqua MODIS true color images over Arabian Sea on 12 days during the second half 614
of June 2008. The arrows show the main pathways of the dust plumes from the arid continents to 615
the marine environment, mostly emphasizing on dust storms originated from Sistan. 616
Figure 7: 5-day forward air mass trajectories starting from Sistan basin at 500 m agl during the 617
18 dust storms in June 2008. The altitudinal variation of the dusty air masses is shown in the 618
colored scale. 619
Figure 8: NCEP/NCAR composite means of geopotential heights at 1000 hPa, 850 hPa and 700 620
hPa over south Asia during June 2008 (upper row) and anomalies from the mean June 621
climatology during 1981-2010 (lower row). 622
Figure 9: Composite mean wind vectors (ms-1) at 1000 hPa, 850 hPa and 700 hPa from 623
NCEP/NCAR reanalysis over south Asia during June 2008. 624
Figure 10: SPRINTARS simulations of surface dust concentration (µgm-3) (upper row) and 625
AOD550 (bottom row) for June 2001-2010, June 2008 and their % difference over southwest 626
Asia. 627
628
629
630

MANUSCRIP
T
ACCEPTED
ACCEPTED MANUSCRIPT
20
631
632
633
Figure 1 634
635
636
637
638
Figure 2 639
640
0.0
0.4
0.8
1.2
1.6
2.0
2.4
2.8
AO
D55
0
2000 2001 2002 2003 2004 2005 2006 2007 2008 2009 2010 2011 2012 2013
Year
MANUSCRIP
T
ACCEPTED
ACCEPTED MANUSCRIPT
21
641
642
643
644
Figure 3 645
646
647
648
8
10
12
14
16
18
20
22
24
26
0.4 0.6 0.8 1.0 1.2 1.4 1.6 1.8
June 2000-2013 June 2008
AOD550
Lat
itud
e (d
egre
es)
(a)
8
10
12
14
16
18
20
22
24
26
0.0 0.2 0.4 0.6 0.8 1.0
Absolute AOD difference Percentage (%) AOD difference
Lat
itud
e (d
egre
es)
Absolute AOD difference
0 20 40 60 80 100 120 140 160(b)
% AOD difference
649
Figure 4 650
651

MANUSCRIP
T
ACCEPTED
ACCEPTED MANUSCRIPT
22
652
653
654
655
656
Figure 5 657
658
659
660

MANUSCRIP
T
ACCEPTED
ACCEPTED MANUSCRIPT
23
661
662
663
664
Figure 6 665
MANUSCRIP
T
ACCEPTED
ACCEPTED MANUSCRIPT
24
666
667
668
Figure 7 669
670
671
672
Figure 8 673
674
675
1000 hPa 850 hPa 700 hPa
1000 hPa 850 hPa 700 hPa
Jun
e 2
00
8An
omaly
from
1981
-201
0

MANUSCRIP
T
ACCEPTED
ACCEPTED MANUSCRIPT
25
676
677
678
Figure 9 679
680
681
682
683
684
Figure 10 685

MANUSCRIP
T
ACCEPTED
ACCEPTED MANUSCRIPT
Highlights
The high AOD over Arabian Sea in June 2008 is mostly attributed to Sistan dust storms
The role of the Sistan basin in dust aerosol loading over Arabian Sea
The Hamoun lakes and the Levar wind play a major role in enhancement of dust activity
The intensity of the cyclonic circulation over Arabian Sea favored the dust exposure