Embed Size (px)
Citation preview

Computers in Biology and Medicine 78 (2016) 97–106
Contents lists available at ScienceDirect
Computers in Biology and Medicine
http://d0010-48
n CorrNew Yo
E-m
journal homepage: www.elsevier.com/locate/cbm
Extraction and processing of videocapsule data to detect and measurethe presence of villous atrophy in celiac disease patients
Edward J. Ciaccio a,n, Govind Bhagat a,b, Suzanne K. Lewis a, Peter H. Green a
a Celiac Disease Center, Department of Medicine, Columbia University Medical Center, New York, United Statesb Department of Pathology and Cell Biology, Columbia University Medical Center, New York, United States
a r t i c l e i n f o
Article history:Received 8 July 2016Received in revised form5 September 2016Accepted 14 September 2016
Keywords:Celiac diseaseImagesSmall intestineTutorialVideocapsuleVillous atrophy
x.doi.org/10.1016/j.compbiomed.2016.09.00925/& 2016 Elsevier Ltd. All rights reserved.
espondence to: HP 934, Columbia University,rk, NY 10032, United States.ail address: [email protected] (E.J. Ciaccio).
a b s t r a c t
Background: Videocapsule endoscopy is a relative new method to analyze the gastrointestinal tract forthe presence of pathologic features. It is of relevance to detect villous atrophy in the small bowel, whichis a defining symptom of celiac disease.Method: In this tutorial, methods to extract and process videocapsule endoscopy data are elucidated. Thealgorithms, computer code, and paradigms to analyze image series are described in detail. The topicscovered include extraction of data, analysis of texture, eigenanalysis, spectral analysis, three-dimensionalprojection, and estimation of motility. The basic paradigms to implement these processes are provided.Results: Examples of successful quantitative analysis implementations for selected untreated celiacdisease patients with villous atrophy versus control patients with normal villi were illustrated. Based onthe implementations, it was evident that celiac patients tended to have a rougher small intestinal textureas compared with control patients. From three-dimensional projection, celiac patients exhibited largersurface protrusions emanating from the small intestinal mucosa, which may represent clumps of atro-phied villi. The periodicity of small intestinal contractions tends to be slower when villous atrophy ispresent, and the estimated degree of motility is reduced as compared with control image series. Basisimage construction suggested that fissuring and mottling of the mucosal surface is predominant inuntreated celiac patients, and mostly absent in controls.Conclusions: Implementation of computerized methods, as described in this tutorial, will likely be usefulfor the automated detection and measurement of villous atrophy, and to map its extent along the smallintestine of celiac patients.
& 2016 Elsevier Ltd. All rights reserved.
1. Introduction
Celiac disease is a major health issue in many parts of theworld, but it is unknown to many and often remains undiagnosed[1]. Yet, left untreated, the disease can cause many harmful effects,including damage to the nervous system and cancer [2]. The dis-ease is caused by reactivity to gluten, a protein found in wheat,rye, and barley grains, and similar protein components [3]. There isonly one effective treatment thus far developed – abstinence fromconsuming gluten and its components. Yet, most persons do notmaintain the diet unless diagnosed as having the disease. Diag-nosis of celiac disease is difficult owing to the presence of occultsymptoms [4]. A defining manifestation is the presence of villousatrophy in the small intestine, which can be detected in biopsyspecimens acquired during standard endoscopy using light
180 Fort Washington Avenue
microscopy. However, the presence of villous atrophy in the smallintestinal mucosa is often patchy and subtle [5]. It is not so readilyevident by visual observation based on the endoscopic imagingtechnology that is readily available at the present time. Thus, theneed for a computerized means for detection of villous atrophy.
If villous atrophy could be detected based on computerizedanalysis of endoscopic images, it would go a long way towardimproving success in diagnosing the disease in many more pa-tients. Yet, with standard endoscopy, distal regions of the smallintestine, in the jejunum and ileum, where villous atrophy issometimes present, cannot be analyzed due to the limited loca-tional ability of the technique. More recently, videocapsule endo-scopy has been introduced to enable the observation of the entiresmall intestine for presence of pathologic features [6–8]. Video-capsule endoscopy consists of a small swallowable capsule withcamera and light source that acquires high-resolution images fromthe small intestine at periodic intervals. The imaging data istransferred via radio link to a receiver console for subsequentanalysis. Although the videocapsule images are currently acquiredat a rate of approximately 2 frames per second and a resolution of

E.J. Ciaccio et al. / Computers in Biology and Medicine 78 (2016) 97–10698
576�576 pixels, this temporal and spatial resolution is not whollyadequate to observationally determine the structure of the smallintestinal villi and their status as being either normal or atrophied.If computerized methods could be implemented for quantitativeanalysis, it would be useful for improved efficacy to detect andmeasure the presence of villous atrophy all along the small in-testinal tract [7]. Such information might possibly reduce the needfor standard endoscopy and intestinal biopsy, thus decreasing in-vasiveness, and likely decreasing procedural cost as well.
In prior work, the extraction and quantification of videocapsuleendoscopy data was studied for the analysis of untreated celiacpatients with villous atrophy versus control patients with normalvilli [7,9–13]. The purpose of this tutorial is to show methods ofimplementation in terms of the algorithms, flow of computer code,and paradigms for successful analysis. Herein, techniques thathave been noted to be useful for detection of villous atrophy inceliac disease patients will be defined and described in detail, sothat they can be readily implemented on any computer system foranalysis of videocapsule data.
Fig. 1. Celiac disease endoscopic image used to show data format in the PGM file.
2. Method
In this section, the clinical methods, the videocapsule devicespecifications, the implementation of algorithms for videocapsuledata analysis, and the presentation of relevant paradigms forcomputer code will be described and discussed. Implementation ofthe computer code provided enables the rapid analysis of data onPC-type computers.
2.1. Clinical methods
Retrospective use of videocapsule endoscopic data was ap-proved by the Internal Review Board of Columbia UniversityMedical Center. Adult patients that were referred for videocapsuleanalysis included both confirmed celiac disease patients andcontrols. Only in the celiac patients was villous atrophy present inthe small intestinal mucosa. Based on a prior analysis of smallintestinal biopsies obtained by standard endoscopy and imagedunder light microscopy, the severity of villous atrophy in the celiacpatients ranged from Marsh Score II–IIIc. Control patients witheither obscure bleeding or suspected Crohn's disease were used forquantitative comparison. Both male and female patients were in-cluded for analysis.
2.2. Description of the videocapsule
The videocapsule device used for imaging was the Pillcam SB2(Given Imaging, Ltd, Yoqneam, Israel). The plastic capsule size is11�26 mm, the weight is 2.8 g, the videocamera field of view is156°, and it acquires 2 images per second [14]. The battery life is8 h, with an image resolution of 576�576 pixels. The capsule isdisposable. It consists of an imaging device, a compact lens, awhite light emitting diode which acts to illuminate the gastro-intestinal mucosa, and an internal battery. The entire wirelesscapsule system consists of a videocapsule endoscope, a sensingand recording system which is attached via a belt to the patient,and a computer console with proprietary software (RAPID v6.5,Given Imaging). After fast, the patient swallows the capsule withwater, and can then undergo normal daily activity. Data trans-mission is via ultra-high frequency radio band telemetry. Once thedata stream is downloaded, representative images and videoclipscan be annotated and stored to PC hard drive or removable media.Contraindications for this procedure include known or suspectedgastrointestinal obstruction, presence of a cardiac pacemaker orimplantable cardioverter defibrillator, swallowing disorder, and
pregnancy of the female patient.
2.3. PGM image format specification
Once the imaging data is downloaded, although videocapsuleimages are initially stored as tricolor data, for simplicity, reducedstorage requirement, and ease of use, the information is firsttransformed to grayscale level. The Portable Gray Map specifica-tion (PGM or pgm) is a straightforward method for encodinggrayscale images that is used for this purpose. The format of PGMimages is comprised of several components, which are describedin detail in the Appendix, Part A. The graylevel is embedded in thefile data for a total of 576�576 pixels, and therefore 576�576grayscale values, i.e., 331,776 pixels in all. In Fig. 1, this data isdisplayed using the ImageJ program [15]. Depicted is an image ofthe small intestinal mucosa from a control patient. At the top leftof the image, the ImageJ program displays the spatial resolution(576�576 pixels), grayscale level (8 bit or 256 levels), and therounded total number of pixels contained in the image. Additionalinformation that is embedded in the image is also shown – thedate that the image was acquired, patient code, and imagingmodel (Pillcam SB). The borders are black by default in the Pillcamsystem. The image itself only consists of the portion within theblack borders. ImageJ, as a program that can display PGM images,provides the information about the image resolution at top anddisplays with white borders.
2.4. Extraction of imaging data
To obtain PGM images for analysis, the computer program inthe Appendix, Section B, can be used. The program plays a colormpeg videoclip, and then stores the individual frames as 256-levelgrayscale PGM images in ASCII. The reading of videoclips that aremade in other formats, and the writing of the separate images toother formats or to a binary file, can be readily done by changing afew of the parameters. The play speed for the movie, 2 per secondfor the Given Imaging system application, can be altered via thelast parameter in the movie function, and can be used to slow

E.J. Ciaccio et al. / Computers in Biology and Medicine 78 (2016) 97–106 99
down or speed up play. The code was implemented in MATLAB ver.7.7.0, R2008b (The MathWorks, Natick, MA). Only the main MA-TLAB program, not any of the toolboxes, is required for it to run.
In the first portion of the program, the number of image framesis automatically determined, and the video frames are prepared toplay successively in color (Appendix, Part A). In the second portionof the program, the movie is played, with the frame rate given as2 per second, which is the same as the record speed. To slow themovie down, this number could be decreased to 1 per second, andto speed it up, it would be increased. The movie frames are alsoconverted to grayscale and then written to disk as PGM images.The image is saved to folder C:/folder/im in this example.
Based on this paradigm, PGM images can be readily acquiredfrom an MPEG movie clip obtained during videocapsule endo-scopy. Once the PGM graylevel images are stored to disk, it isstraightforward to prepare them for processing. The pixel levelgrayvalues are provided as a sequential set of numbers which iscomposed of 331,776 elements. These elements are ordered rowby row, 576 elements per row, and 576 rows, from left to right andtop to bottom, with only space delimiters separating each pixelgraylevel value and no extra delimiters used to denote the end of arow. This data can then be rapidly read into other computer pro-grams for further processing.
2.5. Three-dimensional projection and syntactic analysis
A first step in the analysis of the data is to display the structuralcomponents contained in the two-dimensional image by project-ing it to three dimensions. A useful algorithm to do this is shownin the Appendix, part C. The code first initializes parameters (lines1 and 2). The user is then asked for the file number to process (line3). The file is opened, the first line is read, and the data is input allat once as a vector p of length 331,776. The file is then closed, andthe counter n is initialized to a value of 0 (line 4). The information
Fig. 2. Examples of original two-dimensional endoscopic images (A), three-dimensioninterpretation of the references to color in this figure legend, the reader is referred to t
is then read and arranged from vector p to a matrix m of size576�576 (lines 5–7). Two files are opened, one to display thebrightness level (line 9) and the other to display locational in-formation (line 10). Then in lines 11–19, a moving average filterwith 11�11 kernel size is implemented to smooth the data. Thedisplay of the three-dimensional data is done using the map3dprogram [16]. The .pot file, used by map3d, provides grayscalelevel only, which can be assessed to generate a false-color three-dimensional image. The .pts file, also used by map3d, provides thethree-dimensional data in Cartesian coordinates, where the firsttwo dimensions are the X and Y axis locations of the pixel, and thethird dimension (Z-axis) is the smoothed grayscale level.
The transformation process from graylevel to Z-axis position isbased on the principles of shape-from-shading. In prior work, ithas been shown that the transformation of two-dimensional en-doscopic images to three-dimensional projections is useful to de-tect endoscopic image structure that would not readily be de-tectable by visual inspection [9,10]. Thus, using this projection, itwould be possible to determine whether features unique to areaswith villous atrophy were present in the data. An example of theprocess is shown in Fig. 2. In panel A is provided an image acquiredby videocapsule endoscopy. In panel B is its three-dimensionalcounterpart. The image has been rendered as a three-dimensionalvolume. False color can be added (panel C) to further accentuatethe volume rendering. The top series is from a celiac patient whilethe lower series is from a control patient. The structure of theceliac patient information can be quite readily observed in thethree-dimensional images, with the presence of large protrusionsor nodules, which are particularly evident in the false color imageat right, as compared with the false color image for the controlpatient. It has been shown that in areas with villous atrophy, thesize of the mucosal nodules, some of which are noted by asterisksin the images, are enlarged as compared with control subjects[9,10].
al projection images (B), and false color three-dimensional projections (C). (Forhe web version of this article.)

A. B.
Average determined for the pixels of each square above and plo�ed. The minimum occurs at Avg 4,
and its outer boundary is the protrusion edge.
* 9 × 9
Avg 1 Avg 2
Avg 3 Avg 4 Avg 5
Height
Gray
scal
e
units
Width
Avg 0
Fig. 3. Syntax for a mucosal protrusion is shown. The syntax is used to detect and estimate the geometry of all mucosal protrusions for all images in the videoclip series.
E.J. Ciaccio et al. / Computers in Biology and Medicine 78 (2016) 97–106100
Mucosal protrusions, as are evident in Fig. 2, can be auto-matically detected using a specialized syntax [7,9]. The syntaxused as a first step to model the protrusion was based on a squaregeometric figure. A summary diagram is shown in Fig. 3. At left, alarger area of image is shown. The dashed black square in theimage represents a bright area which is at the center of a mucosalprotrusion. The area searched by the algorithm is shown at right inFig. 3. The average graylevel of each concentric square is de-termined. The outer edge of the protrusion is defined as thatconcentric square in which the average graylevel no longer di-minishes as compared with the adjacent inner square. This is il-lustrated in the graph below the image. From this outermost,concentric square component, the dimensions of the protrusionare estimated. The width and length of the protrusion are definedas the width and length of the concentric square in pixels. Theheight of the protrusion is defined as the difference in averagegraylevel from the outer concentric square to the innermost con-centric square. This process is repeated for all bright areas in theimage. Therefore, the dimensions of all protrusions, and thenumber of such protrusions per image, can be recorded. Theparadigm for detecting mucosal protrusions and for measuringtheir geometry is as follows.
1. Smooth the entire image data (11�11 kernel is typically used).2. Use another kernel to detect protrusions. The kernel consists of
a pixel region, square in shape.3. If the pixel with maximum brightness is at the center of the
kernel, a peak is detected.4. If a peak is detected, determine the average pixel brightness for
center and for concentric rings outward from the bright centralpixel.
5. The edge of the protrusion coincides with the last outer ring inwhich grayscale level decreases.
6. Since a square model is used, the estimated protrusion lengthand width have the same value.
7. The protrusion height is the difference in average grayscale levelbetween center and outer edge.
8. The protrusion volume would be the product oflength�width�height.
Once a protrusion is detected, its height, width, length, area,and volume are calculated and tabulated.
2.6. Motility estimation
Although actual gastrointestinal motility can be measured withstrain gauge devices or with a three-dimensional imaging system,indirect methods exist to assess motility of the gastrointestinaltract from two-dimensional endoscopic image series. In Fig. 4 areshown examples of a motility estimating system [17]. The luminalcenter is anticipated to be, as a first approximation, the regionwith darkest pixels in the image, since darker areas are likely to befurthest from the camera light source. At left are unretouchedimages from an untreated celiac disease patient. At right are thecorresponding images with the darkest 10,000 pixels highlighted.Coordinate data for the retouched images are provided at right.The centroid of the darkest pixels region (x,y) is taken as the actualcenter. The maximum width w is also shown, which is delineatedas a red bar in the image. The standard deviation of the (x,y) centercan be calculated over the entire image series. The obtainedparameters can be used as a rough estimate of gastrointestinalmotility, and correspond to the movement of the lumen centerwith respect to the changing camera angle of the videocapsule.Although the size of the luminal center varies, for simplicity, theregion encompassed by the darkest 10,000 pixels out of the totalnumber of pixels in each image (576�576¼331776) was con-sidered to be the luminal center. The paradigm for detecting theluminal center is as follows.
1. Determine the location of the darkest 10,000 image pixels of331,776 total.
2. Calculate the centroid of this region, which may not becontinuous.
3. The x value of the centroid is the average x location for all10,000 darkest pixels.
4. The y value of the centroid is the average y location for all10,000 darkest pixels.
5. Determine the maximum contiguous width of the 10,000darkest pixels as an additional measure.
6. Over the image series, calculate the standard deviation in theseparameters as a measure of motility.
Another indirect measure of motility can be obtained be esti-mating the periodicity of endoscopic image features [18]. As arough approximation, the mean graylevel of each image can beutilized to determine the periodicity. This is illustrated in Fig. 5. Attop are a series of endoscopic images of differing grayscale level,
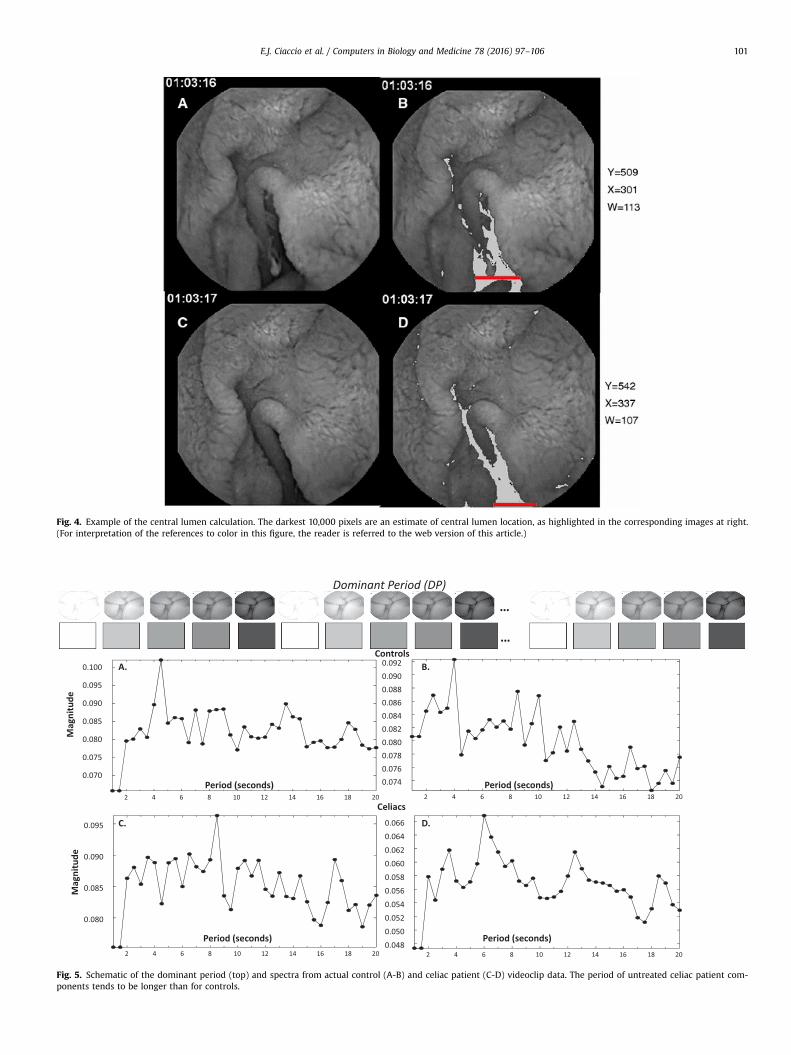
Fig. 4. Example of the central lumen calculation. The darkest 10,000 pixels are an estimate of central lumen location, as highlighted in the corresponding images at right.(For interpretation of the references to color in this figure, the reader is referred to the web version of this article.)
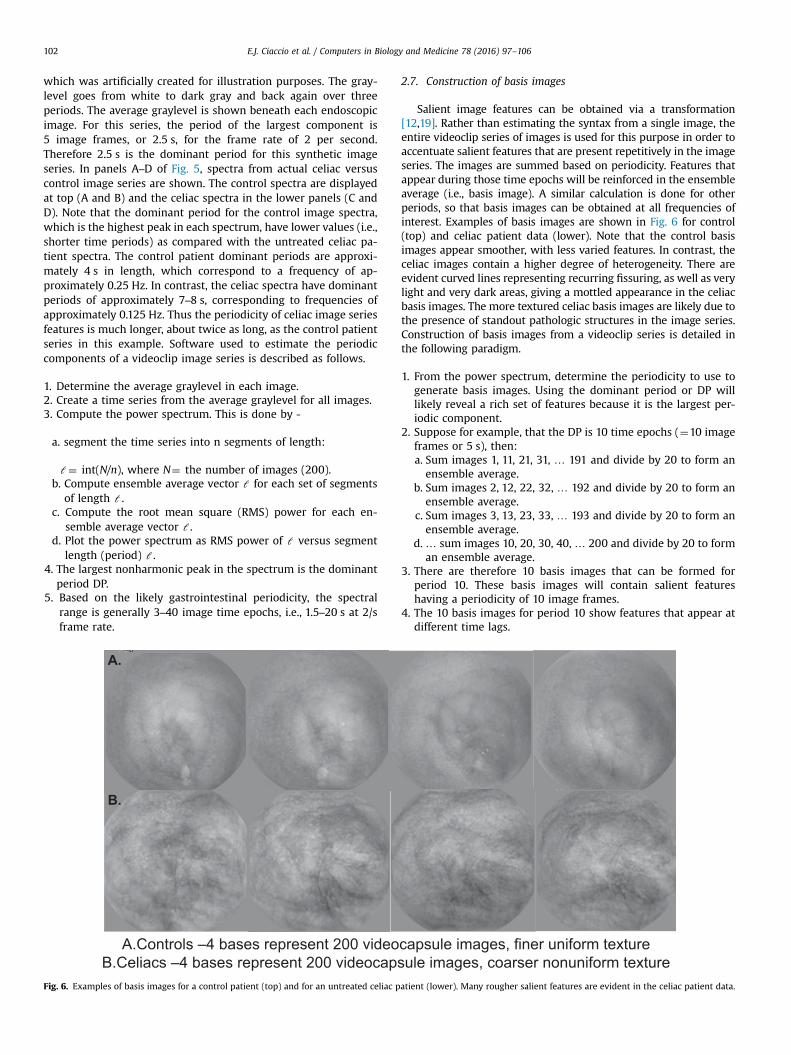
Fig. 5. Schematic of the dominant period (top) and spectra from actual control (A-B) and celiac patient (C-D) videoclip data. The period of untreated celiac patient com-ponents tends to be longer than for controls.
E.J. Ciaccio et al. / Computers in Biology and Medicine 78 (2016) 97–106 101
E.J. Ciaccio et al. / Computers in Biology and Medicine 78 (2016) 97–106102
which was artificially created for illustration purposes. The gray-level goes from white to dark gray and back again over threeperiods. The average graylevel is shown beneath each endoscopicimage. For this series, the period of the largest component is5 image frames, or 2.5 s, for the frame rate of 2 per second.Therefore 2.5 s is the dominant period for this synthetic imageseries. In panels A–D of Fig. 5, spectra from actual celiac versuscontrol image series are shown. The control spectra are displayedat top (A and B) and the celiac spectra in the lower panels (C andD). Note that the dominant period for the control image spectra,which is the highest peak in each spectrum, have lower values (i.e.,shorter time periods) as compared with the untreated celiac pa-tient spectra. The control patient dominant periods are approxi-mately 4 s in length, which correspond to a frequency of ap-proximately 0.25 Hz. In contrast, the celiac spectra have dominantperiods of approximately 7–8 s, corresponding to frequencies ofapproximately 0.125 Hz. Thus the periodicity of celiac image seriesfeatures is much longer, about twice as long, as the control patientseries in this example. Software used to estimate the periodiccomponents of a videoclip image series is described as follows.
1. Determine the average graylevel in each image.2. Create a time series from the average graylevel for all images.3. Compute the power spectrum. This is done by -
a. segment the time series into n segments of length:
ℓ¼ int(N/n), where N¼ the number of images (200).b. Compute ensemble average vector ℓ for each set of segments
of length ℓ.c. Compute the root mean square (RMS) power for each en-
semble average vector ℓ.d. Plot the power spectrum as RMS power of ℓ versus segment
length (period) ℓ.4. The largest nonharmonic peak in the spectrum is the dominant
period DP.5. Based on the likely gastrointestinal periodicity, the spectral
range is generally 3–40 image time epochs, i.e., 1.5–20 s at 2/sframe rate.
A.Controls –4 bases represent 200 videoB.Celiacs –4 bases represent 200 videocaps
A.
B.
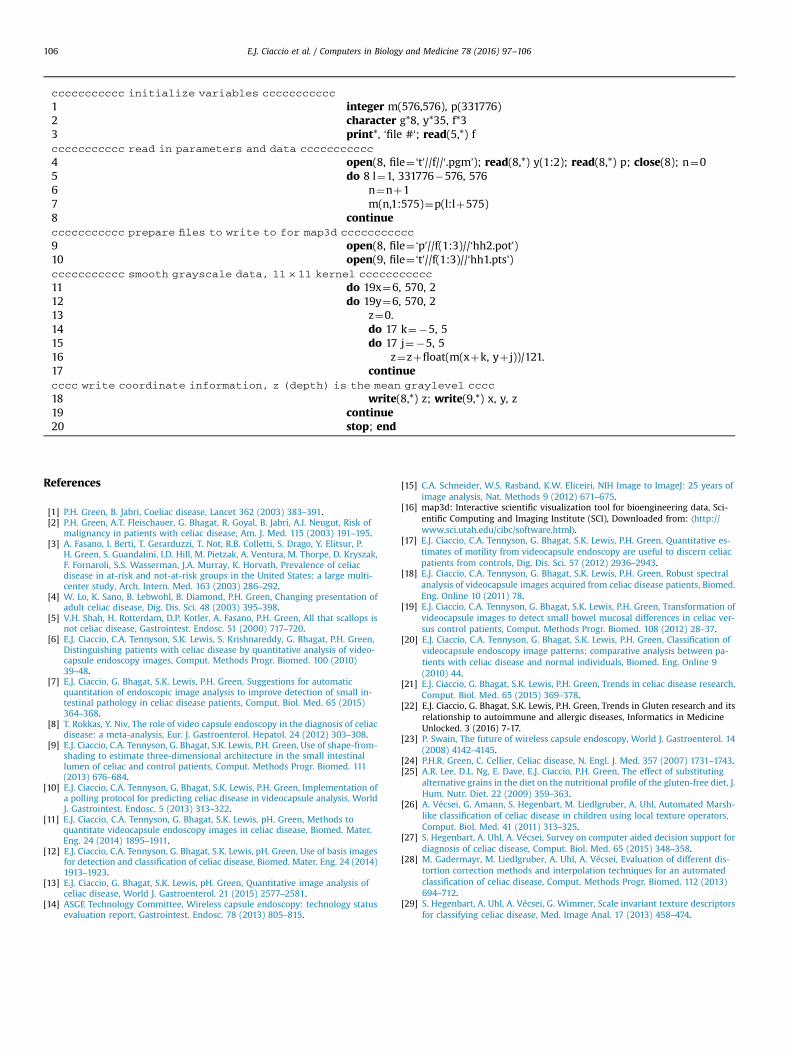
Fig. 6. Examples of basis images for a control patient (top) and for an untreated celiac p
2.7. Construction of basis images
Salient image features can be obtained via a transformation[12,19]. Rather than estimating the syntax from a single image, theentire videoclip series of images is used for this purpose in order toaccentuate salient features that are present repetitively in the imageseries. The images are summed based on periodicity. Features thatappear during those time epochs will be reinforced in the ensembleaverage (i.e., basis image). A similar calculation is done for otherperiods, so that basis images can be obtained at all frequencies ofinterest. Examples of basis images are shown in Fig. 6 for control(top) and celiac patient data (lower). Note that the control basisimages appear smoother, with less varied features. In contrast, theceliac images contain a higher degree of heterogeneity. There areevident curved lines representing recurring fissuring, as well as verylight and very dark areas, giving a mottled appearance in the celiacbasis images. The more textured celiac basis images are likely due tothe presence of standout pathologic structures in the image series.Construction of basis images from a videoclip series is detailed inthe following paradigm.
1. From the power spectrum, determine the periodicity to use togenerate basis images. Using the dominant period or DP willlikely reveal a rich set of features because it is the largest per-iodic component.
2. Suppose for example, that the DP is 10 time epochs (¼10 imageframes or 5 s), then:a. Sum images 1, 11, 21, 31, … 191 and divide by 20 to form anensemble average.
b. Sum images 2, 12, 22, 32, … 192 and divide by 20 to form anensemble average.
c. Sum images 3, 13, 23, 33, … 193 and divide by 20 to form anensemble average.
d. … sum images 10, 20, 30, 40, … 200 and divide by 20 to forman ensemble average.
3. There are therefore 10 basis images that can be formed forperiod 10. These basis images will contain salient featureshaving a periodicity of 10 image frames.
4. The 10 basis images for period 10 show features that appear atdifferent time lags.
capsule images, finer uniform textureule images, coarser nonuniform texture
atient (lower). Many rougher salient features are evident in the celiac patient data.

Fig. 7. Examples of full color videocapsule endoscopic images for control patient (left) and celiac patient (right). The celiac patient image, acquired with the PillCam SB3 system, has a much rougher apparent texture. (For interpretation of the references to color in this figure legend, the reader is referred to the web version of this article.)
E.J. Ciaccio et al. / Computers in Biology and Medicine 78 (2016) 97–106 103
2.8. Textural components
Textural properties are also important to quantitatively com-pare celiac versus control images, and for characterizing the pre-sence of villous atrophy [20]. In Fig. 7, color videocapsule imagesfrom a control patient (left) and from a celiac patient (right) areshown. The control patient image contains mostly homogeneousmucosal surfaces. Smooth edges of the mucosal folds are alsoevident. In contrast, the mucosal surface in the celiac patient im-age has a much rougher evident texture. A large magnitude offissuring is present, as is scalloping of the mucosal folds. There is aslightly mottled appearance of the mucosal surface throughout theimage. A guide for extraction of texture (first and second centralstatistical moments), and the use of 10�10 pixular subimages toestimate spatial variability, shown in Fig. 8, are provided in theparadigm below.
1. Calculate the mean (brightness level) and standard deviation(variation) in pixel graylevel for each 10�10 subimage.
2. There are 576/10�576/10 subimages per image¼56�56¼3136 per image.
3. Determine the average for the brightness level and variation forall subimages in the image.
4. Calculate the mean and standard deviation in brightness leveland variation from the averages for all images in the series.
Fig. 8. Extraction of texture from an endoscopic image. The mean (first statistical momimages are used to show the spatial variation in texture.
3. Discussion
3.1. Summary
To the present time, less quantitative research is being done onceliac disease topics as compared to the amount of biomedicalresearch being done, for example, on food allergies [21,22]. Herein,a number of methods, algorithms, paradigms, and computer codedetails useful for extracting and analyzing videocapsule endoscopydata were presented and described in detail. The presentedmethods have been shown in past studies to be efficacious fordistinguishing videocapsule images series of celiac disease pa-tients with villous atrophy, versus control patient data exhibitingnormal small intestine villi [10]. Firstly, the need for computerizedmethods of image extraction from capsule videoclips was con-sidered, and a technique to do so via MATLAB coding was pre-sented. The method extracts grayscale PGM images from the vi-deoclips, with PGM being selected due to its readily interpretableformat for encoding image data. The PGM images are stored se-parately to computer disk, and are available for visual inspectionvia the ImageJ program [15]. ImageJ can even be used for furtherquantitative analysis of these images, although to do so is notdiscussed herein.
Once the grayscale images are separately stored as individualfiles, they are ready for processing. A shape-from-shading
ent) and standard deviation (second central moment) are calculated. 10�10 sub-

E.J. Ciaccio et al. / Computers in Biology and Medicine 78 (2016) 97–106104
technique has been introduced to transform the two-dimensionalgrayscale endoscopic images into three-dimensional projectionimages [9,10]. The third axis, or Z-axis, i.e. depth, was calculateddirectly from the graylevel values of the original image. The three-dimensional projection images are of potential utility to providean estimate of the actual topography of the small intestinal mu-cosa. In contrast, the topography of the small intestinal mucosa isnot as readily evident in two-dimensional images for analysis,either by computerized means or by direct visual inspection. Anexample of three-dimensional topography, and the presence ofpossibly pathologic features, was shown in Fig. 2, which includedenlarged surface protrusions, that may represent clumps of atro-phied villi, and surface fissuring, in an untreated celiac patient. Thethree-dimensional structural information was used to build asyntax for describing the mucosal surface protrusions. As a firstapproximation, surface protrusions can be modeled as a simplegeometric shape such as a circular or square object [9,10]. Forsimplicity in the paradigm outlined in this study, a square ringmodel was chosen to represent the structure of the protrusions.These features are then detected when the average pixulargrayscale level of concentric square rings progressively diminishesoutward from the bright center. The length, width, and height ofeach protrusion are automatically measured based on theboundary point of outermost ring contained in the protrusion.Examples were given, and in prior work it was shown that inuntreated celiac patients, these protrusions are significantly largerin dimension as compared to those present in control patientslacking villous atrophy [9,10].
An indirect measure of gastrointestinal motility was then pre-sented [17]. The motility of the small intestinal wall was ap-proximated by the variation in location of the distal luminal cavity.This area was modeled as a very dark grayscale level of pixels. Thecentroid of this region, which is the mean location along the X andY axes, was considered to be the direction of the distal lumen. Dueto motion, the Cartesian coordinates (x,y) of this location changedover the image series, and therefore over time. In prior work, itwas found that motility as measured via this metric is less inuntreated celiac patients as compared with controls with normalvilli [17]. Another indirect means of measuring small intestinalmotility that was introduced was to calculate the dominant period[18]. Although as a first approximation, average grayscale levelthroughout each image, plotted for all successive images in thevideoclip series, was used as a measure of periodicity, more so-phisticated algorithms might possibly be developed to determinethe periodic components in the image series. The dominant periodwas defined as the most predominant periodic component in thefrequency spectrum of the image series. The dominant period hasbeen found to be longer in untreated celiac patients as comparedwith control patients having normal villi [18]. The longer periodicnature of the untreated celiac data suggests that the peristalticwaves, an indicator of motility, are slower and longer betweencontractions, at least at areas with villous atrophy in the celiacpatients.
As a measure of the salient features present in the small in-testinal mucosa, basis images can be obtained from each videoclip[12,19]. These transform images are calculated using an ensembleaveraging technique that considers feature periodicity. It wasfound in prior work that the celiac patient basis images containmany more abnormal structural features including the presence ofdark curved lines and patchy areas with differing grayscale level,as compared with controls [12]. The dark curved lines likely re-present the fissuring which is commonly present at the macro-scopic level in celiac patients with significant villous atrophy,while dark patches may represent areas with a greater degree ofvillous atrophy, giving rise to the mottled pattern often evident inceliac patient endoscopic images. Basis images are a composite of
the features that periodically appear in some images in the series,and therefore they represent predominant features that recur. Inceliacs, there are a number of such abnormal-looking featuresthroughout each basis image, while in control patients, many ofthe basis images are quite uniform and homogeneous in appear-ance, thus likely representing smooth and normal villi throughoutthe small intestine. The differing basis images at a particular per-iodicity represent the differing feature content appearing at phaselags.
A more ubiquitous metric for discerning image content is thetexture, and textural parameters were also introduced in themethods provided [6,20]. In order to account for spatial as well astemporal differences in texture, each 576�576 pixel image wassubdivided into 10�10 subimages throughout. The texture in eachof these subimages was separately calculated, and statistical mo-ments were determined to compare and contrast the degree oftexture and the variability in texture between celiac patients andcontrols. It has been shown that celiacs tend to have roughertexture, perhaps owing to the fact that there are macroscopicpathologic structures commonly present in areas with villousatrophy [9,10]. These structures typically are composed of varyingtexture and often, as in the presence of fissuring and mottledappearance, a darker grayscale level, and a more varied grayscalelevel over the entire image (spatial domain), and from image toimage (time domain). This gives rise to both the rougher textureand to the larger variation in texture measured in the celiac pa-tient images. Although the videocapsule resolution in both spatialand temporal domains is still quite limited, it is possible, withimproved resolution, to further resolve types of texture and dis-tinct textural components in the endoscopic images. This could beassistive to determine where precisely actual villous atrophy re-sides, for improved localization to biopsy, as well as to distinguishdegrees of villous atrophy based on the different characteristics ofthe textural features.
3.2. Clinical perspective
Videocapsule endoscopy is a relatively new technique with thepotential to revolutionize the analysis of the small intestinal mu-cosa for evidence of pathology [23]. If the presence and degree ofvillous atrophy could be determined based on videocapsule ima-ging, it would eliminate the need for the more invasive method ofstandard endoscopy to be used. It could also eliminate the need fordetermining locations where villous atrophy, which is patchy, mayreside as a target for biopsy in those areas. The lack of finding of asuitable area to biopsy the small intestine when villous atrophy isactually present would mean that the patient would likely bemisdiagnosed as not having the disease, and / or would requirerepeat procedures when it is still suspected. Although it is notcurrently feasible to obtain a biopsy using videocapsule endo-scopy, this is likely to be possible in future manifestations of thecapsule due to advances in the technology, and could be used, forexample, as a confirmatory procedure once actual areas withsuspected villous atrophy were identified by computerized ana-lysis of the image sequence [23]. Since the method is computer-ized, and the algorithms carry very little computational cost, re-sults would be available in real time and therefore could also beused to guide any future biopsy device that might be availablewithin the capsule. Even at present, the computerized methodsdescribed herein can be useful for identifying likely regions ofvillous atrophy retrospectively, and to gauge the degree of villousatrophy in each patient.
It is important to determine the magnitude of any villousatrophy in addition to its presence and location, so as to monitorthe health of celiac disease patients [24]. Although a gluten-freediet is important for restoring the health of the small intestinal

E.J. Ciaccio et al. / Computers in Biology and Medicine 78 (2016) 97–106 105
villi in celiac patients, as well as to restore the normal functionelsewhere in the body when affected by the autoimmune reaction,it requires monitoring for several reasons [25]. Firstly, food labeledas gluten-free may not actually be entirely gluten-free due tocross-contamination [25]. Moreover, the patient may make mis-takes and accidentally, or even intentionally, ingest gluten-con-taining foods. Furthermore, it is possible that the patient may haverefractory disease and not respond well to a gluten-free diet, inwhich case villous atrophy and other systemic symptoms of thedisease will likely remain. All of these circumstances requirecareful monitoring of the progress of recovery, or lack thereof, inthe small intestinal villi. By automating and computerizing theprocess of videocapsule endoscopy analysis, observer bias iseliminated, subtle pathology can be detected, and there is thepossibility to map the entire small intestine, not only the proximalportion as with standard endoscopic means [10].
3.3. Other quantitative methods useful to detect abnormality
A number of other quantitative methods, some of which arequite sophisticated for quantitative analysis, have been developedand found useful to detect abnormalities in endoscopic imagesacquired from celiac patients. The use of local texture operatorshas been shown to achieve the best overall accuracy of the variousfeature extraction techniques to detect duodenal texture patcheswith pathology (two class problem) [26]. The use of spatio-temporal features and automated systems are also promisingconcepts in videocapsule endoscopy analysis [27]. A syntactictechnique has been developed which included the use of shape-based features to describe local curvature along the edges of imagecomponents, and is helpful for classification [28]. A major imagerepresentation method that has been devised involves the use ofan Edge Co-occurrence Matrix, which embeds information aboutthe edges of image components within the matrix [27]. Wavelet-based methods are also commonly applied for endoscopic imageanalysis of the small intestinal mucosa to detect pathology [27].Additionally, scale-invariant features have been applied to enablerobust analysis when camera perspectives (angle and rotation)and distances vary in the endoscopic sequences [29].
3.4. Limitations and future directions
In the study a number of methods were presented to quanti-tatively analyze the small intestinal mucosa in untreated celiacpatients versus controls. These methods can be implemented insoftware code, and are likely to be portable to most computers andoperating systems. However, as individual computer character-istics vary, it might be necessary to alter the code slightly in orderto fit the specific parameters of the computer system at hand.Provided herein were several methods for detecting the presenceof villous atrophy. It is likely that these methods will be usefuladjuncts when comparing and contrasting patients with suspectedor confirmed villous atrophy, and to monitor the alterations whichoccur over time, owing to the fact that the basic characteristicsthat can be extracted from the videoclip image series were con-sidered – the motility estimates, textural operators, three-dimen-sional structural characteristics and the resulting syntax that canbe developed, as well as the repetition of abnormal features evi-dent in the basis images. The code presented does not represent acomplete, automated and turnkey system. That is left for future,more commercially oriented designs, which might be helpful inimproving future imaging systems for videocapsule analysis ofceliac disease. Comparison of results before and after treatmentcan also provide important information and should be done infuture studies.
Conflicts of interest
No.
Appendix
Part A: portable gray map (PGM) specification
The PGM image file is composed of the following components –.1. An alphanumeric number which identifies the file type. For
PGM, the encoded number is ‘P2’.2. The encoded number is followed by whitespace (space, tab,
carriage return, and / or line feed).3. The image width in number of pixels, formatted as decimal
ASCII characters.4. Whitespace.5. The image height in number of pixels, formatted as decimal
ASCII characters.6. Whitespace.7. The maximum graylevel value, formatted as decimal ASCII
characters.8. Single whitespace character.9. The image data with graylevel values.
The image data appears in the image from top left to bottomright (raster scan mode).
Part B. Video image extraction
The following program can be used in MATLAB to display anendoscopic videoclip as a movie on the computer screen, and toextract and write to disk PGM images from the videoclip.
% Construct an object associated with the mpeg videoclip.readerobj¼mmreader(’C: /folder/filename.mpg’, ‘tag’,‘myreader1′);
% Read in all video frames and obtain the number of frames.vidFrames¼read(readerobj);numFrames¼get(readerobj, ‘numberOfFrames’);% Create a MATLAB movie structure from the video frames.for k¼1: numFrames
mov(k).cdata¼vidFrames(:,:,:,k);mov(k).colormap¼[ ];
end
% Create figure, resize from video dimensions, playback atframe rate (2/s).
hf¼figure;set(hf, ‘position’, [150 150 readerobj. Width readerobj. Height]);movie(hf, mov, 1, 2);% Write movie frames to individual grayscale files (pgmformat).
for k¼1: numFramesimwrite(mov(k).cdata, [’C: /folder/im’ num2str(k, ‘%.3d’) ‘.
pgm’], ‘pgm’, ‘Encoding’, ‘ASCII’);end
Part C. Three-dimensional volume rendering
To obtain a three-dimensional projection of the two-dimen-sional image data, the following computer code can be utilized.This is an example of a complete, turnkey program:
E.J. Ciaccio et al. / Computers in Biology and Medicine 78 (2016) 97–106106
c
123c
45678c
91c
1111111c
11
cccccccccc initialize variables ccccccccccc
integer m(576,576), p(331776)
character g*8, y*35, f*3 print*, ‘file #‘; read(5,*) fcccccccccc read in parameters and data ccccccccccc
open(8, file¼ ‘t′//f//‘.pgm’); read(8,*) y(1:2); read(8,*) p; close(8); n¼0
do 8 l¼1, 331776�576, 576n¼nþ1
m(n,1:575)¼p(l:lþ575)continue
cccccccccc prepare files to write to for map3d cccccccccccopen(8, file¼ ‘p′//f(1:3)//‘hh2.pot’)
0 open(9, file¼ ‘t′//f(1:3)//‘hh1.pts’) cccccccccc smooth grayscale data, 11�11 kernel ccccccccccc1
do 19x¼6, 570, 2 2 do 19y¼6, 570, 2 3 z¼0. 4 do 17 k¼�5, 5 5 do 17 j¼�5, 5 6 z¼zþfloat(m(xþk, yþ j))/121. 7 continue ccc write coordinate information, z (depth) is the mean graylevel cccc8
write(8,*) z; write(9,*) x, y, z 9 continue 0 stop; end 2References
[1] P.H. Green, B. Jabri, Coeliac disease, Lancet 362 (2003) 383–391.[2] P.H. Green, A.T. Fleischauer, G. Bhagat, R. Goyal, B. Jabri, A.I. Neugut, Risk of
malignancy in patients with celiac disease, Am. J. Med. 115 (2003) 191–195.[3] A. Fasano, I. Berti, T. Gerarduzzi, T. Not, R.B. Colletti, S. Drago, Y. Elitsur, P.
H. Green, S. Guandalini, I.D. Hill, M. Pietzak, A. Ventura, M. Thorpe, D. Kryszak,F. Fornaroli, S.S. Wasserman, J.A. Murray, K. Horvath, Prevalence of celiacdisease in at-risk and not-at-risk groups in the United States: a large multi-center study, Arch. Intern. Med. 163 (2003) 286–292.
[4] W. Lo, K. Sano, B. Lebwohl, B. Diamond, P.H. Green, Changing presentation ofadult celiac disease, Dig. Dis. Sci. 48 (2003) 395–398.
[5] V.H. Shah, H. Rotterdam, D.P. Kotler, A. Fasano, P.H. Green, All that scallops isnot celiac disease, Gastrointest. Endosc. 51 (2000) 717–720.
[6] E.J. Ciaccio, C.A. Tennyson, S.K. Lewis, S. Krishnareddy, G. Bhagat, P.H. Green,Distinguishing patients with celiac disease by quantitative analysis of video-capsule endoscopy images, Comput. Methods Progr. Biomed. 100 (2010)39–48.
[7] E.J. Ciaccio, G. Bhagat, S.K. Lewis, P.H. Green, Suggestions for automaticquantitation of endoscopic image analysis to improve detection of small in-testinal pathology in celiac disease patients, Comput. Biol. Med. 65 (2015)364–368.
[8] T. Rokkas, Y. Niv, The role of video capsule endoscopy in the diagnosis of celiacdisease: a meta-analysis, Eur. J. Gastroenterol. Hepatol. 24 (2012) 303–308.
[9] E.J. Ciaccio, C.A. Tennyson, G. Bhagat, S.K. Lewis, P.H. Green, Use of shape-from-shading to estimate three-dimensional architecture in the small intestinallumen of celiac and control patients, Comput. Methods Progr. Biomed. 111(2013) 676–684.
[10] E.J. Ciaccio, C.A. Tennyson, G. Bhagat, S.K. Lewis, P.H. Green, Implementation ofa polling protocol for predicting celiac disease in videocapsule analysis, WorldJ. Gastrointest. Endosc. 5 (2013) 313–322.
[11] E.J. Ciaccio, C.A. Tennyson, G. Bhagat, S.K. Lewis, pH. Green, Methods toquantitate videocapsule endoscopy images in celiac disease, Biomed. Mater.Eng. 24 (2014) 1895–1911.
[12] E.J. Ciaccio, C.A. Tennyson, G. Bhagat, S.K. Lewis, pH. Green, Use of basis imagesfor detection and classification of celiac disease, Biomed. Mater. Eng. 24 (2014)1913–1923.
[13] E.J. Ciaccio, G. Bhagat, S.K. Lewis, pH. Green, Quantitative image analysis ofceliac disease, World J. Gastroenterol. 21 (2015) 2577–2581.
[14] ASGE Technology Committee, Wireless capsule endoscopy: technology statusevaluation report, Gastrointest. Endosc. 78 (2013) 805–815.
[15] C.A. Schneider, W.S. Rasband, K.W. Eliceiri, NIH Image to ImageJ: 25 years ofimage analysis, Nat. Methods 9 (2012) 671–675.
[16] map3d: Interactive scientific visualization tool for bioengineering data, Sci-entific Computing and Imaging Institute (SCI), Downloaded from: ⟨http://www.sci.utah.edu/cibc/software.html⟩.
[17] E.J. Ciaccio, C.A. Tennyson, G. Bhagat, S.K. Lewis, P.H. Green, Quantitative es-timates of motility from videocapsule endoscopy are useful to discern celiacpatients from controls, Dig. Dis. Sci. 57 (2012) 2936–2943.
[18] E.J. Ciaccio, C.A. Tennyson, G. Bhagat, S.K. Lewis, P.H. Green, Robust spectralanalysis of videocapsule images acquired from celiac disease patients, Biomed.Eng. Online 10 (2011) 78.
[19] E.J. Ciaccio, C.A. Tennyson, G. Bhagat, S.K. Lewis, P.H. Green, Transformation ofvideocapsule images to detect small bowel mucosal differences in celiac ver-sus control patients, Comput. Methods Progr. Biomed. 108 (2012) 28–37.
[20] E.J. Ciaccio, C.A. Tennyson, G. Bhagat, S.K. Lewis, P.H. Green, Classification ofvideocapsule endoscopy image patterns: comparative analysis between pa-tients with celiac disease and normal individuals, Biomed. Eng. Online 9(2010) 44.
[21] E.J. Ciaccio, G. Bhagat, S.K. Lewis, P.H. Green, Trends in celiac disease research,Comput. Biol. Med. 65 (2015) 369–378.
[22] E.J. Ciaccio, G. Bhagat, S.K. Lewis, P.H. Green, Trends in Gluten research and itsrelationship to autoimmune and allergic diseases, Informatics in MedicineUnlocked. 3 (2016) 7-17.
[23] P. Swain, The future of wireless capsule endoscopy, World J. Gastroenterol. 14(2008) 4142–4145.
[24] P.H.R. Green, C. Cellier, Celiac disease, N. Engl. J. Med. 357 (2007) 1731–1743.[25] A.R. Lee, D.L. Ng, E. Dave, E.J. Ciaccio, P.H. Green, The effect of substituting
alternative grains in the diet on the nutritional profile of the gluten-free diet, J.Hum. Nutr. Diet. 22 (2009) 359–363.
[26] A. Vécsei, G. Amann, S. Hegenbart, M. Liedlgruber, A. Uhl, Automated Marsh-like classification of celiac disease in children using local texture operators,Comput. Biol. Med. 41 (2011) 313–325.
[27] S. Hegenbart, A. Uhl, A. Vécsei, Survey on computer aided decision support fordiagnosis of celiac disease, Comput. Biol. Med. 65 (2015) 348–358.
[28] M. Gadermayr, M. Liedlgruber, A. Uhl, A. Vécsei, Evaluation of different dis-tortion correction methods and interpolation techniques for an automatedclassification of celiac disease, Comput. Methods Progr. Biomed. 112 (2013)694–712.
[29] S. Hegenbart, A. Uhl, A. Vécsei, G. Wimmer, Scale invariant texture descriptorsfor classifying celiac disease, Med. Image Anal. 17 (2013) 458–474.

![Extraction of Blood Vessels from Retinal Image using ......automatic extraction of blood vessels may help to detect ... literature. In [2], the cross section of a blood vessel is detected](https://img.dokumen.tips/doc/110x75/5f9c882ebfa94c36611bb254/extraction-of-blood-vessels-from-retinal-image-using-automatic-extraction.jpg)