Embed Size (px)
Citation preview

Externally visible fluorochrome marks and allometries of growing sea urchins
Amy S. Johnson,1,a Jordan M. Salyers,2 Nicholas J. Alcorn,1 Olaf Ellers,1 andJonathan D. Allen1,2
1 Biology Department, Bowdoin College, Brunswick, Maine 04011, USA2 Biology Department, College of William and Mary, Williamsburg, Virginia 23187, USA
Abstract. Externally visible, growing calcitic structures can be marked using fluorochromes.Such marks are useful for field recapture studies in ecology, evolution, and aquaculture aswell as for studies on mechanisms of growth and development. We marked 2-month-old seaurchins (Strongylocentrotus droebachiensis) with the fluorochromes calcein, calcein blue, andtetracycline by batch-marking via immersion. Neither growth nor survival was affected bymarking. Marks were externally visible on the skeletal plates, demipyramids, and spines of100% of the marked sea urchins up to 63 d post-marking. After 342 d, marks were stillexternally visible on 100% of calcein-marked, 98% of calcein blue-marked, and 22% oftetracycline-marked sea urchins. Marks were brightest on calcein-marked and faintest ontetracycline-marked sea urchins, in correspondence to the fluorochrome dose. Growthmarks in the aboral oculogenital ring, followed for 333 d, showed that genital plate growthin the hoop direction was greatest adjacent to the anal suture and that both the oculogenitalring and periproct grew less than isometrically. Internal marks (not externally visible) weresubsequently seen on 99% of the demipyramids at 342 d post-marking. Such fluorochromemarks on demipyramids have previously been used to measure aboral and oral-end demi-pyramid growth to allometrically calibrate diametrical growth rates of field sea urchins. Wefound that although aboral demipyramid marks were always clear, 13% of marks on theoral end were obscured. However, we show that measuring only aboral end growth is suffi-cient for allometric calibration. In a separate experiment, multiple marks of the above threefluorochromes plus alizarin complexone, administered by injection to larger (12.9–37.1 mmdiameter) sea urchins, persisted internally for at least 2 years. Multi-color, internally andexternally visible, persistent marks will enhance experimental designs in laboratory, field,and common garden experiments.
Additional key words: growth, juvenile, demipyramid, scaling, periproct
Fluorochromes, such as tetracycline and calcein,have been used extensively to mark growing calciticstructures in animals, and have typically had littleor no effect on growth or gonad production ofmarked animals (for a review see Ellers & Johnson2009). Marks have been used to study growth andto track animals in ecological, behavioral, aquacul-tural, and fisheries studies. The utility of fluoro-chromes is enhanced when information on durationof the marks is available and when marks can beread, using fluorescence microscopy, without sacri-ficing animals. But there is scant information aboutmark duration, and marks are only sometimes,
externally visible, facilitating non-destructive sam-pling.
There are a few studies of invertebrates that usedexternally visible fluorochrome marks (Moran 2000;Eads & Layzer 2002; Moran & Marko 2005); how-ever, there are none on sea urchins. Sea urchins aregood candidates for extending such studies becausetheir calcitic endoskeleton is visible through a thinlayer of epidermis. The external visibility of suchmarks would be useful for mark and recapture stud-ies, and would inform understanding of the relation-ship between individual plate growth and wholeskeletal growth.
The sea urchin endoskeleton (test) is made up ofcolumns of hexagonal plates, held together atsutures by calcite or, during growth, by mutable
aAuthor for correspondence.E-mail: [email protected]
Invertebrate Biology 132(3): 251–269.© 2013, The American Microscopical Society, Inc.DOI: 10.1111/ivb.12024
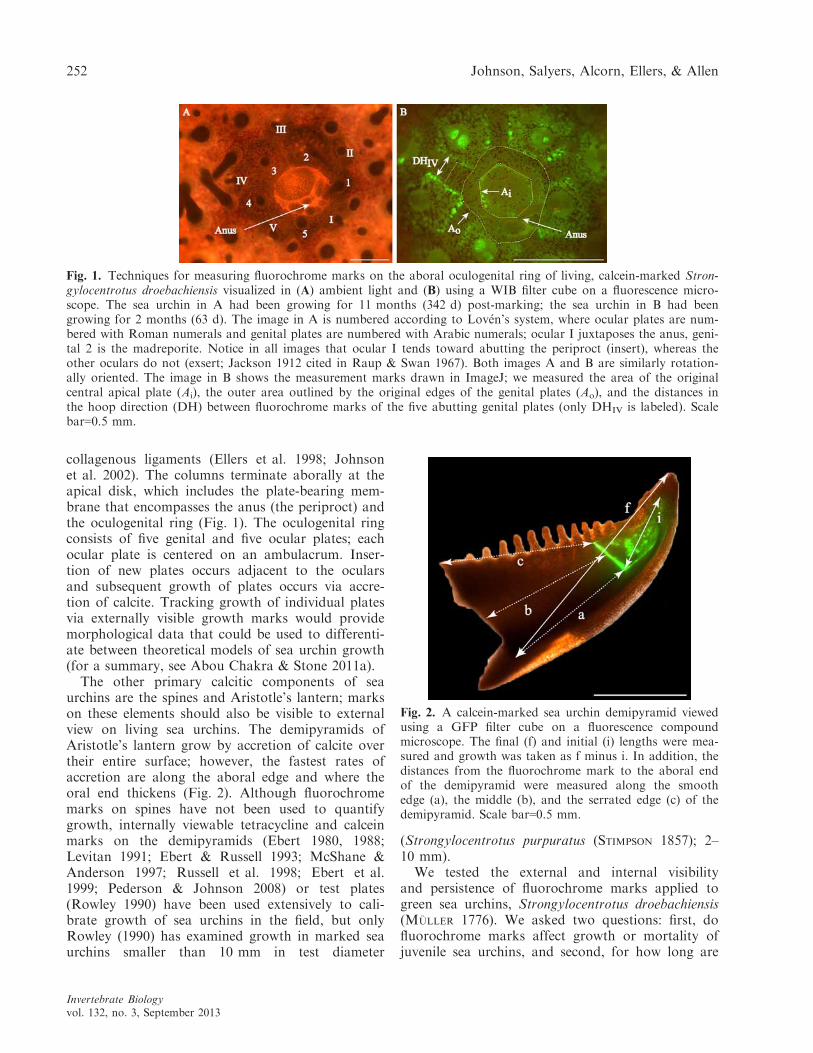
collagenous ligaments (Ellers et al. 1998; Johnsonet al. 2002). The columns terminate aborally at theapical disk, which includes the plate-bearing mem-brane that encompasses the anus (the periproct) andthe oculogenital ring (Fig. 1). The oculogenital ringconsists of five genital and five ocular plates; eachocular plate is centered on an ambulacrum. Inser-tion of new plates occurs adjacent to the ocularsand subsequent growth of plates occurs via accre-tion of calcite. Tracking growth of individual platesvia externally visible growth marks would providemorphological data that could be used to differenti-ate between theoretical models of sea urchin growth(for a summary, see Abou Chakra & Stone 2011a).
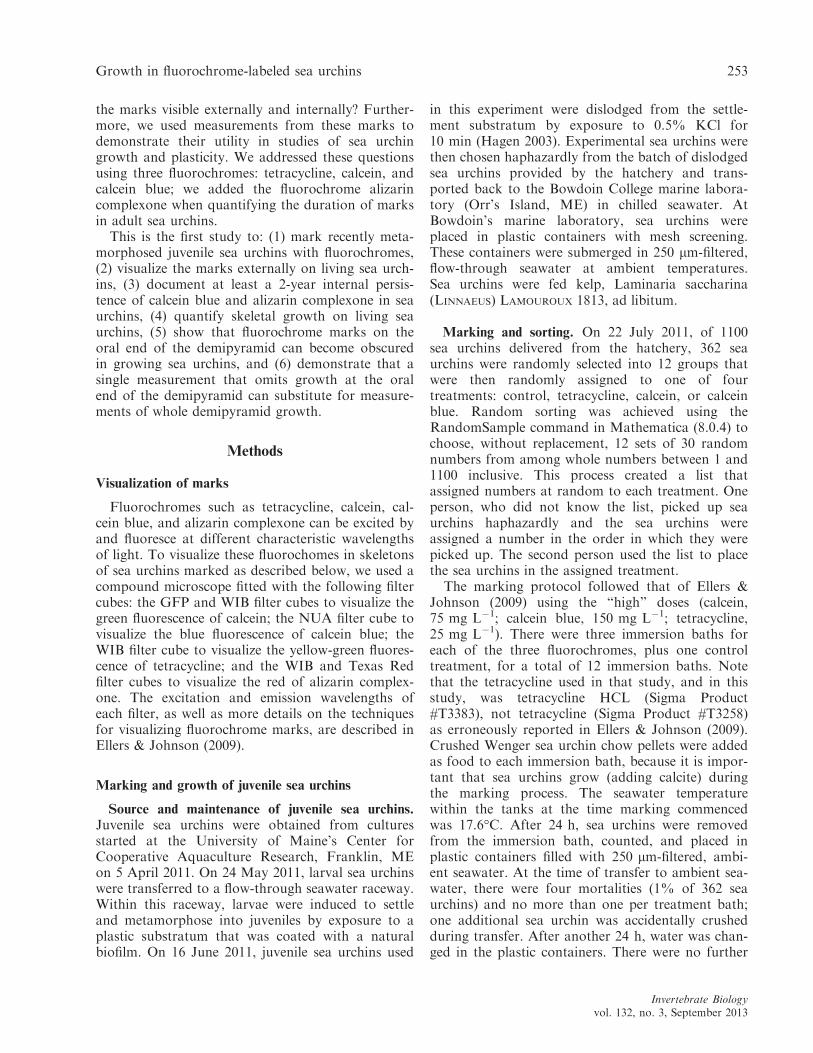
The other primary calcitic components of seaurchins are the spines and Aristotle’s lantern; markson these elements should also be visible to externalview on living sea urchins. The demipyramids ofAristotle’s lantern grow by accretion of calcite overtheir entire surface; however, the fastest rates ofaccretion are along the aboral edge and where theoral end thickens (Fig. 2). Although fluorochromemarks on spines have not been used to quantifygrowth, internally viewable tetracycline and calceinmarks on the demipyramids (Ebert 1980, 1988;Levitan 1991; Ebert & Russell 1993; McShane &Anderson 1997; Russell et al. 1998; Ebert et al.1999; Pederson & Johnson 2008) or test plates(Rowley 1990) have been used extensively to cali-brate growth of sea urchins in the field, but onlyRowley (1990) has examined growth in marked seaurchins smaller than 10 mm in test diameter
(Strongylocentrotus purpuratus (STIMPSON 1857); 2–10 mm).
We tested the external and internal visibilityand persistence of fluorochrome marks applied togreen sea urchins, Strongylocentrotus droebachiensis(M €ULLER 1776). We asked two questions: first, dofluorochrome marks affect growth or mortality ofjuvenile sea urchins, and second, for how long are
Fig. 1. Techniques for measuring fluorochrome marks on the aboral oculogenital ring of living, calcein-marked Stron-gylocentrotus droebachiensis visualized in (A) ambient light and (B) using a WIB filter cube on a fluorescence micro-scope. The sea urchin in A had been growing for 11 months (342 d) post-marking; the sea urchin in B had beengrowing for 2 months (63 d). The image in A is numbered according to Lov�en’s system, where ocular plates are num-bered with Roman numerals and genital plates are numbered with Arabic numerals; ocular I juxtaposes the anus, geni-tal 2 is the madreporite. Notice in all images that ocular I tends toward abutting the periproct (insert), whereas theother oculars do not (exsert; Jackson 1912 cited in Raup & Swan 1967). Both images A and B are similarly rotation-ally oriented. The image in B shows the measurement marks drawn in ImageJ; we measured the area of the originalcentral apical plate (Ai), the outer area outlined by the original edges of the genital plates (Ao), and the distances inthe hoop direction (DH) between fluorochrome marks of the five abutting genital plates (only DHIV is labeled). Scalebar=0.5 mm.
Fig. 2. A calcein-marked sea urchin demipyramid viewedusing a GFP filter cube on a fluorescence compoundmicroscope. The final (f) and initial (i) lengths were mea-sured and growth was taken as f minus i. In addition, thedistances from the fluorochrome mark to the aboral endof the demipyramid were measured along the smoothedge (a), the middle (b), and the serrated edge (c) of thedemipyramid. Scale bar=0.5 mm.
Invertebrate Biologyvol. 132, no. 3, September 2013
252 Johnson, Salyers, Alcorn, Ellers, & Allen
the marks visible externally and internally? Further-more, we used measurements from these marks todemonstrate their utility in studies of sea urchingrowth and plasticity. We addressed these questionsusing three fluorochromes: tetracycline, calcein, andcalcein blue; we added the fluorochrome alizarincomplexone when quantifying the duration of marksin adult sea urchins.
This is the first study to: (1) mark recently meta-morphosed juvenile sea urchins with fluorochromes,(2) visualize the marks externally on living sea urch-ins, (3) document at least a 2-year internal persis-tence of calcein blue and alizarin complexone in seaurchins, (4) quantify skeletal growth on living seaurchins, (5) show that fluorochrome marks on theoral end of the demipyramid can become obscuredin growing sea urchins, and (6) demonstrate that asingle measurement that omits growth at the oralend of the demipyramid can substitute for measure-ments of whole demipyramid growth.
Methods
Visualization of marks
Fluorochromes such as tetracycline, calcein, cal-cein blue, and alizarin complexone can be excited byand fluoresce at different characteristic wavelengthsof light. To visualize these fluorochomes in skeletonsof sea urchins marked as described below, we used acompound microscope fitted with the following filtercubes: the GFP and WIB filter cubes to visualize thegreen fluorescence of calcein; the NUA filter cube tovisualize the blue fluorescence of calcein blue; theWIB filter cube to visualize the yellow-green fluores-cence of tetracycline; and the WIB and Texas Redfilter cubes to visualize the red of alizarin complex-one. The excitation and emission wavelengths ofeach filter, as well as more details on the techniquesfor visualizing fluorochrome marks, are described inEllers & Johnson (2009).
Marking and growth of juvenile sea urchins
Source and maintenance of juvenile sea urchins.
Juvenile sea urchins were obtained from culturesstarted at the University of Maine’s Center forCooperative Aquaculture Research, Franklin, MEon 5 April 2011. On 24 May 2011, larval sea urchinswere transferred to a flow-through seawater raceway.Within this raceway, larvae were induced to settleand metamorphose into juveniles by exposure to aplastic substratum that was coated with a naturalbiofilm. On 16 June 2011, juvenile sea urchins used
in this experiment were dislodged from the settle-ment substratum by exposure to 0.5% KCl for10 min (Hagen 2003). Experimental sea urchins werethen chosen haphazardly from the batch of dislodgedsea urchins provided by the hatchery and trans-ported back to the Bowdoin College marine labora-tory (Orr’s Island, ME) in chilled seawater. AtBowdoin’s marine laboratory, sea urchins wereplaced in plastic containers with mesh screening.These containers were submerged in 250 lm-filtered,flow-through seawater at ambient temperatures.Sea urchins were fed kelp, Laminaria saccharina(LINNAEUS) LAMOUROUX 1813, ad libitum.
Marking and sorting. On 22 July 2011, of 1100sea urchins delivered from the hatchery, 362 seaurchins were randomly selected into 12 groups thatwere then randomly assigned to one of fourtreatments: control, tetracycline, calcein, or calceinblue. Random sorting was achieved using theRandomSample command in Mathematica (8.0.4) tochoose, without replacement, 12 sets of 30 randomnumbers from among whole numbers between 1 and1100 inclusive. This process created a list thatassigned numbers at random to each treatment. Oneperson, who did not know the list, picked up seaurchins haphazardly and the sea urchins wereassigned a number in the order in which they werepicked up. The second person used the list to placethe sea urchins in the assigned treatment.
The marking protocol followed that of Ellers &Johnson (2009) using the “high” doses (calcein,75 mg L�1; calcein blue, 150 mg L�1; tetracycline,25 mg L�1). There were three immersion baths foreach of the three fluorochromes, plus one controltreatment, for a total of 12 immersion baths. Notethat the tetracycline used in that study, and in thisstudy, was tetracycline HCL (Sigma Product#T3383), not tetracycline (Sigma Product #T3258)as erroneously reported in Ellers & Johnson (2009).Crushed Wenger sea urchin chow pellets were addedas food to each immersion bath, because it is impor-tant that sea urchins grow (adding calcite) duringthe marking process. The seawater temperaturewithin the tanks at the time marking commencedwas 17.6°C. After 24 h, sea urchins were removedfrom the immersion bath, counted, and placed inplastic containers filled with 250 lm-filtered, ambi-ent seawater. At the time of transfer to ambient sea-water, there were four mortalities (1% of 362 seaurchins) and no more than one per treatment bath;one additional sea urchin was accidentally crushedduring transfer. After another 24 h, water was chan-ged in the plastic containers. There were no further
Invertebrate Biologyvol. 132, no. 3, September 2013
Growth in fluorochrome-labeled sea urchins 253

mortalities up to the third day post-marking (25July 2011).
On the third day post-marking, sea urchins ineach treatment were randomly assigned either to aposition within a 15 by 20 array of mesh cages (300sea urchins) or to an out-group (57 sea urchins);each sea urchin in the in-group was assigned ran-domly to one mesh cage and given a unique identifi-cation. Random assignments were performed asfollows. Marked sea urchins were first assignedeither to be in the experiment or not by using theRandomSample, Mathematica (8.0.4) command foreach treatment to pick 75 numbers of a total of 89to 91 numbers (depending on the number alive ineach treatment); this number list was used to assignsea urchins. Five sea urchins from each of the fourtreatments were then assigned at random (using thesame technique) to each of 15 racks. The order ofsea urchins in each rack was determined by generat-ing a random number between 0 and 1 for every seaurchin assigned to that rack, using the RANDBE-TWEEN command in Excel (14.1.0), and placingthe sea urchins in that randomly generated numeri-cal order in the rack.
Mesh cages (400 lm mesh size; 7 cm wide by6 cm opening at top by 8.5 cm length) were hungfrom the 15 racks into a 200-L tank (1.8 m long by0.91 m wide by 0.13 m deep) filled with 10 lm-fil-tered, flow-through seawater; thus experimental sea-water was at ambient seawater temperatures. Therewere 20 mesh cages per rack and five cages for eachtreatment per rack. Two powerheads were used toincrease the flow of water within the 200-L tank.
During a 5-d acclimation period, between the ini-tial sorting of sea urchins into racks and the initialdiameter measurement, there were eight mortalitiesin the experimental group (three control, three tetra-cycline, one calcein, and one calcein blue); replace-ment sea urchins for those eight sea urchins werechosen randomly from the out-group of sea urchinsof the same treatment. Throughout the experiment,seawater temperature (�0.2°C) was monitored onceper hour using a HOBO Water Temp Pro tempera-ture datalogger (v2, Onset Computer Corporation,Bourne, MA). During the acclimation period, theaverage ambient seawater temperature was 18.6°C(�0.7°C SD).
Survival and growth of marked juvenile sea urch-
ins. From 31 July 2011 through 19 November 2011,sea urchins were fed L. saccharina, ad libitum. Onceper week, racks were rotated from front to backand shifted by one position along the row of racksto alleviate potential effects of position of cages
within the tank. Cages were scrubbed with a tooth-brush once per month to remove fouling organismsand to improve water flow into the cages. Anydeaths, documented by the presence of a decayingskeleton in the cage, and any escapes, documentedby the complete absence of a sea urchin in the cage,were noted when observed during feeding, cleaning,or measuring. From 19 November 2011 through 20June 2012, sea urchins were maintained as previ-ously, but with no added food, no cleaning, no rota-tion of cages, and no record on deaths or escapes;during this time, sea urchins were able to graze onthe organic epifauna that slowly accumulated on thecages.
To quantify growth, an ocular micrometermounted on a dissecting microscope was used tomeasure sea urchin diameters (�0.015 mm at thehighest magnification used; �0.036 mm at the low-est magnification used) on 29 July, 26 August, 24September, 22 October, and 19 November 2011; thefinal diameters were measured on 20 June 2012.
External visibility of marks on juvenile sea urchins.
To quantify external visibility of the fluorochromemarks in living sea urchins, 60 sea urchins in threedesignated racks were visually examined on 29August 2011 (38 d post-marking), 23 September2011 (63 d post-marking), 19 November 2011 (120 dpost-marking), and 19 June 2012 (333 d post-mark-ing) with a compound fluorescence microscope.Marks were qualitatively ranked as bright, faint, orabsent. The external visibility of marks was deter-mined for all other sea urchins on 28 June 2012(342 d post-marking). The percentage of sea urchinswith visible fluorochrome marks was calculatedfrom sea urchins remaining at the time of each visu-alization.
Quantification of growth from externally visible
marks. The fluorochrome mark appears in the cal-cite that was deposited at the time of the immersionbath. Thus, the mark appears as a border aroundplate boundaries (Fig. 1B). The area encompassedby the mark represents the area of the plate at thetime of marking; the distances between marks repre-sent new calcite added on both sides of the suturessince the time of marking. Using ImageJ software(National Institutes of Health, NIH), we measuredthe following: (1) the area that outlines the originalcentral, apical plate (inner area, Ai) clearly outlinedby a fluorochrome mark, (2) the area outlined bythe old, marked edge of the five genital plates thatabut the periproct (outer area, Ao), and (3) thedistances in the hoop direction between fluoro-
Invertebrate Biologyvol. 132, no. 3, September 2013
254 Johnson, Salyers, Alcorn, Ellers, & Allen
chrome marks for each of the five abutting genitalplates (DHI-V). Periproct nominal diameter (Dn) wasdetermined by transforming the area measurementsinto a nominal diameter using following equation:
Dn ¼ 2pðarea=pÞ
Nominal diameter growth (ΔDn) was determinedby subtracting the nominal diameter of the originalinner area from the nominal diameter of the outerarea. These measurements were made from photo-graphs of a subset of the 60 visualization sea urch-ins. The subsets consisted of four sea urchins from29 August 2011; 22 sea urchins from 23 September2011; 19 sea urchins from 19 November 2011; andeight sea urchins from 19 June 2012. The numberphotographed each month depended on the timeavailable and the number of sea urchins of which itwas possible to obtain photographs that were goodenough for measurement; this number was fewerthan the total number of sea urchins on whichexternally viewable marks were visible each month.
Marks on demipyramids of juvenile sea urchins.
After the final external visualizations, all sea urchinswere bleached, rinsed with fresh water, air-dried,and the demipyramids were extracted. Demipyra-mids were inspected for marks using a compoundfluorescence microscope and filters as describedabove. In addition, using ImageJ, the measurementsillustrated in Fig. 2 were performed on one demipyr-amid each from 11 random sea urchins from eachmarking treatment, as well as for an additionalseven sea urchins from the calcein-marked visualiza-tion group. The additional seven sea urchins wereall ones for which there were good photographs ofthe externally visible fluorochrome marks on theapical plates from the last visualization period.
Two variables were calculated from these mea-surements: (1) the mean distance to the aboral endof the demipyramid, which was the average of mea-surements of a, b, and c as shown in Fig. 2; and (2)change in demipyramid length, which was the differ-ence between the initial length of the demipyramid(i in Fig. 2) and the final length of the demipyramid(f in Fig. 2). Demipyramid length was measured asin Ebert’s (1980) Fig. 1.
Statistical analyses
All statistical analyses were performed using pro-grams written by O. Ellers in Mathematica 8.0.4,with the exception of analyses of growth in the ocu-
logenital ring, which were performed using Prism 5and SPSS Statistics 20.0.
The effect of treatment on mortality was assessedusing a v2-statistic. Comparisons of the initial diam-eter of sea urchins in treatment groups were assessedusing a one-way ANOVA to ensure that treatmentgroups were not different in size at the start of theexperiment. Comparisons of growth rates betweentreatment groups were assessed using ANCOVA.Initial diameter at the start of a measurement periodwas the covariate because diametrical growth ratevaries with size in Strongylocentrotus droebachiensis(Ellers & Johnson 2009).
Genital plate growth in the hoop direction wasassessed both as a sum of hoop growth at all fivesutures and as an average of growth at the fournon-anal sutures (as the growth at the anal suturewas found to differ significantly from the others andcould be measured less reliably). Hoop genital plategrowth (both sum and average) and periproct nomi-nal diametrical growth were assessed using linearregression analyses on log–log transformed datawith sea urchin diameter growth as the independentvariable.
Demipyramid growth was assessed using linearregression analyses with the following dependentand independent variables, respectively: (1) meanchange in length of the aboral end of demipyramid(average of a, b, and c in Fig. 2), change in demi-pyramid length (=f–i in Fig. 2); (2) change in lengthof the smooth edge of demipyramid’s aboral end (ain Fig. 2), change in demipyramid length; and (3)log sea urchin diameter, log demipyramid length.For the last comparison, data were fit for both ini-tial (i in Fig. 2) and final (f in Fig. 2) log demipyr-amid length separately.
Duration of marks on adult sea urchins
To test fluorochrome mark duration in largerStrongylocentrotus droebachiensis, we marked 26 seaurchins, ranging in diameter from 12.9 to 37.1 mm,with either two, three, or four fluorochromesinjected sequentially at 5–7 d intervals. Injectiontechniques and doses were as described for multiplemarks in Ellers & Johnson (2009). The injectiondoses were 15, 30, 50, and 30 mg kg�1 for calcein,calcein blue, tetracycline, and alizarin complexone,respectively. The first mark was always tetracycline,followed by some sequential combination of calcein,calcein blue, and alizarin complexone. Injectionswere started on 3 June 2006 and were completed by21 June 2006.
Invertebrate Biologyvol. 132, no. 3, September 2013
Growth in fluorochrome-labeled sea urchins 255

Sea urchins were maintained in individual baskets(11.4911.4910.8 cm; square holes in the mesh were4 mm on the diagonal) hung in a flow-through, 10-lm filtered seawater aquarium (1 m by 2 m by 0.1 mdeep; 200 L); sea urchins were fed Wenger sea urchinchow pellets once per week until 18 June 2008.Ambient seawater temperature, monitored once anhour using Hobo temperature dataloggers from 21June 2006 through 18 June 2008, was 9.75°C�5.48°CSD. On 18 June 2008, Aristotle’s lanterns wereremoved, bleached, rinsed with fresh water, and air-dried for visualization of marks on the demipyra-mids. Visualization of marks was as described above.
Results
Marking and growth of juvenile sea urchins
Survival of juvenile sea urchins. Over the first4 months of the experiment, there were a total of 36mortalities (12%) spread evenly over all treatmentgroups (8 control, 9 tetracycline, 10 calcein, 9 cal-cein blue; v2, p(3)=0.97). Mortalities were nottracked after the first 4 months.
Over the first 4 months of the experiment, therewere a total of 15 escapes (sea urchin gone, no skel-eton found: 0 control, 6 tetracycline, 7 calcein, 2 cal-cein blue). Escapes were not tracked after the first4 months; however, there were likely other escapeevents during the following 7-month period. At theend of the experiment, 14 of the escapees were thriv-ing in the tank area outside of the cages.
Temperature during the experiment. Mean seawa-ter temperature cooled from 18.7°C to 10.2°C from31 July to 19 November, reached a minimum of0.05°C on 21 January 2012, and warmed to 18.5°Cby 20 June 2012 (Table 1). This is importantbecause temperature affects growth rate: Stron-gylocentrotus droebachiensis of similar size (3 mm)grew fastest at 14.9°C and slower at higher andlower temperatures (A.S. Johnson, O. Ellers, K.Guttenplan, unpubl. data).
Initial size and growth of juvenile sea urchins. Meaninitial diameter of sea urchins was independent oftreatment group (ANOVA: p(3,296)=0.997; mean ini-tial diameter=1.71 mm�0.021 mm SE; range: 0.63–2.63 mm; n=300).
Overall, in a given month, diametrical growth ratedecreased as a function of increasing initial diame-ter, although not in the marking month. There wereno significant differences in growth rate betweentreatments during any measurement period (Fig. 3;Table 2).
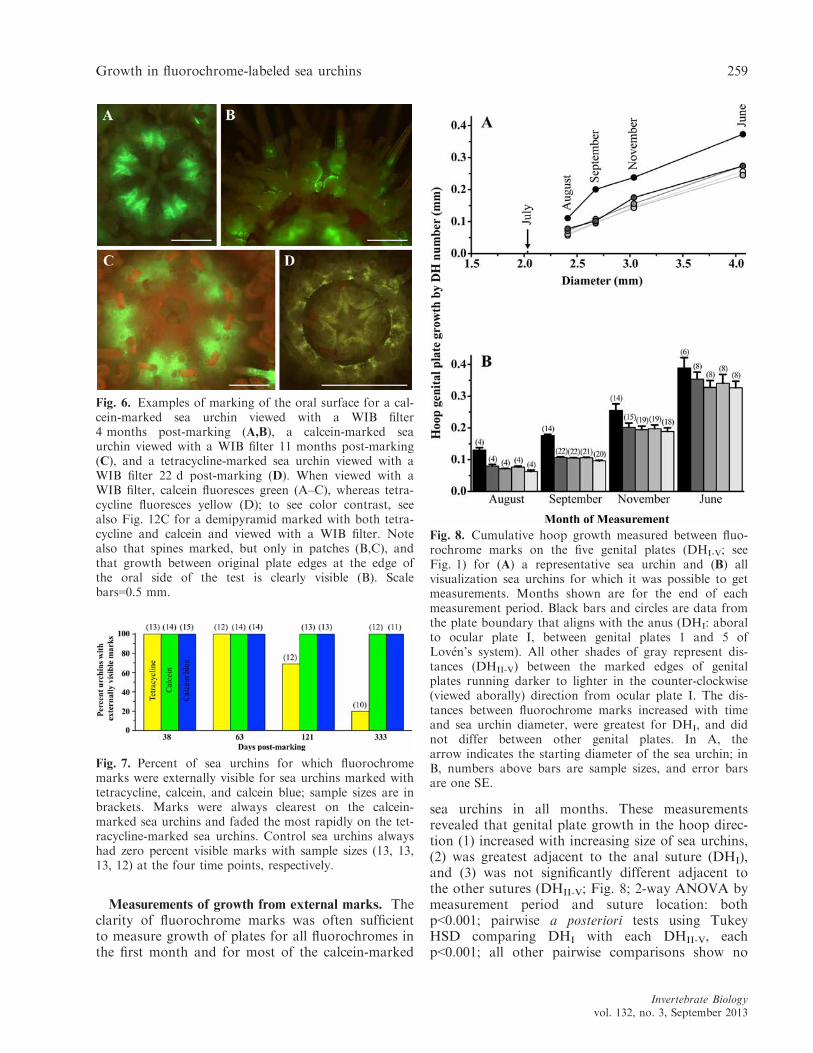
Persistence of external visibility. We were oftenable to see fluorochrome marks that glowed throughthe thin epidermis on skeletal plates (Fig. 4). Wewere always able to see the oral ends (marked orunmarked) of demipyramids through the thin peri-stomial membrane in sea urchins in the size rangeencountered in this experiment (Figs. 5,6). Further-more, patches of glowing, fluorochrome-marked cal-cite were usually visible on spines, spine bases, andtubercles (Fig. 6).
At 38, 63, 120, and 333 d post-marking, a visuali-zation group, consisting of 15 sea urchins from eachtreatment, was assayed for the external visibility offluorochrome marks when visualized with a com-pound fluorescence microscope; the same 60 seaurchins were visualized at each of these times. Therewere never externally visible marks on control seaurchins, although there was some faint autofluores-cence of the demipyramids visible on some sea urch-ins under the WIB filter. At 38 and 63 d post-marking, fluorochrome marks were clearly visible on100% of the marked sea urchins examined whenviewed externally on a fluorescence microscope andin none of the control sea urchins, although therewas faint fluorescence in one of the control seaurchins at 38 d that was interpreted as auto-fluores-cence. At 120 and 333 d post-marking, marks werestill externally visible on 69% and 20% of tetracy-cline-marked sea urchins, respectively, and on bothdates, marks were still externally visible on 100% ofcalcein and calcein blue-marked sea urchins (Fig. 7).
Table 1. Summary statistics for seawater temperatures between each measurement period.
Period Date range Mean T (°C) High T (°C) Low T (°C) SD SE N
Acclimation 7/25/11–7/29/11 18.6 20.1 16.3 0.7 0.079 83Marking month 7/29/11–8/26/11 18.7 21.0 16.6 0.8 0.032 647Month two 8/26/11–9/24/11 17.2 20.3 14.1 1.5 0.057 696Month three 9/24/11–10/22/11 15.4 19.2 12.4 1.4 0.054 672Month four 10/22/11–11/19/11 10.2 13.2 8.6 1.2 0.045 720Months 5–11 11/19/11–6/20/12 7.4 19.2 0.05 4.1 0.057 5135
Invertebrate Biologyvol. 132, no. 3, September 2013
256 Johnson, Salyers, Alcorn, Ellers, & Allen

Absolute brightness of marks was not quantified,but marks were placed into qualitative categories of“bright” or “faint.” For all calcein-marked sea urch-ins, fluorochrome marks were always bright through
333 d post-marking. For calcein blue-marked seaurchins, at 63 d post-marking, all marks were brighton 100% of sea urchins; at 120 d post-marking,marks were bright on 33% and faint on 67% of sea
Fig. 3. Diametrical growth rates of marked sea urchins. A. Box and whisker plot indicates the median diametricalgrowth rates in the marking month; boxes span the 0.25–0.75 quantile; whiskers span the range. B–F. Diametricalgrowth rate, normalized per year, as a function of initial diameter at the start of each shown month or multimonthperiod; treatments are as indicated on the box and whisker plot (A). In any given measurement period, there were nosignificant differences in slope or intercept for any treatment (ANCOVA in Table 2). Fitted lines represent the overallslope of the pooled data, which was significantly different from zero except in the marking month.
Table 2. ANCOVA and linear regression statistics for data shown in Fig. 3.
Measurementperiod
ANCOVA statistics Overall linear regression statistics for pooled data
p thatslopes areequal
p thatinterceptsare equal
d.f. R2 Slope (year�1)(�SE)
Intercept(mm year�1)
p that slope=0(d.f.)
Marking month 0.082 0.17 4, 287 0.0085 �0.56 (�0.36) 5.8 0.12 (1, 290)Month two 0.53 0.86 4, 279 0.19 �3.3 (�0.40) 12 <0.001 (1, 282)Month three 0.57 0.54 4, 261 0.042 �2.5 (�0.73) 13 0.02 (1, 264)Month four 0.75 0.41 4, 259 0.30 �4.0 (�0.38) 16 <0.001 (1, 262)Months 5–11 0.27 0.24 4, 234 0.063 �0.69 (�0.17) 4.5 0.004 (1, 237)All Months 0.17 0.85 4, 234 0.41 �0.94 (�0.11) 4.8 <0.001 (1, 237)
Invertebrate Biologyvol. 132, no. 3, September 2013
Growth in fluorochrome-labeled sea urchins 257
urchins; and at 333 d post-marking, marks werefaint on 100% of sea urchins. For tetracycline-marked sea urchins, marks were bright on all butone sea urchin through 63 d post-marking and veryfaint, when visible, at all subsequent assay times.
At 342 d post-marking, all sea urchins that werenot in the visualization group were also assayed forexternal visibility of marks. Of these, 100% (47/47)of the marks on calcein-marked sea urchins were
externally visible and bright; 98% (49/50) of themarks on calcein blue sea urchins were externallyvisible, although sometimes very faint; and 22%(10/46) of the marks on tetracycline-marked seaurchins were externally visible, although alwaysvery faint. One sea urchin in the tetracycline groupwas marked with calcein; the growth data for thissea urchin were thereafter moved to the calceingroup.
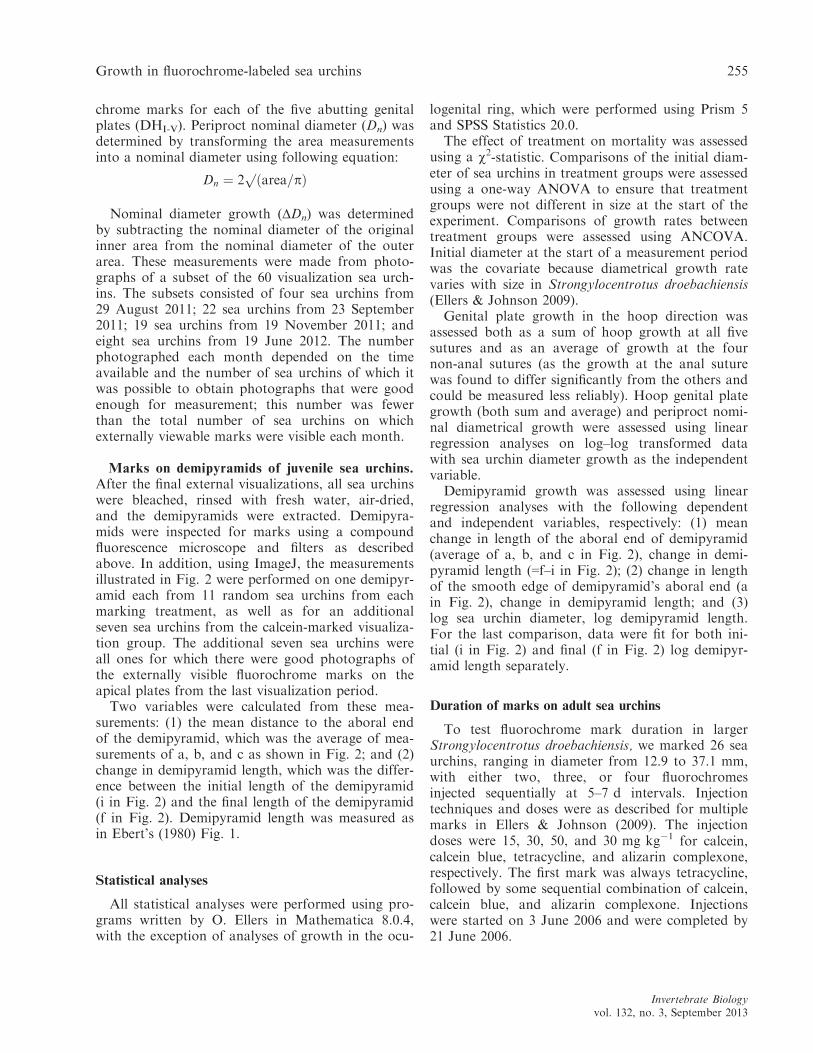
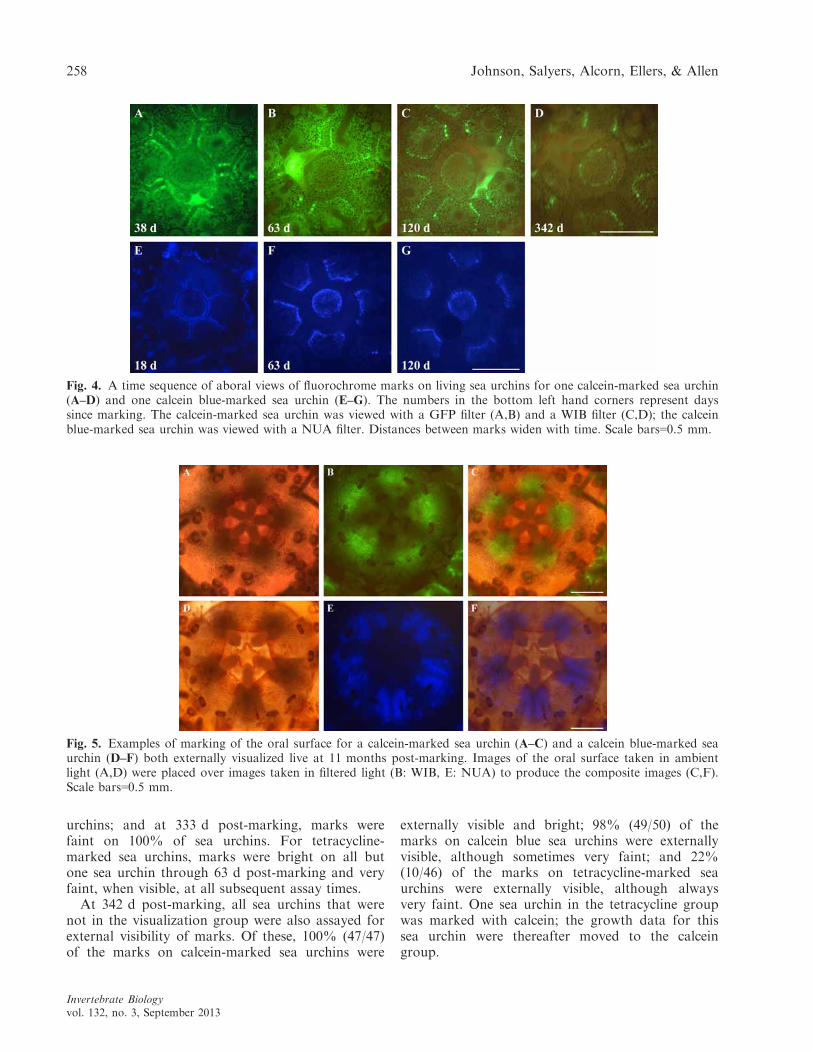
Fig. 4. A time sequence of aboral views of fluorochrome marks on living sea urchins for one calcein-marked sea urchin(A–D) and one calcein blue-marked sea urchin (E–G). The numbers in the bottom left hand corners represent dayssince marking. The calcein-marked sea urchin was viewed with a GFP filter (A,B) and a WIB filter (C,D); the calceinblue-marked sea urchin was viewed with a NUA filter. Distances between marks widen with time. Scale bars=0.5 mm.
Fig. 5. Examples of marking of the oral surface for a calcein-marked sea urchin (A–C) and a calcein blue-marked seaurchin (D–F) both externally visualized live at 11 months post-marking. Images of the oral surface taken in ambientlight (A,D) were placed over images taken in filtered light (B: WIB, E: NUA) to produce the composite images (C,F).Scale bars=0.5 mm.
Invertebrate Biologyvol. 132, no. 3, September 2013
258 Johnson, Salyers, Alcorn, Ellers, & Allen
Measurements of growth from external marks. Theclarity of fluorochrome marks was often sufficientto measure growth of plates for all fluorochromes inthe first month and for most of the calcein-marked
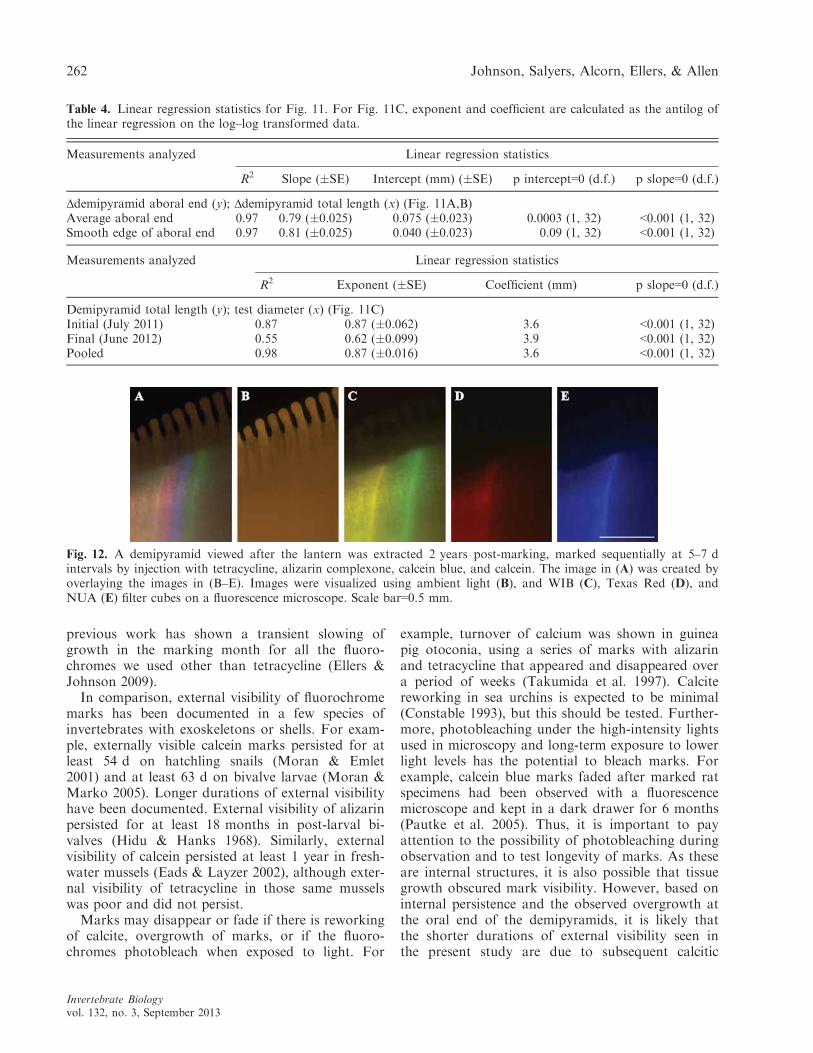
sea urchins in all months. These measurementsrevealed that genital plate growth in the hoop direc-tion (1) increased with increasing size of sea urchins,(2) was greatest adjacent to the anal suture (DHI),and (3) was not significantly different adjacent tothe other sutures (DHII-V; Fig. 8; 2-way ANOVA bymeasurement period and suture location: bothp<0.001; pairwise a posteriori tests using TukeyHSD comparing DHI with each DHII-V, eachp<0.001; all other pairwise comparisons show no
Fig. 6. Examples of marking of the oral surface for a cal-cein-marked sea urchin viewed with a WIB filter4 months post-marking (A,B), a calcein-marked seaurchin viewed with a WIB filter 11 months post-marking(C), and a tetracycline-marked sea urchin viewed with aWIB filter 22 d post-marking (D). When viewed with aWIB filter, calcein fluoresces green (A–C), whereas tetra-cycline fluoresces yellow (D); to see color contrast, seealso Fig. 12C for a demipyramid marked with both tetra-cycline and calcein and viewed with a WIB filter. Notealso that spines marked, but only in patches (B,C), andthat growth between original plate edges at the edge ofthe oral side of the test is clearly visible (B). Scalebars=0.5 mm.
Fig. 7. Percent of sea urchins for which fluorochromemarks were externally visible for sea urchins marked withtetracycline, calcein, and calcein blue; sample sizes are inbrackets. Marks were always clearest on the calcein-marked sea urchins and faded the most rapidly on the tet-racycline-marked sea urchins. Control sea urchins alwayshad zero percent visible marks with sample sizes (13, 13,13, 12) at the four time points, respectively.
Fig. 8. Cumulative hoop growth measured between fluo-rochrome marks on the five genital plates (DHI-V; seeFig. 1) for (A) a representative sea urchin and (B) allvisualization sea urchins for which it was possible to getmeasurements. Months shown are for the end of eachmeasurement period. Black bars and circles are data fromthe plate boundary that aligns with the anus (DHI: aboralto ocular plate I, between genital plates 1 and 5 ofLov�en’s system). All other shades of gray represent dis-tances (DHII-V) between the marked edges of genitalplates running darker to lighter in the counter-clockwise(viewed aborally) direction from ocular plate I. The dis-tances between fluorochrome marks increased with timeand sea urchin diameter, were greatest for DHI, and didnot differ between other genital plates. In A, thearrow indicates the starting diameter of the sea urchin; inB, numbers above bars are sample sizes, and error barsare one SE.
Invertebrate Biologyvol. 132, no. 3, September 2013
Growth in fluorochrome-labeled sea urchins 259

significant difference, each p>0.5). Hoop genitalplate growth and nominal diameter growth of theperiproct area underscaled (increased less than iso-metrically) with diametrical growth of sea urchins(Fig. 9; Table 3).
Marks on demipyramids. The expected internalmarks were always clear and visible on the bleachedjaws of all sea urchins, and there were no marks onthe jaws of control sea urchins with the followingexceptions: one sea urchin’s demipyramids in thetetracycline group showed no marks, and one seaurchin’s demipyramids in the tetracycline group hadcalcein marks. Growth data for this latter sea urchinwere moved to the calcein group. This classificationerror had already been detected on the same seaurchin through external visualization (describedabove).
The oral end of the fluorochrome mark was notalways visible (Fig. 10; compare A,B with C,D).Thus, measurements of the length change of theentire demipyramid are not always possible usingthese marks. Establishing the allometry betweenchange in entire demipyramid length and the lengthadded to the aboral end of the demipyramid wouldpermit the use of more demipyramids in growthstudies.
The measurements on demipyramids demon-strated that (1) the regression of the average changein length of the aboral end of the demipyramid andchange in demipyramid length has a significantlynon-zero intercept (Fig. 11A; Table 4), (2) theregression of the change in length of the smoothedge of the demipyramid’s aboral end and thechange in demipyramid length has a zero intercept(Fig. 11B; Table 4), and (3) the log–log regressionof initial demipyramid length and sea urchin diame-ter differs from that of the final demipyramid lengthand sea urchin diameter (Fig. 11C; Table 4). Theaverage growth rate of the aboral end of the demi-pyramids over 342 d (average of measurements a, b,c in Fig. 2) was 2.3 lm per day (�0.08 SE; n=33sea urchins).
Duration of marks on adult sea urchins
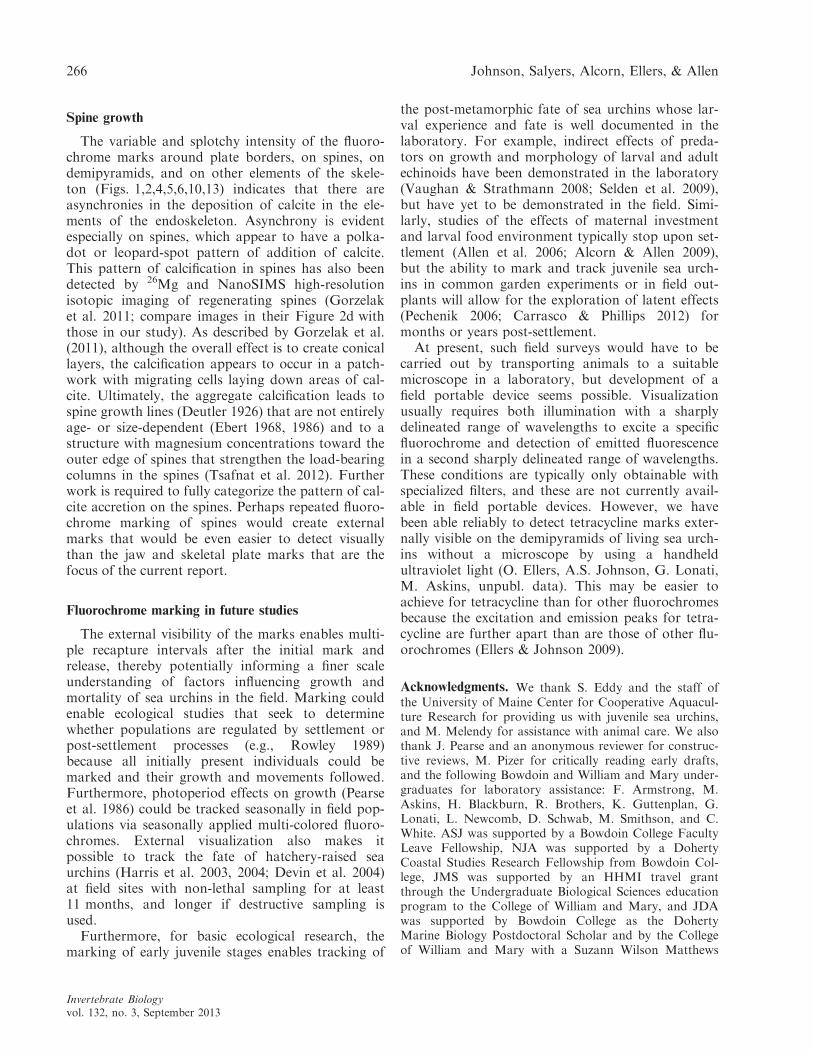
For adult sea urchins, after 2 years, 100% of thecalcein (18/18) and calcein blue (18/18) marks, 94%(15/16) of the alizarin complexone marks, and 92%(24/26) of tetracycline marks were visible on thebleached sea urchin demipyramids (Fig. 12).
Discussion
External visibility of marks in juvenile sea urchins
We observed that fluorochrome marks were exter-nally visible for 2 months in all visualization seaurchins, and for all fluorochromes. Calcein andcalcein blue marks were externally visible on all seaurchins through 11 months post-marking, although
Table 3. Linear regression statistics for Fig. 9. Exponent and coefficient are for the antilog of the linear regressionequation for the log–log transformed data.
Variables (y; x) (all units are mm) Linear regression statistics
R2 Exponent (�SE) Coefficient (mm) p slope=0 (d.f.)
DHII-V average growth; sea urchin diameter growth 0.93 0.79 (�0.03) 0.14 <0.001 (1, 47)DHI-V total growth; sea urchin diameter growth 0.92 0.68 (�0.03) 0.80 <0.001 (1, 45)ΔDn; sea urchin diameter growth 0.90 0.61 (�0.03) 0.31 <0.001 (1, 46)
Fig. 9. Log–log plot of the average hoop growth of thefour non-anal genital plate edges (left y axis; dark graycircles, long-dashed line), total hoop growth of genitalplates (left y axis; light gray circles, short-dashed line)and nominal diameter growth of the periproct (right yaxis; clear circles, solid line) as a function of sea urchindiameter growth. Average genital plate growth in thehoop direction is the average of DHII-V, total plategrowth is the sum of DHI-V. Lines are linear regressionson log-transformed data (Table 3). All slopes differ signif-icantly from zero and are less than one, indicating that allvariables underscale with diametrical growth.
Invertebrate Biologyvol. 132, no. 3, September 2013
260 Johnson, Salyers, Alcorn, Ellers, & Allen

they were bright only on the calcein-marked seaurchins. External visibility of tetracycline marks wasfaint past the second month post-marking. This maybe because we used a relatively low dose of tetracy-cline (25 mg L�1) compared with what has com-monly been reported in the literature (21–1000 mg L�1: McShane & Anderson 1997; Russellet al. 1998; Ebert 2001; Dumont et al. 2004; Russell& Urbaniak 2004; Pederson & Johnson 2008). Ellers& Johnson (2009) found that dose affected markbrightness, with a lower dose (2.5 mg L�1) produc-ing less bright marks on the demipyramids. Becausethe higher dose used here is still on the low end ofdoses reported in the literature, we recommendusing even higher doses of tetracycline to increaseclarity and longevity of marks. Improving the exter-nal visibility of tetracycline is worthwhile becausethe US Food and Drug Administration hasapproved tetracycline and calcein for use in severalfisheries contexts (Purcell et al. 2006). An additionalreason for using tetracycline is that, although therewas no effect of any fluorochrome on growth or sur-vival of juvenile sea urchins in the present study,
Fig. 10. Green fluorochrome marks on demipyramidsfrom four of the calcein-marked sea urchins viewed usinga GFP filter cube on a fluorescence compound micro-scope. Typically, the entire edge of the original demipyr-amid was marked (A). Often, the oral end of the markwas visible, but partially obscured (B). In 12.5% of thedemipyramids observed (5/40), the oral end of the origi-nal demipyramid either failed to mark initially or wassubsequently overgrown and completely obscured by newcalcite (C,D). Scale bar=0.5 mm.
Fig. 11. Demipyramid growth analyses. A. Mean distanceto the aboral end of the demipyramid (average of a, b,and c in Fig. 2) as a function of change in demipyramidlength (f minus i in Fig. 2). B. Change in the length ofthe smooth edge (a in Fig. 2) of the aboral end of thedemipyramid as a function of change in demipyramidlength (f minus i in Fig. 2). C. Log–log plot of sea urchindiameter as a function of demipyramid length for seaurchins at the beginning (i in Fig. 2, black circles, solidline) and end (f in Fig. 2, open circles, dashed line). Linesare linear fits to the log-transformed data, extrapolatedbeyond the data points in C to demonstrate the apparentchange in scaling that can occur when using a small dataset with a small range of sizes (Table 4).
Invertebrate Biologyvol. 132, no. 3, September 2013
Growth in fluorochrome-labeled sea urchins 261
previous work has shown a transient slowing ofgrowth in the marking month for all the fluoro-chromes we used other than tetracycline (Ellers &Johnson 2009).
In comparison, external visibility of fluorochromemarks has been documented in a few species ofinvertebrates with exoskeletons or shells. For exam-ple, externally visible calcein marks persisted for atleast 54 d on hatchling snails (Moran & Emlet2001) and at least 63 d on bivalve larvae (Moran &Marko 2005). Longer durations of external visibilityhave been documented. External visibility of alizarinpersisted for at least 18 months in post-larval bi-valves (Hidu & Hanks 1968). Similarly, externalvisibility of calcein persisted at least 1 year in fresh-water mussels (Eads & Layzer 2002), although exter-nal visibility of tetracycline in those same musselswas poor and did not persist.
Marks may disappear or fade if there is reworkingof calcite, overgrowth of marks, or if the fluoro-chromes photobleach when exposed to light. For
example, turnover of calcium was shown in guineapig otoconia, using a series of marks with alizarinand tetracycline that appeared and disappeared overa period of weeks (Takumida et al. 1997). Calcitereworking in sea urchins is expected to be minimal(Constable 1993), but this should be tested. Further-more, photobleaching under the high-intensity lightsused in microscopy and long-term exposure to lowerlight levels has the potential to bleach marks. Forexample, calcein blue marks faded after marked ratspecimens had been observed with a fluorescencemicroscope and kept in a dark drawer for 6 months(Pautke et al. 2005). Thus, it is important to payattention to the possibility of photobleaching duringobservation and to test longevity of marks. As theseare internal structures, it is also possible that tissuegrowth obscured mark visibility. However, based oninternal persistence and the observed overgrowth atthe oral end of the demipyramids, it is likely thatthe shorter durations of external visibility seen inthe present study are due to subsequent calcitic
Table 4. Linear regression statistics for Fig. 11. For Fig. 11C, exponent and coefficient are calculated as the antilog ofthe linear regression on the log–log transformed data.
Measurements analyzed Linear regression statistics
R2 Slope (�SE) Intercept (mm) (�SE) p intercept=0 (d.f.) p slope=0 (d.f.)
Δdemipyramid aboral end (y); Δdemipyramid total length (x) (Fig. 11A,B)Average aboral end 0.97 0.79 (�0.025) 0.075 (�0.023) 0.0003 (1, 32) <0.001 (1, 32)Smooth edge of aboral end 0.97 0.81 (�0.025) 0.040 (�0.023) 0.09 (1, 32) <0.001 (1, 32)
Measurements analyzed Linear regression statistics
R2 Exponent (�SE) Coefficient (mm) p slope=0 (d.f.)
Demipyramid total length (y); test diameter (x) (Fig. 11C)Initial (July 2011) 0.87 0.87 (�0.062) 3.6 <0.001 (1, 32)Final (June 2012) 0.55 0.62 (�0.099) 3.9 <0.001 (1, 32)Pooled 0.98 0.87 (�0.016) 3.6 <0.001 (1, 32)
Fig. 12. A demipyramid viewed after the lantern was extracted 2 years post-marking, marked sequentially at 5–7 dintervals by injection with tetracycline, alizarin complexone, calcein blue, and calcein. The image in (A) was created byoverlaying the images in (B–E). Images were visualized using ambient light (B), and WIB (C), Texas Red (D), andNUA (E) filter cubes on a fluorescence microscope. Scale bar=0.5 mm.
Invertebrate Biologyvol. 132, no. 3, September 2013
262 Johnson, Salyers, Alcorn, Ellers, & Allen

accretion covering the marks, rather than disappear-ance of marks per se.
Internal visibility of marks in sea urchins
In the limited number of occasions where it hasbeen checked, internal fluorochrome marks appearto remain visible for months or years, although thepresent study is the first to document the 2-year per-sistence of calcein blue, alizarin complexone, andsequential multiple marks in sea urchins. In the cur-rent study, tetracycline, calcein blue, and calceinremained internally visible for at least 11 monthsafter marking juvenile sea urchins. Similarly, in pre-liminary studies in which we marked similarly sizedjuvenile sea urchins, these three fluorochromes andalizarin complexone remained internally visible untilthe end of the study at 22 months post-marking(J.D. Allen, A.S. Johnson, O. Ellers, N.J. Alcorn,unpubl. data).
Longevity of internal marks is not well known asthe durations of marking studies are rarely very longcompared with the life span of sea urchins; in a listof 11 fluorochrome studies on sea urchins, only twowere of 2-year duration and two were of 1-yearduration, with all others being only a few months(Russell & Meredith 2000). Persistence of internallyvisualized tetracycline and calcein marks for at least1 year has been observed in other studies: in ophiu-roids (Medeiros-Bergen & Ebert 1995; Stewart1996), in holothuroids (Purcell et al. 2006; Purcell &Blockmans 2009), and in several species of seaurchins (Ellers et al. 1998; Russell et al. 1998; Ebertet al. 1999; Russell 2000), although none of thosestudies used animals as small as the juvenile seaurchins used in the present trials. In adult sea urch-ins, internal tetracycline marks have been detectedafter 2 years (Gage 1992) and internal calcein markshave been detected after 3.9 years (Lamare &Mladenov 2000). Even longer persistence times havebeen observed in other species: calcein marks per-sisted for 13 years in a coralline sponge (Willenz &Hartman 1999), and Alizarin Red S persisted for atleast 10 years in corals (Rosenfeld et al. 2003).Overall, internal persistence for many years seemspossible in sea urchins.
Diametrical growth of marked juvenile sea urchins
In general, diametrical growth rate in sea urchinsincreases with increasing size in the smallest seaurchins, reaches a maximum at an intermediatediameter, and decreases with further increases indiameter. This pattern of growth has been fit with
several different functions, including the Tanakaand gamma functions (Ebert & Russell 1993; Rus-sell et al. 1998; Ebert et al. 1999; Russell 2000;Rogers-Bennett et al. 2003; Ellers & Johnson 2009).Although the models disagree in the details of thespecific fits, they are all characterized by nearly lin-ear increases in growth rate with increasing diame-ter for the smallest sea urchins. In fact, Seldenet al. (2009) were able to compare the size-specificeffect of crab effluent on growth of sea urchinsusing linear fits to data for sea urchins smaller than17 mm. In contrast, in the current study, growthrate was independent of size during the markingmonth (Fig. 3). This may have been due to theexceptionally narrow size range of sea urchins usedin this study. However, the significantly negativerelationship between growth rate and size in thesubsequent months was contrary to previous stud-ies. It is not possible to pinpoint a precise cause forthis difference. Sea urchins were fed ad libitum, andthus differences in food availability per se do notexplain this reverse trend, but it is possible that thetype of food mattered: the algal and microfaunalfood was different from the sea urchin chow usedpreviously (Ellers & Johnson 2009). Also, becauseof the small size of the sea urchins, we used a dif-ferent type of cage with a finer mesh size; thusvarying effects on water flow caused by differentmesh or cage sizes could contribute to the observeddifferences in size-dependent growth between thisand previous studies.
The magnitude of growth rates in the currentstudy was slightly less than in our previous growthstudy (Ellers & Johnson 2009), which was conductedat 14°C. The most comparable point is given bycomparing growth rates of sea urchins at the sametemperature and initial diameter. In the currentstudy, growth rate during the third month, whentemperatures averaged 15.4°C and initial size aver-aged 2.5 mm, was 6.4 mm year�1 (�0.24 SE). Butan extrapolation of the fit from Ellers & Johnson(2009; Fig. 7) to a sea urchin of the same initialdiameter gives 13.3 mm year�1 (�1.8 SE). Thesetwo growth rates are not statistically equal becausetheir 95% confidence limits (=2 SE) do not overlap.Thus, growth rates in the current study were lower,possibly as a result of diet, which was Wenger seaurchin chow in the previous experiment and kelp inthe present study. This finding is consistent withother studies (Briscoe & Sebens 1988; Meidel &Scheibling 1999; Eddy et al. 2012), which foundthat Strongylocentrotus droebachiensis grew betterwhen kelp was supplemented with protein or onprotein alone. The decrease in growth rate between
Invertebrate Biologyvol. 132, no. 3, September 2013
Growth in fluorochrome-labeled sea urchins 263

November 2011 and June 2012 was presumably dueto the decrease in ambient seawater temperatures(Table 1) and to a decrease in food availability, assea urchins switched from feeding on kelp ad libitumto scavenging on epifauna growing on their cages.Similarly, Rowley (1990) found that 53 d-old, lab-oratory-grown S. purpuratus grew faster in treat-ments fed kelp (6.8–14.1 mm year�1) than intreatments with just the natural microbial coveringon bare rocks available for food (1.5–2.8 mmyear�1).
Neither calcein nor calcein blue nor tetracyclinealtered mortality or growth of juvenile sea urchins.The absence of any short-term depression of growthin S. droebachiensis in response to fluorochrometreatments was in contrast to some previous studies.For example, growth in calcein treatments was sig-nificantly slowed relative to a control in the firstmonth of growth in Ellers & Johnson (2009) and inthe first week of growth in Russell & Urbaniak(2004), but not thereafter. Ellers & Johnson (2009)also found a short-term suppression of growth rela-tive to controls of calcein blue and alizarin complex-one, but not tetracycline using the sameconcentrations used in the present study. In the2009 study, sample sizes were larger so perhapssmall, temporary adverse effects were more readilydetected.
Plate and diametrical growth and sea urchin shape
External visualization of marks on living sea urch-ins enables new experimental approaches for study-ing how plate growth and sea urchin growth arerelated. For instance, sea urchin growth ratedepends on food availability, photoperiod, and tem-perature, but it is not known whether it is the rateof addition of plates or the growth rate of individualplates that changes. The distinction between thesetwo growth modes has evolutionary implicationssince a trend in echinoid evolution has been fromgrowth by plate addition to growth by plate accre-tion (Smith 2005). On our marked sea urchins,newly added plates and unmarked new growth ofadjacent plates are clearly visible as dark unmarkedregions (Fig. 13). Thus, using externally visible fluo-rochrome marks, especially marking at several timepoints with different fluorochromes, would enablemeasurement of how plate addition and plate accre-tion vary with experimentally manipulated growthrate.
Associated with plate accretion are naturallyoccurring growth lines in plates. Such growth lineshave been extensively documented (Deutler 1926;
Raup 1968; Duineveld & Jenness 1984; Ebert1988). Fluorochromes could be used to interpretthe fine structure of growth lines, with their alter-ation of organized and unorganized trabeculargrowth associated with changes in growth rate (Pe-arse & Pearse 1975). These growth lines have alsobeen used as inspiration for models of plate andsea urchin growth (Zachos 2009; Abou Chakra &Stone 2011b). Correctly interpreting growth lines interms of growth rates and timing of growth isessential for calibrating and further developing suchmodels. We show that the aboral border of theoculogenital ring (or equivalently the adoral borderof the periproct) underscales with diameter(Fig. 10); this fact could and should be used eitheras boundary inputs to, or predicted outcomes of,such models. Models in the context of such experi-mental data could show how growth at the level ofindividual plates influences the shape of a seaurchin as a whole.
Although a comprehensive model of plate growthover the entire surface of sea urchins might be anultimate goal, a back-of-the-envelope analysis canalready yield insights. For instance, the averageaccretion of calcite in the hoop direction of the am-bital plates, estimated from average diametricalgrowth rates over the first 2 months, was 2.1 lm
Fig. 13. Aboral view of calcein marks and a growth zoneon a living sea urchin at 38 d post-marking, viewed witha WIB filter cube. Ocular plates IV and V and genitalplate 4 are labeled. The dark region indicated by the dou-ble arrow represents growth of the adoral edge of theoculogenital ring, growth of the edge of the axial platesthat abutted the oculogenital ring at the time of marking,and addition of new axial plates produced since marking.Scale bar=0.5 mm.
Invertebrate Biologyvol. 132, no. 3, September 2013
264 Johnson, Salyers, Alcorn, Ellers, & Allen

per plate per d (�0.04 SE; n=284); this rate can becompared with the average accretion of calcite inthe hoop direction of the genital plates, which was1.9 lm per plate per d (�0.12 SE; n=19). Thus, theaverage accretion rate of the major ambital plates,which contribute to circumferential growth, is aboutthe same as the average accretion rate of the fivegenital plates, which cause widening of the oculo-genital ring. But as there are only five genital platestending to drive circumferential growth in the oculo-genital ring versus 20 such plates driving circumfer-ential growth at the ambitus, there is an inherenttendency toward underscaling of the apical disk(consisting of the oculogenital ring plus periproct).The main point, however, is that the integratedunderstanding of shape change could be modeledand tested by the kinds of visualization we demon-strate in the current study.
Plasticity in growth of plates (Pearse & Pearse1975) could contribute to plasticity in skeletalshape. Skeletal shape, however, is not a simple sumof the plates. At the time of growth, sutures loosenand are held together by collagenous fibers (Dafni1986; Ellers et al. 1998; Johnson et al. 2002), allow-ing the sutures to act as hinges and reorient inresponse to forces acting on the skeleton (Ellers &Telford 1992; Ellers 1993). Thus, sutural flexibilityduring growth may control overall sea urchinshape.
Demipyramid and diametrical growth
Tetracycline marks on demipyramids are oftenused to quantify growth of sea urchins returned tothe field for 1 year post-marking (see e.g., Ebert &Russell 1993; Russell et al. 1998; Ebert et al. 1999;Russell 2000). This technique assumes that there isa temporally unchanging and low variance allomet-ric relationship between demipyramid length andsea urchin diameter for sea urchins living in agiven experimental period and habitat. The tech-nique also requires that both the initial and finaljaw size can be measured on the demipyramid (seeFigs. 2 and 11). Key to using this technique is thatthe entire length of the original jaw can be mea-sured from the fluorochrome marks. However,demipyramids of S. droebachiensis thicken at theoral end during growth, which can obscure themark at the original oral end of the demipyramid(Fig. 10). We found this to be the case in 13% (5/40) of the demipyramids photographed. Similarly,Pederson & Johnson (2008) were not able to distin-guish measureable growth at the oral end of thedemipyramids of Heliocidaris erythrogramma
(VALENCIENNES, 1846) at 1–2 years post-marking.Thus, establishing a relationship between growth ofthe aboral end of the demipyramid and growth ofthe whole demipyramid enables using a greaternumber of recovered demipyramids for growthquantification. Although 97% of the variation intotal demipyramid length was accounted for byvariation in either the mean of the measures of theaboral end or just the measure of the smooth edgeof the aboral end of the demipyramid, the latterrelationship had a zero intercept, whereas the for-mer did not (Fig. 11A,B). Thus, change in lengthof the smooth edge of the aboral end of the demi-pyramid, which involves only a single measurementof the demipyramid, is the most straightforwardsubstitute for change in total demipyramid lengthwhen using demipyramid growth to calibrate dia-metrical growth.
The allometry between demipyramid and diamet-rical growth is sensitive to variations in diet andhabitat (Ebert 1980; Black et al. 1982, 1984; Levitan1991; McShane & Anderson 1997; Pederson &Johnson 2008); thus, the specific allometry has to beuniquely established for each population being stud-ied. Typically, the allometric relationship betweendiameter and demipyramid length has been estab-lished among recaptured sea urchins in mark-recap-ture studies (Ebert & Russell 1993; Russell et al.1998; Ebert et al. 1999; Russell 2000). This tech-nique will work best if there is a broad size range inthe recaptured group. However, care must be takenin using this endpoint as a narrow size range cangive an erroneous, or variable, allometry (Fig. 11);we found that the allometry was the same if just theinitial values were used or the combined initial andfinal values were used, but not if just the final valueswere used.
For combined initial and final measurements onthe 40 sea urchins we measured, the allometry waspositive (jaw length increased faster than diameterlength): D=3.63 J0.87, where D is the diameter and Jis the demipyramid length. For comparison, Russell(2000) had similar coefficients for S. droebachiensis,but exponents of around 1.2, indicating a negativeallometry. Relatively large jaws can be associatedwith food shortage (Ebert 1980; Black et al. 1982,1984; Levitan 1991; McShane & Anderson 1997;Pederson & Johnson 2008). Diet, habitat, flow, oxy-gen, and temperature differences between our labo-ratory-reared sea urchins and wild-caught seaurchins may contribute to the difference betweenRussell (2000) and our results, but any more specificinterpretation of these scaling differences wouldrequire further experimental work.
Invertebrate Biologyvol. 132, no. 3, September 2013
Growth in fluorochrome-labeled sea urchins 265
Spine growth
The variable and splotchy intensity of the fluoro-chrome marks around plate borders, on spines, ondemipyramids, and on other elements of the skele-ton (Figs. 1,2,4,5,6,10,13) indicates that there areasynchronies in the deposition of calcite in the ele-ments of the endoskeleton. Asynchrony is evidentespecially on spines, which appear to have a polka-dot or leopard-spot pattern of addition of calcite.This pattern of calcification in spines has also beendetected by 26Mg and NanoSIMS high-resolutionisotopic imaging of regenerating spines (Gorzelaket al. 2011; compare images in their Figure 2d withthose in our study). As described by Gorzelak et al.(2011), although the overall effect is to create conicallayers, the calcification appears to occur in a patch-work with migrating cells laying down areas of cal-cite. Ultimately, the aggregate calcification leads tospine growth lines (Deutler 1926) that are not entirelyage- or size-dependent (Ebert 1968, 1986) and to astructure with magnesium concentrations toward theouter edge of spines that strengthen the load-bearingcolumns in the spines (Tsafnat et al. 2012). Furtherwork is required to fully categorize the pattern of cal-cite accretion on the spines. Perhaps repeated fluoro-chrome marking of spines would create externalmarks that would be even easier to detect visuallythan the jaw and skeletal plate marks that are thefocus of the current report.
Fluorochrome marking in future studies
The external visibility of the marks enables multi-ple recapture intervals after the initial mark andrelease, thereby potentially informing a finer scaleunderstanding of factors influencing growth andmortality of sea urchins in the field. Marking couldenable ecological studies that seek to determinewhether populations are regulated by settlement orpost-settlement processes (e.g., Rowley 1989)because all initially present individuals could bemarked and their growth and movements followed.Furthermore, photoperiod effects on growth (Pearseet al. 1986) could be tracked seasonally in field pop-ulations via seasonally applied multi-colored fluoro-chromes. External visualization also makes itpossible to track the fate of hatchery-raised seaurchins (Harris et al. 2003, 2004; Devin et al. 2004)at field sites with non-lethal sampling for at least11 months, and longer if destructive sampling isused.
Furthermore, for basic ecological research, themarking of early juvenile stages enables tracking of
the post-metamorphic fate of sea urchins whose lar-val experience and fate is well documented in thelaboratory. For example, indirect effects of preda-tors on growth and morphology of larval and adultechinoids have been demonstrated in the laboratory(Vaughan & Strathmann 2008; Selden et al. 2009),but have yet to be demonstrated in the field. Simi-larly, studies of the effects of maternal investmentand larval food environment typically stop upon set-tlement (Allen et al. 2006; Alcorn & Allen 2009),but the ability to mark and track juvenile sea urch-ins in common garden experiments or in field out-plants will allow for the exploration of latent effects(Pechenik 2006; Carrasco & Phillips 2012) formonths or years post-settlement.
At present, such field surveys would have to becarried out by transporting animals to a suitablemicroscope in a laboratory, but development of afield portable device seems possible. Visualizationusually requires both illumination with a sharplydelineated range of wavelengths to excite a specificfluorochrome and detection of emitted fluorescencein a second sharply delineated range of wavelengths.These conditions are typically only obtainable withspecialized filters, and these are not currently avail-able in field portable devices. However, we havebeen able reliably to detect tetracycline marks exter-nally visible on the demipyramids of living sea urch-ins without a microscope by using a handheldultraviolet light (O. Ellers, A.S. Johnson, G. Lonati,M. Askins, unpubl. data). This may be easier toachieve for tetracycline than for other fluorochromesbecause the excitation and emission peaks for tetra-cycline are further apart than are those of other flu-orochromes (Ellers & Johnson 2009).
Acknowledgments. We thank S. Eddy and the staff ofthe University of Maine Center for Cooperative Aquacul-ture Research for providing us with juvenile sea urchins,and M. Melendy for assistance with animal care. We alsothank J. Pearse and an anonymous reviewer for construc-tive reviews, M. Pizer for critically reading early drafts,and the following Bowdoin and William and Mary under-graduates for laboratory assistance: F. Armstrong, M.Askins, H. Blackburn, R. Brothers, K. Guttenplan, G.Lonati, L. Newcomb, D. Schwab, M. Smithson, and C.White. ASJ was supported by a Bowdoin College FacultyLeave Fellowship, NJA was supported by a DohertyCoastal Studies Research Fellowship from Bowdoin Col-lege, JMS was supported by an HHMI travel grantthrough the Undergraduate Biological Sciences educationprogram to the College of William and Mary, and JDAwas supported by Bowdoin College as the DohertyMarine Biology Postdoctoral Scholar and by the Collegeof William and Mary with a Suzann Wilson Matthews
Invertebrate Biologyvol. 132, no. 3, September 2013
266 Johnson, Salyers, Alcorn, Ellers, & Allen
Summer Research Award during the completion of thisresearch.
References
Abou Chakra M & Stone JR 2011a. Classifying echinoidskeleton models: testing ideas about growth and form.Paleobiol. 37: 686–695.
———— 2011b. Holotestoid: a computational model fortesting hypotheses about echinoid skeleton form andgrowth. J. Theor. Biol. 285: 113–125.
Alcorn NJ & Allen JD 2009. How do changes in parentalinvestment influence development in echinoid echino-derms? Evol. Dev. 11: 719–727.
Allen JD, Zakas C, & Podolsky RD 2006. Effects of eggsize reduction and larval feeding on juvenile quality fora species with facultative-feeding development. J. Exp.Mar. Biol. Ecol. 331: 186–197.
Black R, Johnson MS, & Trendall JT 1982. Relative sizeof Aristotle’s lantern in Echinometra mathaei occurringat different densities. Mar. Biol. 71: 101–106.
Black R, Codd C, Hebbert D, Vink S, & Burt J 1984.The functional significance of the relative size of Aris-totle’s lantern in the sea urchin Echinometra mathaei(De Blainville). J. Exp. Mar. Biol. Ecol. 77: 81–97.
Briscoe CS & Sebens KP 1988. Omnivory in Strongylo-centrotus droebachiensis (M€uller) (Echinodermata: Echi-noidea): predation on subtidal mussels. J. Exp. Mar.Biol. Ecol. 115: 1–24.
Carrasco SA & Phillips NE 2012. Differential vulnerabil-ity to predation in two sympatric whelks is mediatedby juvenile traits. Invertebr. Biol. 131(3): 187–196.doi:10.1111/j.1744-7410.2012.00274.x.
Constable AJ 1993. The role of sutures in shrinking ofthe test in Heliocidaris erythrogramma (Echinoidea:Echinometridae). Mar. Biol. 117: 423–430.
Dafni J 1986. A biomechanical model for the morphogen-esis of regular echinoid tests. Paleobiol. 12: 143–160.
Deutler F 1926. Uber das Wachstum des Seeigelskeletts.Zool. Jahrbucher. 48: 119–200.
Devin MG, Peacock RJ, & Stence HD 2004. Develop-ment of grow-out techniques for juvenile sea urchinsStrongylocentrotus droebachiensis. In: Proceedings ofthe International Conference on Sea Urchin Fisheriesand Aquaculture 2003. Lawrence J, ed., pp. 246–254.DEStech Publications Inc., Lancaster, PA.
Duineveld GCA & Jenness MI 1984. Differences ingrowth rates of the sea urchin Echinocardium cordatumas estimated by the parameter x of the von Bertalanffyequation applied to skeletal rings. Mar. Ecol. Prog.Ser. 19: 65–72.
Dumont C, Himmelman JH, & Russell MP 2004. Size-specific movement of green sea urchins Strongylocentro-tus droebachiensis on sea urchin barrens in eastern Can-ada. Mar. Ecol. Prog. Ser. 276: 93–101.
Eads C & Layzer JB 2002. How to pick your mussels out ofa crowd: using fluorescence to mark juvenile freshwatermussels. J. North Am. Benthol. Soc. 21: 476–486.
Ebert TA 1968. Growth rates of the sea urchin (Strongy-locentrotus purpuratus) related to food availability andspine abrasion. Ecology 49: 1075–1091.
———— 1980. Relative growth of sea urchin jaws: anexample of plastic resource allocation. Bull. Mar. Sci.30: 467–474.
———— 1986. A new theory to explain the origin ofgrowth lines in sea urchin spines. Mar. Ecol. Prog. Ser.34: 197–199.
———— 1988. Calibration of natural growth lines in ossi-cles of two sea urchins, Strongylocentrotus purpuratusand Echinometra mathaei using tetracycline. In: Echino-derm Biology: Proceedings 6th International Echino-derm Conference. Burke RD, Mladenov PV, LambertP, & Parsley RL, eds., pp. 435–443. A.A. Balkema,Rotterdam, the Netherlands.
———— 2001. Growth and survival of post-settlement seaurchins. In: Edible Sea Urchins: Biology and Ecology.Lawrence JM, ed., pp. 79–102. Elsevier Science,Amsterdam, the Netherlands.
Ebert TA & Russell MP 1993. Growth and mortality ofsubtidal red sea urchins (Strongylocentrotus francisc-anus) at San Nicolas Island, California, USA: problemswith models. Mar. Biol. 117: 79–89.
Ebert TA, Dixon JD, Schroeter SC, Kalvass PE, Rich-mond NT, Bradbury WA, & Woodby DA 1999.Growth and mortality of red sea urchins Strongylocen-trotus franciscanus across a latitudinal gradient. Mar.Ecol. Prog. Ser. 190: 189–209.
Eddy SD, Brown NP, Kling AL, Watts SA, & LawrenceA 2012. Growth of juvenile green sea urchins, Strongy-locentrotus droebachiensis, fed formulated feeds withvarying protein levels compared with a macroalgal dietand a commercial abalone feed. J. World Aquacult.Soc. 43(2): 159–173.
Ellers O 1993. A mechanical model of growth in regu-lar sea urchins: predictions of shape and a develop-mental morphospace. Proc. R. Soc. Lond. B 254:123–129.
Ellers O & Johnson AS 2009. Polyflurochrome markingslows growth only during the marking month in thegreen sea urchin Strongylocentrotus droebachiensis.Invertebr. Biol. 128: 126–144.
Ellers O & Telford M 1992. Causes and consequences offluctuating coelomic pressure in sea urchins. Biol. Bull.182: 424–434.
Ellers O, Johnson AS, & Moberg P 1998. Suturalstrengthening of urchin skeletons by collagenoussutural ligaments. Biol. Bull. 195: 136–144.
Gage JD 1992. Natural growth bands and growth vari-ability in the sea urchin Echinus esculentus: results fromtetracycline tagging. Mar. Biol. 114: 607–616.
Gorzelak P, Stolarski J, Dubois P, Kopp C, & MeibomA 2011. 26Mg labeling of the sea urchin regeneratingspine: insights into echinoderm biomineralization pro-cess. J. Struct. Biol. 176: 119–126.
Hagen NT 2003. KCl induced paralysis facilitates detach-ment of hatchery reared juvenile green sea urchins,
Invertebrate Biologyvol. 132, no. 3, September 2013
Growth in fluorochrome-labeled sea urchins 267
Strongylocentrotus droebachiensis. Aquaculture 216:155–164.
Harris LG, Madigan P, & Waters K 2003. A hatcherysystem for green sea urchin aquaculture in the Gulf ofMaine. World Aquacult. 34: 32–38.
Harris LG, Madigan P, & Toppin RL 2004. Test of asuspended recruitment and juvenile grow out systemfor the sea urchin Strongylocentrotus droebachiensis inthe Gulf of Maine. In: Proceedings of the 11th Interna-tional Echinoderm Conference, Munich, Germany.Heinzeller T & Nebelsick JH, eds., pp. 277–282. A.A.Balkema, New York.
Hidu H & Hanks HE 1968. Vital staining of bivalve mol-lusk shells with alizarin sodium monosulfonate. Proc.Natl. Shellfish Assoc. 58: 37–41.
Jackson RT 1912. Phylogeny of the Echini, with a revi-sion of Paleozoic species. Mem. Boston Soc. Nat. Hist.7: 1491.
Johnson AS, Ellers O, Lemire J, Minor M, & Leddy H2002. Sutural loosening and skeletal flexibility duringgrowth: determination of drop-like shapes in sea urch-ins. Proc. R. Soc. Lond. B 269: 215–220.
Lamare MD & Mladenov PV 2000. Modeling somaticgrowth in the sea urchin Evechinus chloroticus (Echinoi-dea: Echinometridae). J. Exp. Mar. Biol. Ecol. 243:17–43.
Levitan DR 1991. Skeletal changes in the test and jaws ofthe sea urchin Diadema antillarum in response to foodlimitation. Mar. Biol. 111: 431–435.
McShane PE & Anderson OF 1997. Resource allocationand growth rates in the sea urchin Evechinus chloroticus(Echinoidea: Echinometridae). Mar. Biol. 128: 657–663.
Medeiros-Bergen DE & Ebert TA 1995. Growth, fecun-dity and mortality rates of two intertidal brittlestars(Echinodermata: Ophiuroidea) with contrasting modesof development. J. Exp. Mar. Biol. Ecol. 189: 47–64.
Meidel SK & Scheibling RE 1999. Effects of food typeand ration on reproductive maturation and growth ofthe sea urchin, Strongylocentrotus droebachiensis. Mar.Biol. 134: 155–166.
Moran AL 2000. Calcein as a marker in experimentalstudies of newly-hatched gastropods. Mar. Biol. 137:893–898.
Moran AL & Emlet RB 2001. Offspring size and perfor-mance in variable environments: field studies on a mar-ine snail. Ecology 82: 1597–1612.
Moran AL & Marko PB 2005. A simple technique forphysical marking of larvae of marine bivalves. J. Shell-fish Res. 24: 567–571.
Pautke C, Vogt S, Tischer T, Wexel G, Deppe H, Milz S,Schieker M, & Kolk A 2005. Polychrome labeling ofbone with seven different fluorochromes: enhancingfluorochrome discrimination by spectral image analysis.Bone 37: 441–445.
Pearse JS & Pearse VB 1975. Growth zones in the echi-noid skeleton. Am. Zool. 15: 731–753.
Pearse JS, Pearse VB, & Davis KK 1986. Photoperiodicregulation of gametogenesis and growth in the sea
urchin Strongylocentrotus purpuratus. J. Exp. Zool. 237:107–118.
Pechenik JA 2006. Larval experience and latent effects–metamorphosis is not a new beginning. Integr. Comp.Biol. 46: 323–333.
Pederson HG & Johnson CR 2008. Growth and agestructure of sea urchins (Heliocidaris erythrogramma) incomplex barrens and native macroalgal beds in easternTasmania. ICES J. Mar. Sci. 65: 1–11.
Purcell SW & Blockmans BF 2009. Effective flurochromemarking of juvenile sea cucumbers for sea ranchingand restocking. Aquaculture 296: 263–270.
Purcell SW, Blockmans BF, & Nash WJ 2006. Efficacy ofchemical markers and physical tags for large-scalerelease of an exploited holothurian. J. Exp. Mar. Biol.Ecol. 334: 283–293.
Raup DM 1968. Theoretical morphology of echinoidgrowth. J. Paleontol. 42: 50–63.
Raup DM & Swan EF 1967. Crystal orientation in theapical plates of aberrant echinoids. Biol. Bull. 133:618–629.
Rogers-Bennett L, Rogers DW, Bennett WA, & EbertTA 2003. Modeling red sea urchin (Strongylocentrotusfranciscanus) growth using six growth functions. Fish.Bull. 101: 614–626.
Rosenfeld M, Yam R, Shemesh A, & Loya Y 2003.Implication of water depth on stable isotope composi-tion and skeletal density banding patterns in a Poriteslutea colony: results from a long-term translocationexperiment. Coral Reefs 22: 337–345.
Rowley RJ 1989. Settlement and recruitment of sea urch-ins (Strongylocentrotus spp) in a sea urchin barrenground and a kelp bed: are populations regulated bysettlement or post-settlement processes? Mar. Biol. 100:485–494.
———— 1990. Newly settled sea urchins in a kelp bed andsea urchin barren ground: a comparison of growth andmortality. Mar. Ecol. Prog. Ser. 62: 229–240.
Russell MP 2000. Spatial and temporal variation ingrowth of the green sea urchin Strongylocentrotus droe-bachiensis, in the Gulf of Maine, USA. In: Proceedingsof the Tenth International Echinoderm Conference.Barker AA, ed., pp. 533–538. A.A. Balkema, Rotter-dam, the Netherlands.
Russell MP & Meredith RW 2000. Natural growth linesin echinoid ossicles are not reliable indicators of age: atest using Strongylocentrotus droebachiensis. Invertebr.Biol. 119: 410–420.
Russell MP & Urbaniak LM 2004. Does calcein affectestimates of growth rates in sea urchins? In: Proceed-ings of the Eleventh International Echinoderm Confer-ence. Heinzeller T & Nebelsick JH, eds., pp. 53–57.A.A. Balkema, Rotterdam, the Netherlands.
Russell MP, Ebert TA, & Petraitis PS 1998. Field esti-mates of growth and mortality of the green sea urchinStrongylocentrotus droebachiensis. Ophelia 48: 137–153.
Selden R, Johnson AS, & Ellers O 2009. Waterborne cuesfrom crabs induce thicker skeletons, smaller gonads
Invertebrate Biologyvol. 132, no. 3, September 2013
268 Johnson, Salyers, Alcorn, Ellers, & Allen

and size-specific changes in growth rate in sea urchins.Mar. Biol. 156: 1057–1071.
Smith AB 2005. Growth and form in echinoids: the evolu-tionary interplay of plate accretion and plate addition.In: Evolving Form and Function – Fossils and Devel-opment. Briggs DEG, ed., pp. 181–194. Yale UniversityPress, New Haven.
Stewart B 1996. Growth dynamics of the radial shields ofthe euryalis snake star Astrobrachion constrictum (Echi-nodermata: Ophiuroidea). Invertebr. Biol. 115: 321–330.
Takumida M, Zhang DM, Yajin K, & Harada Y 1997.Polychromatic labeling of otoconia for the investigation
of calcium turnover. ORL J. Otorhinolaryngol. Relat.Spec. 59(1): 4–9.
Tsafnat N, Fitz Gerald JD, Le HN, & Stachurski ZH2012. Micromechanics of sea urchin spines. PLoS ONE7(9): e44140. doi:10.1371/journal.pone.0044140
Vaughan D & Strathmann RR 2008. Predators inducecloning in echinoderm larvae. Science 319: 1503.
Willenz P & Hartman WD 1999. Growth and regenera-tion rates of the calcareous skeleton of the Caribbeancoralline sponge Ceratoporella nicholsoni: a long termsurvey. Mem. Queensl. Mus. 44: 675–685.
Zachos LG 2009. A new computational growth model forsea urchin skeletons. J. Theor. Biol. 259: 646–657.
Invertebrate Biologyvol. 132, no. 3, September 2013
Growth in fluorochrome-labeled sea urchins 269