Embed Size (px)
Citation preview

5‐6‐2015
1
External quality assesment in Europe
Predictive markers as game changer
Han van Krieken,
Nijmegen, the Netherlands
Prognosis
• Differentiation/grade
• Extend (TNM)
• Additional features
• Angioinvasion
• Protein expression
Prediction
Concentrate therapeutic interventions on patients likely
to benefitEfficacy
.
EfficiencySpare expense in patients
not likely to benefit
Predictivebiomarkers
Spare potential sideeffects in patientsnot likely to benefit
Safety

5‐6‐2015
2
Prediction
• Dependant on tumor type
• The same gene alteration has different effects in different tumors
External quality assessment more important than ever
• The result of a single test determines clinical management
• Proces/Technology more complicated
• Rapid changes in scope
QA is a key part of Good Laboratory Practice, GLP
Test Facility Organization and Personnel
FacilitiesApparatus, materials and reagents
Quality Assesmentprogramme
Components of GLP:
Test systems Test & reference items
Standard operating procedures
Performance of the study
Reporting of study results
Storage and retention of records and materials
g
5‐6‐2015
3
Validation and verification of diagnostic tests
New diagnostic test
e.g. • Laboratory developed methods
• Existing tests used outside of approved scope
Existing, approved test
e.g. • Commercial CE-IVD kits
• Approved tests with defined performance specifications
VALIDATIONVALIDATION
Define performance specification: accuracy, limitations, controls
VERIFICATION
Compare performance with existing specifications
Test implementation
Continual validation
Performance monitoring and audits
ESP Quality Assurance Programme
2008: With support from Amgen, multidisciplinary group formsand makes proposal for European QA Programme
2012: The multidisciplinary group establishes guidelines toharmonize EQA schemesin molecular pathology
EV0313
2014: June–Sept online registration open for 2014−2015 ESP Colon EQA scheme
2009: First European KRAS EQA scheme pilot tests in 11 expert centres
Regional EQA roll‐out approves 55 centres
2010−12: Annual KRAS EQA schemes award 296 approvals in32 countries
2013: ESP Colon EQA scheme expands to include KRAS, NRAS and BRAFtesting
2015: June–Sept results of2014−2015 ESP Colon EQA scheme
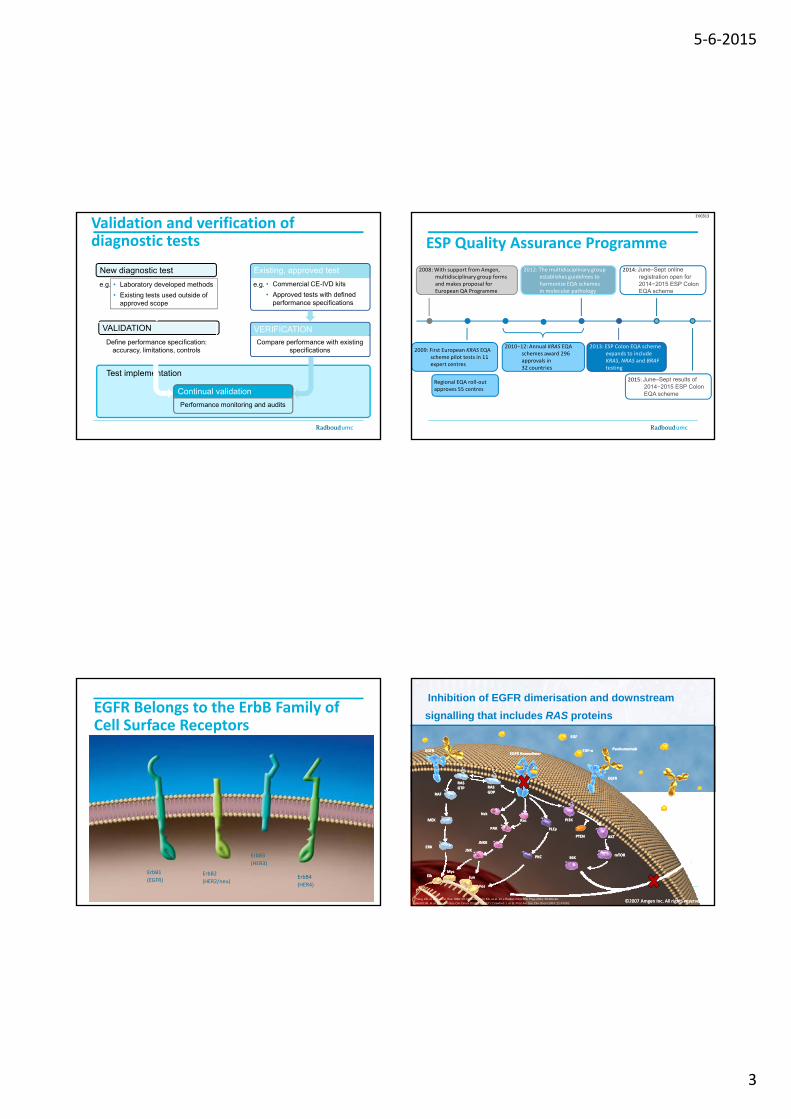
EGFR Belongs to the ErbB Family of Cell Surface Receptors
ErbB1
(EGFR)ErbB2
(HER2/neu)
ErbB3
(HER3)
ErbB4
(HER4)
Inhibition of EGFR dimerisation and downstream
signalling that includes RAS proteins
EGFREGFREGFR EGFR HomodimerHomodimer
RASRASGTPGTP RASRAS
GDPGDP
EGFEGF
TGFTGF‐‐αα PanitumumabPanitumumab
EGFREGFR
Yang XD, et al. Cancer Res 1999; 59:1236-43; Foon KA, et al. Int J Radiat Oncol Biol Phys 2004; 58:984-90;
Hecht JR, et al. Proc Am Soc Clin Oncol 2004; 22:A3511; Crawford J, et al. Proc Am Soc Clin Oncol 2004; 22:A7083.©2007 Amgen Inc. All rights reserved©2007 Amgen Inc. All rights reserved
GDPGDPRAFRAF
MEKMEK
ERKERK
ElkElkMycMyc
JNKJNK
JunJun
JNKKJNKK
PAKPAK
NckNck
RacRac
PLCPLCγγ
PPKCKC
PPTENTEN
PPI3KI3K
S6KS6K
AKTAKT
mTORmTOR
ProliferationProliferationAntiAnti‐‐apoptosisapoptosisAngiogenesisAngiogenesisSurvivalSurvivalMetastasisMetastasis
FosFos

5‐6‐2015
4
KRAS Is Important in Growth and Cell Division—Mutations Can Cause Cancer
• Ras proteins are GTPases• Ras family members include:
KRAS, NRAS, and HRAS
• Normal cycle occurs between a
GDPinactive
GDPinactive Normal:
– Growth
– Proliferation
– Differentiation
• Normal cycle occurs between a GDP‐bound (inactive) and a GTP‐
bound (active) form of Ras
• Specific mutations in the KRASgene result in a constitutively
active protein
GTP
activeGTP
active
GDP
GTP
inactive
active
*
GDP
GTP
inactive
active
*Schubbert S, et al. Nature Rev Cancer. 2007;7:295‐308.
ABNORMAL:
– Growth
– Proliferation
– Differentiation
Cet + FOLFIRI(n=178)
FOLFIRI(n=189)
No. events 130 154
Median OS 28.4 20.2
(95% CI) (24.7–31.6) (17.0–24.5)
HR 0.69 (0.54–0.88)
p=0.0024
OS: KRAS wt vs. RAS wt
KRAS wt (exon 2) RAS wt
Cet + FOLFIRI(n=316)
FOLFIRI(n=350)
No. events 242 288
Median OS 23.5 20.0
(95% CI) (21.2–26.3) (17.4–21.7)
HR 0.796 (0.670–0.946)
p=0.0093
Data on file
Cetuximab + FOLFIRI
FOLFIRICetuximab + FOLFIRI
FOLFIRI
EPAR cetuximab, june 2014
Implications for current practice in mCRC
Expanded RAS analysis of 1st‐line mCRC patients improved the benefit/risk profile of EGFR‐targetedimproved the benefit/risk profile of EGFR targeted
therapy
There are many different RAS testing methods
IVDmethods
Laboratory based methodsNon‐commercial “in‐house” methods
Commercial test kits
Conform to Directive 98/97/EC and carry CE marking
RUOmethods
Not validated for use in patient IVD

5‐6‐2015
5
Laboratory based RAS testing methods
Gel electrophoresis Sequencing
• Temporal temperature gradient • Denaturing gradient• Constant denaturant capillary
electrophoresis SSCP
• Sanger sequencing
• Pyrosequencing
15 ‐ 20%3
5%3
Allele-specific PCR Other• SSCP
• Allele-specific amplification based on primer design(ARMS, REMS, FLAG, RFLP)
• Ligation detection reaction (LDR, LDR spFRET)
• Coamplification at lower denaturation temperature (COLD)
• Hybridization assays
• HRMA (screening)
Limit of detection
0.1 ‐ 1%2
~10%3
Conventional ‘Sanger’ sequencing
PCR
Sequence
KRAS TP53BRAFEGFR
PB1 PB2
Next generation sequencing
PCR
KRASTP53
BRAFEGFR
PCR
Sequence
PB3
PB4

Dias nummer 19
PB1 KRAS & NRAS?Peter Burdon; 09-09-2013
PB2 Commnet: suggest to indicate number of amplicons to be sequenced for each genePeter Burdon; 09-09-2013
Dias nummer 20
PB3 KRAS & NRAS?Peter Burdon; 09-09-2013
PB4 List total number of actionable amplicons?Peter Burdon; 09-09-2013

5‐6‐2015
6
OncoNetwork Consortium: 8 experienced labs
in colon and lung cancer diagnosis
Prof. Orla SheilsTrinity College Dublin, Ireland
Dr. Marjolijn Ligtenberg & Dr. Bastiaan TopsRadboud University
Nijmegen Medical CentreThe Netherlands
Prof. Ian CreeWarwick Medical School United Kingdom
Dr. Cristoph Noppen & Dr. Henriette Kurth
VIOLLIER AG Basle Switzerland
Dr. Nicola NormannoCentro Ricerche Oncologiche
Mercogliano, Italy
Prof. Pierre Laurent PuigUniversité Paris Descartes, France
Dr. Ludovic LacroixInstitut Gustave Roussy Paris, France
Prof. Aldo ScarpaARC-NET University of
Verona Italy
VIOLLIER AG Basle, Switzerland
Alain RicoRosella Petraroli
RAS testing
• A tumour sample is sent to the laboratory for analysis• The test can use fresh, frozen or paraffin-embedded tissue
• A pathologist confirms that the tissue is cancerous and selects test materialse ec s es a e a
• A sample of DNA is prepared for the RAS test
• The polymerase chain reaction (PCR) is used to amplify the DNA sample and test for RAS mutation status
The ESP Colon EQA scheme
ESP/European QA Council
European QA Coordinator for KRAS testing
Regional QA programmes
Centralised QAprogramme
OECD Guidelines for Quality Assurance in Molecular Genetic Testing. http://www.oecd.org (accessed 9/10/2013);
van Krieken JH, et al. Ann Oncol 2013;24:1958–63; van Krieken JH, et al. Virchows Arch 2008;453:417–31.
Participating laboratories
programmes programme
10
ESP EQA schemes for CRC: overview
Scheme GenesNumberof labs
Number of countries
% of labsreported genotypes correctly
KRAS EQA 2009 KRAS 61 9 69%
KRAS EQA 2010 KRAS 76 14 67%
KRAS EQA 2011 KRAS 124 27 72%
Slide courtesy of ESP EQA Group. *only KRAS mandatory24
Q
KRAS EQA 2012 KRAS 105 26 71%
RAS EQA 2013 KRAS/NRAS/BRAF* 131 25 73%
Numericalscoring system
1 point: correct genotype or in case mutation was not screened andidentified as WT
0.5 points: no result given due to low DNA quality or technical failures (since 2012)
0 points: incorrect genotype

5‐6‐2015
7
• 125 laboratories submitted RAS genotype results, 105 also performed BRAF testing (optional):
• 40 labs (32%) made at least one major genotyping error:
• 20 laboratories made 1 major genotyping error (16%), whereas 2 or more
major genotyping errors were made by 20 laboratories (16%)
ESP Colon EQA 2014: results
major genotyping errors were made by 20 laboratories (16%)
• 12 labs (9.60%) reported one or more technical error(s):
• 9 laboratories (7.20%) reported one test failure and 3 laboratories (2.40%)
reported a test failure for multiple samples; 2 laboratories (1.60%) made a
combination of genotyping errors and technical errors.
• 82 labs (65.60%) participated successfully (no major genotyping error and a score on technical evaluation of ≥18/20)
Slide courtesy of ESP EQA Group.
ESP EQA schemes for CRC: overview
Scheme GenesNumberof labs
Number of countries
% of labsreported genotypes correctly
KRAS EQA 2009 KRAS 61 9 69%
KRAS EQA 2010 KRAS 76 14 67%
Slide courtesy of ESP EQA Group. *only KRAS mandatory
**KRAS and NRAS mandatory26
KRAS EQA 2011 KRAS 124 27 72%
KRAS EQA 2012 KRAS 105 26 71%
Colon EQA 2013 KRAS/NRAS/BRAF* 131 25 73%
Colon EQA 2014‐2015
KRAS/NRAS/BRAF** 125 30 66%
Results most recent colon EQA scheme (2014‐
2015)
Type of error Number of labs
% (n=125)
1 major genotypingerror*
20 16%
≥2 major genotyping errors*
20 16%
1 technical failure 9 7.20%
27
≥2 technical failures 3 2.40%
Combination of genotyping and technical errors
2 1.60%
Nomenclature error 33 26.6%
• average genotyping score is 18.06/20 (90.28%). • 82 laboratories (65.60%) participated successfully (no major genotyping error
and a score on technical evaluation of ≥18/20)
• 46 laboratories (36.80%) obtained the maximum score (20/20)
*false positive, false negative, wrong mutation, samples switched, mutation not screened
Country (n=number of participating
laboratories)
Average genotype
score
/20
Average
genotype score
%
Number of labs
successful
% of labs
successful
The Netherlands (n=22) 18.07 90.34% 17 77.27%
Belgium (n=13) 18.12 90.58% 10 76.92%
Austria (n=9) 18.94 94.72% 7 77.78%
France (n=8) 17.06 85.31% 3 37.50%
Denmark (n=8) 18.88 94.38% 6 75.00%
Spain (n=6) 18.42 92.08% 2 33.33%
Sweden (n=6) 18.17 90.83% 4 66.67%
Italy (n=6) 18.58 92.92% 4 66.67%
RESULTS MOST RECENT COLON EQA SCHEME (2014)
prof dr E Dequeker 28
Italy (n 6)
Czech republic (n=5) 19.80 99.00% 5 100.00%
Turkey (n=4) 14.88 74.38% 1 25.00%
Switzerland (n=4) 18.88 94.38% 3 75.00%
Germany (n=4) 19.63 98.13% 4 100.00%
Norway (n=4) 13.38 66.88% 0 0.00%
Slovakia (n=3), Portugal (n=3), Hungary
(n=3), Poland (n=3), Greece (n=2), Israel
(n=2), Japan (n=1), Australia (n=1),
United Kingdom (n=1), Romania (n=1),
Brazil (n=1), Singapore (n=1), Colombia
(n=1), Finland (n=1), Bulgaria (n=1),
Slovenia (n=1)
17.71 88.54% 16 61.54%
TOTAL (n=125) 18.06 90.28% 82 65.60%

5‐6‐2015
8
NSCLC EQA Scheme Genes Number of l b t i
Number of t i
NSCLC EQA scheme
2 pilot rounds in 2012
2014: new biomarker ROS1 included
Increasing nr of partipants and nr of participating countries
prof dr E Dequeker 29
laboratories countries
Pilot ‐ Lung EQA 2012 a ALK 68 22
Pilot ‐ Lung EQA 2012 b ALK, EGFR, KRAS 149 26
Lung EQA 2014, part I EGFR 144 29
Lung EQA 2014, part II ALK, ROS1 139 28
Lung EQA 2015, ALK scheme ALK 157 32
Lung EQA 2015, ROS1 scheme
ROS1 84 19
Lung EQA 2015, EGFR scheme
EGFR 111 25
Scheme Subscheme Number of labs % of labs successful
Pilot Lung EQA 2012 a
ALK FISH 54 72%
ALK FISH Digital* 67 82%
ALK IHC 29 52%
Pilot Lung EQA 2012 b
ALK FISH 104 68%
ALK FISH Digital* 106 74%
ALK RT‐PCR 8 educational
ALK IHC 58 64%
KRAS 92 educational
ESP EQA Schemes for NSCLC: results
prof dr E Dequeker 30
EGFR 107 educational
Lung EQA 2014, part I
EGFR 144 61%
Lung EQA 2014, part II
ALK IHC 96 70%
ALK FISH 116 69%
ALK FISH Digital* 81 educational
ALK RT‐PCR 6 educational
ROS1 IHC 31 90%
ROS1 FISH 56 64%
*In collaboration with UKNEQAS
ESP Lung EQA Schemes: results from 2 pilot rounds in 2012
Subscheme Error rate round 1* Error rate round 2*
Digital ALK
FISH
3,6%
(7 out of
195)
0,5% due to FP 1,1 %
(4 out of
366)
0,8% due to FP
3,1% due to FN 0,3% due to FN
7,3% 0,5% due to FP 5,2% 4,0% due to FP
prof dr E Dequeker 31
ALK FISH TMA (14 out of
193)
(22 out of
423)6,7% due to FN 1,2% due to FN
ALK IHC
13,0%
(30 out of
230)
7,4% due to FP 8,2%
(44 out of
540)
5,0% due to FP
5,6% due to FN 3,2% due to FN
*Error rate = (number of FP + number of FN)/total number of informative resultsFP, false positives; FN, false negatives
• Website• kras.eqascheme.org
• lung.eqascheme.org
• E‐mail• [email protected]
l @k l b
More information

5‐6‐2015
9
Concern!
• Very high level of reliability is needed because of the no harm principle
• Not all laboratories have taken up full RAS testing
• Potential detrimental effect
• Data presented at ECCO
The sensitivity issue
• Technical sensitivity
• Neoplastic cell content
• Clinical relevant sensitivity
RAS testing sensitivity: Comparison between studies
• RASmutation frequency in CRYSTAL is in line with that of other trials applying a
threshold of 5%
Study Starting material Methodology Cut‐off (%)RAS assessable
(n)New RAS mt (n)
Mutation rate (%)
CRYSTAL Extracted DNA BEAMing 5 430 63 15
OPUS Extracted DNA BEAMing 5 118 31 26
Macrodissected specimen
*Exact cut‐off not known, but assumed from technology used Data on fileNGS, next‐generation sequencing
FIRE IIIMacrodissected specimen (>200 cells, >30% tumor content)
Pyrosequencing 5* 407 65 16
PRIMETumor slides (macrodissected if tumor content <50%)
Sanger sequencing,WAVE‐based technology
5–10* 620 108 17
PEAKTumor slides (macrodissected if tumor content <50%)
Sanger sequencing,WAVE‐based technology
5–10* 221 51 23
20020408Tumor slides (not further specified)
NGS 1–5* 165 29 18`
CAPRITumor slides (macrodissectedif tumor content <50%)
NGS 2% 182 29 16
CAPRI‐GIOM Trial – NGS sequencing29 additional mutations found in 182
KRAS exon 2 wild‐type cases:
• Possibly different histology sections
used for new and original analysis
• Limit of detection NGS (2%) vs. SANGER
SEQ (5‐10%)
All dditi l KRAS 2 All additional KRAS exon 2
mutations found with NGS were
confirmed with SANGER Sequencing
or therascreen KRAS RGQ kit
Ciardiello, F. , Normanno, N. et al. (2014). Annals of Oncology. doi:10.1093/annonc/mdu230
underperformance of routine practice underscores need of EQA program and guidelines for RAS‐testing
CONSISTENCY: 84.1%

5‐6‐2015
10
Reproducibility RAS‐testing in NL
CONSISTENCY 97 6%
166 DNA samples from 17 Dutch centers retested at the Radboudumc:
• Only 4 samples were discordant:
• In 3 samples a mutation in RAS was found that was not reported but not tested for
• In 1 sample a mutation was reported that was not found by the Radboudumc
wildtypeKRAS
exon 2KRAS
exon 3KRAS
exon 4NRAS
exon 2NRAS
exon 3NRAS
exon 4 Total
wildtype 87 1 1 1 90
KRAS exon 2 1 58 59
KRAS exon 3 7 7
KRAS exon 4 5 5
NRAS exon 2 1 1
NRAS exon 3 4 4
NRAS exon 4 0 0
Total (%) 88 (53%) 58 (35%) 7 (4%) 6 (4%) 2 (1%) 5 (3%) 0 (0%) 166
Pa
rtic
ipa
tin
g
Ce
nte
r
Radboudumc
CONSISTENCY: 97.6%
Conclusion
• Full RAS testing is mandatory
• Full Ras testing requires in house, non commercial methods
• EQA is important
• Rapid uptake of RAS testing in the Netherlands
• High reliability of RAS testing in the Netherlands
Conclusion
• EQA is important
• High quality testing available in each country
• Collaboration is the way to go• European network for EQA
• Diagnostic versus predicitve?
• Molecular versus protein based?