Embed Size (px)
Citation preview

Journal of Economic Cooperation 20, 4 (1999) 73-106
EXTERNAL DEBT OF THE ISLAMIC COUNTRIES: THE PRESENT
SITUATION AND FUTURE PROSPECTS*
Đlhan Uğurel** The developing countries, which include all the Islamic countries, aspire to achieve rapid economic growth and accelerated development, since both production and consumption levels are very low in them and overall welfare remains much below contemporary standards. Yet, the domestic resources in many of these countries in the form of investible funds and foreign exchange earnings are not sufficient to fully finance these aspirations. As a result, they have to resort to continuous external borrowing at larger amounts, not only to finance their growth and development programmes, but also at times to even sustain their basic needs. Thus, the external debt stocks of the Islamic countries, and the developing countries as a whole, rapidly accumulated into substantial sums, and serious difficulties started to appear in even servicing such large sums. Furthermore, official development assistance flows levelled off and private borrowing sources with higher costs became a necessity. Thus, debt servicing and actual repayment of borrowed external funds became even more difficult, even to the extent of threatening the viability of the international financial system. The present paper analyses the different aspects of the external debt problem of the Islamic countries during the last three decades and puts forth a number of recommendations, not only to help break the present deadlock, but also to pave the way for a more manageable future. A brief look is also taken at foreign direct investment as a possible complementary source for the pressing foreign exchange needs of the Islamic countries.
1. INTRODUCTION Production and consumption constitute the two basic economic activities of human societies. Both are very low in the developing countries. For this reason, all the developing countries are striving to achieve rapid growth and
* An earlier version of this paper was presented as the keynote address to the “Meeting
on External Debt and Foreign Investments: the Situation and Prospects of the Islamic Countries”, organised in Rome, Italy, on 19 November 1998 by the Italian Islamic Cultural Centre.
** Director, Department of Statistics and Information of the Statistical, Economic and Social Research and Training Centre (SESRTCIC) in Ankara, Turkey. The author is fully responsible for the views expressed in the paper, although he is infinitely grateful to Mr. Selim Đlkin for his highly useful comments on earlier drafts and to Mr. Al-Waleed Hamour and Ms. Aslı Güveli for their help with the data used.

74 Journal of Economic Cooperation
accelerated development. Their own resources in the form of investible funds and foreign exchange earnings, however, are not sufficient to meet their growth and development requirements. Consequently, these countries are in constant need for outside resources in one form or another not only to implement their development programmes, but also sometimes even to sustain their basic needs. Grants-in-aid might help to some extent and often only in extreme emergencies, but the countries either have to borrow or be able to attract foreign investors to help them with their growth and development projects and plans. Yet, both the debts incurred and the foreign funds invested have costs attached to them. Not only will the original external funds lent or invested have eventually to be expatriated to their rightful owners, but interest on borrowed funds and a certain return on foreign investment will also have to be paid to the parties concerned.
In the light of the experience of especially the 1980s and 1990s, it is observed that only a handful of the developing countries that borrowed extensively from outside could achieve rapid growth and realise quantum leaps in development. Furthermore, as a result of these achievements, they have attained a status whereby they not only have very little difficulty in borrowing (even in private markets), but they also constitute attractive destinations for foreign investment.
The majority of the developing countries, however, were not that successful. While they were falling in arrears on their repayment obligations on account of a complex set of national and international factors, they continued to borrow even larger amounts. So much so, that the world has come face to face with the present crisis situation that threatens more than just these countries.
This presentation will concentrate on the present state and future prospects of external debts of a sub-group of developing countries called the Islamic countries. A brief review of foreign direct investments will also be included in the end to gauge the prospect of such flows constituting at least a complementary source of foreign exchange for these countries. First, however, it would be useful to give some background information about the countries in question and the Organisation of the Islamic Conference that has kept them together for three decades.
2. BACKGROUND ON ISLAMIC COUNTRIES For the purposes of this paper, the Islamic countries are defined as the 56 members of the Organisation of the Islamic Conference (OIC). The OIC was

External Debt of the Islamic Countries 75
established in 1969 and has developed, on its thirtieth anniversary, into the second largest International Organisation after the UN. Its General Secretariat is situated in Jeddah, Kingdom of Saudi Arabia.

76 Journal of Economic Cooperation
The OIC Foreign Ministers meet annually, while the OIC Summit Conferences are held every three years. The regular agenda of the Foreign Ministers contains over 140 items, close to 50 of them relating to subjects of common interest in the economic and commercial areas, including those in technical co-operation, science and technology. The OIC has also three specialised standing committees in the areas of economic and commercial co-operation, culture and information and science and technology under the OIC Summit. A Head of State chairs each committee. The three committees meet regularly at the ministerial level.
The OIC has an extensive organisational structure modelled after the UN and made up of a number of subsidiary, specialised and affiliated institutions located in various countries. Established in 1975, the Islamic Development Bank finances trade among member countries and development projects in the Muslim world, and undertakes technical assistance and technical co-operation activities in support of especially the less developed and more needy among its membership. It has a capital of around eight billion dollars.
The OIC has also developed over the years a number of multilateral co-operation agreements and have put most of them into effect. They are in such areas as overall economic co-operation, protection and guarantee of investments, trade preferences, and the like. It has recently reviewed and reformulated its ten-sector Plan of Action to Strengthen Economic and Commercial Co-operation among the Member Countries. Initial implementation meetings on three of these sectors have already been held. The Plan encourages the proposal and implementation of specific projects in the ten sectors among interested member countries.
The member countries of the OIC are dispersed over four continents (26 in Africa, 26 in Asia, two in Europe and two in South America). They cover one fifth of the total land area of the world and house one fifth of its population. Many of them have gained independence quite recently, following years of subjugation as colonies, semi-colonies, administered territories, etc.
All OIC members are developing countries. While 13 of the 56 member countries are considered petroleum-exporting countries, 21 have been officially designated as Least-Developed Countries by the UN, and were accorded special treatment by the international organisations. Yet, at least another 10 could easily be included in this latter category if criteria besides per capita GDP were to be applied in this designation. The remaining 12 countries are middle-income countries. They include some extraordinary achievers in

External Debt of the Islamic Countries 77
terms of growth and development, at least until the outbreak of the latest crisis in East and Southeast Asia.
78 Journal of Economic Cooperation
Consequently, the OIC membership brings together a heterogeneous group of countries made up of some of the poorest and richest countries of the world in terms of per capita income. This figure varies from $86 in Mozambique to $17,000 in Brunei. The prospects for improvement in the lot of the OIC countries as a group are not that great either, because they fare worse than the overall group of developing countries in per capita growth as can be seen in the following table:
REAL PER CAPITA GDP GROWTH RATES IN OIC COUNTRIES (Average annual, in per cent)
1993 1994 1995 1996 1997
Total OIC countries 1.9 -0.3 1.5 2.7 2.0
Developing countries 4.5 4.5 4.2 4.5 4.0
Developed countries 0.6 2.5 1.8 1.9 2.4
Source: SESRTCIC, Annual Economic Report on the OIC Countries 1998, December 1998.
Given this state of affairs, it is not surprising that many of the OIC
member countries experience large gaps in the area of basic needs, low levels of income, backward technologies, lack of diversity in production, etc.
Although all of the OIC countries are developing countries, there are also large differences among them in terms of size, population, development levels, human and natural resource endowments, growth and trade potentials, economic structures and performance, levels of integration into the world economy, etc.
On the other hand, they jointly command substantial portions of the world’s existing resource endowments in oil, certain key minerals, cultivable land and output of a number of important raw materials and basic commodities. Furthermore, they represent a very large actual and an even larger potential market for all sorts of goods and services.
Despite their many shortcomings, all of the OIC countries have, understandably, been aspiring for rapid economic development to help increase incomes and boost overall welfare in their countries so that they could become a part of the contemporary world. Yet, their own resources and incomes are not enough to provide them with the necessary investments. Thus, as was the case with the developing countries as a whole, since they were

External Debt of the Islamic Countries 79
unable to save enough to realise their development programmes, they started to borrow.
Yet, only a few among them were able to place these funds into productive endeavours. In the case of many, external funds quite often had to be used to import basic human necessities. Most had no other choice but to continue to borrow, although they found it more and more taxing even to pay the interest on the debts they already owed. Consequently, the debts of the developing world rapidly accumulated and the issue eventually reached the proportions of a global crisis that threatened even the world economic and financial system. Before going into the details of the problem, however, it would be useful to review briefly the debt problem of all of the developing countries, of which the OIC countries constitute a proper sub-group.
3. FOREIGN DEBTS OF DEVELOPING COUNTRIES The global economic and financial circles have become increasingly concerned in recent years with the problem of the external indebtedness of the developing countries, especially the non-oil ones among them, as well as a number of individual countries, as the size of the total figure involved kept rising rapidly. The situation became acute during the early 1980s, when the external obligations of some of the large borrowing countries exceeded their capacity for repayment, and debt-servicing difficulties set in. Thus, debt rescheduling became a necessity for an increasing number of debtor countries as an attempt to stave off the imminence of a world-wide debt crisis. 3.1. Debt accumulation and increasing debt burdens for developing
countries The total long-term foreign debt of developing countries continued to grow and accumulate during the 1970s and 1980s, expanding from $62 billion in 1970 to $445.3 billion in 1980. With the addition of short- term debts and IMF credits, the latter figure for this group of countries reached above $603 (Table 1). This was twice the export earnings for the whole group. By 1990, the total debt figure for the developing countries had reached $1444 billion and the trend continued to reach above $2095 billion in 1996. The estimate for 1998 stands at a little over $2465 billion. So, the total indebtedness of the developing countries in 1998 was almost 40 times what it was in 1970. Growth was almost tenfold in the 1970s, 2.4 times in the 1980s and higher by 70 per cent since 1990. Although one should remember that the number of independent countries increased considerably, especially in the 1970s, and

80 Journal of Economic Cooperation
continued to do so afterwards, these are still very large figures, and the growth rates involved are phenomenal.
The great leap in the foreign debt stock and the steep increase in interest rates pushed the total debt service from $10 billion in 1970 to $91.2 billion in 1980, $160.3 billion in 1990 and $261.8 billion in 1996, with an amount of $296.1 billion being estimated for 1998.
Such rapid accumulation of external debt and the steep increases in debt service payments made the debt burden so great for many of the debtor countries in the developing world that many of them came very close to defaulting on their external obligations. This development spelled serious trouble particularly for the private creditors, the banks. They were facing serious liquidity shortages, leading possibly to insolvency, and threatening the whole of the international financial system.
In terms of the basic components of the total debt, Long-term Debts jumped from around 74 per cent in the 1980s to above 80 per cent in 1990 and remained at that level ever since, with minor annual fluctuations. Short-term obligations of the developing countries, on the other hand, moved around the 17-18 per cent mark during that period from the much higher shares of about 25 per cent prior to the crisis (Table 1). IMF credits, meanwhile, showed a steady upward trend from below 2 per cent to close to 4 per cent in 1998. Within the long-term debts, the share of private, non-guaranteed debt dropped to the 5-10 per cent range in the early 1990s, as compared to the higher figures of the previous decade. But thanks to the increasing amounts of the private credits being extended to the rapidly developing East and South East Asia particularly, this share went up to almost 13 per cent in 1998. One can easily see that there would be a dramatic change in this picture in the aftermath of the recent crisis.
The basic point here is that the majority of the developing countries depend on official or officially guaranteed loans. Only the relatively more developed among them have a chance to borrow from private sources. It is understandable why total net lending to developing countries by the non-official sector (including short-term flows) would decline in a crisis situation. It is similarly clear why the shift in private lending from large positive to negative flows was particularly marked in Western Hemisphere countries and in Africa. It would not be too surprising if a similar picture should emerge in the Asian countries in the next few years: Private lenders are not only profit seekers, but they are also risk averters.
External Debt of the Islamic Countries 81
A complex set of factors caused the precipitation of the debt crisis, when many developing countries’ debt obligations started to surpass their capacities to procure the necessary foreign exchange resources to meet them. The major ones among these factors can be enumerated as: the large increases in oil prices, the falling export earnings, the increases in the real interest rates and the growing difficulties in foreign borrowing, as well as inefficiencies in the utilisation of the funds actually received. We shall provide some more details on these factors later on when we discuss the case of the Islamic countries.
4. FOREIGN DEBTS OF ISLAMIC COUNTRIES 4.1. Islamic countries and the debt crisis Islamic countries being a part of the Third World, the debt crisis projected a similar picture as above for a large number of them as well. This section looks into the position of the indebted Islamic countries to identify and assess their foreign debt problems in some detail and put forth a number of recommendations.
International economic and financial developments that led to the current state of the foreign debt problem affected most of the OIC members since, as capital-deficit countries, they, like other developing countries, have been facing rapidly-growing debts as a result of the same adverse developments. 4.2. Reasons for debt accumulation and its implications The external debt of the Islamic countries accumulated rapidly simply because they needed increasing amounts of foreign exchange to pay for their ever-growing imports while their earnings from exports of goods and services continuously lagged behind. This created a growing foreign exchange gap, which had to be closed by borrowing larger amounts from abroad. Yet, soon the debts thus accumulated created an additional need for foreign resources besides those needed for the growing imports: debt-service payments. With lagging export earnings and substantially exhausted international reserves, the foreign exchange gap became larger every year and, thus, more had to be borrowed than before.
A number of intricate causes underlay this façade of direct factors. The foreign exchange gap continued to widen basically because of the divergence between the national development aspirations and needs of the debtor countries and their ability to generate the means to fulfil such aspirations and needs through the workings of their national economies due to various
82 Journal of Economic Cooperation
structural shortcomings. These include, among many other gaps, defects and shortages that cripple domestic economies, natural resource shortages, inefficiency in production, technological backwardness, infrastructure problems and small markets.
As a result, from the very start of the development process, a typical underdeveloped economy had to interact with and become dependent upon other economies, particularly the industrial giants of the world, for almost everything. This dependence quickly expanded into finance due to the ever-present problem of the lack of domestic capital in large enough amounts to support the growth and development process in most of the Islamic countries. It was then a short and direct route to expanding foreign exchange gaps and rapidly accumulating debts. So the deep-lying and chronic structural defects started the foreign exchange gap and quickly built it up into the vicious circle of external indebtedness. They are visible in the widely contrasting import and export compositions of the developing countries, the insufficiency of domestic supply to meet the growing overall demand, the limited state and extent of basic and intermediate industries, the insufficient quality of the methods and technology used in production, the underdeveloped state of infrastructure and the overall economic environment, inefficient markets and many more. All of these factors act to limit the generation in sufficient amounts of the desperately needed foreign exchange resources. In contrast, the import demand continued to expand by leaps and bounds. Since the same structural defects and shortcomings acted to keep the international reserves as well limited, the only option left was to borrow externally and continue to do so at an increasing rate. Thus, in addition to becoming burdened with rapidly rising and accumulating foreign debts, these countries became more and more susceptible to the vagaries of international economy and global finance. Namely, (a) The unabated rise in the prices of manufactured goods, oil and foodstuffs
expanded the import bills of the debtor Islamic countries. (b) Meanwhile, the prices of exports of these countries have decreased almost
continuously due to the fall in the price of primary commodities world- wide, thus pulling down these countries’ export earnings.
(c) Furthermore, the demand for the exports of these debtor countries failed
to grow on account of the global recession caused mostly by that in the industrially developed countries.

External Debt of the Islamic Countries 83
(d) Thus, these two developments acted together to depress the volume of the foreign exchange earnings of the debtor countries.
(e) In the area of finance, on the other hand, official credits became more
difficult to obtain, particularly from the governments of the industrialised countries. Here, mention should be made of the fact that the large political attention focused by the industrialised countries on the needs of the countries that emerged after the collapse of the Soviet Union has had a contractionary effect on resources that were previously made available much more easily and in greater amounts to the Islamic countries and the Third World in general.
(f) As a consequence, most of the Islamic countries started to borrow in
larger amounts from private financial markets at less lenient terms, which, in turn, increased the debt-service payments on newer credits.
Although it is generally believed that developing countries seek external
credits mainly to finance the imports needed by their development programs and their debt-service payments, there is considerable evidence that the Islamic countries, like some other developing countries, borrowed also to finance imports for consumption, whenever export earnings were not sufficient to pay for these needs. 4.3. External debt situation of the Islamic debtor countries The total outstanding external debt of the OIC debtor countries, as a group, grew quite rapidly during the 1970s, although one fourth of the membership, the oil exporters, were having a very different experience in those years on account of the oil shocks that rocked the whole world. By 1980, nevertheless, the total debt stock of these countries came to $153 billion and rose by close to 160 per cent during the next decade to reach $394 billion (Table 2). The expansion continued until 1994 ($495 billion) at an average annual rate of around 6 per cent. There was a big drop to $456 billion in 1995 and a tapering off to $454 billion in 1996. Yet, in 1997, there was a 25 per cent jump to above $567 billion. The share of the OIC group in the total debt of the developing countries as a whole showed a slow and steady decline during the 1990s from 27.2 per cent (in 1990) to 24.5 per cent (in 1997). This decline is likely to continue, but this would only mean that the accumulation in the total debts of the larger group is faster than that of the OIC countries.
Although the four largest OIC debtors, Iraq (due to the Gulf War), Indonesia, Turkey and Algeria, account for almost 50 per cent of the total OIC

84 Journal of Economic Cooperation
debt and none of these is likely to experience much difficulty in debt servicing, it would be too rash to be optimistic about the OIC group. This is because of the Islamic LDCs (LDICs). They officially number 21 out of 56 OIC countries and there are around 10 other countries that are right above the boundary line and equally poor. Their total debt figure jumped from $17.6 billion in 1980 (11 per cent of total OIC debt) to almost $58 billion in 1990 and slowly climbed up to $67.7 billion in 1994. It stands close to $65 billion in 1997 (Table 2), which is 11.4 per cent of the total OIC debt and it makes about $3 billion per country on average. The latter average does not look insurmountable, yet, these are small countries with very weak economies and the debt crisis is most serious for them. Their resource endowments and borrowing possibilities are quite limited, which makes debt servicing very difficult.
To get a better idea of the crippling dimensions of the total accumulated debt of the OIC countries, one can look at two key ratios: the percentages of Total Debt Outstanding to Gross National Product and to Total Exports of Goods and Services. It is observed that in terms of the first ratio, the total OIC figure was 36 per cent in 1980, but has jumped substantially in the 1990s to 72 per cent in 1995 and came down to 51.6 per cent in 1997 (Table 3). This means that all the Islamic countries will have to allocate a little more than six months’ worth of their annual combined income to clear their total accumulated outstanding debt. The corresponding figure is 35 per cent in the case of all of the developing countries taken together. Yet, this percentage is much higher for some of the ICs taken individually. For quite a few, it even reaches three digits. Thus, for Mozambique, for instance, the figure fluctuated between 257 and 457 per cent.
Since the main potential source through which the debts could be paid is export earnings, the ratio of Total Outstanding Debt to Exports is a good general indicator of the ability to repay. The actual percentages here are several multiples of those in the previous ratio as would be expected. The OIC total varies between 200 to 244 per cent during the 1990s, although it was 170 per cent in 1980 (Table 4). The comparable figures for the whole of the developing countries are again lower, and those about the Least-Developed Islamic Countries are again multiples of the OIC group values. In the case of the individual countries, one can observe percentages even in four digits. A figure like 2562 for Guinea-Bissau in 1997, for example, means that the total accumulated debt of that country was more than 25 times the total exports in that year. This requires no further explanation as an indication of the gravity of the situation.

External Debt of the Islamic Countries 85
4.4. Servicing the debt The debtors are expected to repay every year a part of the principal of each loan borrowed plus the interest. It is observed that while the total debt service payments by the Islamic countries were close to $20 billion in 1980, they climbed to well above that level in the 1990s: the lowest level being almost $43 billion in 1990 and the peak level of above $69 billion having been reached in 1997 (Table 5). Yet, the debt servicing capability of countries is rarely evaluated in terms of absolute amounts. The most commonly used measure in this connection is the ratio of total debt service (TDS) payments to exports. For all of the OIC countries, again, there was an increase in this percentage from 17 per cent in 1980 to 26 per cent in 1990, and the figure declined almost continuously to around 21 per cent in 1997 (Table 6). The same was true for the Least-Developed Islamic Countries, but, interestingly, the percentages were considerably lower (11 to 20 per cent) than those for the whole OIC group throughout the 1990s. On the other hand, this figure for all of the Developing countries was a near constant at 17-18 per cent during the 1990s, although it was 13 per cent in 1980. Meanwhile, the TDS/GDP ratio shows the annual cost of debt servicing in terms of the output forgone.
One may note that, as far as the debt-service payments are concerned, the burden carried by the ICs is undoubtedly less heavy than that carried by the severely indebted countries owing to a combination of debt rescheduling and the forgiveness of official development assistance loans. For a few countries, the ratios are very low because debts are not being serviced. For many other countries, the ratios are low because of debt relief. Yet, a number of Islamic countries have had Total Debt Service/Exports ratios above 20 per cent despite debt relief.
The international reserves of a country are made up of the country's savings (gold and convertible currencies and the IMF special drawing rights). As acceptable means of payment for foreign creditors and exporters, they can be used for financing external debt-service payments as well as imports. The ratio of the international reserves of a debtor country to its external debt shows the country's external position. These ratios were high for 1980-81 for the whole group, because they included the oil exporters (Algeria, Indonesia, Malaysia, Nigeria and Oman). As oil prices declined, so did the said ratio for these countries. Turning to oil-importing countries, one can observe low ratios for especially some of the Least Developed Islamic countries, which brings the LDIC average below that for the whole of the OIC (Table 7).

86 Journal of Economic Cooperation
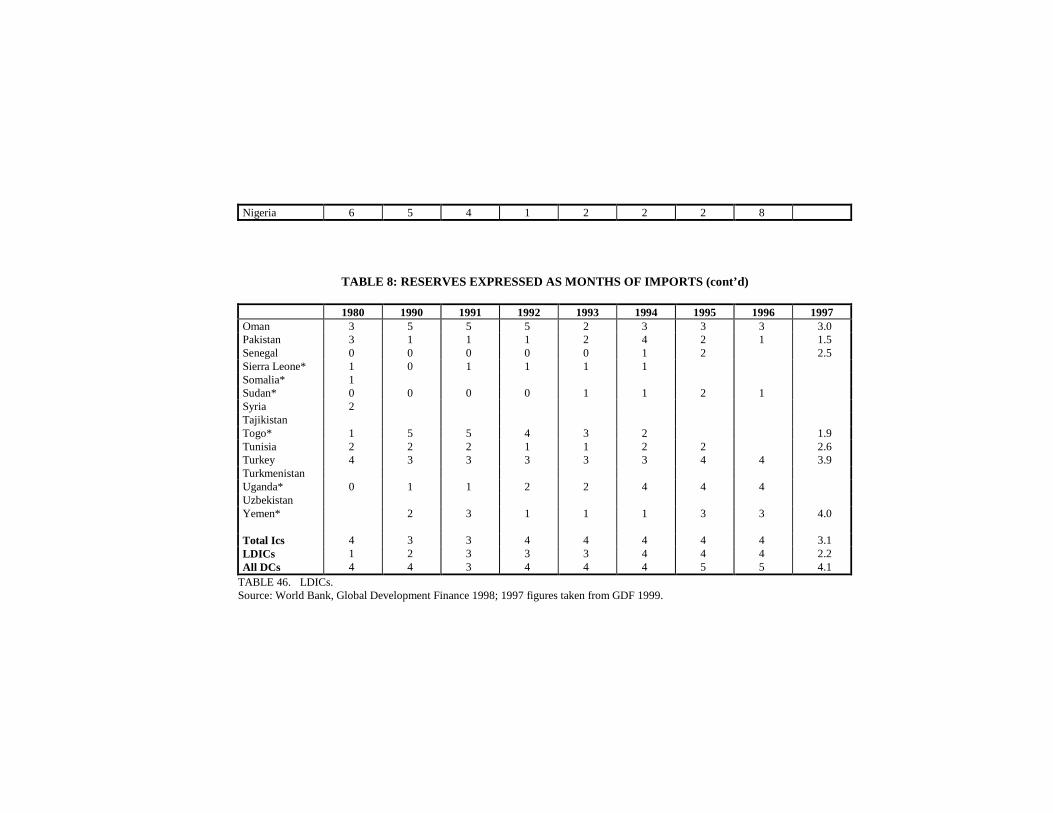
As a means of external payment, the ratio of international reserves to the value of imports measures the extent to which the country can finance its imports during the year. If one divides the Reserves/Imports over twelve months, it can be seen that the international reserves of the Islamic countries have been enough to pay for imports of only a few months during most of the past years (Table 8). In some countries, international reserves were not enough to pay for imports of even two months. Partly because of the increases in the external payments by these countries, international reserves fell to such low levels. Also, because of this, most of these countries have become almost totally dependent on their exports and foreign borrowing.

External Debt of the Islamic Countries 87
4.5. Foreign investments as an additional recourse for drawing foreign exchange
We have studied Foreign Borrowing as a major recourse for the developing countries to procure additional resources for their pressing growth and development needs. We have also seen, however, that with the alarmingly high levels of the accumulated debts of many of these countries, foreign borrowing has become more difficult and costly in different ways. To complete the picture, we should also look into foreign investments as yet another potential source that could accommodate, at least in part, the growth and development requirements of the Islamic countries.*
Foreign investment flows comprise Foreign Direct Investment (FDI) and Portfolio Investment (FPI). The total value of the World FDI outflows in 1996 is estimated at $318 billion, with $268 billion or 84 per cent of this total emanating from the OECD countries (27 per cent of it from the US). The breakdown by products of OECD FDI outflows shows that services is the leading sector with 55 per cent, followed by manufacturing with 37 per cent and the primary sector with 8 per cent. The OECD countries are also responsible for $205 billion of the total FDI inflow (65 per cent). The total FDI stock, meanwhile, stood at $3500 billion, having risen from $650 billion in 1985.
The OIC countries account for about $15 billion or 5 per cent of the world FDI inflows. Of this amount, the EU is supplying 37 per cent (to Turkey, Indonesia, Malaysia, Iran, Egypt and Morocco), the USA 34 per cent (to Malaysia, Indonesia, Saudi Arabia and the UAE) and Japan 23 per cent (to Indonesia, Malaysia and Turkey).
In Portfolio investments, the OIC countries account for 2 per cent of the world outflows (Saudi Arabia, Turkey and Kuwait) and 0.86 of inflows (to Indonesia and Turkey).
In terms of the net FDI flows [inflow(-)outflow], the largest part of these flows are accounted for by seven or eight middle-income countries, with the Least-Developed Islamic Countries appearing at the bottom of the scale, as would be expected.
From 1990 to 1996, there was, on average, a slightly rising trend in the net FDI flows for the majority of the OIC countries, yet these flows peak earlier (in 1992-1994) in the case of some of the largest FDI takers (Table 9).

88 Journal of Economic Cooperation
FDI flows among the OIC countries themselves are quite limited, with the main suppliers being Saudi Arabia, Malaysia, Kuwait and the UAE.

External Debt of the Islamic Countries 89
As far as intra-OIC investments are concerned, it can be observed that, despite the lack of sufficient information, the total FDI flows are around $3 billion, which is very low given the potentials. The target sectors are services with 48 per cent, followed by manufacturing (44 per cent) and agriculture (8 per cent). In this regard, there is no difference between the OECD pattern of FDI and the intra-OIC pattern. 4.6. Factors impeding foreign investments and issues relating to their
removal The impediments to foreign investment in the OIC countries are well known: the small size of the domestic markets and the low world market share; inefficiency, lack of transparency and stability of investment policies and regulations; financial and monetary obstacles; lack of infrastructure and the high cost of certain factors of production; economic and political instability; and lack of promotional activities and information on investment opportunities.
As regards the legal and institutional agreements governing foreign investment, it is observed that the existing inter-governmental arrangements comprise a panoply of bilateral, regional and multilateral instruments that differ in terms of their legal nature, scope and objectives.
There are some 1630 bilateral investment treaties (BITs), but the bilateral approach is less than ideal in a rapidly integrating world economy, and most BITs are limited to the protection of investments after they are made. The result of a bilateral approach will always yield a number of different outcomes and, hence, a lack of coherence, considerable uncertainty and the potential for international friction. Regional agreements, such as NAFTA, that include investment provisions, represent a major advance but are necessarily partial in their geographic coverage. The OECD instruments are not all binding or comprehensive, and they lack effective dispute settlement mechanisms. At the same time, the global competition for capital has intensified, and while market factors are, of course, the primary determinants of investment decisions, stable and responsible investors are seeking long-term stability of rules and procedures.
These considerations have led the governments of the OECD countries to conclude that the global economy has reached the stage where international investment rules can and should begin to be multilateralised. They have proposed a Multilateral Agreement on Investment (MAI) and kept it under negotiation at the OECD since 1995. It was conceived as a treaty that will lay

90 Journal of Economic Cooperation
down internationally agreed standards for the treatment of foreign investors and investments, combining for the first time into a single multilateral instrument the three principles of investment rule-making: protection, liberalisation, and dispute settlement. The ultimate objective of the MAI was to encourage high-quality international investment, thereby contributing to development and prosperity. Yet, the recent information is that the negotiations have been stopped.
Even if the MAI had been agreed upon and implemented, it would not have altered the fundamental market determinants of foreign investment patterns but would have contributed to the reduction of the risks of investing, even if the return from that investment did not change. The information costs of investing would also have been reduced by providing investors with a standard framework for assessing the openness -- and hence investment opportunities -- in each country. Finally, it would also have lent credibility to the home country authorities’ commitment to reform and transparency in the eyes of foreign as well as domestic investors.
Any future initiative on the part of the big investors, similar to MAI, would always be of concern to a large number of developing countries regarding the extent of liberalisation required and the degree of policy flexibility which will remain to apply discriminatory policies in the interests of development, i.e. to keep foreign investors out of some sectors of the economy and, in other sectors, make market access conditional on the fulfilment of certain performance criteria. So any such arrangement in the future would do well to offer, as MAI did, considerable flexibility in these areas through a list of exceptions and through the rules applying to performance requirements. Yet, at the same time, it bears asking whether such flexibility would actually serve the interests of development. Developing countries would be wary of the establishment of any MAI-like arrangement on the grounds that it will not be trade-related, but eventually turns out to be a classical package for protection of foreign investment.
5. CONCLUSIONS AND RECOMMENDATIONS The external debt of the Islamic developing countries in particular, and the developing countries in general, has been rapidly and continuously accumulating since the late 1970s. The situation threatened to develop into an international crisis relatively recently, as many of the debtor countries, including the small ones started to encounter serious debt-servicing difficulties. This, in turn, brought their external creditors, the banks, face to face with liquidity problems verging on possible insolvency.

External Debt of the Islamic Countries 91
Faced with the recent downward trends in the inflow of official
development assistance, most of the Islamic countries increased their borrowings from private sources, namely commercial banks, on shorter terms and higher costs. Since these funds were borrowed to finance longer-term development projects, debt accumulation accelerated. Their dependence on foreign trade and external borrowing, on the one hand, and their concomitant susceptibility to external developments and disturbances emanating from the developed industrialised countries, on the other, thus grew.
Although the number of debt scheduling cases increased in recent years, they remained mostly ineffective. They were not only applied in an ad hoc manner, but also on a case-by-case basis, and they were mostly set up as arrangements to relieve extreme cases of liquidity shortage by spreading the debt burden over a longer period and providing new loans to the countries concerned. Furthermore, the conditions attached to these arrangements, made basically of austerity programmes for adjustment, rarely pay due consideration to the social and political realities in the debtor countries and their longer term growth and development aspirations. The emphasis in these arrangements is on generation of export surpluses so that the external debt of the country concerned could be serviced properly. There is little guarantee that the debt problem would be solved in the long run.
More fundamental action, rather than ad hoc arrangements with a limited optique that aim to buy time, would be needed to turn the tide on the debt crisis and bring it to an eventual and lasting solution. There is even a considerable risk that the present policies and arrangements involving rescheduling, with their stringent conditions, might eventually prove counter-productive for the debtor countries, since the original structural defects and other fundamental issues would not only remain untouched, but may even be exacerbated on account of the piecemeal and ad hoc arrangements being applied. A new alternative approach that would take into account the following would be needed: (a) The debt crisis should be viewed as something much more than a
liquidity problem. Taken also as an issue of equality: distributing equitably the responsibility and the costs between the debtors and all the creditors, public or private.
(b) Assistance programmes and arrangements for the benefit of the debtor
developing countries should support economic growth and export

92 Journal of Economic Cooperation
expansion in these countries in order to allow them to rebuild and promote their debt repayment capacities.
(c) Through guarantees and other instruments, creditor countries must
help debtor countries secure the resources needed to service their debts, obtain new funds (commercial bank loans, official bilateral lending, multilateral lending through the IMF, the World Bank and the regional development finance institutions) that will ensure higher growth rates and sufficient imports and obtain debt relief at lower interest rates than the current ones.
(d) Rescheduling arrangements should be enlarged in scope, with longer
maturities and grace periods, supported by fixed or capped interest rates.
(e) Direct foreign investment should be encouraged through support
measures to be applied by both developing and industrial countries in a mutually acceptable framework.
(f) The terms of reference of the international financial institutions
(especially the IMF and the World Bank) should be revised and their resources increased substantially. This would allow them to play a much more active and enlarged role in resolving the debt problem and in meeting the financing needs of developing economies in a long-term framework.
(g) The industrial countries should provide more substantial support to the
borrowers in their efforts to obtain proper debt relief at rates much more manageable than the current ones. They should also increase ODA to developing countries at much lower interest rates than presently effective and reduce the protectionist measures against the exports of the debtor countries.
(h) The OIC countries, on the other hand, should promote interregional
co-operation and economic integration amongst themselves and readjust or co-ordinate development strategies accordingly, while they make every effort to provide sufficiently effective incentives for interregional flows of capital, including private direct investment.
(i) They should also design and diligently implement substantially
improved policies of their own that would ensure better mobilisation of domestic resources, more efficient use of these resources, much

External Debt of the Islamic Countries 93
improved fiscal balances, more realistic exchange rates and better management of external debt.
REFERENCES Cline, W. R., International Debt and the Stability of the World Economy, Institute for International Economics, Sept., Wash., D.C., 1983. Cline, W.R., International Debt: Systematic Risk and Policy Response, Institute for International Economics, Wash., D.C., 1984. Elaian, S., “External Debt in Islamic Countries”, in T. M. Klein (editor), Managing External Debt in Developing Countries, Proceedings of a Joint Seminar, Jeddah, May 1990, The World Bank, Wash. D.C., 1992. Husain, I., Underwood, J., African External Finance in the 1990s, The World Bank, Wash., D.C., 1991. Hzaine, El Hassane, “Investment in OIC Member Countries”, presentation made during the Workshop on Intra-OIC Trade and Investment and Economic Stabilisation and Structural Adjustment Reforms in OIC Member States, 30 September-2 October 1998, Casablanca, Morocco. Klein, T. M. (editor), Managing External Debt in Developing Countries, Proceedings of a Joint Seminar, Jeddah, May 1990, The World Bank, Wash. D.C., 1992. Nikbakht, E., Foreign Loans and Economic Performance: The Experience of the Less Developed Countries, Praeger Publishers, New York, 1984. SESRTCIC, Annual Economic Report on the OIC Countries 1998, December 1998. World Bank, Global Development Finance: Country Tables, Wash. D.C., 1998.
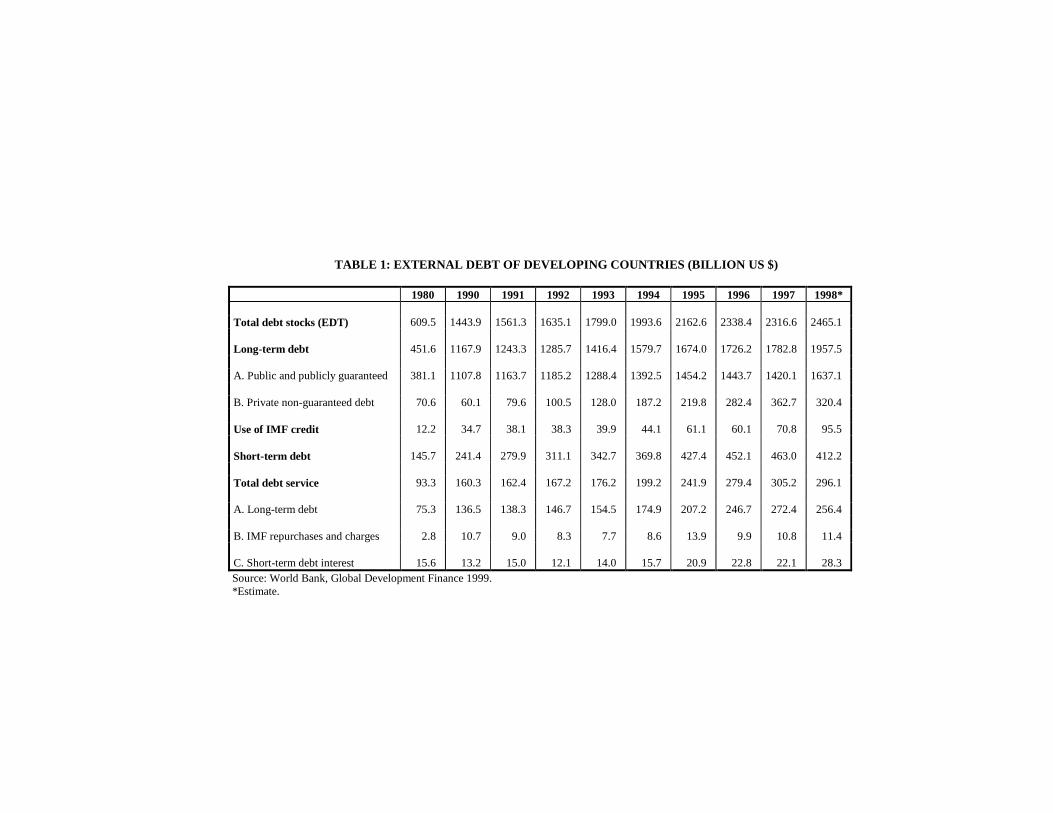
TABLE 1: EXTERNAL DEBT OF DEVELOPING COUNTRIES (BIL LION US $)
1980 1990 1991 1992 1993 1994 1995 1996 1997 1998* Total debt stocks (EDT) 609.5 1443.9 1561.3 1635.1 1799.0 1993.6 2162.6 2338.4 2316.6 2465.1 Long-term debt 451.6 1167.9 1243.3 1285.7 1416.4 1579.7 1674.0 1726.2 1782.8 1957.5 A. Public and publicly guaranteed 381.1 1107.8 1163.7 1185.2 1288.4 1392.5 1454.2 1443.7 1420.1 1637.1 B. Private non-guaranteed debt 70.6 60.1 79.6 100.5 128.0 187.2 219.8 282.4 362.7 320.4 Use of IMF credit 12.2 34.7 38.1 38.3 39.9 44.1 61.1 60.1 70.8 95.5 Short-term debt 145.7 241.4 279.9 311.1 342.7 369.8 427.4 452.1 463.0 412.2 Total debt service 93.3 160.3 162.4 167.2 176.2 199.2 241.9 279.4 305.2 296.1 A. Long-term debt 75.3 136.5 138.3 146.7 154.5 174.9 207.2 246.7 272.4 256.4 B. IMF repurchases and charges 2.8 10.7 9.0 8.3 7.7 8.6 13.9 9.9 10.8 11.4 C. Short-term debt interest 15.6 13.2 15.0 12.1 14.0 15.7 20.9 22.8 22.1 28.3 Source: World Bank, Global Development Finance 1999. *Estimate.

TABLE 2: TOTAL EXTERNAL DEBT FOR ISLAMIC COUNTRIES (MILLION US $)
1980 1990 1991 1992 1993 1994 1995 1996 1997
Albania 348.6 511.5 638.8 831.8 925 599.1 672.5 706 Algeria 19365 27858.0 28124.0 27083.0 26033 30167 30991 30808 30921 Azerbaijan 35.5 112.8 206.1 244.9 504 Bangladesh* 4056 12757.0 13470.0 13898.0 14619 16223 15471 15403 15125 Benin* 417 1224.0 1364.0 1407.0 1479 1636 1483 1449 1624 Burkina Faso* 334 834.0 968.0 1040.0 1115 1128 1136 1160 1297 Cameroon 2513 6679.0 6898.0 7349.0 7452 8254 8258 8184 9293 Chad* 218 530.0 634.0 728.0 771.3 824.8 833.3 913.7 1027 Comoros* 44 184.7 179.9 188.0 184.4 188.7 190.3 192.9 197 Djibouti* 31.8 206.3 192.2 192.5 225.4 246.9 226.4 226.2 284 Egypt 20384 32551.0 33026.0 31573.0 31109 33039 30900 29045 29849 Gabon 1513 3967.0 4177.0 3803.0 3818 3967 3990 3874 4285 Gambia* 137 369.0 383.0 403.4 425.4 421.3 384.3 412 430 Guinea* 1117 2469.0 2615.0 2643.0 2848 3108 2987 2981 3520 Guinea-Bissau* 132 668.4 718.9 727.6 802.4 858.7 796.6 856.2 921 Indonesia 20944 69955.0 79548.0 88004.0 89148 96543 98432 96803 136174 Iran 4500 9020.0 11332.0 16033.0 23362 22712 17446 16153 11816 Jordan 1977 8184.0 9553.0 7819.0 7501 7606 7070 7182 8234 Kazakhstan 35.0 1724 2670 2882 2147 4278 Kyrgyzstan 0.6 294.3 449.7 478.3 640.3 928 Lebanon 510 1779.0 1554.0 1807.0 1347 1718 1601 2343 5036 Malaysia 6610 16421.0 18155.0 20024.0 26148 29537 27059 28708 47228 Maldives* 26 78.0 81.2 95.0 112.3 124 151.9 162.6 160 Mali* 733 2478.0 2590.0 2623.0 2656 2796 2739 2776 2945 Mauritania* 845 2140.0 2236.0 2138.0 2174 2329 2048 2073 2453 Morocco 9678 23532.0 21139.0 21273.0 20687 21587 22445 21165 19321 Mozambique* 4474.0 4725.0 5138.0 5209 5651 5270 5476 5991 Niger* 863 1793.0 1565.0 1580.0 1614 1566 1478 1460 1579

Nigeria 8934 33440.0 33527.0 29019.0 30699 33519 28441 25731 28455
TABLE 2: TOTAL EXTERNAL DEBT FOR ISLAMIC COUNTRIES (MILLION US $) (cont’d)
1980 1990 1991 1992 1993 1994 1995 1996 1997 Oman 599 2736.0 2901.0 2855.0 2657 3085 2640 2649 3602 Pakistan 9941 20661.0 23046.0 24911.0 24518 27342 25401 25690 29665 Senegal 1469 3731.0 3554.0 3634.0 3766 3659 3217 3142 3666 Sierra Leone* 430 1155.0 1303.0 1313.0 1452 1532 906 892 1149 Somalia* 660 2370.0 2449.0 2447.0 2501 2616 1961 1918 2561 Sudan* 5163 15303.0 15227.0 15450.0 15837 16918 10275 9865 16326 Syria 2749 17068.0 18942.0 19016.0 19975 20557 16757 16698 20865 Tajikistan 9.7 382.4 594.4 605.2 671.7 901 Togo* 1049 1275.0 1342.0 1339.0 1278 1444 1472 1463 1339 Tunisia 3527 7691.0 8250.0 8543.0 8682 9348 8919 8877 11323 Turkey 19119 49238.0 50747.0 56451.0 68800 66391 57394 58591 91205 Turkmenistan 276.4 427 374.7 538.2 1771 Uganda* 733 2583.0 2777.0 2928.0 3029 3369 3063 6151 3708 Uzbekistan 60.0 1032 1194 1418 1990 2765 Yemen* 1684 6345.0 6473.0 6571.0 5923 6121 5528 5622
Total Idcs 153004.8 394096 416277.7 432790.6 464533.6 494505.3 455924.2 454000.2 567424 LDICs 17623.8 57961.4 59951.2 61510.5 62977.2 67657.4 56927.8 59989.6 64633 All DCs 603300 1443900 1524045 1592981 1747780 1899065 2042783 2095428 2316601
*LDICs. Source: World Bank, Global Development Finance 1998; 1997 figures taken from GDF 1999.

TABLE 3: RATIO OF TOTAL EXTERNAL DEBT TO GROSS NATI ONAL PRODUCT (%)
1980 1990 1991 1992 1993 1994 1995 1996 1997
Albania 16 46 100 50 48 30 28 27 Algeria 47 48 65 59 54 74 83 77 73 Azerbaijan 1 3 9 12 13 Bangladesh* 32 59 59 60 61 63 56 51 37 Benin* 36 68 72 66 71 109 82 74 78 Burkina Faso* 20 32 35 35 40 61 55 51 54 Cameroon 37 57 60 70 104 114 128 113 14 Chad* 30 43 50 54 75 103 89 88 67 Comoros* 36 76 75 70 66 96 87 89 95 Djibouti* 47 45 40 47 58 Egypt 95 79 93 76 66 63 57 46 44 Gabon 40 82 86 79 100 108 101 87 95 Gambia* 61 116 121 111 120 119 111 Guinea* 95 94 94 93 95 91 86 97 Guinea-Bissau* 126 269 327 348 339 360 363 352 374 Indonesia 28 64 65 66 59 63 65 60 66 Iran 8 9 15 15 15 11 Jordan 202 250 163 145 134 126 114 123 Kazakhstan 0 7 14 19 14 21 Kyrgyzstan 0 15 31 40 47 34 Lebanon 50 32 31 17 22 26 30 38 Malaysia 28 39 41 36 44 44 43 42 52 Maldives* 108 60 54 54 57 56 62 59 57 Mali* 45 102 109 93 100 149 123 116 116 Mauritania* 126 223 209 190 248 223 228 228 237 Morocco 53 95 79 78 81 74 73 61 58 Mozambique* 364 386 492 424 457 449 349 257 Niger* 35 74 68 68 74 104 87 80 84

Nigeria 9 131 135 109 144 141 149 101 88
TABLE 3: RATIO OF TOTAL EXTERNAL DEBT TO GROSS NATI ONAL PRODUCT (%) (cont’d)
1980 1990 1991 1992 1993 1994 1995 1996 1997 Oman 11 29 32 29 28 33 30 34 Pakistan 42 50 50 50 47 52 50 46 47 Senegal 50 68 67 62 70 99 81 73 76 Sierra Leone* 40 150 184 225 205 184 146 127 136 Somalia* 109 284 167 Sudan* 66 175 212 262 244 218 Syria 21 126 158 154 157 146 135 131 131 Tajikistan 0 13 27 30 35 45 Togo* 80 85 81 108 165 118 105 98 Tunisia 42 65 66 56 62 61 57 54 63 Turkey 34 33 33 35 38 51 44 43 50 Turkmenistan 5 10 9 19 48 Uganda* 43 63 85 106 96 86 63 61 61 Uzbekistan 0 5 5 8 10 12 Yemen* 135 134 123 104 104 94 120 88
Total Ics 36 62 66 62 66 70 72 63 51.6 LDICs 41 104 124 134 80 94 122 81 91.6 All DCs 21 38 38 40 40 39 36 35 34.9
*LDIC’s. Source: World Bank, Global Development Finance 1998; 1997 figures taken from GDF 1999.

TABLE 4: RATIO OF TOTAL EXTERNAL DEBT TO EXPORTS OF GOODS AND SERVICES (%)
1980 1990 1991 1992 1993 1994 1995 1996 1997
Albania 99 616 263 160 177 99 82 93 Algeria 130 201 217 208 219 276 265 219 212 Azerbaijan 5 14 41 57 56 Bangladesh* 360 467 458 408 371 378 297 272 251 Benin* 133 259 238 220 246 333 263 254 344 Burkina Faso* 88 165 207 230 260 313 308 289 427 Cameroon 142 285 270 313 358 465 443 425 404 Chad* 398 191 269 319 377 423 284 313 354 Comoros* 280 390 290 279 257 335 332 337 324 Djibouti* 84 88 97 112 115 127 Egypt 208 285 223 169 153 212 182 158 147 Gabon 62 145 164 145 145 154 149 124 134 Gambia* 207 218 169 173 176 193 235 200 202 Guinea* 294 310 387 376 460 454 418 472 Guinea-Bissau* 3410 3653 11713 4918 2567 3753 4073 2,562 Indonesia 234 237 230 213 232 234 221 228 Iran 32 45 58 78 122 114 114 57 Jordan 105 266 313 216 192 186 167 153 157 Kazakhstan 1 41 66 64 42 63 Kyrgyzstan 1 88 133 141 142 163 Lebanon 59 50 58 43 61 66 85 106 Malaysia 45 44 43 43 48 43 40 42 51 Maldives* 40 43 43 43 51 45 48 43 42 Mali* 226 439 459 512 504 555 470 467 512 Mauritania* 306 432 457 439 500 508 454 424 498 Morocco 214 284 239 223 228 226 209 190 166 Mozambique* 1560 1299 1424 1405 1429 1223 1080 1,185 Niger* 133 305 344 343 419 553 480 476 478

Nigeria 32 226 250 222 258 317 319 200 173
TABLE 4: RATIO OF TOTAL EXTERNAL DEBT TO EXPORTS OF GOODS AND SERVICES (%) (cont’d)
1980 1990 1991 1992 1993 1994 1995 1996 1997 Oman 15 46 54 48 46 53 49 45 49 Pakistan 209 250 249 254 246 276 253 251 253 Senegal 163 229 239 233 279 267 228 213 222 Sierra Leone* 170 547 536 610 779 894 111 1042 982 Somalia* 252 Sudan* 501 1755 2980 3096 3632 2445 2392 1766 1,530 Syria 106 313 385 380 387 353 339 321 331 Tajikistan 85 105 76 92 111 Togo* 181 176 195 225 355 347 274 283 192 Tunisia 96 131 145 129 138 123 112 110 129 Turkey 333 196 197 200 226 203 178 158 182 Turkmenistan 12 20 19 49 145 Uganda* 209 1050 1375 1471 1252 980 523 492 485 Uzbekistan 4 36 35 46 65 69 Yemen* 206 263 279 244 200 195 177 109
Total Ics 170 225 244 236 244 240 224 208 185.2 LDICs 321 656 858 923 914 727 636 543 509.6 All DCs 85 171 171 177 168 149 137 134 129.0
*LDIC’s. Source: World Bank, Global Development Finance 1998; 1997 figures taken from GDF 1999.

TABLE 5: TOTAL DEBT SERVICE PAYMENTS BY ISLAMIC COU NTRIES (MILLION US $)
1980 1990 1991 1992 1993 1994 1995 1996 1997
Albania 3.1 3.6 1.9 0.3 11.1 1.8 23.1 39 Algeria 4034 8564.0 9011.0 8889.0 8623.0 4923 3877 3991 4420 Azerbaijan 0.0 0 8.7 4.3 78 Bangladesh* 272 547.0 455.0 466.0 464.0 537 729 595 705 Benin* 20 33.0 28.0 26.0 30.0 38 45 39 55 Burkina Faso* 22 28.0 40.0 29.0 36.0 42 46 45 52 Cameroon 280 391.0 372.0 300.0 391.0 354 346 459 513 Chad* 6 6.6 9.1 9.7 14.4 15.4 7.3 22.9 35 Comoros* 0 0.8 8.1 5.8 2.2 2.7 0.9 1.4 2 Djibouti* 3.1 10.6 10.1 9.4 7.3 5.9 10.9 10.4 7 Egypt 2038 2709.0 2305.0 2493.0 2024.0 2077 2090 1890 1928 Gabon 432 102.0 224.0 338.0 70.0 198 368 357 433 Gambia* 4 30.3 23.5 25.3 24.8 26 19.3 20.1 27 Guinea* 109 148.0 121.0 80.0 78.0 90 164 101 161 Guinea-Bissau* 5 6.2 7.0 8.8 4.5 9.2 13.8 9.6 10 Indonesia 3084 9200.0 10311.0 11552.0 13255.0 13130 9488 11664 19736 Iran 959 253.0 225.0 286.0 564.0 3682 5204 3025 6274 Jordan 210 550.0 624.0 655.0 507.0 484 544 579 621 Kazakhstan 0.0 8.0 51 195 246 502 Kyrgyzstan 0.0 0.4 13.1 56.1 43.7 43 Lebanon 13 39.0 47.0 65.0 68.0 122 158 216 734 Malaysia 934 3402.0 2811.0 4086.0 4310.0 5733 2533 4170 7109 Maldives* 1 7.3 6.8 6.8 8.1 9.4 10.7 11.3 29 Mali* 16 40.0 16.0 34.0 31.0 116 77 106 78 Mauritania* 48 121.0 73.0 72.0 118.0 95 101 106 114 Morocco 1414 1445.0 2120.0 3667.0 3089.0 3156 3503 3101 3082 Mozambique* 33.0 74.0 75.0 112.0 122 156 134 104 Niger* 141 71.0 85.0 40.0 79.0 54 14 15 61

Nigeria 1153 3304.0 2917.0 3709.0 1441.0 1822 1748 2433 1416
TABLE 5: TOTAL DEBT SERVICE PAYMENTS BY ISLAMIC COU NTRIES (MILLION US $) (cont’d)
1980 1990 1991 1992 1993 1994 1995 1996 1997 Oman 249 714.0 552.0 493.0 583.0 525 466 719 474 Pakistan 855 1437.0 1591.0 1948.0 2144.0 3271 2286 2251 4059 Senegal 259 225.0 236.0 145.0 75.0 177 198 213 247 Sierra Leone* 63 6.0 3.0 22.0 18.0 35 74 54 20 Somalia* 13 7.0 0.0 0.0 0.0 0 0 3 0 Sudan* 264 23.0 22.0 26.0 17.0 3 17 0 58 Syria 382 1191.0 383.0 207.0 174.0 229 155 124 563 Tajikistan 1.2 0.4 0 0.3 37 Togo* 38 60.0 39.0 19.0 13.0 12 14 42 55 Tunisia 545 1267.0 1178.0 1258.0 1261.0 1389 1376 1338 1413 Turkey 1607 6824.0 7753.0 8516.0 7832.0 9497 9110 8372 10716 Turkmenistan 10.4 97.7 102.2 167.5 263 Uganda* 44 87.0 102.0 77.0 142.0 122 104 95 191 Uzbekistan 5.0 20.0 122 228 278 516 Yemen* 35 108.0 151.0 103.0 99.0 81 91 79 98
Total Ics 19552.1 42993.9 43937.2 49748.7 47749.6 52479.9 45736.7 47154.6 69075 LDICs 1066.1 1313.8 1234.6 1115.8 1285.3 1403.6 1680.9 1447.7 3859 All DCs 73284 136349 136005 142689 150322 168018 198509 233278 305236
• LDICs. Source: World Bank, Global Development Finance 1998; 1997 figures taken from GDF 1999.

TABLE 6: RATIO OF DEBT SERVICE TO EXPORTS OF GOODS AND SERVICES (%)
1980 1990 1991 1992 1993 1994 1995 1996 1997
Albania 1 4 1 0 2 1 4 5 Algeria 27 67 70 74 73 46 34 28 30 Azerbaijan 0 0 1 1 9 Bangladesh* 24 21 21 17 14 14 15 12 12 Benin* 6 7 6 4 5 9 8 7 12 Burkina Faso* 6 9 10 7 9 12 12 11 17 Cameroon 15 17 16 16 23 22 20 24 22 Chad* 8 6 5 5 8 9 5 10 12 Comoros* 3 3 13 8 3 5 2 2 4 Djibouti* 5 4 4 5 5 3 Egypt 13 32 17 15 14 15 13 12 10 Gabon 18 8 12 16 6 10 15 11 14 Gambia* 6 14 14 13 12 14 15 13 13 Guinea* 20 16 13 11 15 25 15 22 Guinea-Bissau* 42 113 102 22 22 64 49 27 Indonesia 38 34 33 34 31 31 37 33 Iran 7 3 4 5 9 22 29 30 Jordan 11 20 24 20 15 14 13 12 12 Kazakhstan 0 0 2 4 10 7 Kyrgyzstan 0 0 5 14 9 8 Lebanon 3 4 4 4 5 5 6 15 Malaysia 6 13 7 9 9 9 7 8 8 Maldives* 1 5 4 3 4 3 3 3 8 Mali* 5 12 8 11 14 18 14 18 14 Mauritania* 17 30 20 18 30 24 22 22 23 Morocco 33 22 27 40 36 36 33 28 27 Mozambique* 26 23 23 33 31 38 32 22 Niger* 22 17 25 12 24 24 17 17 18

Nigeria 4 23 22 29 13 18 17 16 9
TABLE 6: RATIO OF DEBT SERVICE TO EXPORTS OF GOODS AND SERVICES (%) (cont’d)
1980 1990 1991 1992 1993 1994 1995 1996 1997 Oman 6 12 11 9 10 9 8 10 6 Pakistan 18 23 21 24 24 35 27 27 35 Senegal 29 20 21 14 8 16 16 16 16 Sierra Leone* 24 10 6 17 18 96 75 53 17 Somalia* 5 Sudan* 26 6 4 5 5 1 9 5 5 Syria 11 23 10 6 6 7 5 4 9 Tajikistan 0 0 0 0 5 Togo* 9 12 8 6 7 6 6 11 8 Tunisia 15 25 24 20 21 19 17 17 16 Turkey 28 29 32 32 29 31 28 22 21 Turkmenistan 0 5 5 11 21 Uganda* 17 60 73 57 65 44 20 20 25 Uzbekistan 0 1 4 6 8 13 Yemen* 6 8 6 5 4 3 2 3
Total Ics 17 26 24 24 22 23 22 21 21.8 LDICs 20 18 20 16 16 14 14 11 12.1 All DCs 13 18 18 18 18 17 17 17 17.0
• LDICs. Source: World Bank, Global Development Finance 1998; 1997 figures taken from GDF 1999.
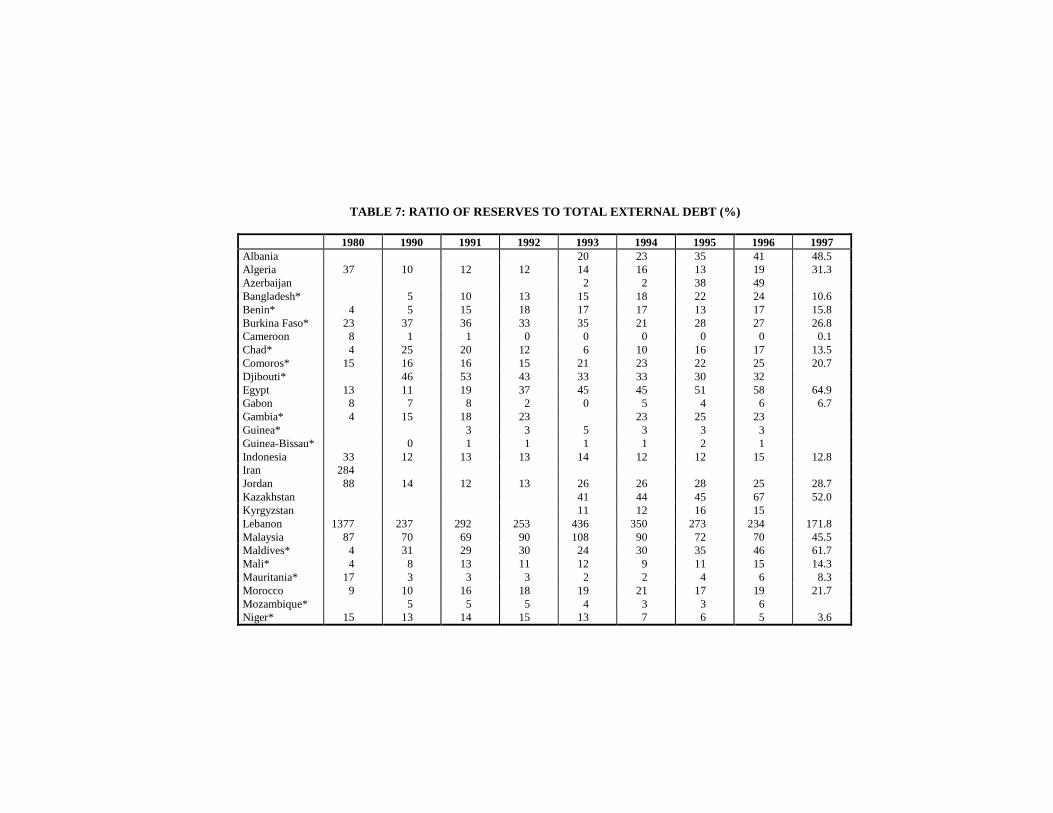
TABLE 7: RATIO OF RESERVES TO TOTAL EXTERNAL DEBT ( %)
1980 1990 1991 1992 1993 1994 1995 1996 1997
Albania 20 23 35 41 48.5 Algeria 37 10 12 12 14 16 13 19 31.3 Azerbaijan 2 2 38 49 Bangladesh* 5 10 13 15 18 22 24 10.6 Benin* 4 5 15 18 17 17 13 17 15.8 Burkina Faso* 23 37 36 33 35 21 28 27 26.8 Cameroon 8 1 1 0 0 0 0 0 0.1 Chad* 4 25 20 12 6 10 16 17 13.5 Comoros* 15 16 16 15 21 23 22 25 20.7 Djibouti* 46 53 43 33 33 30 32 Egypt 13 11 19 37 45 45 51 58 64.9 Gabon 8 7 8 2 0 5 4 6 6.7 Gambia* 4 15 18 23 23 25 23 Guinea* 3 3 5 3 3 3 Guinea-Bissau* 0 1 1 1 1 2 1 Indonesia 33 12 13 13 14 12 12 15 12.8 Iran 284 Jordan 88 14 12 13 26 26 28 25 28.7 Kazakhstan 41 44 45 67 52.0 Kyrgyzstan 11 12 16 15 Lebanon 1377 237 292 253 436 350 273 234 171.8 Malaysia 87 70 69 90 108 90 72 70 45.5 Maldives* 4 31 29 30 24 30 35 46 61.7 Mali* 4 8 13 11 12 9 11 15 14.3 Mauritania* 17 3 3 3 2 2 4 6 8.3 Morocco 9 10 16 18 19 21 17 19 21.7 Mozambique* 5 5 5 4 3 3 6 Niger* 15 13 14 15 13 7 6 5 3.6

Nigeria 119 12 14 4 5 5 5 26
TABLE 7: RATIO OF RESERVES TO TOTAL EXTERNAL DEBT ( %) (cont’d)
1980 1990 1991 1992 1993 1994 1995 1996 1997 Oman 118 65 61 73 38 35 39 44 45.3 Pakistan 16 5 5 6 8 14 8 4 6.0 Senegal 2 1 1 1 0 5 7 8 10.8 Sierra Leone* 7 1 1 2 2 3 3 2 Somalia* 4 Sudan* 1 0 0 0 0 1 1 1 Syria 23 Tajikistan Togo* 8 28 28 21 13 7 9 6 9.1 Tunisia 20 11 11 11 11 17 17 18.0 Turkey 17 15 13 13 11 13 19 22 21.7 Turkmenistan Uganda* 0 2 2 3 5 10 13 14 Uzbekistan 82 102 95 69 Yemen* 7 11 5 3 5 10 16 31.6
Total Ics 78 21 22 25 30 28 27 30 18.8 LDICs 5 6 9 9 9 11 14 16 10.3 All DCs 38 18 18 21 22 26 29 30 28.1
• LDICs. Source: World Bank, Global Development Finance 1998; 1997 figures taken from GDF 1999.

TABLE 8: RESERVES EXPRESSED AS MONTHS OF IMPORTS
1980 1990 1991 1992 1993 1994 1995 1996 1997
Albania 3 4 4 4 5.0 Algeria 6 3 4 9.1 Azerbaijan 1 Bangladesh* 2 4 5 6 7 6 6 2.5 Benin* 0 1 4 4 4 6 4.2 Burkina Faso* 2 5 6 6 7 6 5.7 Cameroon 1 0 0 0 0 0 0 0 0.0 Chad* 2 3 3 2 1 2 2.8 Comoros* 2 4 3 3 5 6 5 5.1 Djibouti* 3 2 3 3 Egypt 3 3 4 9 10 11 11 11 11.9 Gabon 1 1 2 0 0 1 1 0 1.2 Gambia* 0 3 3 5 5 5 4 Guinea* 1 1 2 1 1 1 Guinea-Bissau* 0 0 1 1 1 2 Indonesia 3 3 3 3 3 3 3.0 Iran 9 Jordan 8 3 3 3 5 5 5 4 4.7 Kazakhstan 2 3 3 3 3.1 Kyrgyzstan 1 1 2 1 Lebanon 17 14 12 13 14 13 14 12.0 Malaysia 5 4 3 4 6 4 3 2.6 Maldives* 0 2 1 1 1 2 2 3 2.8 Mali* 1 3 5 4 5 4 5.3 Mauritania* 4 1 2 1 1 1 2 4.2 Morocco 2 3 4 4 5 5 4 4 4.2 Mozambique* 2 2 2 2 2 2 Niger* 2 3 4 4 5 3 2 1.4
Nigeria 6 5 4 1 2 2 2 8
TABLE 8: RESERVES EXPRESSED AS MONTHS OF IMPORTS (cont’d)
1980 1990 1991 1992 1993 1994 1995 1996 1997 Oman 3 5 5 5 2 3 3 3 3.0 Pakistan 3 1 1 1 2 4 2 1 1.5 Senegal 0 0 0 0 0 1 2 2.5 Sierra Leone* 1 0 1 1 1 1 Somalia* 1 Sudan* 0 0 0 0 1 1 2 1 Syria 2 Tajikistan Togo* 1 5 5 4 3 2 1.9 Tunisia 2 2 2 1 1 2 2 2.6 Turkey 4 3 3 3 3 3 4 4 3.9 Turkmenistan Uganda* 0 1 1 2 2 4 4 4 Uzbekistan Yemen* 2 3 1 1 1 3 3 4.0
Total Ics 4 3 3 4 4 4 4 4 3.1 LDICs 1 2 3 3 3 4 4 4 2.2 All DCs 4 4 3 4 4 4 5 5 4.1
TABLE 46. LDICs. Source: World Bank, Global Development Finance 1998; 1997 figures taken from GDF 1999.

TABLE 9. NET FOREIGN DIRECT INVESTMENT (US MILLION $)
1980 1990 1991 1992 1993 1994 1995 1996 1997 Albania 0 0 20 58 53 70 90.1 48 Algeria 349 0 12 12 15 18 5 4 7 Azerbaijan 0 22 275 601 650 Bangladesh* 0 3 1 4 14 11 2 15 135 Benin* 4 1 13 7 10 5 1 2 3 Burkina Faso* 0 0 13 0 0 1 0 0 0 Cameroon 130 -113 -15 29 5 -9 7 35 45 Chad* 0 0 4 2 15 27 13 18 15 Comoros* 0 -1 3 -1 2 3 1 2 2 Djibouti* 0 0 0 2.3 1.4 1.4 3.2 5 5 Egypt 548 734 253 459 493 1256 598 636 891 Gabon 32 74 -55 127 -114 -103 -113 -65 -100 Gambia* 0 0 10 6 11 9.8 7.8 11 12 Guinea* 34 18 39 20 3 1 1 24 1 Guinea-Bissau* 0 2 0 0 0 1 1 1 2 Indonesia 180 1093 1482 1777 2004 2109 4348 7960 4,677 Iran 0 -362 0 0 0 2 17 10 50 Jordan 34 38 -12 41 -34 3 13 16 22 Kazakhstan 100 150 185 284 310 1,321 Kyrgyzstan 0 10 38.2 96.1 46.3 50 Lebanon 0 6 0 4 6 7 35 80 150 Malaysia 934 2333 3998 5183 5006 4342 4132 4500 5,106 Maldives* 0 6 7 7 7 9 7 8 10 Mali* 2 -7 4 -8 -20 45 12 23 15 Mauritania* 27 7 2 8 16 2 7 5 3 Morocco 89 165 317 422 491 551 290 311 1,200 Mozambique* 9 23 25 32 35 45 29 35 Niger* 49 -1 15 56 -34 -11 0 0 2

Nigeria -740 588 712 897 1345 1959 2201 1391 1,539
TABLE 9. NET FOREIGN DIRECT INVESTMENT (US MILLION $) (cont’d)
1980 1990 1991 1992 1993 1994 1995 1996 1997 Oman 98 141 135 104 142 76 46 67 90 Pakistan 63 244 257 335 346 419 719 690 713 Senegal 15 57 -8 21 -1 67 32 45 30 Sierra Leone* -19 32 8 -6 -7 -4 1 5 4 Somalia* 0 6 0 0 2 1 1 0 0 Sudan* 0 0 0 0 0 0 0 0 0 Syria 0 71 0 0 176 251 100 89 80 Tajikistan 0 0 10 15 16 20 Togo* 42 0 7 0 0 0 0 0 0 Tunisia 235 76 126 526 562 432 264 320 316 Turkey 18 684 810 844 636 608 885 722 805 Turkmenistan 0 0 0 108 85 Uganda* 0 0 1 3 55 88 121 121 180 Uzbekistan 40 45 50 115 55 285 Yemen* 34 -131 593 714 897 11 -218 100 -138
* LDICs. Source: World Bank, Global Development Finance 1998; 1997 figures taken from GDF 1999.


90 Journal of Economic Cooperation

External Debt of the Islamic Countries 91

92 Journal of Economic Cooperation

External Debt of the Islamic Countries 93

94 Journal of Economic Cooperation

External Debt of the Islamic Countries 95

96 Journal of Economic Cooperation

External Debt of the Islamic Countries 97

98 Journal of Economic Cooperation

External Debt of the Islamic Countries 99

100 Journal of Economic Cooperation

External Debt of the Islamic Countries 101

102 Journal of Economic Cooperation

External Debt of the Islamic Countries 103

104 Journal of Economic Cooperation

External Debt of the Islamic Countries 105

106 Journal of Economic Cooperation