Embed Size (px)
Citation preview

Extensible Monitoring with Nagios and Messaging MiddlewareLISA 2012
Jonathan Reams <[email protected]>

Symon Says Nagios Project
• Replace 12-year-old home grown monitoring system– Very customized– Very engineered– Very unsupported
• ~17,000 checks • Mandate to move to Nagios

False Start
1. Installed Nagios
2. Ported checks from old system to new
3. Went out for coffee
4. Problems
a. High check latency
b. High load

Stock Nagios

Nagios Problems
• Trapped on one host:– Check results– Status data– Configuration data
• Nagios isn’t a great executor– Forks 2 processes per check– Everything is basically synchronous – async achieved
with multiple processes• Data format is simple but non-standard

Nagios Problems
• Implementation is all in C – hard to customize• Can be I/O bound by reading/writing check result files• Cannot query data from status file/configuration without
reading/parsing all of it• Input via FIFO gives no feedback and has a limited
buffer size

Nagios Problems
Communication is hard!

My Solution
NagMQ
A ZeroMQ-based API for Nagios

Background on ZeroMQ
• Broker-less messaging kernel in a single library• Emulates Berkeley socket API• Supports IPC/TCP/Multicast transports• Fanout, pub/sub, pipe-line, and request/reply messaging
patterns• All I/O is asynchronous after connections are established
with dedicated I/O threads• Bindings available for large number of operating systems
and languages• Agnostic of data being sent – no defined data format

NagMQ

Event Publisher & Commands
Host check result from publisherhost_check_processed localhost{ "host_name": "localhost", "check_type": 0, "check_options": 0, "scheduled_check": 1, "reschedule_check": 1, "current_attempt": 1, "max_attempts": 1, "state": 0, "last_state": 0, "last_hard_state": 0, "last_check": 1354996955, "last_state_change": 1337098090, "latency": 1.63600, "timeout": 60, "type": "host_check_processed", "start_time": { "tv_sec": 1354996955, "tv_usec": 636453 }, "end_time": { "tv_sec": 1354996964, "tv_usec": 161965 }, "early_timeout": 0, "execution_time": 0.07324, "return_code": 0, "output": "Host up", "long_output": null, "perf_data": null, "timestamp": { "tv_sec": 1354996964, "tv_usec": 161966 } }
Command to add an acknowledgement to service problem{'comment_data': 'Stop alerting me!!', 'notify_contacts': False, 'author_name': ’jreams', 'persistent_comment': False, 'host_name': 'localhost', 'service_description': 'rotate-unix', 'time_stamp': {'tv_sec': 1355074576}, 'type': 'acknowledgement'}
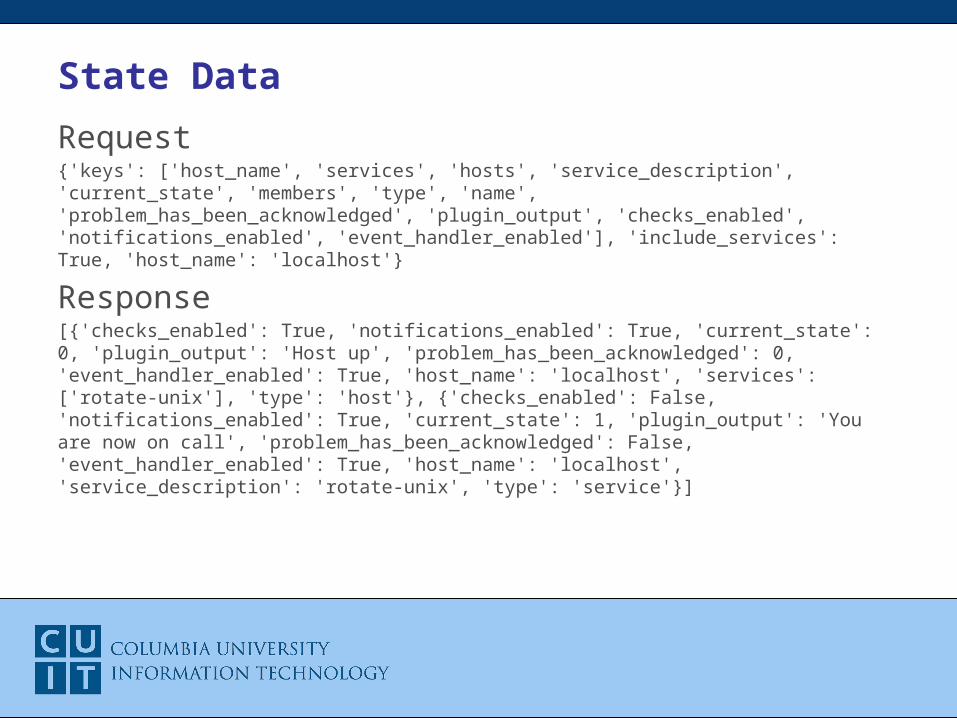
State Data
Request{'keys': ['host_name', 'services', 'hosts', 'service_description', 'current_state', 'members', 'type', 'name', 'problem_has_been_acknowledged', 'plugin_output', 'checks_enabled', 'notifications_enabled', 'event_handler_enabled'], 'include_services': True, 'host_name': 'localhost'}
Response[{'checks_enabled': True, 'notifications_enabled': True, 'current_state': 0, 'plugin_output': 'Host up', 'problem_has_been_acknowledged': 0, 'event_handler_enabled': True, 'host_name': 'localhost', 'services': ['rotate-unix'], 'type': 'host'}, {'checks_enabled': False, 'notifications_enabled': True, 'current_state': 1, 'plugin_output': 'You are now on call', 'problem_has_been_acknowledged': False, 'event_handler_enabled': True, 'host_name': 'localhost', 'service_description': 'rotate-unix', 'type': 'service'}]

Some examples
• Distributed check execution (mqexec)• Custom user interfaces (nag.py, etc)• High availability (haagent.py, halib.py)

mqexec

mqexec
• Asynchronous command executor• Subscribes to host_check_initiate,
service_check_initiate, and event_handler_start
messages, and executes command line specified• Can filter which commands to execute based on any
attribute in message• Receives messages as
– Fair-queued worker pool (pull from MQ broker)– Individual worker (subscribe directly to NagMQ)
• Sends results back to command interface of NagMQ

Performance: Stock Nagios
1 2 3 4 5 6 7 8 9 10111213141516171819200
2
4
6
8
10
12
14
16
18
Max HostAvg HostMax SvcAvg Svc
Time in Minutes
Lat
ency
in
Sec
on
ds

Performance: NagMQ/mqexec
1 2 3 4 5 6 7 8 9 10111213141516171819200
2
4
6
8
10
12
14
16
18
Max HostAvg HostMax SvcAvg Svc
Time in Minutes
Lat
ency
in
Sec
on
ds

User Interfaces
• Command-line$ nag.py -c 'Stop alerting me!!' add ack localhost[localhost]: No problem found[uptime@localhost]: Acknowledgement added
• Python/Javascript/Twitter Bootstrap web interface using NagMQ (see demo)
• Interface to Twitter

High Availability – Stock Nagios

High Availability - NagMQ

High Availability - NagMQ
• Use regular program_status to provide heartbeat• Retrieve active state from state interface to bring passive
node into sync with active node on startup• Subscribe to and send check result messages,
acknowledgements, downtimes, and adaptive changes to command interface
• Passive host’s mqexec(s) run checks for whatever host is active
• Use VIFs owned by the message broker to direct traffic to active host

Why not use one of these?
• LiveStatus – live state query module with check execution workers
• Mod_gearman – distributed check execution based on gearman job queue
• Merlin – database/distributed backend for Nagios• Ndoutils – database backend for Nagios• NSCA – allows check/command submission over
network• NRPE – remote check executor

API – not a product
• NagMQ is just an interface into Nagios, not a product• Better communication with clients comes from larger
ZeroMQ project – leaving NagMQ to focus on Nagios• Implement ad-hoc tools for Nagios without having to
write any compiled code• Doing expensive data processing of monitoring data
doesn’t have to create latency in monitoring system• Re-use one interface for many tools

Future Work
• Pluggable authentication/encryption for NagMQ• Pluggable parser/emitter for custom data formats (XML,
Yaml, etc)• NDOutils database replacement• More user interfaces (Jabber, SMS, email gateway,
REST API)• Nagios 4

NagMQ
https://github.com/jbreams/nagmq
Jonathan Reams