Embed Size (px)
Citation preview
March 13, 2014
Dr. H. Christopher Frey
Chair, Clean Air Scientific Advisory Committee
Science Advisory Board
US Environmental Protection Agency
1200 Pennsylvania Avenue, NW
Washington, DC 20460
Dear Dr. Frey:
We urge CASAC to consider the following comments, presenting our recommendations for
improvements to the 2014 Health Risk and Exposure Assessment for Ozone Second External Review
Draft (REA; US EPA, 2014). We received funding from the American Petroleum Institute (API) to
prepare these comments, but the recommendations are based on our own independent evaluation of the
REA and don't necessarily reflect the views of API.
We found the REA to be a much more thorough and complete risk assessment than the first draft. In the
second draft, the United States Environmental Protection Agency (EPA) presented analyses of 12 urban
areas, a more detailed discussion of sensitivity analyses, and several sources of uncertainty, and it
included confidence bounds for mortality risk estimates. However, we found that EPA took an overly
conservative approach and highlighted modeled results without sufficient discussion of the uncertainty.
EPA could improve the REA by presenting analyses more clearly and providing a more complete
discussion of uncertainty and its impact on the two key questions posed in the REA:
(a) To what extent is the existing ozone standard protective of public health? and,
(b) What is the nature and magnitude of additional public health protection provided by
the suite of alternative standards under consideration?
EPA made a number of changes we recommended in prior comments (Goodman and Sax, 2012), which
we believe improved the analysis. One of these changes is the use of a model-based adjustment
procedure instead of the mathematically based quadratic rollback procedure to estimate ozone
concentrations that meet current and alternative ozone standards. EPA relied on these estimates for two
separate risk evaluations: lung function decrements based on controlled exposure studies, and respiratory
morbidity and all-cause mortality endpoints based on epidemiology data.
Exposure and lung function risks assessment based on controlled human exposure studies
In the REA, EPA used an updated model to evaluate lung function decrements – this was one of our
recommendations from previous comments (Goodman and Sax, 2012). In addition, EPA used an updated
epidemiology study in its evaluation of short-term ozone exposure and risks of all-cause mortality. EPA
also evaluated respiratory morbidity outcomes (i.e., emergency department visits for asthma and all
respiratory outcomes and hospital admissions for chronic obstructive pulmonary disease, asthma and all
respiratory effects, and respiratory symptoms), but it used the same studies as in the first draft REA.
Against our recommendation (because of a lack of evidence for causation), EPA added an evaluation of
respiratory mortality risks associated with long-term ozone exposure in the second draft REA.
EPA estimated population ozone exposures using version 4.5 of the Air Pollutants Exposure (APEX)
Model for four groups of what it considered to be "higher-risk" populations, including school-aged
2
children (ages 5-18 years), asthmatic school-age children, asthmatic adults (ages 19-64 years), and older
adults (ages 65-95 years), but it reported exposure-related lung function decrements only for school-aged
children (ages 5-18 years) and adults (19-35, 35-55, and >55 years old). EPA developed concentration-
response functions1 for lung function decrements from several controlled human exposure studies. The
exposure-response functions were based on two models: one used in the 2007 ozone National Ambient
Air Quality Standards (NAAQS) review updated with data from more recent studies, and an updated
McDonnell-Stewart-Smith model (McDonnell et al., 2012).
EPA estimated exposures over three "benchmark" levels in its exposure evaluation, noting that an 8-hour
exposure level of 60 parts per billion (ppb) was the lowest level at which ozone-related effects have been
observed in human exposure studies. In reporting lung function impacts from ozone exposure, EPA
evaluated the percentage of people with a single occurrence of a lung function decrement over a cutoff
value (i.e., ≥ 10, 15, or 20%) in one year.
Mortality and morbidity risk assessment based on epidemiology studies
EPA based its analyses of respiratory morbidity and mortality on data from epidemiology studies. EPA
calculated risks using the environmental Benefits Mapping and Analysis Program for 12 US cities and
also calculated a national assessment of mortality risks to compare risks in these cities to the US as a
whole. EPA calculated "total" risks modeled down to a zero ozone level for the air quality years 2007
and 2009 and scenarios in which ozone concentrations meet the current standard (75 ppb). It also
calculated the incremental risk reductions that would occur by achieving lower proposed standards (60,
65, and 70 ppb) vs. the current level of the standard.
EPA conducted a limited uncertainty evaluation for each analysis. EPA reported confidence bounds for
mortality risk estimates from short- and long-term ozone exposure only, and only a small portion of the
uncertainty was represented by these confidence bounds. EPA discussed other sources of uncertainty
associated with the exposure, lung function, and respiratory morbidity risk assessments only qualitatively.
In addition, EPA conducted only a limited number of sensitivity analyses.
Based on the results from the various risk evaluations, EPA (2014) concluded:
[E]xposures and risks remain after just meeting the existing standards, and…in many
cases, just meeting alternative standard levels results in reduction in those exposures and
risks.
EPA appears to base this conclusion largely on evaluations of standards that would result in children
experiencing one time in a year (1) exposures above 8-hour average concentrations of 60 ppb ozone or (2)
≥ 10% lung function decrements. Notably, EPA concluded that "[m]ortality from short- and long-term
O3 exposures and respiratory hospitalization risk is not greatly affected by meeting lower standards"
(US EPA, 2014, p. 9-47).
Recommendations
Our evaluation shows that the REA likely overestimated exposure and lung function risks, and small
reductions in exposure and risks from lower ozone standards are likely to be well within model
uncertainty – particularly when considering that the current ozone standard is health protective. We
discuss specific recommendations in response to CASAC charge questions.
1 EPA refers to the concentration-response function as an "exposure-response function" for controlled exposure studies.

3
Exposure and lung function risk assessment based on controlled human exposure studies
With regard to the exposure and lung function risk assessment, EPA posed the following question
to CASAC:
To what extent does the Panel find the assessment, interpretation, and presentation of
the methods and results of the updated and expanded population-based exposure
analysis to be technically sound, appropriately balanced, and clearly communicated?
EPA's exposure assessment approach was conservative on many levels, and it should not be.
EPA used benchmark ozone concentrations down to an 8-hour average of 60 ppb ozone when
data do not support health effects at these low levels of exposure (e.g., Goodman et al.,
2013). EPA should analyze exposures and risks above a higher benchmark, such as 70 ppb,
as the core analysis.
EPA highlighted analyses of a single day in a year with exposures above benchmark levels,
but it would be more appropriate to consider multiple days as the core analysis.
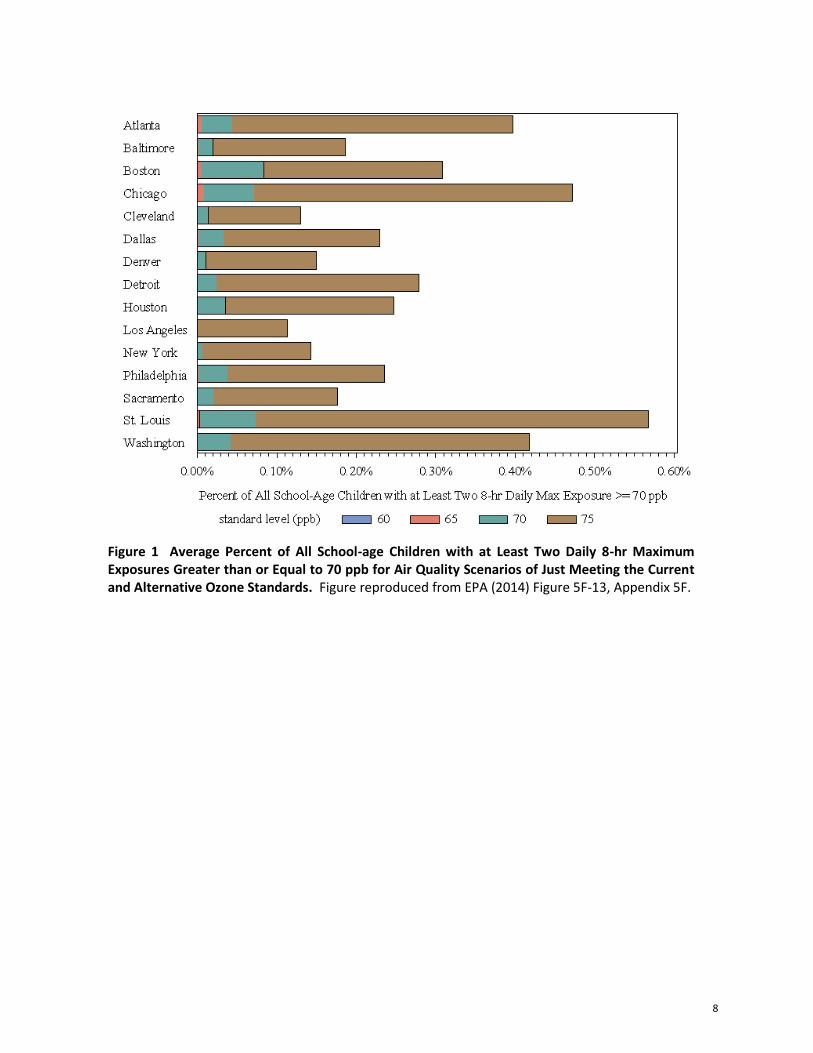
With regard to the exposure analyses, results indicate that lower ozone standards would lead to
small reductions in exposure above EPA benchmarks, particularly at the mid-level benchmark
(Figure 1), but reductions in the number of exposed individuals are likely well within model
uncertainty. EPA should highlight these findings instead of findings at lower more uncertain
benchmarks which are of questionable adversity (i.e., single exceedances at 60 ppb, Figure 2).
With regard to the lung function risk analysis, EPA highlighted risks of experiencing small lung
function decrements (≥ 10% and < 20%), measured as forced expiratory volume in 1 second
(FEV1), but these are not likely to be adverse according to ATS and others if not accompanied by
other respiratory symptoms (ATS, 2000; Pellegrino et al., 2005). Also, compared to multiple
occurrences, single FEV1 decrements in a year are more likely to be due to factors other than
ozone or within normal variability. Therefore, EPA should only report results for multiple
occurrences of FEV1 decrements.
With regard to the uncertainty analysis, EPA posed the following question to CASAC:
To what extent does the Panel find that the discussion of uncertainty and variability
have covered important sources of uncertainty and variability and appropriately
characterized their relationship to the exposure estimates?
EPA conducted only quantitative analysis for most sources of uncertainty in the exposure and risk
assessments.
Even though EPA appears to have identified the major sources of uncertainty, it needs to
better identify which are expected to have the most influence on exposure and risk estimates.
Also, EPA should more clearly state the expected direction and magnitude of bias with
examples.
EPA should also provide confidence bounds for exposure estimates that reflect all the
uncertainty in the modeled estimates that can be quantified. This should, at a minimum, be
part of the core analyses.
4
Sensitivity analyses EPA performed in the REA suggest that key model assumptions, including
age-adjustments and ventilation rate assumptions, led to overestimates of risks – particularly for
children. Key results are imbedded in appendices and need to be highlighted more in the main
REA document.
As with the exposure estimates, EPA should incorporate confidence bounds for risk estimates in
the core and sensitivity analyses. This would allow proper comparison between risk estimates for
meeting the current and alternative standards.
Despite having no confidence bounds for risk estimates, results suggest very small reductions in
risk with lower ozone standards, particularly when considering risk levels that are more likely to
be adverse (e.g., multiple days with FEV1 decrements). EPA should highlight these findings,
which indicate that the current standard is health protective and no significant additional benefits
will be achieved from lower ozone standards.
For example, Table 6-4 from the REA (reproduced as Table 1 below) shows that not more
than approximately 6% of simulated individuals (representing worst-case conditions) would
have multiple (> 6 days) of lung function decrements ≥ 10% at current levels of the ozone
standard (75 ppb) compared to 9% at baseline ozone levels.
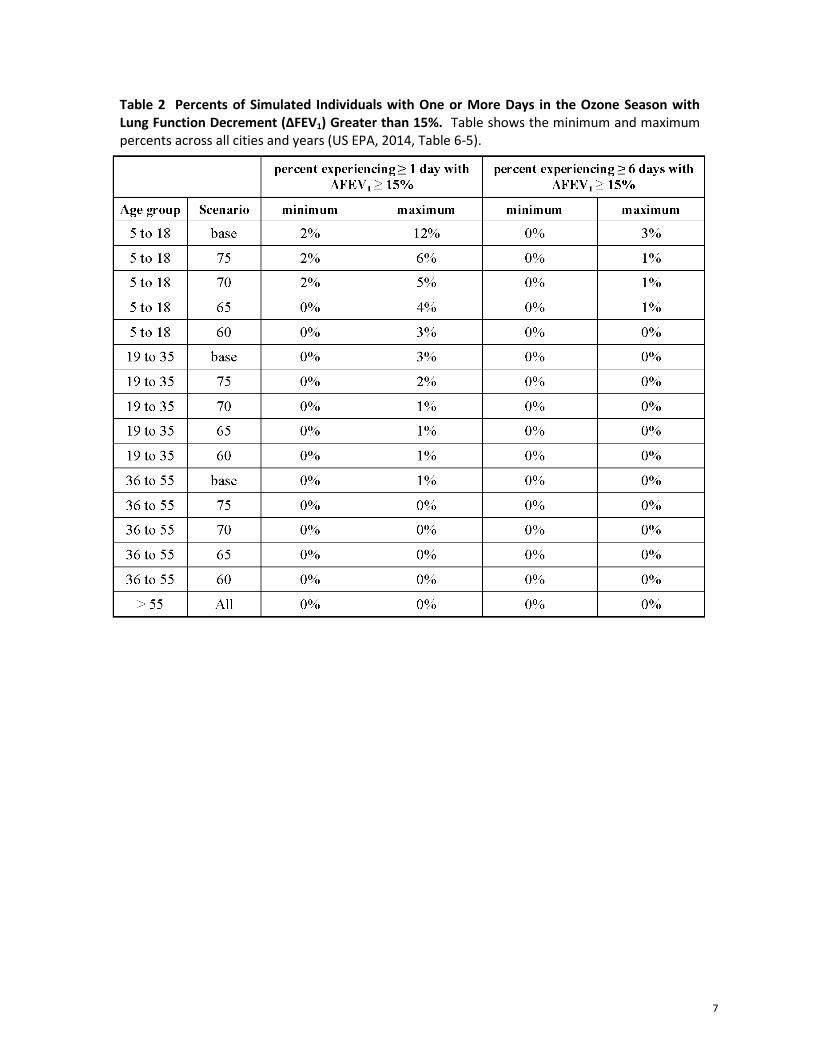
Also, Table 6-5 from the REA (reproduced as Table 2 below) shows that not more than about
1% of simulated individuals (representing worst-case conditions) have multiple days of lung
function decrements ≥ 15% at the current level of the ozone standard compared to about 3%
for baseline conditions.
Lower ozone standards do not significantly change these numbers, and these changes are
more than likely within model uncertainty.
Mortality and morbidity risk assessment based on epidemiology studies
With regard to the mortality risk assessment, EPA posed the following question to CASAC:
To what extent does the Panel find the assessment, interpretation, and presentation of
the methods and results of the updated epidemiology-based risk assessment to be
technically sound, appropriately balanced, and clearly communicated?
Instead of evaluating mortality and respiratory morbidity risks down to a zero ozone
concentration, EPA should only evaluate risks above ozone threshold levels (either background
ozone or thresholds determined by evidence from controlled human exposure studies).
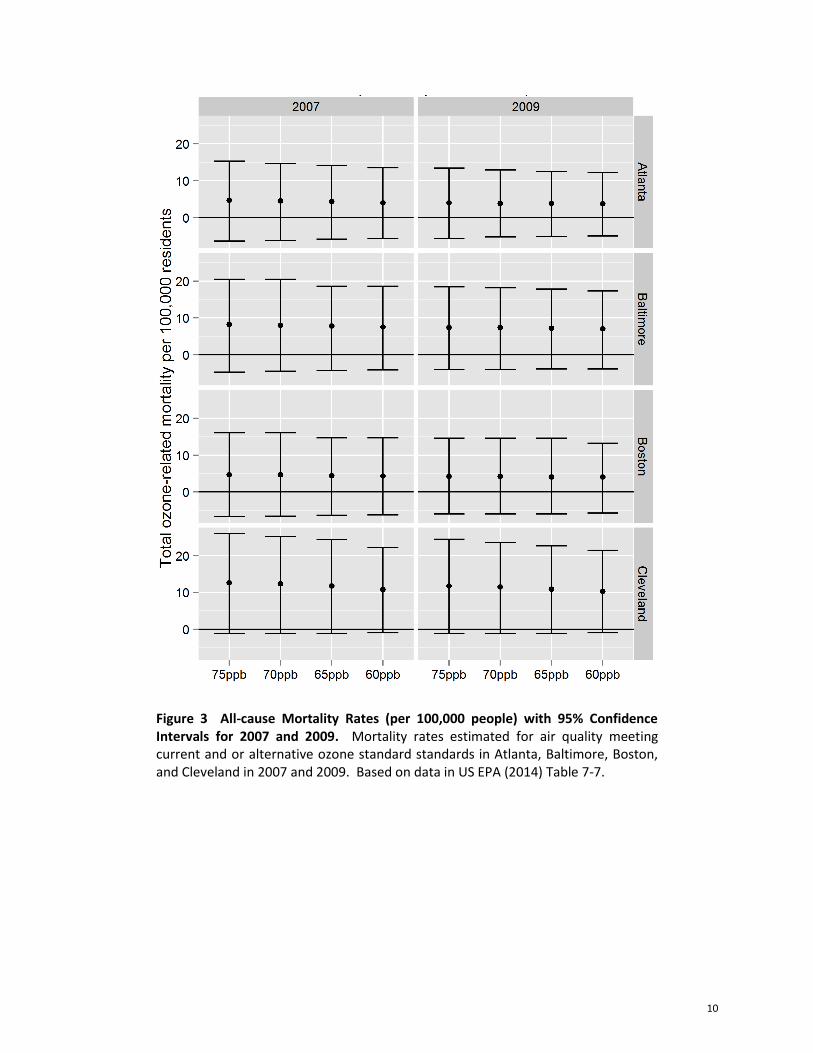
EPA's presentation of mortality rates in graphics is sometimes misleading and should be updated.
For example, although the data are shown in tables, EPA should present mortality rate results
in figures with confidence bounds for current and alternative levels of the ozone standard. As
we show below (Figure 3), in contrast to results as presented by EPA in the REA (Figure 4
below), this approach more clearly demonstrates that there is no apparent statistical difference
in mortality at alternative ozone levels compared to current levels when considering
uncertainty.
EPA should consistently show confidence bounds in summary figures in the main REA
document.

5
Regarding a specific approach in the risk analysis, EPA posed the following question to CASAC:
What are the views of the Panel on the characterization of the degree to which these
changes in spatial patterns of O3 introduce uncertainty in risk estimates when effect
estimates based on one spatial/temporal pattern of O3 (the pattern in the epidemiology
study) are applied to a substantially different spatial/temporal pattern of O3
concentrations?
EPA should not have increased the air quality monitoring area evaluated in the risk assessment
beyond the area included in the underlying epidemiology studies in the core analysis. This
introduced considerable uncertainty.
With regard to uncertainty in the mortality risk assessment, EPA posed the following question to
CASAC:
To what extent does the Panel find that the discussion of uncertainty and variability
have covered important sources and appropriately characterized the relationship of
those sources of uncertainty and variability to the risk estimates?
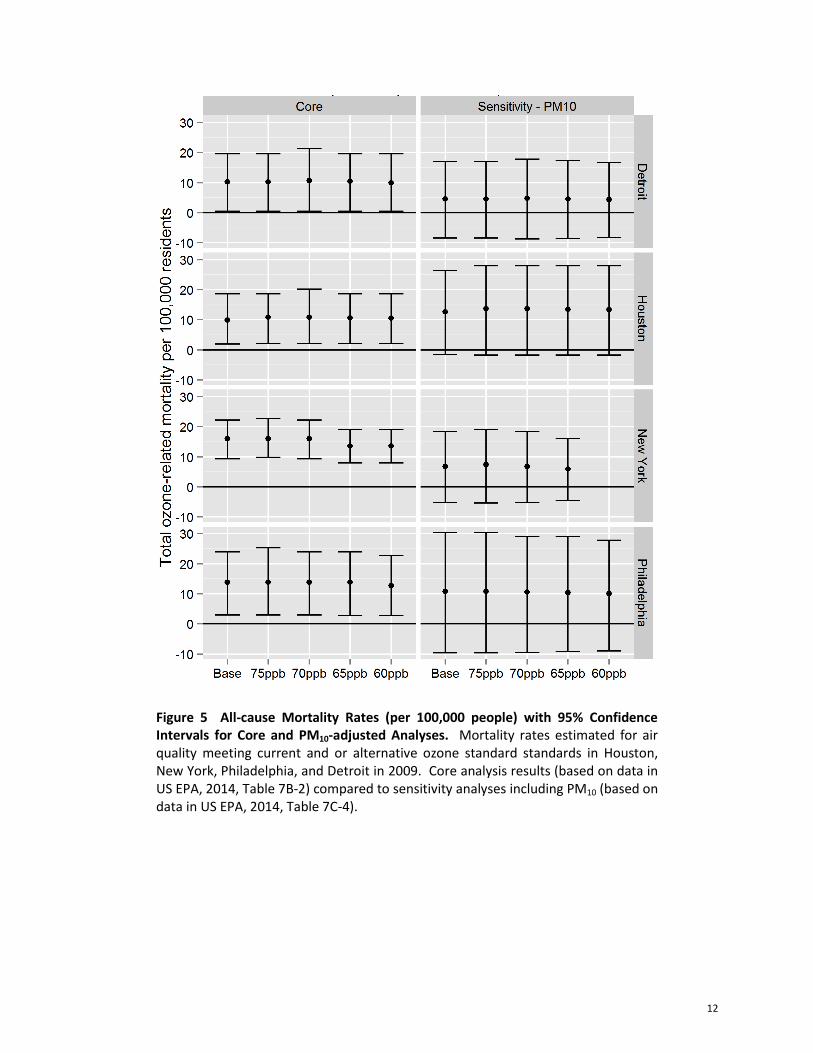
EPA did not, but should, explicitly discuss the magnitude and direction of bias from uncertainty
not included in the confidence bounds for mortality risk estimates (e.g., shape of the CRF,
confounding, model specification, exposure and outcome measurement error).
For example, Figure 5 shows that mortality estimates that were positive in core analyses are
not positive when PM10 is included in the model.
EPA should discuss the rational for the respiratory morbidity risk assessment more fully, as it is
based on much more limited data (e.g., primarily single-city studies) compared to the mortality
risk evaluation. Also, EPA should include confidence bounds for morbidity risks.
EPA should not include an evaluation of respiratory mortality associated with long-term ozone
exposure. EPA cites a single study, Jerrett et al. (2009), as support of evidence for respiratory
mortality, when other studies and a larger body of evidence do not support a causal association
with this endpoint. Thus, this analysis should not be included in the REA.
EPA should be consistent in its approach for evaluating higher-risk individuals. For example, it
justified using data based on adults for children by acknowledging a similar lung function
response, but then used inappropriate age adjustments. This led to overestimated risks.
If the REA is updated to address these recommendations, it will be evident that ozone exposure and risk
assessments do not indicate additional public health protection from lowering the ozone standard
compared to the current, health-protective standard.
Thank you for your consideration.
Sincerely,
GRADIENT
Julie E. Goodman, Ph.D., DABT Sonja N. Sax, Sc.D.
Principal Senior Environmental Scientist
email: [email protected] email: [email protected]

6
Table 1 Percents of Simulated Individuals with One or More Days in the Ozone Season with Lung Function Decrement (ΔFEV1) Greater than 10%. Table shows the minimum and maximum percents across all cities and years (US EPA, 2014, Table 6-4).
7
Table 2 Percents of Simulated Individuals with One or More Days in the Ozone Season with Lung Function Decrement (ΔFEV1) Greater than 15%. Table shows the minimum and maximum percents across all cities and years (US EPA, 2014, Table 6-5).
8
Figure 1 Average Percent of All School-age Children with at Least Two Daily 8-hr Maximum Exposures Greater than or Equal to 70 ppb for Air Quality Scenarios of Just Meeting the Current and Alternative Ozone Standards. Figure reproduced from EPA (2014) Figure 5F-13, Appendix 5F.

9
Figure 2 Average Percent of All School-age Children with at Least One Daily 8-hr Maximum Exposures Greater than or Equal to 60 ppb for Air Quality Scenarios of Just Meeting the Current and Alternative Ozone Standards. Figure reproduced from EPA (2014) Figure 9-3.
10
Figure 3 All-cause Mortality Rates (per 100,000 people) with 95% Confidence Intervals for 2007 and 2009. Mortality rates estimated for air quality meeting current and or alternative ozone standard standards in Atlanta, Baltimore, Boston, and Cleveland in 2007 and 2009. Based on data in US EPA (2014) Table 7-7.

11
Figure 4 All-cause Mortality Rates for Just Meeting Existing (75 ppb) and Alternative Standards for 2007 and 2009. Reproduced from US EPA (2014) Figure 9-6.
12
Figure 5 All-cause Mortality Rates (per 100,000 people) with 95% Confidence Intervals for Core and PM10-adjusted Analyses. Mortality rates estimated for air quality meeting current and or alternative ozone standard standards in Houston, New York, Philadelphia, and Detroit in 2009. Core analysis results (based on data in US EPA, 2014, Table 7B-2) compared to sensitivity analyses including PM10 (based on data in US EPA, 2014, Table 7C-4).

13
References
American Thoracic Society (ATS). 2000. "What constitutes an adverse health effect of air pollution?"
Am. J. Respir. Crit. Care Med. 161:665-673.
Goodman, JE; Prueitt, RL; Chandalia, J; Sax, SN. 2013. "Evaluation of adverse human lung function
effects in controlled ozone exposure studies." J. Appl. Toxicol. doi :10.1002/jat.2905.
Goodman, JE; Sax, S. [Gradient]. 2012. "Comments on the Health Risk and Exposure Assessment for
Ozone: First External Review Draft (Draft)." Report to American Petroleum Institute (Washington, DC).
46p., September 13.
Jerrett, M; Burnett, RT; Pope, CA; Ito, K; Thurston, G; Krewski, D; Shi, Y; Calle, E; Thun, M. 2009.
"Long-term ozone exposure and mortality." N. Engl. J. Med. 360(11):1085-1095.
McDonnell, WF; Stewart, PW; Smith, MV; Kim, CS; Schelegle, ES. 2012. "Prediction of lung function
response for populations exposed to a wide range of ozone conditions." Inhal. Toxicol. 24(10):619-633.
Pellegrino, R; Viegi, G; Brusasco, V; Crapo, RO; Burgos, F; Casaburi, R; Coates, A; van der Grinten,
CP; Gustafsson, P; Hankinson, J; Jensen, R; Johnson, DC; MacIntyre, N; McKay, R; Miller, MR;
Navajas, D; Pedersen, OF; Wanger, J. 2005. "Interpretative strategies for lung function tests." Eur.
Respir. J. 26(5):948-968.
US EPA. 2014. "Health Risk and Exposure Assessment for Ozone (Second External Review Draft)."
EPA-452/P-14-004a; EPA-452/P-14-004b; EPA-452/P-14-004c; EPA-452/P-14-004d; EPA-452/P-14-
004e; EPA-452/P-14-004f. Accessed on February 03, 2014 at http://www.epa.gov/ttn/naaqs/standards/
ozone/s_o3_2008_rea.html, January.
Evaluation of adverse human lung functioneffects in controlled ozone exposure studiesJulie E. Goodman,a* Robyn L. Prueitt,b Juhi Chandaliaa andSonja N. Saxa
ABSTRACT: The US EPA is evaluating controlled human ozone exposure studies to determine the adequacy of the currentozone National Ambient Air Quality Standard of 75 ppb. These studies have shown that ozone exposures of 80 ppb andgreater are associated with lung function decrements. Here, we critically review studies with exposures below 80 ppb todetermine the lowest ozone concentration at which decrements are causally associated with ozone exposure and could beconsidered adverse using the Adverse Effects/Causation Framework. Regarding causation, the framework includesconsideration of whether exposure-related effects are primary or secondary, statistically significant, isolated or independent,or due to study limitations. Regarding adversity, the framework indicates one should consider whether effects are adaptive,compensatory, precursors to an apical effect, severe, transient and/or reversible. We found that, at exposures below 72 ppbozone, lung function effects are primary effects, but are isolated, independent and not statistically different compared toeffects observed during filtered air exposure, indicating a lack of causation. Up to 72 ppb, lung function effects may be pre-cursors to an apical effect, but are not likely adverse because they are transient, reversible, of low severity, do not interferewith normal activity and do not result in permanent respiratory injury or progressive respiratory dysfunction. Overall, thesestudies do not demonstrate a causal association between ozone concentrations in the range of the current National AmbientAir Quality Standard and adverse effects on lung function. Copyright © 2013 John Wiley & Sons, Ltd.
Keywords: criteria pollutants; inhalation exposure; pulmonary disease; ozone; human exposure; adverse effects; pulmonary function;causality; NAAQS
IntroductionAcute ozone exposure can produce reversible lung functiondecrements and transient respiratory symptoms, such as coughing,wheezing and chest pain (US EPA, 2006). Studies of humanssubjected to ozone under controlled conditions have consistentlyshown these effects with ozone exposures of 80 ppb and greater(US EPA, 2006), but the lowest ozone concentration at which theseeffects occur and, importantly, the lowest concentration at whichthey should be considered to be adverse, is under debate.
The current primary ozone National Ambient Air Quality Standard(NAAQS) set by the United States Environmental Protection Agency(US EPA) in 2008 is 75 ppb (US EPA, 2008), although this is currentlyunder review. In August 2012, US EPA released the first draft PolicyAssessment (US EPA, 2012a), in which it stated that evidencepresented in the third draft Integrated Science Assessment(US EPA, 2012b) and the first draft Risk and Exposure Assessment(US EPA, 2012c) ‘calls into question the adequacy of the currentstandard and provides strong support for considering potentialalternative standards to increase public health protection’ (US EPA,2012a). Part of the evidence cited by US EPA came from humanstudies with controlled ozone exposures below 80 ppb.
Biological changes in response to an environmental exposureoccur along a continuum that may eventually lead to adverseeffects, depending on exposure dose and duration [NationalResearch Council (NRC), 2007]. Many types of changes may fallalong the continuum, but some changes are mild and transientand do not result in long-term adverse outcomes. For example,if the perturbation of a normal biological pathway is smallenough, it will cause an adaptive response to maintain
homeostasis. Because the body is able to adapt to various envi-ronmental stresses to maintain homeostasis, most substancesdo not cause adverse effects unless they are at a dose sufficientto overwhelm these processes over a certain period (Goodmanet al., 2010). Distinguishing non-adverse from adverse effects iscritical for determining the dose at which an exposure can resultin a detrimental health outcome.We critically reviewed the recent controlled human studies
with exposures below 80 ppb. We applied the recentlydeveloped Adverse Effects/Causation Framework (Goodmanet al., 2010) to assess causality and characterize the degree ofadversity of the respiratory effects reported in these controlledhuman ozone exposure studies.
Methods
Literature Search
We conducted a literature search in PubMed for studies of lungfunction effects in humans after controlled exposure to ozone.Search terms included expos*, ozone, pulmonary, lung, respiratory,response, function, human and forced expiratory volume in 1 s(FEV1). We limited our analysis to studies that examined ozone
*Correspondence to: Julie E. Goodman, Gradient, 20 University Road, Suite 5,Cambridge, MA 02138, USA. E-mail: [email protected]
aGradient, 20 University Road, Suite 5, Cambridge, MA, 02138, USA
bGradient, 600 Stewart Street, Suite 803, Seattle, WA, 98101, USA
J. Appl. Toxicol. 2013 Copyright © 2013 John Wiley & Sons, Ltd.
Research Article
Received: 17 January 2013, Revised: 16 May 2013, Accepted: 19 May 2013 Published online in Wiley Online Library
(wileyonlinelibrary.com) DOI 10.1002/jat.2905
This Electronic Copy of Copyrighted Material Was Made and Delivered for Governmental Regulatory/Judicial Purposes Under License from Copyright Clearance Center, Inc. - No Further Reproduction is Permitted without a Separate License.

concentrations relevant to the current primary ozone NAAQS of 75ppb and informative for the determination of the Lowest ObservableAdverse Effect Concentration (LOAEC) for lung function effects ofozone. Studies that evaluated only high exposures (i.e., > 80 ppb)were excluded from the analysis.
The Adverse Effects/Causation Framework
We evaluated the relevant controlled exposure studies using theAdverse Effects/Causation Framework described by Goodmanet al. (2010). The framework describes several factors that shouldbe considered for determining both causation and adversity.Regarding causation, primary exposure-related effects aremuch more reliable indicators of causation than effects thatare secondary (e.g., DNA damage because of cytotoxicity).Statistical significance is also a key factor for determiningcausality. Although there are many reasons that a trueassociation might not be statistically significant in a particularstudy, if an association is statistically significant, it is muchmore likely to be indicative of a true association. Similarly, inmost cases, if an effect is isolated (occurring in very few studysubjects) or independent (occurring in the absence of othereffects that are expected via the same mode of action), it is not aslikely to be causally related to an exposure. By definition, bothisolated and independent effects occur inconsistently and likelyreflect biological effects from another cause or measurement errorrather than effects from a given exposure (Lewis et al., 2002). Ifobserved effects are a result of study limitations (e.g., exposuremeasurement error, confounding), they are not likely to beindicative of causation.
Regarding adversity, adaptive effects are changes that occur inresponse to environmental stressors to maintain normal functionin an organism and enhance its ability to respond to additionalstressors. Adaptive effects are not considered adverse. Compensa-tory effects also maintain normal function of an organism withoutenhancement of response to further environmental insults. Ifcompensatory effects occur over a short period, they are notconsidered adverse. Transient effects are initial responses to anenvironmental exposure that are not sustained throughout theexposure period. Effects are reversible if the subject recoverscompletely at some point after exposure has ended. Both transientand reversible effects are less likely to be considered adverse. Earlyprecursors of apical effects, effects of low severity and effects thatare not severe (i.e., do not result in functional impairment) are lesslikely to be adverse. It should also be noted that there could beeffects that occur after an exposure that are not homeostatic, butthey are unrelated to any toxic effect of that particular exposure.These effects should not be considered adverse.
Sir Austin Bradford Hill (1965) put forth nine guidelines thatshould be considered when evaluating causation that also applyto evaluations of adversity. He cautioned:
None of my nine viewpoints can bring indisputable evidencefor or against the cause-and-effect hypothesis and none canbe required as sine qua non. What they can do, with greateror less strength, is to help us make up our minds on thefundamental question – is there any other way of explainingthe facts before us, is there any other answer equally, ormore, likely than cause and effect?
The Adverse Effects/Causation Framework should be used andinterpreted in the samemanner. It should not be used as a checklist,
but rather all of the factors should be considered and they shouldeach inform the interpretation of each other. For example, a non-statistically significant association is more likely to be indicative ofcausation if it occurs with other effects that are expected based onthe mode of action.
We evaluated controlled human exposure studies using theframework to determine the No Observable Adverse EffectConcentration (NOAEC) or the level at which no adverse effectsare observed, and the LOAEC or the level at which adverseeffects are observed because of ozone exposure.
Controlled Exposure StudiesWe reviewed studies that evaluated concentrations of ozonebelow 80 ppb because such concentrations are relevant to thecurrent primary ozone NAAQS of 75 ppb and are informative fordetermining the LOAEC for lung function effects. These studiesinvolved healthy young adults who were exposed to controlledconcentrations of ozone through a facemask inhalation systemor via whole-body exposure in an environmental chamber forperiods of up to 6.6 h. Because physical activity increases ventila-tion rate, which in turn increases the dose of inhaled ozone at agiven concentration relative to an individual at rest, the subjectsperformed quasi-continuous exercise (QCE) during the exposureperiod (i.e., 50 min of continuous exercise followed by 10 min ofrest each hour). All of the studies included a control scenario inwhich subjects were exposed to filtered air (FA) with no ozone.
Lung function and respiratory symptoms were generallyassessed once during each hour of exposure. Lung function ef-fects were evaluated via spirometry to determine temporalchanges in FEV1, forced vital capacity (FVC) and the ratio ofFEV1/FVC. FEV1 is the amount of air that can be exhaled fromlungs in the first second of a forced exhalation. FVC is a measureof the maximum amount of air that can be exhaled from lungsafter a maximum inspiration. The FEV1/FVC ratio, also calledthe Tiffeneau index, is used in the diagnosis of obstructive andrestrictive lung disease. In obstructive lung disease, this ratio isreduced because of a reduction in FEV1. In contrast, forrestrictive lung disease, the FVC is reduced because of fibrosis orother lung pathology, and the ratio is larger due to an increasedFEV1. Ventilatory disease, which encompasses aspects of bothobstructive and restrictive patterns, can result in decreases of bothFEV1 and FVC, resulting in a ratio similar to 1.
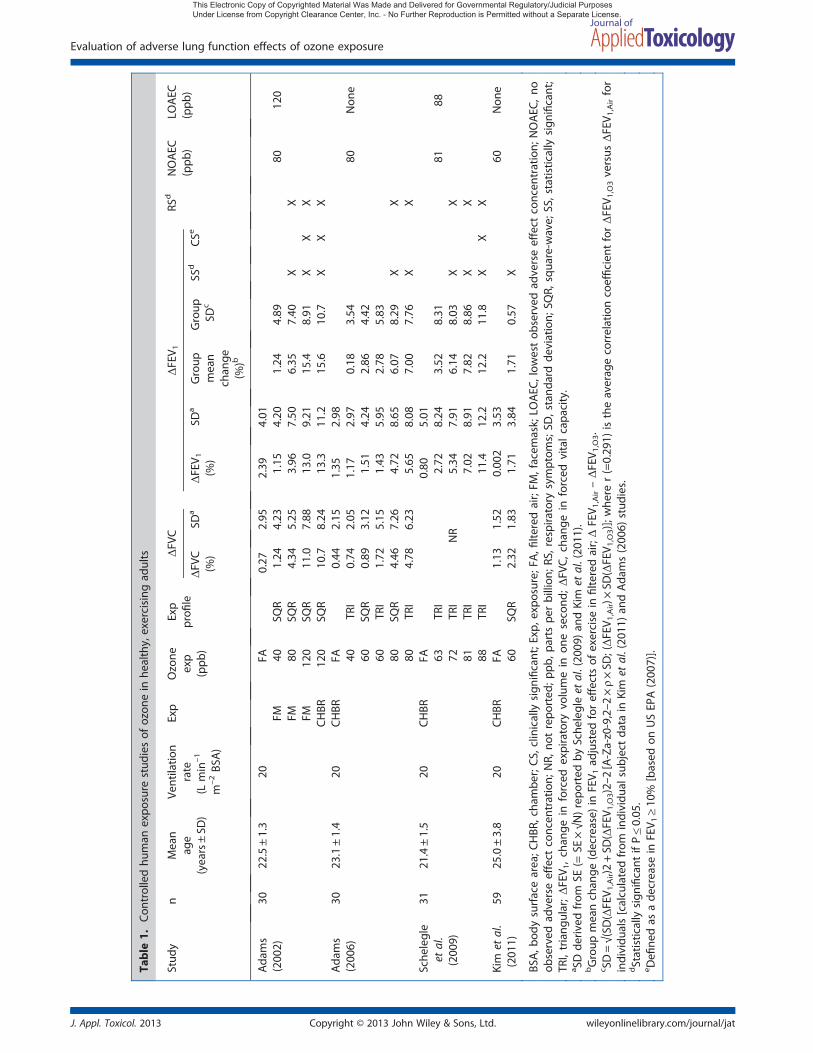
In general, the controlled human exposure studies we reviewedwere not designed to assess ozone effects in individuals; rather, theywere designed to determine whether, at a given exposure level, thedata support ozone as a cause of lung function effects or respiratorysymptoms at the group level. The studies deviated primarily in thestatistical analyses of the results. The relevant studies that were iden-tified are summarized in Table 1 and described below.
Adams (2002)
Adams (2002) investigated lung function effects and respiratorysymptoms in 30 healthy, non-smoking young adults (15 of eachsex; mean age of 22 years) exposed to ozone for 6.6 h. He usedfive experimental protocols with square-wave exposures, inwhich ozone concentrations were maintained at a constantvalue throughout the exposure period. Two protocols includedexposure to 120 ppb ozone (facemask or chamber exposure);the other protocols included facemask exposures at 80 ppband 40 ppb ozone and a chamber exposure to FA. The subjects
J. E. Goodman et al.
J. Appl. Toxicol. 2013Copyright © 2013 John Wiley & Sons, Ltd.wileyonlinelibrary.com/journal/jat
This Electronic Copy of Copyrighted Material Was Made and Delivered for Governmental Regulatory/Judicial Purposes Under License from Copyright Clearance Center, Inc. - No Further Reproduction is Permitted without a Separate License.
Table
1.Con
trolledhu
man
expo
sure
stud
iesof
ozon
ein
healthy,exercising
adults
Stud
yn
Mean
age
(years±SD
)
Ventilatio
nrate
(Lmin
–1
m–2BS
A)
Exp
Ozone
exp
(ppb
)
Exp
profi
leΔFV
CΔFEV 1
RSd
NOAEC
(ppb
)LO
AEC
(ppb
)ΔFV
C(%
)SD
aΔFEV 1
(%)
SDa
Group
mean
chan
ge(%
)b
Group
SDc
SSd
CSe
Ada
ms
(200
2)30
22.5±1.3
20FA
0.27
2.95
2.39
4.01
FM40
SQR
�1.24
4.23
�1.15
4.20
�1.24
4.89
8012
0FM
80SQ
R�4
.34
5.25
�3.96
7.50
�6.35
7.40
XX
FM12
0SQ
R�1
1.0
7.88
�13.0
9.21
�15.4
8.91
XX
XCHBR
120
SQR
�10.7
8.24
�13.3
11.2
�15.6
10.7
XX
XAda
ms
(200
6)30
23.1±1.4
20CHBR
FA�0
.44
2.15
1.35
2.98
40TR
I�0
.74
2.05
1.17
2.97
�0.18
3.54
80Non
e60
SQR
�0.89
3.12
�1.51
4.24
�2.86
4.42
60TR
I�1
.72
5.15
�1.43
5.95
�2.78
5.83
80SQ
R�4
.46
7.26
�4.72
8.65
�6.07
8.29
XX
80TR
I�4
.78
6.23
�5.65
8.08
�7.00
7.76
XX
Sche
legle
etal.
(200
9)
3121
.4±1.5
20CHBR
FA
NR
0.80
5.01
63TR
I�2
.72
8.24
�3.52
8.31
8188
72TR
I�5
.34
7.91
�6.14
8.03
XX
81TR
I�7
.02
8.91
�7.82
8.86
XX
88TR
I�1
1.4
12.2
�12.2
11.8
XX
XKim
etal.
(201
1)59
25.0±3.8
20CHBR
FA�1
.13
1.52
�0.002
3.53
60Non
e60
SQR
�2.32
1.83
�1.71
3.84
�1.71
0.57
X
BSA,b
odysurfacearea;C
HBR
,cha
mbe
r;CS,
clinically
sign
ificant;E
xp,e
xposure;
FA,fi
lteredair;FM
,facem
ask;LO
AEC
,low
estob
served
adverseeffect
concen
tration;
NOAEC
,no
observed
adverseeffect
concen
tration;
NR,
notrepo
rted
;ppb
,parts
perbillion
;RS,
respira
tory
symptom
s;SD
,stand
ardde
viation;
SQR,
squa
re-w
ave;
SS,statistically
sign
ificant;
TRI,triang
ular;ΔFEV 1,chan
gein
forced
expiratory
volumein
onesecond
;ΔFV
C,chan
gein
forced
vitalcapa
city.
a SDde
rived
from
SE(=
SE×√N
)repo
rted
bySche
legleet
al.(20
09)an
dKim
etal.(20
11).
bGroup
meanchan
ge(decrease)
inFEV 1
adjusted
foreffectsof
exercise
infilte
redair;ΔFEV 1
,Air–ΔFEV 1
,O3.
c SD=√(SD
(ΔFEV 1
,Air)2+SD
(ΔFEV 1
,O3)2–2
[A-Za-z0-9,2–2
×ρ×SD
;(ΔFEV 1
,Air)×
SD(ΔFEV 1
,O3)];
whe
rer(=0.29
1)istheaverag
ecorrelationcoefficien
tforΔFEV 1
,O3versus
ΔFEV 1
,Airfor
individu
als[calculatedfrom
individu
alsubjectda
tain
Kim
etal.(20
11)an
dAda
ms(200
6)stud
ies.
dStatistically
sign
ificant
ifP≤0.05
.eDefi
nedas
ade
crease
inFEV 1
≥10
%[based
onUSEP
A(200
7)].
Evaluation of adverse lung function effects of ozone exposure
J. Appl. Toxicol. 2013 Copyright © 2013 John Wiley & Sons, Ltd. wileyonlinelibrary.com/journal/jat
This Electronic Copy of Copyrighted Material Was Made and Delivered for Governmental Regulatory/Judicial Purposes Under License from Copyright Clearance Center, Inc. - No Further Reproduction is Permitted without a Separate License.
performed QCE during the exposure period, alternating betweena cycle ergometer and a treadmill each hour. A minuteventilation rate (VE) of ~ 20 L min–1 m–2 of body surface areawas maintained during exercise. After the first 3 h of exposure,the subjects were given a brief lunch break, during which theywere exposed to ozone in chamber (but not facemask) protocols.The endpoints examined in this study were percentage changesin FEV1 and FVC, absolute changes in self-reported total symp-tom severity (TSS) and pain on deep inspiration (PDI). Allendpoints were evaluated before, after and hourly during the6.6 h experimental protocol.
To analyze the data, Adams (2002) used a two-way analysis ofvariance (ANOVA) with repeated measures, which tested forozone concentration and exposure protocol (facemask versuschamber) and time effects on lung function. In this type ofanalysis, individual subjects are measured multiple times, eachserving as his or her control. Upon obtaining a statistically signif-icant F statistic, the Scheffe post hoc test was used to assessdifferences between the mean values for each time point andfor each protocol (a total of five protocols × six time points = 30mean values), which resulted in (30 × 29)/2 = 435 comparisons.
Adams (2002) reported statistically significant effects on lungfunction at ozone concentrations of 80 ppb and 120 ppb, butnot 40 ppb. Based on the Scheffe test, the mean percentagechanges in FEV1 and FVC in the post-exposure group for the two120 ppb protocols were greater than for the other threeprotocols (P< 0.05). In addition, the changes were greater forthe 80 ppb protocol than the 40 ppb and FA protocols (P< 0.05),which did not differ from one another. As shown in Table 1, thegroup mean decrement in FEV1 after exposure to 80 ppb ozonerelative to FA was 6.35%, and for the 120 ppb protocols, the groupmean FEV1 decrement ranged from 15.4 to 15.6% relative to FA.Post-exposure decrements in FVC ranged from 11.0 to 11.2% forthe 120 ppb protocols and 4.6% following 80 ppb ozone relativeto FA. Observed changes in FEV1 and FVC both decreased suchthat there was little difference in the FEV1/FVC ratio after exposure.Both post-exposure TSS and PDI were increased with the 80 and120 ppb protocols compared to the FA protocol (P< 0.05). Adams(2002) concluded that the results for the chamber and facemaskexposures at 120 ppb were equivalent, but noted high individualsubject variability in responses with the 80 ppb protocol.
Adams (2006)
Adams (2006) examined the lung function effects of time-depen-dent chamber exposures to ozone for 6.6 h in 30 healthy, non-smoking young adults (15 of each sex; mean age of 23 years). Muchof the experimental study design followed the structure of hisprevious study (i.e., Adams, 2002); one difference is the concentra-tion–time profile of exposure because one of the goals of the newerstudy was to investigate the differences between triangular andsquare-wave exposure scenarios. In the triangular exposure profile,ozone concentrations were increased step-wise each hour for thefirst 4 h then decreased in the last 2 h of exposure. This was doneto achieve an overall cumulative average equal to a specified levelthat was also used as a uniform or square-wave exposure in a sepa-rate experiment. The triangular exposure profile better approximatesthe typical pattern of daytime ambient ozone concentrations thanthe square-wave profile (Adams, 2006; Lefohn et al., 2010). Adams(2006) used six different experimental protocols: standard square-wave concentration profiles at 0 (FA), 60 and 80 ppb ozone andtriangular concentration profiles at 40, 60 and 80 ppb ozone. The
same endpoints were examined as in the study by Adams (2002)before, after and at 1 h intervals during exposure. The subjectsperformed QCE to maintain a VE of 20 L min–1 m–2 body surfacearea, a precedent set by earlier studies. Characteristics such as age,height, weight, body fat, VO2max and baseline pulmonary measures(FEV1, FVC, FEV1/FVC) were recorded and summarized as a group,but were not directly assessed in the data analyses as possibleconfounders.
Similar to the Adams (2002) study, the data in this study wereanalyzed using a two-way ANOVA with repeated measures. Theanalysis tested for ozone concentration and exposure protocol(square-wave versus triangular) and time effects on lung func-tion and was followed by the Scheffe post hoc test to assessdifferences between the mean values.
Adams (2006) reported statistically significant decrements inlung function only with the 80 ppb exposure protocols. As shownin Table 1, the post-exposure groupmean percentage changes inFEV1 andFVC for the two80ppbprotocolsweregreater than thosefor theFA,40ppbtriangular, 60ppbsquare-waveand60ppbtrian-gularexposureprotocols (P< 0.05 for all),whichdidnotdiffer fromoneanother. Specifically, Adams (2006) reportedgroupmeandec-rements in FEV1 of 6.1% and 7.0% relative to FA for the square-wave and triangular 80 ppb ozone exposures, respectively. Adose-dependent group mean decrement in FVC was also ob-served, with maximal FVC change of 4.9% for square-wave and5.2% for triangular protocols at 80 ppb ozone relative to FA.Changes in FEV1 and FVC were observed concurrently, andtherefore the ratio of FEV1/FVC remained relatively unchangedacross exposure levels. Post-exposure TSS andPDIwere increased,relative to the FA protocol, for the two 80 ppb exposure protocols(P< 0.05), whereas for all other ozone exposure protocols, post-exposure scores were indistinguishable from those of the FAprotocol. Adams (2006) also noted that for a nominal exposureconcentration, triangular exposures caused effects on lungfunction earlier than equivalent square-wave protocols.
Schelegle et al. (2009)
Schelegle et al. (2009) conducted chamber exposure studies on31 healthy, non-smoking young adults (16 females, 15 males; meanage of 21 years) using 6.6 h triangular exposure profiles with meanambient ozone concentrations of 63, 72, 81 and 88 ppb, as well asFA. The subjects performed QCE as in the studies by Adams (2002,2006), and a 35 min lunch break was given after 3 h in the chamberat the ozone concentration used during the third hour. FEV1, FVCand TSS were measured at multiple time points up to 6.6 h of expo-sure, as well as 1 h post-exposure, and, in a subset of 13–17 subjects(depending on concentration), 4 h post-exposure.
Schelegle et al. (2009) used three different statistical methodsto address different analytical issues, such as repeated measure-ments, multiple comparisons and non-parametric data. Thesetechniques were mixed-effects two-way ANOVA (with ozoneconcentration and time as factors) with Tukey's adjustment for mul-tiple comparisons (also known as the Tukey–Kramer adjustment),mixed-effects one-way ANOVA (with ozone concentration as thefactor) with Dunnett's adjustment for multiple comparisons againsta single control (FA), and Friedman's non-parametric test withDunnett's adjustment. For the latter two methods, the authorsrestricted the statistical analyses to the FEV1 decrements at 6.6 honly. The use of the mixed-effects ANOVA technique addressedsubject variability. None of these statistical methods yielded a statis-tically significant group mean FEV1 decrement with exposure to 63
J. E. Goodman et al.
J. Appl. Toxicol. 2013Copyright © 2013 John Wiley & Sons, Ltd.wileyonlinelibrary.com/journal/jat
This Electronic Copy of Copyrighted Material Was Made and Delivered for Governmental Regulatory/Judicial Purposes Under License from Copyright Clearance Center, Inc. - No Further Reproduction is Permitted without a Separate License.

ppb ozone for 6.6 h (P> 0.05), yet all were statistically significant forthe 72 (P< 0.01), 81 (P< 0.001) and 88 ppb (P< 0.0001) ozoneexposure protocols. Similarly, increases in TSS were associated withexposure to 72, 81 and 88 ppb ozone (P< 0.05), but not with expo-sure to 63 ppb ozone. After 6.6 h of exposure to 63 ppb ozone, theauthors observed a groupmean FEV1 decrement of 3.5% (relative toFA) versus 6.1% at 72 ppb ozone. Statistically significant groupmeandecrements in FEV1 were observed only at 6.6 h at the 72 ppb expo-sure level, while no statistically significant differences were reportedat any time point for FVC at this level. Statistically significant changesin the FEV1/FVC ratio were only observed at the 5.6 h and 6.6 h timepoints for the 81 ppb ozone exposure level. In sum, Schelegle et al.(2009) found that the lowest mean ozone concentration associatedwith a statistically significant decrease in FEV1 after 6.6 h of exposurerelative to baseline, without any concomitant decrement in FVC,was 72 ppb.
Kim et al. (2011)
Kim et al. (2011) exposed 59 healthy, non-smoking young adults(32 females, 27 males; mean age of 25 years) to FA and 60 ppbozone (square-wave) for 6.6 h under controlled chamber condi-tions to evaluate the changes in FEV1, FVC and TSS relative tobaseline. As in the studies described above, the subjectsperformed QCE during the exposure period, with a 35 min lunchbreak in the chamber. Lung function was measured beforebeginning the initial QCE period; during the 10 min rest periodsafter 3, 4.6 and 5.6 h; and immediately after the 6.6 h exposureperiod. The authors stated that they analyzed only the measure-ments taken before the first hour and after the sixth hour ofexposure because they believed this would limit the need formultiple comparisons. They used linear mixed-effects modelswith subject-specific random intercepts to account for subject-level variability and repeated measures. Kim et al. (2011)reported a statistically significant mean percentage change inFEV1 (FA adjusted) of �1.7 (95% CI: –3.0, –0.5, P = 0.008) and astatistically significant decrement in FVC (FA adjusted) of1.2 ± 0.51% (P = 0.02). In addition, the authors noted an increasein neutrophilic inflammation of the airways in male subjects.Lastly, exposure to 60 ppb ozone in this study was not associ-ated with any statistically significant increase in TSS.
Results and DiscussionAdverse lung function decrements have been consistentlyobserved with controlled human exposures to ozone of at least80 ppb, but the evidence for lower exposures is less clear. Wepreviously described a framework that evaluates effects foundalong a continuum of biological changes to determine whetherexposure is likely to be causal and an effect likely to be adverse(Goodman et al., 2010). We applied this framework to estimatethe lowest ozone concentration that can cause adverse lungfunction effects in controlled exposure studies.
Causality
We applied the Adverse Effects/Causation Framework to deter-mine the exposure level at which ozone may be causally associ-ated with adverse lung function effects. The framework,described above and in more detail in Goodman et al. (2010),specifies several factors that should be considered to determinewhether an association between an exposure and a health effect
is likely to be causal. These include a consideration of whetheran observed effect is a primary effect, isolated or independent,statistically significant and/or a result of study limitations.A change in FEV1 or FVC can be considered a primary effect, as
they each can be a direct result of ozone exposure. The observedFEV1 and FVC decrements in the controlled human exposurestudies are isolated at exposure levels below about 72 ppb inthat they occur in a very small number of study subjects. Inaddition, these decrements occurred independent of othereffects (e.g., respiratory symptoms) at these exposure levels.Independent and isolated effects are not likely indicative ofcausation.For an exposure to be considered causal of an effect, the asso-
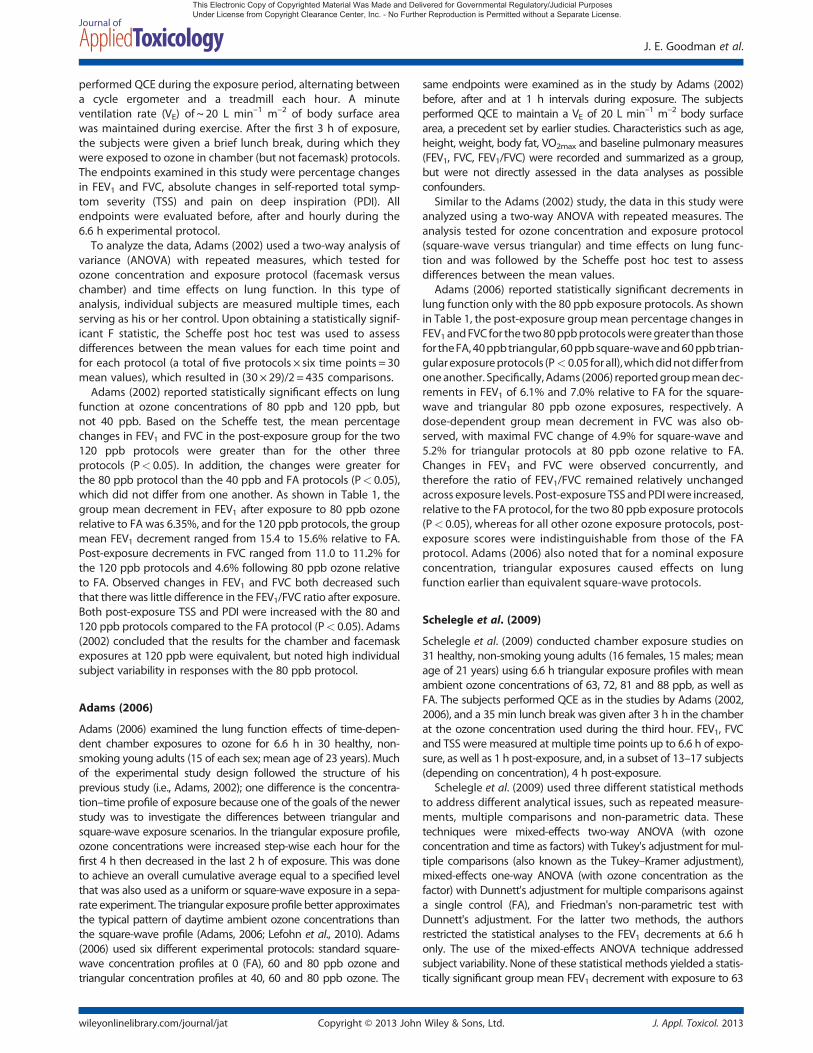
ciation between the two should be statistically significant basedon an appropriate statistical test. To best determine effects at ex-posures below 80 ppb, one could conduct a meta-regression ofall relevant data (at all exposure levels and all time points) ineach relevant study (i.e., Adams, 2002, 2006; Schelegle et al.,2009; Kim et al., 2011). The results presented by study authors,shown in Fig. 1, represent the overall post-exposure FEV1changes. Because each study did not provide intermediate datapoints, we were unable to conduct such an analysis. Therefore,below, we discuss individual studies, as well as a few quantita-tive evaluations of relevant studies.Adams (2002, 2006) used the Scheffe post hoc test to assess
several ozone protocols and time points. The Scheffe test is acommonly used statistical test to compare mean values becauseit minimizes false positive results; however, it can also producefalse negative results. Nicolich (2007) analyzed the entire FEV1data set using a mixed-model ANOVA and Dunnett's post hoctest, which is less likely to produce false negative results thanthe Scheffe test. We found that the results from this analysiswere consistent with the original findings of Adams (2006); therewas no statistically significant group mean decrement in FEV1after 6.6 h of exposure to 60 ppb ozone versus FA.In a separate evaluation of controlled human exposure stud-
ies, Brown et al. (2008) reanalyzed the FEV1 study results fromAdams (2006) using the nonparametric sign test as the primarystatistical method to test the hypothesis that FEV1 responsesfor the FA and 60 ppb exposure protocols differed. They alsoused the Wilcoxon signed rank test and paired t-test in theirreanalysis. Both the sign test and Wilcoxon signed rank test arenonparametric tests that do not rely on the assumptions ofnormal distributions.We note that a major limitation of the Brown et al. (2008)
analysis is that they used only a subset of the Adams (2006) data.They analyzed the data as if they were from a study that mea-sured only pre- and post-exposure results for FA and the 60ppb square-wave protocol; data from other protocols and mea-surements taken at intermediate time points were ignored.Omitting the majority of the data from their analysis likely biasedthe results away from the null. Based on their statisticalapproach, Brown et al. (2008) reported the same 2.85% decreasein FEV1 with the 60 ppb square-wave ozone protocol (relative toFA) as reported by Adams (2006), but reported results asstatistically significant.Regarding the study by Schelegle et al. (2009), the authors
implemented a mixed-effects two-way ANOVA, as well as theTukey–Kramer adjustment for multiple comparisons, that usedall available data. The authors did not find statistically significanteffects of ozone on FEV1 or FVC at 63 ppb using these statisticalmethods. Schelegle et al. (2009) also used two additional
Evaluation of adverse lung function effects of ozone exposure
J. Appl. Toxicol. 2013 Copyright © 2013 John Wiley & Sons, Ltd. wileyonlinelibrary.com/journal/jat
This Electronic Copy of Copyrighted Material Was Made and Delivered for Governmental Regulatory/Judicial Purposes Under License from Copyright Clearance Center, Inc. - No Further Reproduction is Permitted without a Separate License.
statistical approaches (ANOVA and Friedman's test, both withDunnett's test) to examine only the FEV1 data for pre-exposureand post-exposure after 6.6 h. The results of these additionalanalyses using only a subset of the data also indicated that therewas no statistically significant FEV1 decrement after exposure to63 ppb ozone.
The most recent controlled human exposure study by Kimet al. (2011) measured FEV1 and FVC at several time pointsduring the exposure period, but only analyzed the data fromthe pre-exposure and post-exposure (i.e., at 6.6 h) time points.Kim et al. (2011) reported a statistically significant group meanpercentage change in FEV1 and FVC after 6.6 h of exposure to60 ppb ozone. Like the analysis conducted by Brown et al.(2008), this analysis did not use the full data set, which likelybiased the results away from the null.
Lefohn et al. (2010) re-analyzed five controlled ozone expo-sure studies that used triangular exposures, including those byAdams (2006) and Schelegle et al. (2009). Lefohn et al. (2010)used two-way ANOVA and evaluated statistical significance byusing the Tukey's studentized range approach to account formultiple comparisons for least square means. Although theydid not subtract the FEV1 responses with FA from the ozonetreatment responses, their methodology can still be consideredconservative in that it minimizes type II errors (false negatives).Lefohn et al. (2010) did not find any statistically significantchanges in FEV1 at any measurement time associated with the40 ppb and 60 ppb profiles. In addition, they found that in fourof five studies, exposures to FA substantially improved FEV1response over the exposure period, indicating that analysesusing FA controls, such as those by Adams (2006) and Schelegleet al. (2009), may have overestimated FEV1 changes.
In addition, McDonnell et al. (2012) analyzed 23 controlledexposure studies to assess respiratory risks from ozone exposure,including those with no exposures below 80 ppb. In one of their
models, McDonnell et al. (2012) defined the threshold as 59 ppbin liters of inhaled air permin (accumulated ozone dose), accountingfor both the level of exercise and ozone concentration. This is equiv-alent to near-continuous exercise for 1 h at 60–80 ppb ozone or 2 hat 40 ppb ozone, or rest for 1 h at 180–240 ppb ozone or for 2 h at120 ppb ozone. The authors found that the threshold model fit theobserved data better than a no-threshold model, particularly at ear-lier time points and at the lowest exposure levels. These findingsindicate that there are ozone exposures at which no adverse effectsare likely to occur.
Regardless of the statistical test used, several study limitationsshould be considered when evaluating these results. For example,it is well established that inter-individual variation in FEV1 measure-ments can occur in response to other factors, but these potentialconfounding factors were not accounted for in the controlledexposure studies. Observed lung function decrements could bedue to factors unrelated to ozone. Intra-individual variation in FEV1measurements can also be substantial and has been estimated tobe about 5% for measurements taken from healthy individualswithin the same day (Pellegrino et al., 2005). This variability is alsonot fully accounted for in the controlled exposure studies and couldexplain some of the observed statistically significant lung functionchanges at lower ozone exposure levels.
Another important point is the level of exertion in thesestudies. As noted in Folinsbee et al. (1988) and McDonnellet al. (1991), the exercise regimen (i.e., 40 L min–1 for 6–8 h) usedin almost all recent human controlled exposure studiesconducted below 80 ppb ozone is meant to simulate workperformed during a day of heavy manual labor common ofoutdoor workers. As defined by US EPA (1986), exercise contin-ued at this level and duration should be considered as ‘heavy’or ‘strenuous work or play’ (e.g., US EPA, 1986, table 10–3). Thelevel of exertion and differential impact of exercise on studyparticipants, in terms of its impact on FEV1 decrements, needs
Figure 1. Forced expiratory volume in 1 s (FEV1) decrements in controlled ozone exposure studies of healthy adults with exercise. Diamonds indicate dif-ferences betweenmean FEV1 decrements after ozone exposure and FEV1 decrements after filtered air exposure. Horizontal lines indicate 95% confidenceintervals calculated from SDs. CH, chamber exposure; FM, facemask exposure; SQR, square-wave exposure profile; TRI, triangular exposure profile.
J. E. Goodman et al.
J. Appl. Toxicol. 2013Copyright © 2013 John Wiley & Sons, Ltd.wileyonlinelibrary.com/journal/jat
This Electronic Copy of Copyrighted Material Was Made and Delivered for Governmental Regulatory/Judicial Purposes Under License from Copyright Clearance Center, Inc. - No Further Reproduction is Permitted without a Separate License.
to be considered when interpreting results. This is another reasonto analyze data from all time points, rather than restricting theanalysis to a comparison of pre- and post-exposure results.
Overall, the controlled human exposure data indicate thatthere are consistent, statistically significant decrements in FEV1at ozone concentrations of 72 ppb and above, regardless ofthe statistical test used (see Fig. 1). These decrements areprimary effects of ozone exposure. The FEV1 decrementsobserved at 60 (or 63) ppb are isolated and may be attributableto other factors unrelated to ozone. The effects at this concen-tration are only observed as statistically significant when lessappropriate statistical tests are used or when only a subset ofthe available data are used in the analysis. No statistically signif-icant decrements in FEV1 have been reported for exposure to 40ppb ozone, regardless of the statistical test. Although our causal-ity analysis focused only on the more recent studies thatincluded exposures below 80 ppb, the results are consistent withother controlled exposure studies demonstrating statisticallysignificant decrements in FEV1 at ozone concentrations of 80ppb (Horstman et al., 1990; McDonnell et al., 1991; Adams,2003a, 2003b), 100 ppb (Horstman et al., 1990; McDonnellet al., 1991) and above (as reviewed by US EPA, 2006).
Adversity
Inhaled ozone can produce vagal stimulation, resulting in physiolog-ical changes in pulmonary function, including bronchoconstriction(Schelegle et al., 1993). Antioxidants within airway lining fluid havebeen shown to prevent ozone-mediated cellular and tissueoxidation (Cross et al., 1994; Mudway et al., 1996; Avissar et al.,2000; Samet et al., 2001; Ballinger et al., 2005). Therefore, only ozoneexposure of sufficient duration and concentration can overwhelmantioxidant defenses, allowing oxidative damage to occur in airwayepithelial cells (Schelegle et al., 2007). Accordingly, a threshold existsbelow which antioxidant defenses are sufficient to protect againstadverse effects from ozone. The question to ask is what is thisthreshold? To answer this, we used the Adverse Effects/CausationFramework. We determined the degree of adversity of the observedlung function effects in the controlled exposure studies by assessingwhether effects were adaptive or compensatory, early precursors ofan apical effect (e.g., early precursors of lung disease), transient,reversible, of low severity or did not result in functional impairment.
Ozone-associated pulmonary function decrements appearassociated with both inflammatory processes and with the directactivation of nerve cells involved in response to noxious stimuli(Kim et al., 2011). Based on their rapid temporal response, smalldecrements are unlikely to be associated with tissue damage orpathologic changes associated with chronic pulmonary diseaseand they should be considered adaptive or compensatoryresponses. In contrast, large decrements in FEV1 and/or FVC couldresult in adverse effects, including impaired ventilation, such asthat found in restrictive or obstructive lung disease (Witschi et al.,2008) or a mixed (restrictive/obstructive) pulmonary abnormality(Pellegrino et al., 2005).
Adversity criteria have been established by various groupsdescribing levels of FEV1 or FVC that should be consideredadverse. For example, the American Thoracic Society (ATS)judges a reversible loss of lung function in combination withrespiratory symptoms to be adverse but does not indicate thata small and asymptomatic transient change constitutes anadverse effect (ATS, 2000). The European Respiratory Societysuggests that short-term changes in FEV1 exceeding 12% ‘may
be clinically important’ and that changes in FEV1 measurementsshould exceed 5% to overcome the intra-day variability of FEV1in normal subjects (Pellegrino et al., 2005). Clinical studies haveoften used a cut-off value of at least 20% for a decline in FEV1as the definition of a ‘mild’ asthma exacerbation (Reddel et al.,2009). US EPA (2007) considers a moderate decrement in lungfunction (defined as a decrease in FEV1 between 10% and20%) and/or respiratory symptoms to be adverse, although thisclassification has not been validated for acceptability or againstother measures (ATS, 2000). In contrast, a FEV1 decrement up to30% of predicted is considered to be ‘mild’ in the diagnostic classifi-cation of ventilatory disorders (Pellegrino et al., 2005). The minimalclinically important change for FVC in patients with pulmonarydisease is approximately 6% (du Bois et al., 2011). Therefore, ozoneeffects may be indicative of an apical effect only if FEV1 or FVCdecrements are sufficiently large.As shown in Table 1, Adams (2002) reported mean decre-
ments in FEV1 of at least 10% at an ozone exposure of 120ppb, either via facemask (15.4% decrement) or chamber (15.6%decrement), but not at exposures of 40 or 80 ppb ozone.Increased respiratory symptoms were reported with exposureto both 80 ppb and 120 ppb ozone. A mean reduction in FVCgreater than 6% was observed only at 120 ppb, where FVCwas reduced by 11%. Similarly, Adams (2006) reported no meandecrements in FEV1 that exceeded 10% or FVC that exceeded6% with exposure to 40, 60 or 80 ppb ozone, but increasedrespiratory symptoms with both triangular and square-waveexposures to 80 ppb ozone were found.Schelegle et al. (2009) also reported a mean FEV1 decrement
greater than 10% only after exposure to ozone at a concentrationabove 80 ppb. The authors reported a mean FEV1 decrement of12.2% after exposure to 88 ppb ozone but reported decrementsof 7% or less with lower exposures (63, 72 and 81 ppb ozone). Nosignificant change in FVCwas reported. Respiratory symptoms wereincreased after exposure to 72, 81 and 88 ppb but not 63 ppb ozone.Finally, Kim et al. (2011) reported a mean FEV1 decrement of 1.7%and no increase in respiratory symptoms after exposure to 60 ppbozone, but did not investigate other exposure concentrations.These findings are consistent with other controlled exposure
studies that examined 6.6 h exposures to ozone concentrationsbetween 80 and 100 ppb. At 80 ppb, other studies reportedstatistically significant group mean decrements in FEV1 rangingfrom 6–8% in conjunction with increased respiratory symptoms(Horstman et al., 1990; McDonnell et al., 1991; Adams, 2003a,2003b). Similarly, exposures to 100 ppb ozone were associatedwith statistically significant group mean FEV1 decrements of8–14% and increased symptoms (Horstman et al., 1990;McDonnell et al., 1991).Based on the ATS (2000), European Respiratory Society
(Pellegrino et al., 2005) and US EPA (2007) guidelines, we consid-ered the lung function effects of ozone in controlled humanexposure studies to be adverse if mean decrements in FEV1 wereat least 10% and accompanied by respiratory symptoms. Assuch, we defined the NOAEC as the highest level of ozone expo-sure at which FEV1 decrements were less than 10% and theLOAEC as the level of ozone exposure at which FEV1 decrementswere greater than 10% and significant respiratory symptomswere observed (Table 1). The 10% criterion may be overlyconservative given that the concomitant decrease in FVC wasonly associated with larger FEV1 responses (Schelegle et al.,2009). As shown in Table 1, the group mean FEV1 decrementsare less than 10% at ozone exposures up to 81 ppb in all studies
Evaluation of adverse lung function effects of ozone exposure
J. Appl. Toxicol. 2013 Copyright © 2013 John Wiley & Sons, Ltd. wileyonlinelibrary.com/journal/jat
This Electronic Copy of Copyrighted Material Was Made and Delivered for Governmental Regulatory/Judicial Purposes Under License from Copyright Clearance Center, Inc. - No Further Reproduction is Permitted without a Separate License.
reviewed here, and are greater than 10% only at exposures of atleast 88 ppb. In addition, respiratory symptoms were increasedonly at exposures of 80 ppb and above. A decrease in FVC ofgreater than 6% was noted only following exposure to 120ppb. Thus, only ozone exposures of at least 88 ppb should beconsidered to induce adverse health effects, albeit of lowseverity.
Studies have also shown that the FEV1 and FVC decrementsobserved after controlled human ozone exposures returned to base-line levels following the cessation of both exercise and exposure (e.g.,Schelegle et al., 2009). In addition, several studies have shown recov-ery of FEV1 decrements as the ozone concentration decreases fromthe peak value in triangular exposure profiles (Lefohn et al., 2010).This indicates that the FEV1 and FVC decrements in response toozone can be both transient and reversible. This appears related tothe removal of nervous stimulus and return to baseline activity ofvagal signaling without functional changes to tissue.
It should be noted that all of the studies evaluated wereconducted in healthy adults. As discussed above, the vigor andduration of exercise in test subjects exceeded the length andextent likely to occur in the general population. That is, testsubject respiratory rate and ventilatory capacity were increased,producing larger ozone exposures at each tested concentrationthan would be expected in the general population. Therefore,exposure to similar levels of ozone in the general population areunlikely to produce the same magnitude of respiratory changes asthose observed in these studies. In addition, there is little evidenceof differential effects of ozone exposure on susceptible populations,including asthmatics and children. For example, several controlledhuman exposure studies have found no differences in lung functioneffects between asthmatics and non-asthmatics at elevated ozoneexposures of 200–400 ppb (Basha et al., 1994; Scannell et al., 1996;Alexis et al., 2000; Mudway et al., 2001). With regard to children,several controlled exposure studies have reported that ozoneresponsiveness is similar or lower in children than in adults. In acontrolled exposure study of children, aged 8–11 years, exposedto 120 ppb ozone for 2.5 h, there were similar decrements in FEV1and fewer symptoms than those observed in adults in other studies(McDonnell et al., 1985). In an analysis of a larger data set of 741healthy young adults (mean age 23.8 years) from controlledhuman exposure studies, McDonnell et al. (2012) did not find astatistically significant effect of age on the FEV1 responses to ozoneexposures.
In summary, the small decrements in pulmonary function, asrepresented by slightly decreased mean FEV1 values with no orslight concomitant changes in FVC, observed at relatively lowozone concentrations, are of low severity because they do notinterfere with normal activity and do not result in permanent respi-ratory injury or progressive respiratory dysfunction. In addition,because the decrements in FEV1 and FVC are reversible, transientand represent a reflexive nervous response, these small changesrepresent a lesser degree of adversity than irreversible andsustained changes in cellular composition or in lung function.
ConclusionsInhaled ozone of sufficient concentration produces vagal nervestimulation and resulting physiological changes in pulmonaryfunction. These changes, including bronchoconstriction, aremeasureable apical effects. In addition, antioxidants withinairway lining fluid prevent ozone-mediated cellular and tissueoxidation in a time- and concentration-dependent manner;
ozone can cause adverse effects only when these defenses aresaturated. Therefore, a threshold exists below which nerveactivation is minimal and where antioxidant defenses aresufficient to protect against adverse effects from ozone.
Studies of humans exposed to ozone under controlledconditions indicate that ozone can cause decreased lungfunction and respiratory symptoms at sufficiently high concen-trations. We evaluated the data from studies of controlledhuman exposures below 80 ppb using the Adverse Effects/Cau-sation Framework and found that, below 72 ppb, lung functioneffects are primary effects, but are isolated, independent andnot statistically different in subjects exposed to ozone comparedto those exposed to FA, indicating a lack of causation. Up toabout 72 ppb, lung function effects are not adverse becausethey are transient, reversible and of low severity, as they donot interfere with normal activity and do not result in permanentrespiratory injury or progressive respiratory dysfunction.
Overall, controlled human exposure studies do not demonstratea causal association between ozone concentrations in the range ofcurrent NAAQS and adverse effects on lung function.
Acknowledgments
This paper was prepared with financial support to Gradient, a pri-vate environmental consulting firm, from the American PetroleumInstitute (API), a trade association representing producers, refinersand distributors of petroleum products. The work reported in thispaper was conducted during the normal course of employmentby Gradient. The authors have sole responsibility for the writingand contents of this paper. We thank Dr. Christopher Brynczkaand Dr. Sagar Thakali for their valuable input.
ReferencesAdams WC. 2002. Comparison of chamber and face-mask 6.6-hour
exposures to ozone on pulmonary function and symptoms responses.Inhal. Toxicol. 14: 745–764.
Adams WC. 2003a. Comparison of chamber and face mask 6.6-hourexposure to 0.08 ppm ozone via square-wave and triangular profileson pulmonary responses. Inhal. Toxicol. 15: 265–281.
Adams WC. 2003b. Relation of pulmonary responses induced by 6.6-hexposures to 0.08 ppm ozone and 2-h exposures to 0.30 ppm ozonevia chamber and face-mask inhalation. Inhal. Toxicol. 15: 745–759.
Adams WC. 2006. Comparison of chamber 6.6-h exposures to 0.04-0.08ppm ozone via square-wave and triangular profiles on pulmonaryresponses. Inhal. Toxicol. 18: 127–136.
Alexis N, Urch B, Tarlo S, Corey P, Pengelly D, O'Byrne P, Silverman F.2000. Cyclooxygenase metabolites play a different role in ozone-induced pulmonary function decline in asthmatics compared tonormals. Inhal. Toxicol. 12: 1205–1224.
American Thoracic Society (ATS). 2000.What constitutes an adverse health ef-fect of air pollution? Am. J. Respir. Crit. Care Med. 161: 665–673.
Avissar NE, Reed CK, Cox C, Frampton MW, Finkelstein JN. 2000. Ozone,but not nitrogen dioxide, exposure decreases glutathione peroxi-dases in epithelial lining fluid of human lung. Am. J. Respir. Crit. CareMed. 162: 1342–1347.
Ballinger CA, Cueto R, Squadrito G, Coffin JF, Velsor LW, Pryor WA,Postlethwait EM. 2005. Antioxidant-mediated augmentation of ozone-induced membrane oxidation. Free Rad. Biol. Med. 38: 515–526.
Basha MA, Gross KB, Gwizdala CJ, Haidar AH, Popovich J Jr. 1994. Bron-choalveolar lavage neutrophilia in asthmatic and health volunteersafter controlled exposure to ozone and filtered purified air. Chest106: 1757–1765.
Brown JS, Bateson TF, McDonnell WF. 2008. Effects of exposure to 0.06ppm ozone on FEV1 in humans: A secondary analysis of existing data.Environ. Health Perspect. 116: 1023–1026.
Cross CE, van der Vliet A, O'Neill CA, Louie S, Halliwell B. 1994. Oxidants,antioxidants, and respiratory tract lining fluids. Environ. HealthPerspect. 102: 185–191.
J. E. Goodman et al.
J. Appl. Toxicol. 2013Copyright © 2013 John Wiley & Sons, Ltd.wileyonlinelibrary.com/journal/jat
This Electronic Copy of Copyrighted Material Was Made and Delivered for Governmental Regulatory/Judicial Purposes Under License from Copyright Clearance Center, Inc. - No Further Reproduction is Permitted without a Separate License.

du Bois RM, Weycker D, Albera C, Bradford WZ, Costabel U, Kartashov A,King Jr. TE, Lancaster L, Noble PW, Sahn SA, Thomeer M, Valeyre D,Wells AU. 2011. Forced vital capacity in patients with idiopathicpulmonary fibrosis: Test properties and minimal clinically importantdifference. Am. J. Respir. Crit. Care Med. 184: 1382–1389.
Folinsbee LJ, McDonnell WF, Horstman DH. 1988. Pulmonary functionand symptom responses after 6.6-hour exposure to 0.12 ppm ozonewith moderate exercise. JAPCA 38: 28–35.
Goodman JE, Dodge DG, Bailey LA. 2010. A framework for assessingcausality and adverse effects in humans with a case study of sulfurdioxide. Regul. Toxicol. Pharmacol. 58: 308–322.
Hill AB. 1965. The environment and disease: Association or causation?Proc. R. Soc. Med. 58: 295–300.
Horstman DH, Folinsbee LJ, Ives PJ, Abdul-Salaam S, McDonnell WF.1990. Ozone concentration and pulmonary response relationshipsfor 6.6-hour exposures with five hours of moderate exercise to 0.08,0.10, and 0.12 ppm. Am. J. Respir. Crit. Care Med. 142: 1158–1163.
Kim CS, Alexis NE, Rappold AG, Kehrl H, Hazucha MJ, Lay JC, SchmittMT, Case M, Devlin RB, Peden DB, Diaz-Sanchez D. 2011. Lungfunction and inflammatory responses in healthy young adults ex-posed to 0.06 ppm ozone for 6.6 hours. Am. J. Respir. Crit. CareMed. 183: 1215–1221.
Lefohn AS, Hazucha MJ, Shadwick D, Adams WC. 2010. An alternativeform and level of the human health ozone standard. Inhal. Toxicol.22: 999–1011.
Lewis RW, Billington R, Debryune E, Gamer A, Lang B, Carpanini, F. 2002.Recognition of adverse and nonadverse effects in toxicity studies.Toxicol. Pathol. 30: 66–74.
McDonnell WF, Chapman RS, Leigh MW, Strope GL, Collier AM. 1985.Respiratory responses of vigorously exercising children to 0.12 ppmozone exposure. Am. Rev. Respir. Dis. 132: 875–879.
McDonnell WF, Kehrl HR, Abdul-Salaam S, Ives PJ, Folinsbee LJ, Devlin RB,O'Neil JJ, Horstman DH. 1991. Respiratory response of humansexposed to low levels of ozone for 6.6 hours. Arch. Environ. Occup.Health 46: 145–150.
McDonnell WF, Stewart PW, Smith MV, Kim CS, Schelegle ES. 2012.Prediction of lung function response for populations exposed to awide range of ozone conditions. Inhal. Toxicol. 24: 619–633.
Mudway IS, Housley D, Eccles R, Richards RJ, Datta AK, Tetley TD, Kelly FJ.1996. Differential depletion of human respiratory tract antioxidants inresponse to ozone challenge. Free Radic. Res. 25: 499–513.
Mudway IS, Stenfors N, Blomberg A, Helleday R, Dunster C, Marklund SL,Frew AJ, Sandstrom T, Kelly FJ. 2001. Differences in basal airway anti-oxidant concentrations are not predictive of individual responsive-ness to ozone: A comparison of healthy and mild asthmaticsubjects. Free Radic. Biol. Med. 31: 962–974.
National Research Council (NRC). 2007. Toxicity Testing in the Twenty-first Cen-tury: A Vision and a Strategy. National Academies Press: Washington DC.
Nicolich M. 2007. Attachment A: Some Additional Statistical Analyses ofthe FEV1 Pulmonary Response Data From the W.C. Adams Data(2006). EPA-HQ-OAR-2005-0172-4163. Accessed on November 8,2012 at http://www.regulations.gov, April.
Pellegrino R, Viegi G, Brusasco V, Crapo RO, Burgos F, Casaburi R, CoatesA, van der Grinten CP, Gustafsson P, Hankinson J, Jensen R, JohnsonDC, MacIntyre N, McKay R, Miller MR, Navajas D, Pedersen OF, Wanger
J. 2005. Interpretative strategies for lung function tests. Eur. Respir. J.26: 948–968.
Reddel HK, Taylor DR, Bateman ED, Boulet LP, Boushey HA, Busse WW,Casale TB, Chanez P, Enright PL, Gibson PG, de Jongste JC, KerstjensHAM, Lazarus SC, Levy ML, O'Byrne PM, Partridge MR, Pavord ID,Sears MR, Sterk PJ, Stoloff SW, Sullivan SD, Szefler SJ, Thomas MD,Wenzel SE. [American Thoracic Society/European Respiratory SocietyTask Force on Asthma]. 2009. An official American Thoracic Society/European Respiratory Society statement: Asthma control andexacerbations: Standardizing endpoints for clinical asthma trials andclinical practice. Am. J. Respir. Crit. Care Med. 180: 59–99.
Samet JM, Hatch GE, Hortsman D, Steck-Stott S, Arab L, Bromberg PA,Levine M, Mcdonnell WF, Devlin RB. 2001. Effect of antioxidantsupplementation on ozone-induced lung injury in human subjects.Am. J. Respir. Crit. Care Med. 164: 819–825.
Scannell C, Chen L, Aris RM, Tager I, Christian D, Ferrando R, Welch B, Kelly T,Balmes JR. 1996. Greater ozone-induced inflammatory responses insubjects with asthma. Am. J. Respir. Crit. Care Med. 154: 24–29.
Schelegle ES, Carl ML, Coleridge HM, Coleridge JC, Green JF. 1993. Con-tribution of vagal afferents to respiratory reflexes evoked by acute in-halation of ozone in dogs. J. Appl. Physiol. 74: 2338–2344.
Schelegle ES, Morales CA, Walby WF, Marion S, Allen RP. 2009. 6.6-Hourinhalation of ozone concentrations from 60 to 87 parts per billionin healthy humans. Am. J. Respir. Crit. Care Med. 180: 265–272.
Schelegle ES, Walby WF, Adams WC. 2007. Time course of ozone-inducedchanges in breathing pattern in healthy exercising humans. J. Appl.Physiol. 102: 688–697.
US EPA. 1986. Air Quality Criteria for Ozone and Other PhotochemicalOxidants, Volumes I–V (Final). EPA/600/8-84/020aF-eF. EnvironmentalCriteria and Assessment Office, Center for Environmental ResearchInformation. August.
US EPA. 2006. Air Quality Criteria for Ozone and Related PhotochemicalOxidants. Volume I. EPA 600/R-05/004aF. National Center for Environ-mental Assessment (NCEA).
US EPA. 2007. Review of the National Ambient Air Quality Standards forOzone: Policy Assessment of Scientific and Technical Information(OAQPS Staff Paper). EPA-452/R-07-007. Office of Air Quality Planningand Standards.
US EPA. 2008. National ambient air quality standards for ozone. Final rule.Fed. Reg. 73: 16436–16514.
US EPA. 2012a. Policy Assessment for the Review of the Ozone NationalAmbient Air Quality Standards (First External Review Draft). EPA 452/P-12-002. Office of Air and Radiation, Office of Air Quality Planningand Standards. Accessed on August 23, 2012 at http://www.epa.gov/ttn/naaqs/standards/ozone/data/20120816pa.pdf, 297p., August.
US EPA. 2012b. Integrated Science Assessment for Ozone and Related Pho-tochemical Oxidants (Third External Review Draft). EPA/600/R-10/076C.National Center for Environmental Assessment (NCEA). 1,262p., June.
US EPA. 2012c. Health Risk and Exposure Assessment for Ozone (FirstExternal Review Draft). EPA 452/P-12-001. Office of Air and Radiation,Office of Air Quality Planning and Standards. 474p., July.
Witschi HR, Pinkerton KE, VanWinkle LS, Last JA. 2008. Toxic responses of therespiratory system. In Casarett and Doull's Toxicology: The Basic Science ofPoisons (7th Edition), Klaassen CD (ed.). McGraw Hill Medical: New York;609–630.
Evaluation of adverse lung function effects of ozone exposure
J. Appl. Toxicol. 2013 Copyright © 2013 John Wiley & Sons, Ltd. wileyonlinelibrary.com/journal/jat
This Electronic Copy of Copyrighted Material Was Made and Delivered for Governmental Regulatory/Judicial Purposes Under License from Copyright Clearance Center, Inc. - No Further Reproduction is Permitted without a Separate License.