Embed Size (px)
Citation preview

1
Working Paper No. 20
Exporting and Foreign Direct Investment Spillovers: Cambodia’s Experience Sokty Chhair
1 and Luyna Ung
2
Abstract One feature of exporting firms in Cambodia is that they are not of domestic origin but are foreign firms that export from the moment they are established in Cambodia. In this paper we examine the extent to which the presence of foreign-owned export firms impacts on the productivity of domestic firms. We consider two channels: first, the extent to which export-induced improvements in the legal and institutional framework has led to productivity improvements for non-exporting firms, and second the extent to which horizontal spillovers from foreign-owned firm’s impact on the productivity of domestic firms. We find that relieving institutional constraints for export firms has positive impacts on the productivity of all firms, including non-export firms, and that there are negative productivity spillovers from foreign-owned to domestic firms.
Keywords: Exports, foreign direct investment, institutional constraints, spillovers, Cambodia JEL classification: D22, F14, O12, O14

The Brookings Institution is a private non-profit organization. Its mission is to conduct high-quality, independent research and, based on that research, to provide innovative, practical recommendations for policymakers and the public. Brookings recognizes that the value it provides is in its absolute commitment to quality, independence and impact. Activities supported by its donors reflect this commitment and the analysis and recommendations are not determined or influenced by any donation.
Learning to Compete (L2C) is a collaborative research program of the Africa Growth Initiative at Brookings (AGI), the African Development Bank, (AfDB), and the United Nations University World Institute for Development Economics Research (UNU-WIDER) on industrial development in Africa. Outputs in this Working Paper Series have been supported by all three institutions.
AGI-Brookings is grateful for the contribution of an anonymous donor for funding its work under the collaborative research program.
The views expressed in this publication are those of the author(s), and do not reflect the views of the Institution, its management, or its other scholars. Publication does not imply endorsement by any of the collaborating institutions or their program sponsors of any of the views expressed.
1Cambodian Economic Association; 2Supreme National Economic Council, corresponding author: [email protected]

1
1 Introduction
The manufacturing sector in Cambodia has seen significant growth over the last decade. The share of manufacturing output in gross domestic product (GDP) increased from only 9 per cent in 1994 to just over 15 per cent in 2008. This growth is also reflected in the export numbers: exports have increased in real terms from US$2.1 billion in 2000 to US$11.7 billion in 2010. A large part of the growth in manufacturing and exports has been fuelled by investments in the garment sector which increased from around US$19 million in 1994 to US$150 million in 2008 (as measured by fixed assets). The textiles sector as a whole is by far the largest export sector with a total value of almost US$3.8 billion in 2010, an 11 per cent increase from 2006, and accounting for 32 per cent of total exports. However, it also accounts for the largest share of imports at over US$10.6 billion or 39 per cent of total imports.
The development of the manufacturing sector in Cambodia came at a time when the business environment was recovering after years of conflict. The trade opportunities provided by agreements made with the USA (1996) and the European Union (EU) (1997) led to an influx of foreign investment into Cambodia. This foreign investment drove a large part of the growth in the garment sector, particularly investment from the Association of Southeast Asian Nations (ASEAN), China, and Korea. In the initial stages, foreign investors were required to have a share of business that was Cambodian-owned but this was later removed to attract higher levels of investment. Very few domestic firms engage in this sector: only 9 per cent of garment factories in Cambodia were domestically-owned in 2010. Most of these firms are domestically focused in both accessing inputs and supplying domestic markets. As such, exports from the sector are driven by foreign firms: most output is sold on export markets and they are, for the most part, disconnected from domestic markets.
The Cambodian export experience is therefore different to that experienced in other developing countries in the region, such as, for example, Vietnam, who has been relatively successful both in attracting foreign direct investment (FDI) and encouraging export participation by domestic firms. A large body of evidence set in developing country contexts suggests that the most efficient domestic firms self-select to become exporters (see, for example, Clerides et al. (1998) who find evidence for Columbia, Mexico, and Morocco or Bigsten et al. (2004) who finds evidence for a similar pattern among firms in Africa), while more recent evidence suggests that, in addition, firms that export become more productive as a result of their export experience (see, for example, Bigsten and Gebreeyesus (2008) who find evidence of learning by exporting in Ethiopia, Van Biesebroeck (2005) who finds productivity improvements for exporting firms in a number of African countries and Aw et al. (2000) who finds similar evidence for Asia). On balance, the evidence suggests that there are productivity gains from exporting but a productive domestic manufacturing sector is first required before selection into export markets is likely to take place. As such, creating a domestic manufacturing sector capable of exports is a necessary first step in this process.
It is clear in the Cambodian case that this has not yet happened. It is still possible, however, that the outward focused policies aimed at attracting FDI and facilitating exports by foreign firms, have also impacted on domestic firms, and so may, in fact, create the necessary basis for domestic firms to begin to access export markets. For example, significant institutional reforms have taken place to accommodate garment exports by FDI firms. These reforms have resulted in a change in the business climate which has the potential to relieve institutional and business climate constraints for exporting and non-exporting firms which in turn have the potential to increase firm productivity. Moreover, a large body of literature suggests that the presence of foreign-owned firms has the potential to yield technology or knowledge spillovers that impact on the domestic sector (see, for example, Blalock and Gertler (2008), Javorcik (2004), and Kugler

2
(2006). Horizontal spillovers of this kind are also a possible consequence of the export-focused policies that have attracted FDI to Cambodia over the last decades.
In this paper we examine the extent to which the presence of foreign-owned export firms impacts on the productivity of domestic firms. We consider two channels: first, the extent to which export-induced improvements in the legal and institutional framework has led to productivity improvements for non-exporting firms, and second the extent to which horizontal spillovers from foreign-owned firms, impact on the productivity of domestic firms.
The paper highlights that the investment climate significantly improved between 2003 and 2007 but that these improvements were export-biased. Our analysis shows that exporting firms in Cambodia are not of domestic origin but it is the foreign firms that export and they do so from the moment they establish in Cambodia. Exporting firms tend to be much larger than non-exporting firms (e.g., higher annual sales, greater capital investments, and more employees) and most are engaged in the garment sector. We also find, however, that despite these differences, total factor productivity (TFP) of exporting firms does not appear to be higher than that of non-exporting firms. We observe productivity improvements between 2003 and 2007 and find that relieving institutional constraints for export firms has positive impacts on the productivity of all firms, including non-export firms. We also find suggestive evidence of negative productivity spillovers from foreign-owned to domestic firms.
The rest of the paper is structured as follows. In Section 2 we provide an overview of Cambodia’s manufacturing sector focusing in particular on the pattern of export participation and the garment sector which constitutes the majority of export firms. We also document firm’s perceptions about the business and investment climate in Cambodia. In Section 3 we present the data and research methodology. Section 4 presents our results and Section 5 concludes the paper with a discussion of policy recommendations.
2 Cambodia’s manufacturing sector and export experience
2.1 Structure of the manufacturing sector in Cambodia
We begin by providing a backdrop to the nature of the manufacturing sector in Cambodia. The sector is dominated by micro firms, i.e. those with less than ten employees. According to authors’ calculation based on data from the Nation-Wide Establishment Listing in 2009 collected by the National Institute of Statistics (NIS) in 2009, there were 349 manufacturing firms with more than 100 employees; 79 with between 50 and 100 employees; and 1,125 firms with between ten and 50 employees (Table 1). Compared to 2000, the number of micro and small firms increased significantly, by more than 100 per cent. The number of medium-sized firms increased by 11 per cent, while the number of large firms declined by 33 per cent.1 There was a notable shift from large-sized manufacturing firms to medium- and small-sized firms, arguably more suitable to the operating environment in Cambodia in which larger firms need to follow more stringent administrative procedures. Most large firms (90 per cent) are registered, while micro firms are largely (98.5 per cent) unregistered. Only 30 per cent of small and 62 per cent of medium-sized firms are registered.
1 The definition used in NIS (2009) is that firms that employ more than 100 are considered large, 50 to 100 medium, 10 to 50 small, and less than 10 are considered micro.

3
Table 1: Number of establishments in the manufacturing sector
2000 2009 Growth (%)
Less than 10 (Micro) 6,751 83,068 113
10-49 (Small) 493 1,125 128
50-99 (Medium) 87 97 11
100+ (Large) 524 349 -33
Source: Authors’ calculation using data from NIS (2000; 2009).
Measured by the total number of establishments, Cambodia’s manufacturing sector is dominated by food products accounting for 51.49 per cent of firms. Textiles account for 13.4 per cent of firms, wearing apparel 11.14 per cent, beverages 6.19 per cent, and fabricated metal products 4.84 per cent (Table 2). Measured by average employment per establishment, the manufacturing sector with the largest firms are in the leather and related products sector, which employs 175.62 people on average per establishment, while wearing apparel employs 28.21 on average, paper and paper products 27.18, pharmaceuticals, medicinal chemical, and botanical products 23.60, and rubber and plastics products 21.40.
Table 2: Number of establishment in the top five manufacturing sector
No Industry descriptions 2000 2009 Growth (%)
1 Manufacture of food products and beverage 5,515 48,820 78
2 Manufacture of textiles 227 11,342 399
3 Manufacture of wearing apparel 257 9,425 3567
4 Manufacture of fabricated metal products, except machinery and equipment
343 4,098 1094
5Manufacture of wood and of products of wood and cork, except furniture; manufacture of articles of straw and plaiting materials
154 2,633 1610
Total 7,857 84,639 977
Source: Authors’ calculation using data from NIS (2000; 2009).
The number of firms in the manufacturing sector grew very fast between 2000 and 2009. In particular, the number of firms operating in the manufacture of wearing apparel increased on average by 356 per cent every year. In terms of value added, textile and wearing apparel accounted for almost 80 per cent of total value added created by the manufacturing sector in 2009. While food, beverages and tobacco grew at a rate of 3 per cent per annum, the textile sector grew at a rate of 17 per cent per annum from 2000 to 2010. The whole manufacturing sector grew at a rate of 13 per cent annually within the same period. The share of manufacturing value added increased from 16 per cent of GDP in 2000 to 20.5 per cent in 2009 (Figure 1). The manufacturing sector employed about 530,000 people, of which 70.5 per cent were female in 2009.
Textile, wearing apparel, and footwear dropped for the first time in 2009 after experiencing a very high growth rate since 1994. The sector began to slow down in 2008 due to a weak demand with a growth rate of 2 per cent and experienced negative growth of -9 per cent in 2009. However, it bounced back to growth of 19 per cent in 2010 following economic recovery in the EU and the USA.
In sum, Cambodia’s manufacturing sector has grown very fast both in terms of the number of firms and value added. There has been a decrease in the number of large firms, but an increase in the number of small- and medium-sized manufacturing firms as well as micro firms. Textiles, wearing apparel and footwear are the fastest growing sectors in terms of value added as well as in terms of the number of establishments. The food, beverages, and tobacco sector has also grown but at a slower pace. The Cambodian manufacturing sector is dominated by garment

4
manufacturing. According to the Korean Development Institute and Ministry of Strategy and Finance (2011), the total number of large-scale enterprises (employing more than 100 workers) registered in the Ministry of Industry, Mines, and Energy were 556, in which 422 enterprises are in the garment sector. This figure is also comparable to the Cambodia Enterprise Census in 2011 which shows that there are only 814 establishments employing more than 100 workers, in which 341 are in the garment sector. Even more interestingly, among 118 establishments employing more than 1000 workers, 100 are in the garment sector.
Figure 1: Percentage share of value added of the manufacturing sector
Source: Authors’ calculation using data from NIS (2011).
2.2 Export firms in Cambodia
Aggregate export data reveal that Cambodian exports are dominated by garment products including clothes, shoes, and other textiles (see Figure 2).2 In 2000, more than 90 per cent of total exports were in garment production. This increased to almost 95 per cent in 2008 before declining during the 2009 crisis. The relative share of garments in Cambodia’s exports declined during the oil and food price crisis. Moreover, the increased value of rubber lead to more exports of rubber latex while soaring food prices lead to an increase in the export of agricultural products, including rice.
Figure 2: Share of total exports of key products
Source: MEF (2011).
Exports remain dominated by the garment sector, which is consistent with the value added generation as demonstrated in the GDP statistics and the increasing number of garment establishments between 2000 and 2009. The second largest sector, food, beverages and tobacco, 2 The Establishment Listing (NIS 2009) did not contain any information on the export status of firms.
0%
20%
40%
60%
80%
100%
1993 1995 1997 1999 2001 2003 2005 2007 2009
Other manufacturing
Basic Metal and Metal Products
Non-Metallic Manufacturing
Rubber Manufacturing
Wood, Paper & Publishing
Textile,Wearing Apparel & Footwear
Food, Beverages & Tobacco
75%
80%
85%
90%
95%
100%
2000 2001 2002 2003 2004 2005 2006 2007 2008 2009 2010
Others
Agriculture Products
Timber, Ply wood, Veneerand other wood Articles
Fishing Product
Cigarettes
Rubber
Garment

5
engage more in domestic markets with the exception of the export of cigarettes. The other manufacturing sectors do not engage in exports. As a result, the growth of other manufacturing has been slow following slow the expansion of the domestic economy. Cambodia’s manufacturing sector remains labour-intensive and while the garment sector has grown fast, it only captures the lowest part of the global value-chain. There is no sign of diversification to textiles or more complex garments (World Bank 2009: 7).
The main data sources for our analysis are Investment Climate Surveys (ICSs) conducted by the International Finance Corporation (IFC) in 2003 and 2007 (more details are provided in Section 3). The dataset provides some insights into the characteristics of export firms. Similar to export commodities, 79 per cent of exporting firms are in manufacturing sectors, of which 71 per cent are in textiles. More than 93 per cent of exporting firms exported since the year of, or one year after, their establishment. It is also important to note that 80 per cent of the exporting firms have some proportion of foreign ownership. Moreover, export firms concentrate in locations that have good infrastructure: 98 per cent of the exporting firms are located in Phnom Penh, the capital city, and Sihanoukville, the port city. Most of them are well-organized: 50 per cent of the exporting firms are members of business associations while only 11 per cent of non-exporting firms are members. Overall, it is clear that Cambodia’s exporting firms are not domestic firms but are firms owned by foreign capital which export from their inception and take advantage of cheap labour and other incentives provided by the Cambodian government.
2.3 Evolution of the garment sector
Of key importance to the growth of the manufacturing sector in Cambodia has been the garment sector. The garment sector was first established in 1994, a year after the national election in 1993 which followed the signing of the peace agreement in 1991. The sector has quickly emerged as a growth leading sector in the economy particularly in the last decade. In the 1980s, Cambodia’s economy was driven largely by the export of agricultural products. The country’s physical infrastructure was greatly deteriorated during the many conflicts leading up to peace in 1991. Traditionally, industrial products were imported mostly from Thailand since Cambodia had very little manufacturing capacity or know-how due to the regressive policies pursued by the Khmer Rouge regime. For example, immediately after the fall of the Khmer Rouge in early 1979, only 12 factories using obsolete technology were in production, including textiles, tires, plastics, and tools (Slocomb 2010: 125).
After the normalization of trade relationships with the West, Cambodia received Most Favored Nation (MFN) status from the USA in 1996 and preferential treatment under under the generalized system of preference (GSP) from the EU in 1997. These concessions provided the incentive for foreign firms to establish garment factories in Cambodia. The number of garment factories rose steadily after 1996 and the garment industry provided the foundation for a modern manufacturing sector. Traditional textile manufacturers were unable to compete with the efficient modern textile sector in both domestic and foreign markets.
FDI has played an important role in the establishment of the garment sector. FDI was attracted by generous tax incentives. The focus of the garment manufacturing industry was on exports to the USA and EU markets using cheap labour. As a consequence the fortunes of the industry have been closely tied to trade policies as they relate to import markets. Changes in the trade regime have repeatedly threatened the sector, including the ending of the MFN status by the USA in 2004 and the potential disqualification of the EU policy of ‘Everything But Arms (EBA)’ on imports from least developed countries (LDCs), when Cambodia’s economy moves out of the LDC status. As a result bilateral textile trade agreements with the USA and the EU, conditional on labour standards, were sought by Cambodia to maintain market access. As a result, Cambodia entered a bilateral agreement with the USA in 1999 which ended in 2004. Cambodia’s membership in the World Trade Organization (WTO) in 2004 helped it sustain the market access

6
which it had obtained under the multi-fiber agreement which ended in the same year. The implementation of safeguard provisions under the WTO rule on Chinese textile exports has also improved access for Cambodia’s garment exports to the US market in 2005.
The aim of this paper is to explore empirically the extent to which these changes in the institutional and regulatory environment in Cambodia, aimed at attracting FDI and facilitating trade, primarily for the garment sector, has impacted on the productivity of firms. This empirical exercise is the focus of the remainder of the paper.
3 Data and methodology
We employ data from two rounds of ICSs conducted by the IFC in 2003 and 2007. These are firm-level surveys to systematically analyse conditions for private investment and enterprise growth and to compare these conditions across countries. The ICSs cover such topics as financing, regulation, marketing, labour relations, technology and training, conflict resolution, and governance. The sample consisted of 503 firms in 2003 and 502 firms in 2007. We pool both cross-sections together for our analysis so the full dataset used contains 1,005 observations.
As highlighted in Section 2, domestically-owned Cambodian firms, in general, do not export. It is possible, however, that the presence of foreign-owned export firms impacts on the productivity of domestic firms. We investigate two possible channels through which spillover effects occur: (i) how institutional and legal improvements aimed at attracting export-focused foreign-invested firms impact on the perceptions of domestic firms in relation to the business and investment climate and the productivity of domestic firms; and (ii) the extent to which horizontal spillovers from foreign-owned firms impact on the productivity of domestic firms.
To investigate the first channel we consider how the perceptions of firms in relation to the legal and institutional constraints facing their business have changed between 2003 and 2007. We divide the sample into the sub-samples of exporting firms (foreign-owned) and non-exporting firms (domestically-owned) to see whether the improvement in perceptions has changed between the two periods. We estimate an econometric model of the impact of the characteristics of firms and their export status on firms’ perceptions in relation to the legal and institutional environment. Finally, to explore the impact on productivity we estimate a firm level production function which regresses output on inputs and observable firm characteristics which could impact on productivity. In addition, we include the perception measures to capture the extent to which firms’ views on legal and institutional constraints facing their business impact on productivity.3
For the second channel, we construct a variable which measures the proportion of sales from foreign-owned firms in a particular sector and a particular year, and include it as an additional regressor in the production function. If the sign on the coefficient is positive, this is suggestive of a positive spillover effect from foreign-owned firms, while if it is negative it suggests that foreign dominance negatively impacts on domestic firms.
Table 3 presents summary statistics for each of the variables used in the analysis while definitions are given in Table A1 of the Appendix. Only 17 per cent of 1005 firms in the sample export. The majority of firms in our sample are concentrated in urban areas: 76 per cent of firms are located in Phnom Penh (the capital city) and Sihanoukville (the only deep seaport city). Table 4 shows the percentage of firms in each sector in each year by export status. The structure of the sample
3 Given that we use cross-section data and are focused on subjective perception measures of legal and institutional constraints we do not infer any causality from our regression results. Our focus in this paper is on highlighting correlations which are suggestive of possible additional impacts of policy reform that is primarily focused on foreign-invested export firms.

7
by sector is very similar in both years. The share of garment sector firms engaged in exporting is 73 per cent and 71 per cent in 2003 and 2007, respectively.
Table 3: Summary statistics
Variable Obs. Mean Std. dev. Min Max
lnsales 826 11.99 2.59 5.77 19.22
lncapital 664 10.18 2.70 3.40 18.42
lnlabour 998 3.35 1.86 0.00 8.95
lnM 882 10.75 2.64 3.56 18.40
export 1004 0.17 0.37 0.00 1.00
own_foreign (%) 1004 0.27 0.45 0.00 1.00
import_foreign (%) 1003 22.09 39.47 0.00 100.00
experience_foreign 1005 0.19 0.39 0.00 1.00
association 1005 0.18 0.38 0.00 1.00
sector1 1005 0.15 0.36 0.00 1.00
sector2 1005 0.15 0.36 0.00 1.00
sector3 1005 0.25 0.43 0.00 1.00
sector4 1005 0.44 0.50 0.00 1.00
size1 998 0.54 0.50 0.00 1.00
size2 998 0.24 0.43 0.00 1.00
size3 998 0.23 0.42 0.00 1.00
location 1005 0.77 0.42 0.00 1.00
TFP 623 0.01 0.96 -3.55 4.53
lnlabour_prod 822 8.67 1.58 2.15 14.69
prop_for 1005 0.29 0.26 0.12 0.90
Source: Authors’ calculation using data from ICS (2003; 2007).
Table 4: Share of exporting firms by sector
2003 export garment trade tourism others Total
Frequency 0 15 45 107 270 437
Percentage (%) 3.43 10.3 24.49 61.78 100
Frequency 1 48 4 3 11 66
Percentage (%) 72.73 6.06 4.55 16.67 100
Frequency Total 63 49 110 281 503
Percentage (%) 12.52 9.74 21.87 55.86 100
2007 export garment trade tourism others Total
Frequency 0 20 104 139 136 399
Percentage (%) 5.01 26.07 34.84 34.09 100
Frequency 1 72 1 5 24 102
Percentage (%) 70.59 0.98 4.90 23.53 100
Frequency Total 92 105 144 160 501
Percentage (%) 18.36 20.96 28.74 31.94 100
Source: Authors’ calculation using data from ICS (2003; 2007).
8
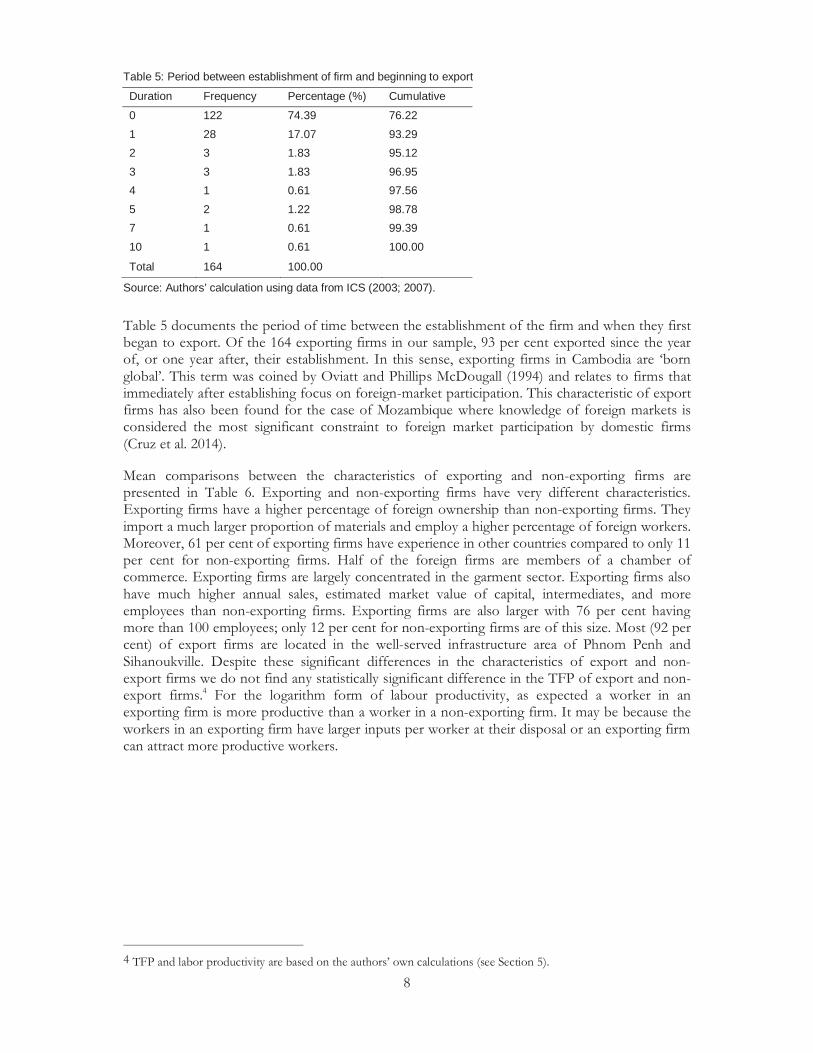
Table 5: Period between establishment of firm and beginning to export
Duration Frequency Percentage (%) Cumulative
0 122 74.39 76.22
1 28 17.07 93.29
2 3 1.83 95.12
3 3 1.83 96.95
4 1 0.61 97.56
5 2 1.22 98.78
7 1 0.61 99.39
10 1 0.61 100.00
Total 164 100.00
Source: Authors’ calculation using data from ICS (2003; 2007).
Table 5 documents the period of time between the establishment of the firm and when they first began to export. Of the 164 exporting firms in our sample, 93 per cent exported since the year of, or one year after, their establishment. In this sense, exporting firms in Cambodia are ‘born global’. This term was coined by Oviatt and Phillips McDougall (1994) and relates to firms that immediately after establishing focus on foreign-market participation. This characteristic of export firms has also been found for the case of Mozambique where knowledge of foreign markets is considered the most significant constraint to foreign market participation by domestic firms (Cruz et al. 2014).
Mean comparisons between the characteristics of exporting and non-exporting firms are presented in Table 6. Exporting and non-exporting firms have very different characteristics. Exporting firms have a higher percentage of foreign ownership than non-exporting firms. They import a much larger proportion of materials and employ a higher percentage of foreign workers. Moreover, 61 per cent of exporting firms have experience in other countries compared to only 11 per cent for non-exporting firms. Half of the foreign firms are members of a chamber of commerce. Exporting firms are largely concentrated in the garment sector. Exporting firms also have much higher annual sales, estimated market value of capital, intermediates, and more employees than non-exporting firms. Exporting firms are also larger with 76 per cent having more than 100 employees; only 12 per cent for non-exporting firms are of this size. Most (92 per cent) of export firms are located in the well-served infrastructure area of Phnom Penh and Sihanoukville. Despite these significant differences in the characteristics of export and non-export firms we do not find any statistically significant difference in the TFP of export and non-export firms.4 For the logarithm form of labour productivity, as expected a worker in an exporting firm is more productive than a worker in a non-exporting firm. It may be because the workers in an exporting firm have larger inputs per worker at their disposal or an exporting firm can attract more productive workers.
4 TFP and labor productivity are based on the authors’ own calculations (see Section 5).

9
Table 6: Mean comparison tests between exporting and non-exporting firms
Non-exporting firms Exporting firms
Mean Obs. Mean Obs. Significance of difference
lnsales 11.45 696 14.86 129 ***
lncapital 9.77 554 12.22 109 ***
lnlabour 2.86 830 5.77 167 ***
lnM 10.31 741 13.09 140 ***
own_foreign 0.17 836 0.80 167 ***
import_foreign 13.02 834 66.97 168 ***
experience_foreign 0.11 836 0.60 168 ***
association 0.11 836 0.50 168 ***
sector1 0.04 836 0.71 168 ***
sector2 0.18 836 0.03 168
sector3 0.29 836 0.05 168
sector4 0.49 836 0.21 168
size1 0.61 830 0.15 167
size2 0.27 830 0.09 167
size3 0.12 830 0.76 167 ***
location 0.73 836 0.98 168 ***
TFP -0.01 520 0.10 102
lnlabour_prod 8.59 693 9.07 129 ***
prop_for 0.21 836 0.70 168
Note: *** significant at 1%, ** significant at 5%, and * significant at 10%.
Source: Authors’ calculation using data from ICS (2003; 2007).
4 Empirical results
The first part of our empirical analysis explores the extent to which changes in institutional and regulatory frameworks impact on the productivity of firms. Before presenting these results we motivate this further by first providing a description of improvements in the investment climate as perceived by firms. Table 7 summarizes the results of mean comparisons of firms’ perceptions of legal and institutional constraints between the surveys in 2003 and 2007. The relative change in the perceptions of exporting and non-exporting firms is then compared to see the extent to which improvements intended to benefit export firms also have an impact on non-exporting firms. For the purpose of simplifying the range of perception measures available in the dataset we use the principle component analysis to combine individual constraints into a single index. Details on the individual categories of constraints are provided in Table A2 of the Appendix.
competitor is an index combining all variables indicating constraints from malpractice of a firm’s competitors.5 infra is an index combining infrastructure constraints such as telecommunications, electricity, and transportation.6 admin is an index combining administrative constraints from government institutions which affect the business environment.7 macro is an index combining
5 See Appendix for details. It includes con11 to con17. 6 See Appendix for details. It includes con21 to con23. 7 See Appendix for details. It combines con31 to con313.

10
macroeconomic constraints, which affect all firms operating in Cambodia generally.8 hon is an index combining firms’ evaluation of public agencies or services for overall honesty and integrity.9
Table 7: Mean comparison tests of perceptions of legal and institutional improvements
Improvement in measure between exporting and non-exporting firms
Deterioration between exporting and non-exporting firms Change in export and non-exporting firms 2003-2007
Variable name (+) (-) No change Improvement Deterioration
competitor × E&N
infra (×××) N
admin × E&N
macro ××× N
honesty × E&N
time - No change
gov_efficiency (×) E
gov_predict (×××) N
gov_consist (×) E
clear_export E
clear_import ×× E&N
permit_export E
quota_export E
cus_cam E
license_import ×× E&N
Notes: × exporting firms improve more than non-exporting firms; ×× exporting and non-exporting firms improve by the same amount; ××× non-exporting firms improve by more than exporting firms; (×) exporting firms deteriorate more than non-exporting firms; (××) exporting and non-exporting firms deteriorate by the same amount; (×××) non-exporting firms deteriorate by more than exporting firms; E exporting firms; N non-exporting firms; E&N both exporting and non-exporting firms.
Source: Authors’ calculation using data from ICS (2003; 2007).
competitor, admin, and hon improved for both exporting and non-exporting firms between 2003 and 2007 but the perception of the exporting firms improved by more than non-exporting firms. infra did not improve between these two periods despite government efforts to expand electricity generation capacity, telecommunication coverage, road networks, and road conditions. Infrastructure constraints appear worse for non-exporting firms. Perceptions on the macro-economy (macro) improved for non-exporting firms only. This may be due to many external factors out of the government’s control that exporting firms must also deal with leading to a lower perception on this index for export firms.
time is a variable describing the percentage of senior management’s time spent in dealing with requirements imposed by government regulations. There was no change in this variable between 2003 and 2007, for exporting or for non-exporting firms. We also consider other measures relating to firms’ perceptions of government, namely, gov_efficiency, gov_predict, and gov_consist. The higher the value of these variables, the more positive is the firms’ evaluation. gov_efficiency is the firm’s evaluation of government efficiency in delivering public goods such as public utilities, public transportation, security, education, and healthcare. gov_predict is the firm’s evaluation of 8 These variables range from access to land to macroeconomic stability. See Appendix for details. It combines con41 to con47. 9 See Appendix for details. It combines hon0 to hon16.

11
predictability of change in policies, laws, and regulations that materially affect their business. gov_consist is the firm’s evaluation of the consistency of the government officials in their interpretation of regulations affecting their establishment. These three variables deteriorated between the two periods. This suggests that to achieve improvements in these variables may require more broad-based governance reforms than those that were in place during this period.
Changes in general administration procedures such as document processing can be a lot easier to implement than broad based governance reforms. Some success in this regard is evident from the improvement in the variables clear_export (the longest number of days for customs clearance at the point of exit for product export), clear_import (the longest number of days for customs clearance at the point of entry for product import), permit_export (the number of days to obtain an export permit), quota_export (the number of days to qualify for a quota), cus_cam (the number of days to clear customs and Camcontrol10), and license_import (the number of days to obtain an import license). Improvements in the time of processing documents and issuing licenses for export markets consolidate the fact that legal and institutional reforms have been export-biased over this period. However, the legal and institutional improvements have positively impacted on exporting and non-exporting firms. So while the data suggest that the investment climate improved over the two observed periods, it appears that the perception of export firms improved more in relation to legal and institutional reforms than non-export firms, suggesting a bias in policy towards exporting firms.
In Table 8 we present the results of a model that regresses firms’ perceptions of legal and institutional constraints on firm characteristics, focusing in particular on changes over time and on the export status of firms.11 We observe that year_d has a negative and significant effect on competitor, admin, honest, and time but is insignificant for infra and macro. This suggests that firms face less legal and institutional constraints in 2007 than in 2003, possibly as a result of government efforts to improve the business and investment climate through legal and institutional reforms. There was no significant improvement in firms’ perceptions of infrastructure or the macro environment variable (macro). For infrastructure, electricity costs remain high and unpredictable. Telephone costs also remain high by international standards. Although road infrastructure has improved, logistical costs remain high due to the need for informal payments when shipping goods. It is therefore not surprising that perceptions in relation to infrastructure have not improved. While efforts have been made to improve macroeconomic stability in Cambodia, high exposure to external markets makes Cambodia’s macroeconomy relatively unstable. This may explain why firms’ perceptions on macroeconomic stability did not improve.
Table 8 also suggests that export firms face fewer constraints in relation to competition, administration- and the macro-environment more generally. Turning to other firm characteristics the coefficient on foreign-owned firms (foreign_own) has a positive sign for competitor, macro and honest. This suggests that firms with foreign ownership face more constraints than domestic firms. sector3, which is an indicator for firms in the tourism sector, is negative and significant for competitor, admin, and macro. location_d, is an indicator for firms being located in Phnom Penh and Sihanoukville. It has a negative impact on infra while it has a positive impact on time. This is as expected given that firms located in Phnom Penh and Sihanoukville are much better-served by infrastructure and thus face less infrastructure constraints than firms located in other locations.
10 Cambodia Import-Export Inspection and Fraud Repression Directorate General, a Directorate General under the Ministry of Commerce created, among other things, to ensure quality and safety of products and services as well as comsumer protection. 11 We also consider an interaction term between the survey year (year_d) and the export status of the firm (export_d) to explore whether the perceptions of export firms improved to a greater extent than those of non-export firms. We do not find it to be statistically significant in any specification and so exclude it from our analysis.

12
Table 8: Determinants of firms’ perceptions of legal and institutional constraints
(1) (2) (3) (4) (5) (6)
competitor infra admin macro honest time
export_d -0.713*** 0.185 -0.552* -0.382* 0.102 1.49
(0.27) (0.17) (0.33) (0.22) (0.47) (2.57)
year_d -0.700*** 0.0905 -2.089*** -0.201 -1.268*** -3.407**
(0.17) (0.11) (0.23) (0.14) (0.35) (1.55)
year_establish 0.00134 0.0176* 0.0155 0.0214 0.0423 0.0322
(0.02) (0.01) (0.02) (0.01) (0.03) (0.15)
own_foreign 0.405* -0.0125 0.341 0.430** 0.790** -1.608
(0.21) (0.13) (0.26) (0.17) (0.38) (1.96)
sector2 -0.156 -0.105 -0.687 -0.201 -0.135 -0.37
(0.40) (0.25) (0.48) (0.32) (0.69) (3.69)
sector3 -1.158*** -0.317 -1.496*** -0.675** -0.726 -0.819
(0.37) (0.24) (0.45) (0.30) (0.65) (3.50)
sector4 -0.567* 0.0256 -0.585 -0.0792 0.322 -2.153
(0.34) (0.22) (0.41) (0.27) (0.59) (3.21)
size_d2 0.0909 0.00358 -0.234 -0.412*** -0.123 6.548***
(0.19) (0.12) (0.25) (0.15) (0.40) (1.71)
size_d3 0.423 0.0756 -0.185 -0.1 -0.782 1.69
(0.28) (0.18) (0.35) (0.22) (0.52) (2.54)
location_d -0.212 -0.200* -0.291 -0.206 -0.293 6.187***
(0.18) (0.11) (0.23) (0.15) (0.36) (1.66)
Constant -1.784 -35.13* -29.1 -42.18 -83.9 -57.25
(32.65) (20.24) (44.30) (26.91) (61.30) (294.20)
N 686 812 477 736 355 890
R-squared 0.0664 0.0122 0.23 0.0406 0.0705 0.0253
Note: Standard errors in parentheses; * p<0.10, ** p<0.05, *** p<0.01. admin and honest are indicators combining 13 and 17 variables, respectively, through a method of principle component analysis so that there are a lot of missing values.
Source: Authors’ calculation using data from ICS (2003; 2007).
Table 9 illustrates the determinants of firms’ perceptions of the functioning of government. Perceptions of gov_efficiency improved between 2003 and 2007 for non-exporting firms but, as indicated by the negative and significant coefficient on the interaction term between export status and survey year, declined for exporting firms. The perception of exporting firms on gov_consist was better than non-exporting firms in 2003 but worsened between 2003 and 2007.
Older and newly established firms do not differ in their perception of gov_efficiency, gov_predict, and gov_consist. Firms with foreign ownership perceive that the government is less efficient in delivering services (e.g., public utilities, public transportation, security, education, and health etc.) than domestic firms. Firms in the tourism sector are more positive in their perception of the consistency of government officials and in their interpretation of regulations affecting their establishment than those in the garment sectors. Firms with total employment between 20 to 99 have a more negative perception of gov_efficiency compared to smaller firms. Firms located in Phnom Penh and Sihanoukville perceive government policy as being more predictable than other firms.

13
Table 9: Determinants of firms’ perceptions of the functioning of government
(1) (2) (3) (4) (5) (6)
gov_effi gov_effi gov_pred gov_pred gov_cons gov_cons
export_d 0.222 -0.0302 -0.314 -0.255* 0.671*** 0.431***
(0.15) (0.12) (0.19) (0.15) (0.21) (0.16)
year_d 0.280*** 0.193*** -0.127 -0.105 -0.0475 -0.128
(0.08) (0.07) (0.10) (0.09) (0.11) (0.10)
year_dexport_d -0.447*** 0.108 -0.412*
(0.17) (0.21) (0.23)
year_establish -0.00429 -0.00516 -0.0111 -0.011 0.00565 0.00481
(0.01) (0.01) (0.01) (0.01) (0.01) (0.01)
own_foreign -0.254*** -0.242*** 0.118 0.114 0.141 0.151
(0.09) (0.09) (0.12) (0.12) (0.12) (0.12)
sector2 -0.212 -0.189 -0.14 -0.145 0.467** 0.487**
(0.17) (0.17) (0.22) (0.22) (0.23) (0.23)
sector3 -0.0132 -0.00454 -0.22 -0.22 0.193 0.198
(0.16) (0.16) (0.21) (0.21) (0.22) (0.22)
sector4 -0.267* -0.280* -0.102 -0.0991 0.322 0.309
(0.15) (0.15) (0.19) (0.19) (0.20) (0.20)
size_d2 0.123 0.148* -0.232** -0.239** -0.0312 -0.00522
(0.08) (0.08) (0.10) (0.10) (0.11) (0.11)
size_d3 -0.0184 -0.0138 -0.128 -0.129 -0.0432 -0.0361
(0.12) (0.12) (0.15) (0.15) (0.16) (0.16)
location_d -0.117 -0.102 0.315*** 0.311*** -0.11 -0.0944
(0.08) (0.08) (0.10) (0.10) (0.10) (0.10)
_cons 12.46 14.2 24.92 24.57 -8.165 -6.471
(13.64) (13.67) (17.74) (17.72) (18.29) (18.29)
N 910 910 830 830 857 857
r2_a 0.0388 0.0323 0.0171 0.018 0.00968 0.00703
Note: Standard errors in parentheses; * p<0.10, ** p<0.05, *** p<0.01.
Source: Authors’ calculation using data from ICS (2003; 2007).
We now explore the extent to which correlations exist between the productivity of firms and their perceptions in relation to legal and institutional constraints. We use the logarithm of the firm’s total sales as the dependent variable. Where value of total sales is missing, we use the logarithm of total production scaled by 0.71.12 For capital, we use the logarithm of the market value of capital and where market value of capital is missing, we use the book value of capital. For labour, we use the logarithm of the total number of employees, which includes permanent employees and the average number of temporary employees. For intermediates, we also use the logarithm of the sum of raw materials and goods bought for resale, the cost of electricity, fuel, communication, transport, and maintenance, and repairing costs. We also control for year_d, sector, size_d, and location_d. The results of the baseline production function are presented in Table 10 while in Table 11 we extend the analysis to also include firms’ perceptions of various legal and institutional constraints as described above.
12 The ratio of mean value of firm’s total production and mean of firm’s total sales is 0.71.

14
Table 10: Determinants of firm productivity
(1)
Full Sample
(2)
Full sample
(3)
Non-garment
(4)
Garment
lncapital_mar 0.0778*** 0.0766*** 0.0723*** 0.111
(0.023) (0.023) (0.025) (0.072)
lnlabour 0.280*** 0.286*** 0.281*** 0.316*
(0.076) (0.076) (0.085) (0.177)
lnM 0.506*** 0.504*** 0.498*** 0.566***
(0.026) (0.026) (0.029) (0.068)
size_d2 0.384** 0.377** 0.385** 0
(0.152) (0.151) (0.164) (.)
size_d3 0.732** 0.718** 0.780** -0.17
(0.299) (0.299) (0.331) (0.604)
export_d 0.229 0.401** 0.393** 0.0349
(0.151) (0.193) (0.195) (0.243)
own_foreign 0.519*** 0.510*** 0.554*** 0.0427
(0.119) (0.119) (0.127) (0.359)
year_d 0.647*** 0.651*** 0.678*** 0.457
(0.111) (0.111) (0.118) (0.369)
year_establish -0.0094 -0.0094 -0.0098 0.00236
(0.008) (0.008) (0.008) (0.030)
sector1 -0.32 -0.113
(0.200) (0.247)
export_d*sector1 -0.427
(0.300)
Constant 22.74 22.61 23.64 -1.053
(16.240) (16.230) (16.970) (60.980)
N 621 621 525 96
R-squared 0.861 0.861 0.809 0.68
Note: Standard errors in parentheses; * p<0.10, ** p<0.05, *** p<0.01. (1) & (2) & (3) all firms, (4) & (6) firms in non-garment sector, and (5) firms in garment sector.
Source: Authors’ calculation using data from ICS (2003; 2007).
As stressed above, data limitations prevent us from establishing a casual relationship between export status, foreign ownership with firm productivity in Cambodia. Our study only attempts to describe the pattern of observed. Column (1) in Table 10 illustrate that foreign-owned firms have a positive and significant impact on firm productivity. We do not find any evidence that exporting firms are more productive. However, it appears that the sector from which firms are exporting matters. When interacting the export status of firms with an indicator for whether the firm is in the garment sector in column (2) we find that export_d has a significant and positive impact on firm productivity suggesting that exporting firms in the non-garment sector are more productive than non-exporting firms in non-garment sectors.
We further investigate the link between exporting status and firm productivity in separate sub-samples of non-garment and garment sectors in columns (3) and (4), respectively. As expected, in column (3) we find that exporting firms are more productive than non-exporting firms in non-garment sectors while exporting firms are not more productive than non-exporting firms in the garment sector (column (4)). The small number of observations in the latter, however, makes it

15
difficult to draw any strong conclusions from this result. Overall, we can conclude from Table 10 that, in general, foreign ownership, not whether firms export, has a positive relationship with productivity; but that export firms in the non-garment sector are more productive than non-export firms in the garment sectors.
The next part of our analysis considers whether perception regarding legal and institutional constraints impact on firm productivity. We find that the only variable that is statistically significant in the productivity regression is admin, which has a positive significant effect on productivity.13 The results are presented in Table 11. If firms’ perceptions regarding admin truly reflect legal and institutional problems then this suggests that removing such constraints could improve firm productivity.
The final part of our analysis considers whether there are other spillover effects associated with foreign-ownership in the form of horizontal spillovers. Table 12 shows the results of the production function when the foreign ownership spillover variable prop_for is included and the analysis is performed on domestic firms only. The variable prop_for is constructed as the proportion of total annual sales of foreign firms in a particular sector and a particular year to total annual sales of all firms in particular sector and year.
Column (1) presents the baseline specification without the inclusion of prop_for while column (2) includes the spillover measure. We find that it has a negative significant effect on firm productivity suggesting negative spillover effects from foreign-owned to domestic firms. Although we cannot draw casual inference possible explanations include the likelihood that foreign-owned firms compete for productive labour resources. For the most part, only low-skill labour is required to work in light and labour-intensive industries and so both domestically- and foreign-owned firms compete for the same pool of labourers. This explanation is confirmed using a mean comparison test of logarithm form of labour productivity between domestic and foreign-owned firms which shows a significant difference at the 1 per cent significant level. This is worthy of further investigation and has interesting implications for policy on FDI and export promotion.
13 Results for the other perceptions variables are not presented as they were statistically insignificant.

16
Table 11: Determinants of firm productivity: the impact of perceptions
(2) (3) (4) (5)
reg2 reg3 reg4 reg5
lncapital_mar 0.0657** 0.0637** 0.0728** -0.00482
(0.031) (0.031) (0.034) (0.095)
lnlabour 0.263** 0.265** 0.234* 0.356
(0.106) (0.106) (0.123) (0.228)
lnM 0.503*** 0.501*** 0.501*** 0.514***
(0.039) (0.039) (0.044) (0.096)
size_d2 0.25 0.249 0.28 -0.447
(0.211) (0.211) (0.231) (0.749)
size_d3 1.012** 1.013** 1.080**
(0.405) (0.405) (0.457)
export_d 0.279 0.482* 0.472* 0.0423
(0.191) (0.254) (0.256) (0.331)
own_foreign 0.533*** 0.516*** 0.562*** 0.118
(0.155) (0.156) (0.166) (0.511)
year_d 0.275 0.282 0.267 0.479
(0.177) (0.177) (0.192) (0.498)
year_establish -0.0202 -0.0193 -0.0207 -0.0128
(0.013) (0.013) (0.014) (0.040)
sector1 -0.491* -0.297
(0.256) (0.302)
admin -0.0724** -0.0729*** -0.0700** -0.0971
(0.028) (0.028) (0.031) (0.076)
export_d*sector1 -0.439
(0.365)
Constant 44.82* 42.93 45.74 30.93
(26.260) (26.290) (28.180) (79.440)
N 297 297 235 62
R-squared 0.876 0.876 0.827 0.574
Note: Standard errors in parentheses; * p<0.10, ** p<0.05, *** p<0.01. (1) & (2) & (3) all firms, (4) & (6) firms in non-garment sector, and (5) firms in garment sector.
Source: Authors’ calculation using data from ICS (2003; 2007).

17
Table 12: Spillover effects of foreign firms
(1) (2)
lncapital_mar 0.0791*** 0.0768***
(0.027) (0.027)
lnlabour 0.305*** 0.308***
(0.093) (0.093)
lnM 0.501*** 0.498***
(0.031) (0.031)
size_d2 0.371** 0.374**
(0.183) (0.183)
size_d3 0.709* 0.723**
(0.366) (0.365)
export_d 0.109 0.149
(0.239) (0.239)
year_d 0.635*** 0.558***
(0.122) (0.130)
year_establish -0.00267 -0.00313
(0.009) (0.009)
sector1 -0.0014 1.359
(0.377) (0.863)
prop_for -1.964*
(1.121)
Constant 9.241 10.6
(17.670) (17.640)
N 447 447
R-squared 0.782 0.783
Source: Authors’ calculation using data from ICS (2003; 2007).
5 Conclusion
This paper presents a case study of the experience of foreign-ownership and exporting in Cambodia. Cambodia has seen substantial legal and institutional improvements to promote the export sector and attract FDI in recent decades. Our study investigates the extent to which these reforms have also yielded positive spillover effects on non-exporting firms through improvements in government institutions and the simplification of procedures for doing business, or through learning spillovers from foreign to domestic firms.
We find that reforms have improved firm productivity through legal and institutional improvements, however, there is some evidence of negative spillover effects from foreign-owned firms to domestic firms in terms of productivity. This is likely due to competition between foreign-owned and domestic firms in attracting more productive labourers, especially in the garment sector.
A caveat of our study is that there is very limited data on this issue. The tentative results presented in this paper suggest that the interaction between foreign-owned and domestic firms requires more detailed investigation, in particular to ascertain the extent to which policies aimed at attracting FDI may have negative implications for the development of the domestic sector. While our study suggests that firms have benefited from improvements to the legal and institutional environment the existence of negative spillovers are of concern and suggest that

18
policy should be better formulated to facilitate more productive linkages between the foreign and domestic sectors. Future analysis is required to establish whether and how this can take place.
Appendix
Table A1: Definition of variables used in productivity analysis
Variable name Description
lnsales Logarithm of total sales
lncapital Logarithm of market value of capital
lnlabour Logarithm of the total number of permanent and temporary employees
lnM Logarithm of intermediates
export Whether a firm has exports
own_foreign Whether a firm is foreign-owned
import_foreign (%) The percentage of materials that are imported
worker_foreign (%) The percentage of foreign workers
experience_foreign Whether a firm has experience operating in other countries
association Whether a firm is a member of chamber of commerce
sector1 Whether a firm is in garment sector
sector2 Whether a firm is in trade sector
sector3 Whether a firm is in tourism sector
sector4 Whether a firm is in other sectors
size1 Whether a firm employs less than 20 workers
size2 Whether a firm employs between 20 to 99 workers
size3 Whether a firm employs over 100 workers
location Whether a firm locates in Phnom Penh or Sihanoukville
TFPTFP is the residual estimated using Cobb-Douglas production function by regressing lnsales on lncapital, lnlabour, lnM, and other firm characteristics
lnlabour_prod Logarithm form of labor productivity measured by total sales divided by the total number of workers
prop_for Proportion of total sales of firms with positive foreign ownership to total sales of all firms in a particular sector and a particular year
Source: Authors’ calculation using data from ICS (2003; 2007).

19
Table A2: Definition of indicators of institutional and business environment
Variable Name Definition
competitor An index combining factors of con11-con17 (Please tell us on a four-point scale how problematic for your firm are the following practices of your competitors for your firm?) using PCA:
con11: They avoid sales tax, VAT or others taxes
con12: They do not pay duties or observe trade regulations
con13: They avoid labour taxes/regulations
con14: They violate my copyrights, patents or trademarks
con15: They receive subsidies (including the toleration of tax arrears) from
national/local government
con16: They have favoured access to credit, infrastructure services or customers
con17: They conspire to limit my access to markets or suppliers
infra An index combining factors of con21-con23 (Please tell in a four-point scale how problematic are the following issues for the operation and growth of your business) using PCA:
con21: Telecommunications
con22: Electricity
con23: Transportation
admin An index combining factors of con31-con33 (Are the following administrative procedures and regulations an obstacle for your firm's operations and growth?) using PCA:
con31: Crime, theft and disorder
con32: Legal system/conflict resolution
con33: Registering a new enterprise
con34: Business/sectoral licensing
con35: Tax administration
con36: Standards and certification
con37: Labour regulations
con38: Environmental regulations
con39: Fire/safety and sanitary regulations
con310: Customs regulations
con311: Price regulations
con312: Procedure for access to land and premises
con313: Business inspection (of all types)
macro An index combining factors of con41-con47 using PCA:
con41: Access to land
con42: Tax rates
con43: Tax administration
con44: Business licensing and operating permits
con45: Economic & regulatory policy uncertainty
con46: Macroeconomic instability (inflation…)
con47: Corruption
honesty An index combining factors of hon0-hon1 (Please evaluate the following public agencies or services for their overall honesty/integrity on a six-point scale) by using Principle Component Analysis method:
hon0: State tax administration
hon1: Customs service/agency
hon2: Pre-shipment inspection service
hon3: Roads department / public works
hon4: Post office
hon5: The telephone service/agency
hon6: The electric power company/agency
hon7: The water/sewerage service/agency
hon8: The police
hon9: The armed forces/military
hon10: Public health care service/hospitals

20
hon11: Education services/schools
hon12: Central government leadership (prime minister)
hon13: The National Assembly
hon14: The judiciary/courts
hon15: Export promotion department, Ministry of Commerce
hon16: Council for development of Cambodia
time In a typical week, what % of senior management's time is spent in dealing with requirements imposed by government regulations?
gov_efficiency How would you rate the efficiency of government in delivering services in a six-point scale (e.g., public utilities, public transportation, security, education & health etc.)?
gov_predict In general, changes in policies, laws and regulations that materially affect my business are predictable in a six-point scale?
gov_consist In general, government officials’ interpretation of regulations affecting my establishment are consistent in a six-point scale?
clear_export If you export, what was the longest number of days in the last year that it took from the time your goods arrived in their point of exit until the time they clear customs?
clear_import If you import, what was the longest number of days in the last year that it took from the time your goods arrived in their point of entry (e.g., airport) until the time you could claim them from customs?
permit_export If you export, please estimate the number of days involved in obtaining an export permit
quota_export If you export, please estimate the number of days involved in qualifying for quota
cus_cam How many days do your firms take to clear customs and CAM control?
license_import What is the number of days of actual delay experienced (from the day you applied to the day you received the service or approval) to obtain an import license?
Source: Authors’ calculation using data from ICS (2003; 2007).
References
Aw, B., Chung, S., and Roberts, M.J. (2000). ‘Productivity and turnover in the export market: micro-level evidence from the Republic of Korea and Taiwan (China)’, World Bank Economic Review, 14(1): 65-90.
Bigsten, A., Collier, P., Dercon, S., Fafchamps, M., Gauthier, B, Gunning, J.W., Oduro, A, Oostendorp, R., Pattillo, C., Söderbom, M., Teal, F., and Zeufack, A. (2004). ‘Do African manufacturing firms learn from exporting?’ Journal of Development Studies, 40(3): 115-41.
Bigsten, A., and Gebreeyesus, M. (2008). ‘Firm productivity and exports: evidence from Ethiopian manufacturing.’ Working Paper Number 303. Gothenburg: School of Business, Economics and Law, University of Gothenburg.
Blalock, G., and Gertler, P.J. (2008). ‘Welfare gains from foreign direct investment through technology transfer to local suppliers,’ Journal of International Economics, 74(2): 402-21.
Clerides, S.K., Loch, S., and Tybout, J.R. (1998). ‘Is learning by exporting important? Micro-dynamic evidence from Columbia, Mexico and Morocco’. Quarterly Journal of Economics, 113(3): 903-47.
Cruz, A., Newman, C., Rand, J., and Tarp F. (2014). ‘Learning by exporting: the case of Mozambican Manufacturing.’ Working Paper 2014/066. Helsinki: UNU-WIDER.
International Finance Corporation (IFC) (2003). Investment Climate Survey 2003. Washington, DC: International Finance Corporation.
International Finance Corporation (IFC) (2007). Investment Climate Survey 2007. Washington, DC: International Finance Corporation.

21
Javorcik, B.S. (2004). ‘Does foreign direct investment increase the productivity of domestic firms? In search of spillovers through backward linkages,’ American Economic Review, 94(3): 605-27.
Korean Development Institute and Ministry of Strategy and Finance (2011). Policy Agenda for Cambodia in Growth, Finance, Industry and Trade. Korean Development Institute and Ministry of Strategy and Finance.
Kugler, M. (2006). ‘Spillovers from foreign direct investment: within or between industries?’, Journal of Development Economics, 80(2): 444-77.
Ministry of Economy and Finance (MEF) (2011). Statisitcal Bulletins. Phnom Penh: MEF.
National Institute of Statistics (NIS) (2000). Survey of Industrial Establishment 2000. Asian Development Bank.
NIS (2009). Nation-wide Establishment Listing of Cambodia 2009: National Report on Final Results, prepared for the Royal Government of Cambodia. Phnom Penh: NIS.
NIS (2011). National Account. Phnom Penh: National Institute of Statisitcs.
Oviatt, B.M., and McDougall, Phillips, P. (1994). ‘Toward a theory of international new ventures,’ Journal of International Business Studies, 25(1): 45-64.
Slocomb, M. (2010). An Economic History of Cambodia in the Twentieth Century. Signapore: NUS Press.
World Bank (2009). Sustaining Rapid Growth in a Challenging Environment: Cambodia Country Economic Memorandum. Wasginton, DC: World Bank.
Van Biesebroeck, J. (2005) ‘Exporting raises productivity in sub-Saharan African Manufacturing Firms.’ Journal of International Economics, 67: 373-91.