Embed Size (px)
Citation preview

EXPORT DIVERSIFICATION AND ECONOMIC GROWTH IN
SUB–SAHARAN AFRICA
BY
LOUIS SITSOFE HODEY
(10225392)
A THESIS SUBMITED TO THE UNIVERSITY OF GHANA,
LEGON IN PARTIAL FULFILMENT OF THE REQUIREMENT
FOR THE AWARD OF MASTER OF PHILOSOPHY (M.PHIL)
DEGREE IN ECONOMICS.
JUNE, 2013
University of Ghana http://ugspace.ug.edu.gh

i
DECLARATION
I, LOUIS SITSOFE HODEY, hereby declare that this thesis is the original research
undertaken by me under the guidance of my supervisors; and with the exception of
references to other people’s work which have been duly cited, this thesis has neither in
part nor in whole been submitted for another degree elsewhere.
……………………………….
LOUIS SITSOFE HODEY
(10225392)
…………………………………………..
DATE
………………………………. ………………………………
MS. ABENA D. ODURO DR. BERNARDIN SENADZA
(SUPERVISOR) (SUPERVISOR)
…………………………. ……………………………
DATE DATE
University of Ghana http://ugspace.ug.edu.gh

ii
DEDICATION
This thesis is dedicated to the Sovereign God who reigns in majesty forever and ever; to
my parents, Mr. Reuben K. Hodey and Mrs. Comfort A. Hodey who defied economic logic
by successfully demanding education for their children even in the absence of their ability
to pay; and finally to all who have dedicated their lives to the dissemination of knowledge
through teaching and research.
University of Ghana http://ugspace.ug.edu.gh

iii
ACKNOWLEDGEMENTS
First of all, I am very grateful to the Lord God Almighty who has offered Himself to me
as a Father. Indeed His plans are sovereign and cannot be thwarted; His resources are
unlimited in supply, not subject to scarcity. He has always brought the right people into
my life to offer things that are lacking in me. May His name be praised now and
forevermore!
I greatly appreciate the tireless effort of Ms. Abena D. Oduro whose aptness and detailed
supervision invaluably enriched this study. I am especially grateful to Dr. Bernardin
Senadza, first for his effort purposefully directed at developing my academic abilities and
secondly for his brilliant supervision. I am very grateful to Prof. Augustin K. Fosu who
made very critical and insightful comments and shared some useful materials with me.
Mr. Abel Fumey and Mrs. Hellen Seshie Nasser made very useful and timely
contributions to this study, and I am grateful to them.
God bless Mr Frank Tweneboa who ensured my enrolment in the University of Ghana for
undergraduate studies; and Rev. John Okai Adjetey who provided one of my greatest
needs for this thesis. My colleagues and other senior colleagues in the department have
made invaluable contributions to the success of this study. Mr. Nicholas K. Essah, Mr.
Innocent Agbeli, Mr. Nicholas Ashiabi and Mr. Solomon Aboagye have offered
tremendous assistance in the course of the study.
Finally, God bless everyone whose name could not be mentioned here due to lack of
space; especially members of my “family”; not forgetting Auntie Rose, Doris, Gideon,
Alberta, Elorm, Courage and Gloria for their encouragement and exceptional
demonstration of love to me.
University of Ghana http://ugspace.ug.edu.gh

iv
ABSTRACT
Most economies in Sub–Saharan Africa (SSA) have been associated with low and volatile
growth performance over the years. Export diversification is identified in the literature as
growth–inducing. However, the assessment of the effect of export diversification on
economic growth has not received much attention in Sub–Saharan Africa. The study
provides evidence on the relationship between export diversification and economic
growth using panel data of forty–two (42) Sub–Saharan African (SSA) countries for the
period 1995–2010.
The study adopts the system GMM estimation technique in order to obtain consistent and
efficient estimates of the effect of export diversification on economic growth. In relation
to most previous empirical studies, this study accounts for time series variations in the
data, captures the unobserved country–specific time–invariant effects, and also controls
for endogeneity in the estimation model.
The estimation results attest to a positive effect of export diversification on economic
growth. Evidence from the regressions does not support a hump–shaped relationship
between export diversification and economic growth in SSA. The study further shows
that other control variables such as gross fixed capital formation, human capital, and
foreign direct investment are significant positive determinants of economic growth in
SSA. Population growth rate on the other hand is found to have a negative significant
effect on economic growth in SSA.
It is recommended that governments in SSA should promote export diversification
together with investment in human and physical capital, keep population growth under
control, and pursue policies that will attract foreign direct investment into growth–
enhancing productive sectors of their economies.
University of Ghana http://ugspace.ug.edu.gh
v
TABLE OF CONTENTS
CONTENT PAGE
DECLARATION……………………………………………………………………………………. i
DEDICATION……………………………………………………………………………………….. ii
ACKNOWLEDGEMENTS…………………………………………………………………………. iii
ABSTRACT…………………………………………………………………………………………. iv
LIST OF TABLES…………………………………………………………………………………… ix
LIST OF FIGURES………………………………………………………………………………….. x
ACRONYMS………………………………………………………………………………………… xi
CHAPTER ONE……………………………………………………………………………………... 1
INTRODUCTION…………………………………………………………………………………… 1
1.1 Background………………………………………………………………………... 1
1.2 Problem Statement………………………………………………………………… 4
1.3 Research Questions………………………………………………………………... 6
1.4 Research Objectives……………………………………………………………….. 7
1.5 Significance of the Study………………………………………………………….. 7
1.6 Scope and Source of Data for the Study…………………………………………... 9
1.7 Overview of Chapters……………………………………………………………... 9
CHAPTER TWO…………………………………………………………………………………….. 11
OVERVIEW…………………………………………………………………………………………. 11
2.1 Introduction………………………………………………………………………... 11
2.2 GDP per Capita Growth…………………………………………………………… 11
University of Ghana http://ugspace.ug.edu.gh

vi
2.3 Export Diversification…………………………………………………………….. 13
2.4 Population Growth………………………………………………………………… 14
2.5 Foreign Direct Investment………………………………………………………… 14
2.6 Gross Fixed Capital Formation……………………………………………………. 15
CHAPTER THREE………………………………………………………………………………….. 17
LITERATURE REVIEW……………………………………………………………………………. 17
3.1 Introduction……………………………………………………………………….. 17
3.2 Theoretical Literature……………………………………………………………... 17
3.3 Empirical Literature……………………………………………………………….. 22
3.4 Concluding Remarks……………………………………………………………… 28
CHAPTER FOUR…………………………………………………………………………………… 29
METHODOLOGY…………………………………………………………………………………... 29
4.1 Introduction………………………………………………………………………... 29
4.2 Description of Variables and Data Sources……………………………………….. 29
4.3 Theoretical Framework……………………………………………………………. 35
4.4 Model for Empirical Estimation…………………………………………………... 36
4.5 Estimation Technique……………………………………………………………... 39
4.6 Diagnostic Tests…………………………………………………………………… 43
4.6.1 Endogeneity………………………………………………………………………….. 43
4.6.2 Autocorrelation and Heteroscedasticity……………………………………………… 44
4.6.3 Fixed Effects (FE) versus Random Effects (RE)…………………………………….. 45
4.6.4 Stationarity (Unit Root) Test………………………………………………………… 47
University of Ghana http://ugspace.ug.edu.gh

vii
4.6.5 Other Diagnostic Tests………………………………………………………………. 48
4.7 Concluding Remarks……………………………………………………………… 49
CHAPTER FIVE…………………………………………………………………………………….. 50
RESULTS AND DISCUSSION……………………………………………………………………... 50
5.1 Introduction………………………………………………………………………... 50
4.2 Descriptive Analysis………………………………………………………………. 50
5.3 Estimation Results………………………………………………………………… 52
5.4 Diagnostic Tests…………………………………………………………………… 54
5.4.1 Endogeneity………………………………………………………………………….. 54
5.4.2 Heteroscedasticity……………………………………………………………………. 55
5.4.3 Autocorrelation………………………………………………………………………. 56
5.4.4 Validity of Overidentifying Restrictions…………………………………………….. 56
5.4.5 Fixed Effects and Random Effects…………………………………………………... 57
5.4.6 Stationarity (Unit Root) Test………………………………………………………… 58
4.5 Discussion of Results……………………………………………………………… 59
4.6 Concluding Remarks……………………………………………………………… 62
CHAPTER SIX………………………………………………………………………………………. 64
SUMMARY, CONCLUSIONS AND POLICY RECOMMENDATIONS…………………………. 64
6.1 Introduction………………………………………………………………………... 64
6.2 Summary and Conclusions………………………………………………………... 64
6.3 Policy Recommendations…………………………………………………………. 65
6.4 Limitations of the Study and Areas for Further Research………………………… 68
University of Ghana http://ugspace.ug.edu.gh

viii
REFERENCES………………………………………………………………………………………. 69
APPENDIX………………………………………………………………………………………….. 83
Appendix I: List of the 42 SSA countries in the study by region…………………………………….83
Appendix II: GDP per Capita (growth) and Export Diversification for SSA, 1995–2010…. 84
Appendix III: Summary of Some Key and Recent Literature Reviewed…………………… 85
University of Ghana http://ugspace.ug.edu.gh

ix
LIST OF TABLES
TABLE PAGE
Table 1.1: Export Structure and Growth Performance of SSA and East Asia …………4
Table 2.2: Selected Macroeconomic Variables in Various Regions of the World, 1995–
2010…………………………………………………………………………………...15
Table 4.1: Summary of Explanatory Variables and their Expected Signs …………....29
Table 5.1: Descriptive Statistics of Real GDP per Capita and its Determinants……...51
Table 5.2: System GMM Estimations Based on the Augmented Solow Growth
Model………………………………………………………………………………….53
Table 5.3: Durbin–Wu–Hausman (DWH) Test for Endogeneity……………………..55
Table 5.4: Breusch –Pagan / Cook –Weisberg Test for Heteroscedasticity…………..57
Table 5.5: Hausman Test for Fixed versus Random Effects………………………….58
Table 5.6: Fisher–Type Stationarity (Unit Root) Test………………………………...59
University of Ghana http://ugspace.ug.edu.gh

x
LIST OF FIGURES
FIGURE PAGE
Figure 1: Evolution of Real GDP per Capita Growth and EDI in SSA, 1995–2010.…..5
Figure 2: The Hump–shaped Relationship between ED and Economic Growth………6
Figure 3: Trend of FDI, GDP per Capita Growth, ED and Population Growth in SSA,
1995–2010…………………………………………………………………………….13
Figure 4: Trend of Gross Fixed Capital Formation and School Enrolment for SSA,
1995–2000…………………………………………………………………………….16
University of Ghana http://ugspace.ug.edu.gh

xi
ACRONYMS
ADI
African Development Indicators
CDI Critical Diversification Index
EC Export Concentration
ECI Export Concentration Index
ED Export Diversification
EDI Export Diversification Index
EDUMMY Dummy for East Africa countries
FDI Foreign Direct Investment
FE Fixed Effects
GDP Gross Domestic Product
GLS Generalised Least Squares
GMM Generalised Method of Moments
HHI
IMF
Hirschman–Herfindahl Index
International Monetary Fund
IV Instrumental Variable
MDUMMY Dummy for Middle (Central) Africa countries
OLS Ordinary Least Squares
RE Random Effects
SDUMMY Dummy for Southern Africa countries
WDI World Development Index
WDUMMY Dummy for West Africa Countries
University of Ghana http://ugspace.ug.edu.gh

1
CHAPTER ONE
INTRODUCTION
1.1 Background
Growth is central to the study of economics and has been a major subject of concern for
nations and economists all over the world. The idea that export diversification (ED) induces
economic growth is not alien to the development economics literature. In a general sense,
export diversification may be seen as a change in the composition of the existing export
structure of an economy. Dennis and Shepherd (2007) look at export diversification as a
process of widening the range of products that a country exports. It may also be referred to as
the spread of a country’s production and exports over many sectors (Samen, 2010). Two
main types of export diversification are identified in the literature. These are horizontal
export diversification and vertical export diversification. Horizontal export diversification is
defined as the process of increasing the number of export products of a country by
diversifying into goods within the same broad category of commodities (meaning that it takes
place within the same sector by introducing new export products to an existing export basket
in the same sector); while vertical export diversification is seen as a process of shifting from
the export of primary commodities to the export of manufactured products (Agosin, 2007).
The idea that the degree of specialisation (concentration) and diversification of the
production and trade structure of a country matters for its economic development is one of
the earliest discoveries in the economic development literature (Naudé and Rossouw, 2008).
University of Ghana http://ugspace.ug.edu.gh

2
There have been several debates in the literature in relation to whether developing countries
should diversify their exports as a means of attaining higher economic growth or on the
contrary, specialise in order to enjoy gains from comparative advantage. The work of
classical trade theorists, notably Adam Smith and David Ricardo emphasised the role of
specialisation for economic development. This idea is also largely favoured by neoclassical
economists.
Export diversification came to light in the literature through the widely cited works of
Prebisch (1950) and Singer (1950) who question the pro–free trade views mainly held by the
classical trade theorists and argue that because of the tendency of the terms–of–trade between
primary and manufactured products to decline over time, specialisation is not in the best
economic interest of developing countries. This is because developing countries largely
depend on the production and export of primary commodities. It is further observed that
specialisation mainly around primary commodities exposes countries to adverse external
shocks, resulting in deteriorating terms–of–trade which subsequently slows down growth
(Hesse, 2008). Hausmann and Klinger (2007) established that a country’s export pattern is a
good predictor of its future growth. They further stipulate that for a country to become rich, it
needs to export “rich country” exports. This means that for developing countries to attain the
income level of developed countries, they must diversify their exports from primary to
manufactured goods which are largely considered as “rich country” exports.
The contribution of export diversification to economic growth has therefore assumed a
central stage in the development literature and has intrigued researchers over the past six
decades. Lederman and Maloney (2003) identify export diversification as a promoter of
economic growth in developing countries. According to Yokoyama and Alemu (2009),
University of Ghana http://ugspace.ug.edu.gh

3
export diversification can be seen as a process of widening comparative advantage which is
essential to economic growth. Countries like South Korea, Taiwan, Mauritius, Finland,
China, and Chile are said to have attained high economic growth rates largely as a result of
export diversification (Agosin, 2007).
Diversification into new primary export products or manufactured goods is generally viewed
as a positive development. Its benefits include higher and more stable export earnings, job
creation and learning effects, and the development of new skills and infrastructure that would
facilitate the development or discovery of new export products (Osakwe, 2007).
Notwithstanding the foregoing observations, the assessment of the effect of export
diversification on economic growth in Sub–Saharan Africa (SSA) has not received much
attention. This study therefore seeks to explore the relationship between export
diversification and economic growth in SSA.
The Sub–Saharan Africa (SSA) region consists of forty–eight (48) African countries
geographically lying in the south of the Sahara. It covers a total land area of 23,638,000
square kilometres and has an estimated population of 841 million people with an annual
average population growth rate of 2.5 percent for the period 1995–2010. In the same period,
the region’s annual GDP per capita growth rate ranged between –0.2 and 3.8 percent (World
Bank, 2012).
University of Ghana http://ugspace.ug.edu.gh

4
1.2 Problem Statement
Most Sub–Saharan Africa countries are associated with the problem of low and volatile
growth in the face of high incidence of poverty over the years. Poverty is essentially not a
good in a nation’s commodity basket; and which according to Hesse (2008), cannot be
reduced in isolation of economic growth. The idea has been that export diversification can
lead to higher growth. But this assertion over the years has largely remained theoretical since
empirical literature explaining the amount of growth that could be induced by export
diversification is sparse, especially in the case of SSA.
It is observed from the literature that the export baskets of high income countries contain
high value–chain commodities whilst that of low income countries; especially those in SSA
largely produce and export primary goods which are very low value–added products
(Yokoyama and Alemu, 2009). Economic theory suggests that relative to manufactured
products, agricultural (primary) commodity prices are prone to inherent world market
volatilities (Osakwe, 2007). Also, the emergence of synthetic substitutes over the years has
further deepened the woes of the exporters of primary products by displacing them as
intermediate inputs (Yokoyama and Alemu, 2009). Following in a similar analogy, Pinaud
and Wegner (2004) observed that the economies of Africa still lack the necessary “shock
absorbers” to withstand internal and external shocks. The point may therefore be advanced
that Africa’s efforts at climbing the economic heights have partly been crippled by high
dependence on a few primary export commodities. In effect, SSA has over the years been
considered the poorest region in the world and the only region where economies are
stagnating; half of its population live on less than one dollar a day; and life expectancy is
falling (Yokoyama and Alemu, 2009).
University of Ghana http://ugspace.ug.edu.gh

5
Figure 1: Evolution of Real GDP per Capita Growth and EDI in SSA, 1995–2010
Source: World Bank, World Development Indicators Online, 2012.
It is observed from Figure 1 that SSA as a whole has not significantly diversified its exports
over the period under review. GDP per capita growth rate has also been fluctuating, attaining
negative values in 1998, 1999 and 2009. The point is made that the growth experiences of
many developing countries, especially those in East Asia are associated with export
diversification (Yokoyama and Alemu, 2009). The observation regarding SSA is that the
economies in the region recorded low growth rates over the years but are yet to significantly
diversify their exports. The question that therefore arises is whether export diversification in
SSA would bring about economic growth as it did for East Asia.
Further, the available theoretical and empirical literature largely suggests a hump–shaped
relationship between export diversification and growth (see Imbs and Wacziarg, 2003;
Aditya and Roy, 2007; Hesse, 2008); meaning that export diversification would promote
economic growth to a point beyond which it would slow down growth. The point beyond
which export diversification slows the pace of growth is referred to as the Critical
Diversification Index (CDI).
University of Ghana http://ugspace.ug.edu.gh

6
Figure 2: The Hump–shaped Relationship between ED and Economic Growth
Income Growth
ED
0
CDI Export Diversification
Interestingly, most of the empirical literature on export diversification and growth in SSA has
not considered testing the hump–shaped relationship; hence the critical diversification index
(CDI) for SSA remains unknown. Knowledge of the CDI for SSA is essential because it
would help determine appropriate policy prescriptions regarding export diversification. This
therefore necessitates further empirical work on SSA in this area of study and this current
study follows in that direction.
1.3 Research Questions
The study seeks to provide answers to the following questions:
What is the effect of export diversification on economic growth in SSA?
University of Ghana http://ugspace.ug.edu.gh

7
Does a hump–shaped relationship exist between export diversification and economic
growth in SSA?
What is the Critical Diversification Index (CDI) for SSA if a hump–shaped
relationship exists between export diversification and economic growth?
1.4 Research Objectives
The general objective of the study is to empirically investigate the relationship between
export diversification and economic growth in Sub–Saharan Africa. The specific research
objectives of the study are to:
Examine the effect of export diversification on economic growth in SSA;
Test the hypothesis of a hump–shaped relationship between export diversification and
economic growth for SSA.
Compute the Critical Diversification Index (CDI) for SSA if a hump–shaped
relationship exists between export diversification and economic growth.
1.5 Significance of the Study
Poor growth performance has been one of the major problems confronting most SSA
countries over the years (Yokoyama and Alemu, 2009). This phenomenon has caught the
attention of researchers who sought to explain the possible reasons for the rather dismal
economic performance of SSA countries over the years. Prominent among the various
contributing factors is the concentration of African economies on the export of a few
University of Ghana http://ugspace.ug.edu.gh

8
traditional primary exports which are highly sensitive to international price fluctuations
(Osakwe, 2007).
The point is made that dependence on a narrow range of exports results in risks associated
with the lack of diversification; thereby increasing a country’s vulnerability to international
economic shocks. Export diversification aims at mitigating these risks, including the
volatility and instability in export earnings which subsequently exert adverse macroeconomic
effects on growth, employment, investment planning, export capacity, foreign exchange
reserves, inflation, capital flight and debt repayment (Samen, 2010). This is because
according to the United Nations (2012), the world economy is entering a period full of
uncertainties and challenges hence African economies must vigorously pursue structural
transformation in order to ensure sustained growth, create jobs and reduce vulnerability to
external shocks. This study attempts to inquire if export diversification is worth considering
in this structural transformation process.
In addition, economic theory seems to suggest that export diversification policies may lead to
faster economic growth; but whether such a relationship exists in reality still remains an
empirical issue. A plethora of empirical studies have been undertaken in this context over the
past decade (see inter alia Al-Marhubi, 2000; Herzer and Nowak-Lehman, 2006; Agosin
2007; Lederman and Maloney, 2007, Imbs and Wacziarg, 2003; Klinger and Lederman,
2005; Aditya and Roy, 2007; Hesse, 2008; Yokoyama and Alemu, 2009). However, the
findings of these studies are not conclusive on the “export diversification – economic
growth” nexus, thereby calling for further research in the field. The point is that while some
studies find a monotonic relationship between export diversification and growth, others
provide evidence of a non–monotonic relationship.
University of Ghana http://ugspace.ug.edu.gh

9
This study contributes to the existing literature by examining the link between export
diversification and economic growth in SSA. It also seeks to test the hump–shaped
relationship between ED and economic growth; and if such a relation exists, compute the
critical diversification index for SSA.
Furthermore, the previous studies do not control for the diversity in the economic
performance of the various regional blocks in SSA. The study acknowledges these
differences and therefore introduces regional dummies for West, South, East and Central
African countries. The study also uses very recent data on export diversification for forty–
two (42) SSA countries for the period 1995–2010 in its analysis.
1.6 Scope and Source of Data for the Study
The study uses panel data on forty–two (42) SSA countries1 for the period 1995–2010 for
which consistently sufficient data are available. The study could not cover all the forty–eight
(48) countries in SSA due to unavailability of consistent data for six countries. Data for all
variables used for the analysis are extracted from the World Bank’s World Development
Indicators (WDI) Online Database, 2012.
1.7 Overview of Chapters
The study has six (6) chapters. This introductory chapter is followed by chapter two, which is
dedicated to an overview of GDP per capita growth and its determinants in SSA. A review of
the theoretical and empirical literature on the relationship between export diversification and
1 See Appendix I for the list of the countries in the study classified in their various regional groupings.
University of Ghana http://ugspace.ug.edu.gh

10
economic growth is provided in chapter three. The fourth chapter presents the methodology
and the empirical model adopted by the study. Empirical results are presented and discussed
in chapter five. The summary, conclusions and policy recommendations emerging from the
study are presented in chapter six.
University of Ghana http://ugspace.ug.edu.gh

11
CHAPTER TWO
OVERVIEW
2.1 Introduction
This chapter provides a trend analysis of the variables under study for the period 1995–2010
in SSA. The next section analyses the GDP per capita growth performance of the region,
followed by a discussion of the performance of the region in terms of export diversification
in Section 2.3. In Sections 2.4, 2.5, 2.6 and 2.7, a trend analysis of population growth, FDI,
gross fixed capital formation, and gross secondary school enrolment are respectively
provided for SSA for the period under review.
2.2 GDP per Capita Growth
The growth performance of SSA countries has been very low and volatile over the years.
SSA countries have also been associated with the age old stories of extreme poverty over the
years. Elsewhere, the African continent which is composed mainly of SSA countries earned
the accolade: “the dark continent”. This has been the picture of the region. However, since
attaining independence in the 1950s and 60s, most SSA countries made some significant
economic strides raising hopes for better economic performance in subsequent years. But this
performance was short–lived; and as a result, the 1970s and 80s have been rightly christened:
“the lost decades” of the region.
Most countries in the region adopted the Economic Recovery Programme initiated by the
World Bank and IMF in the 1980s under the umbrella of the Washington Consensus to
University of Ghana http://ugspace.ug.edu.gh

12
reverse the worsening economic trends of countries in the region. The recovery process has
been very slow, raising doubts about the efficacy of the ERP, with severe criticisms against
the World Bank and IMF from many researchers especially from the sub–region. Economic
performance of the region in recent times especially since the early 2000s has been quite
positive. However, according to the World Bank (2013), though the economic prospects for
Sub-Saharan Africa looks quite strong, growth in the region is still vulnerable to sharp
declines in commodity prices.
Table 2.1: Sub–regional Growth and Export Diversification Performance, 1995–2010
Variable East
Africa
Middle
Africa
Southern
Africa
West
Africa
SSA
Real GDP per capita (Constant
US$)
1,489.01 1,182.03 1,896.73 588.95 1,452.29
Real GDP per capita growth
(annual %)
4.4 2.3 2.2 2.4 4.96
Export diversification index 0.80 0.76 0.76 0.78 0.77
Source: Author’s Computation Using STATA 12.
Aside the fact that the GDP per capita of the region on aggregate has not been quite
impressive, there has also been wide disparity gaps between countries to the extent that the
GDP per capita of the richest SSA country is 83 times larger than that of the poorest (World
Bank, 2012).
University of Ghana http://ugspace.ug.edu.gh

13
2.3 Export Diversification
From Figure 2, we observe that growth in per capita GDP has been volatile between 1995
and 2010. Among others, the volatile growth trend has been partly attributed to the reliance
of the region on primary products for export earnings (Osakwe, 2007). The ability of a
diversified export base to reduce the volatility in export earnings and for that matter
smoothen economic growth is not a recent discovery (see inter alia Presbisch, 1950; Singer
1950; and Hesse, 2008). However, export diversification has on improved much in SSA over
the years; and according to the World Bank (2012), in 21 percent of SSA countries, one or
two products accounts for at least 75 percent of total exports. From Figure 2, we observe that
the index of export diversification has not experienced any significant change during the
period under review.
Figure 3: Trend of FDI, GDP per Capita Growth, ED and Population Growth in SSA,
1995–2010
Source: Author’s computation from World Bank’s WDI Database (2012)
-1
0
1
2
3
4
5
19
95
19
96
19
97
19
98
19
99
20
00
20
01
20
02
20
03
20
04
20
05
20
06
20
07
20
08
20
09
20
10
Foreign direct investment,net inflows (% of GDP)
GDP per capita growth(annual %)
Population growth (annual %)
Export product diversificationindex
University of Ghana http://ugspace.ug.edu.gh

14
2.4 Population Growth
Over the period under review, the population growth rate of the region has not changed
significantly. The average population growth rate of the region remained about 2.7 percent
during the period. It is observed from Figure 2 that for the bulk of the period under review,
the population growth rate far exceeds the GDP per capita growth rate. The implication of
this is that standard of living would be worsening.
2.5 Foreign Direct Investment
Though FDI inflows into the region largely follow an upward trend over the years, inflows
into the region have been considered low compared to some other developing regions of the
world. For instance, Latin America and Caribbean recorded 3.0 percent as compared to 2.9
percent on average for SSA during the period under review (see Table 2.2). This is evident in
the region for instance recording 1.8 percent as compared to 16.2 percent for East Asia in
2005 (Yokoyama and Alemu, 2009). FDI inflows into the region are not only low; they also
exhibit certain geographical and sectoral biases. FDI inflows usually move to natural
resource–rich countries such as South Africa, Nigeria, Angola, and Sudan; and the natural
resource sector, especially the mineral–extracting industry remains the largest recipient of
FDI inflows into the region (Alemu and Yokoyama, 2009). It has been argued time and again
that FDI into such sectors of the economic is followed by capital flight after the mining
operations. This notwithstanding, FDI inflows as a percentage of GDP has followed an
increasing trend over the period under discussion; from about 1.4 percent of GDP in 1995, it
attained a peak of about 4.5 percent in 2001 before slightly falling to about 2.8 percent in
2010.
University of Ghana http://ugspace.ug.edu.gh

15
Table 2.2: Selected Macroeconomic Variables in Various Regions of the World, 1995–
2010
Region
Enrolment
secondary
(% gross)
FDI, net
inflows (%
of GDP)
GDP/capita
(constant
2005 US$)
GDP/capita
growth
(annual %)
Gross fixed
capital
formation (%
GDP)
East Asia & Pacific 67.4 1.9 4,469.53 2.8 27.7
Europe & Central
Asia 95.3 3.4 17,359.82 1.9 20.0
Latin America &
Caribbean 83.6 3.0 4,873.83 1.6 18.9
Middle East & North
Africa 70.5 2.2 4,034.26 2.3 21.7
North America 96.0 1.8 39,130.78 1.5 18.5
South Asia 47.7 1.3 647.38 4.9 25.6
Sub-Saharan Africa 30.1 2.9 834.35 1.6 18.6
World 62.8 2.5 6,733.87 1.5 21.4
Source: Computed from World Bank WDI Database, 2012.
2.6 Gross Fixed Capital Formation
Insufficient resource mobilisation and low level of capital formation have been characteristic
of most SSA countries over the years. This phenomenon continues to impede investment and
productivity in their economies. Empirical evidence and international comparisons indicate
that gross fixed capital formation in SSA is very low. Though gross fixed capital formation
has been increasing for the region during the period under review (see Figure 3), From Table
2.1, the region’s level of capital formation (18.6 percent) is still low as compared to other
developing regions of the world such as East Asia and Pacific (27.7 percent), South Asia
(25.6 percent), Latin America and Caribbean (18.9 percent). Also, the level of capital
formation of the region falls below the world average for the period under review. This is a
major concern because private investment has been considered as having great growth–
inducing effect than government investment because of its close association with efficiency
and corruption (Hernandez–Cata, 2000). Again this is a major concern because the official
University of Ghana http://ugspace.ug.edu.gh

16
development assistant which is a major source of funding for the bulk of public sector
investments in the SSA region has been on the decline in recent years (World Bank, 2012).
Low capital formation may therefore imply low domestic investment which may
consequently result in low productivity and growth.
Figure 4: Trend of Gross Fixed Capital Formation and School Enrolment for SSA,
1995–2000
Source: Author’s computation from World Bank’s WDI Database (2012)
2.7 Gross Secondary School Enrolment
Gross Secondary School Enrolment which has been used severally employed in the literature
as a measure of human capital has improved remarkably over the period under review, rising
from 23.8 percent in 1995 to 40.1 percent in 2010. However, in comparison to other
developing regions of the world, SSA recorded the lowest average enrolment rate of 30.1
among all the other regions, falling far below the world average of 62.8 over the period (see
Table 2.2). Since education is an essential element of human capital accumulation, low level
of enrolment may therefore imply that the human capital accumulation may also be low
(Mankiw et al, 1992).
0
10
20
30
40
50
19
95
19
96
19
97
19
98
19
99
20
00
20
01
20
02
20
03
20
04
20
05
20
06
20
07
20
08
20
09
20
10
Gross fixed capital formation(% of GDP)
School enrollment, secondary(% gross)
University of Ghana http://ugspace.ug.edu.gh
17
CHAPTER THREE
LITERATURE REVIEW
3.1 Introduction
This chapter of the study provides theoretical and empirical underpinnings in support of the
study. Literature is reviewed on the theories and empirical works that provide explanations as
to why export diversification may result in the acceleration in economic growth. This chapter
has two main sections. The next section presents a review of the theoretical literature, while
Section 2.3 is dedicated to the review of the empirical literature. The chapter intends to
identify the gaps in the existing literature and establish the essence and contribution of this
current study.
3.2 Theoretical Literature
First of all, it must be noted that though the benefits of a diversified export base is well–
pronounced in the literature, there exists no unified theoretical framework explaining the
driving forces of export diversification at the macroeconomic level (Bebczuk and Berrettoni,
2006).
Judging from the various ideological perspectives on trade in the literature, export
diversification and specialisation (concentration) appear to represent two different views on
trade. Classical trade theories favour the view that countries should specialise in the
production and export of commodities in which they have comparative advantage. This is
supported by the point that by specialising in production and exports, resource allocation will
University of Ghana http://ugspace.ug.edu.gh

18
be more efficient and each country will increase its welfare and growth. Critics of this view
are of the opinion that by specialising and exporting a relatively small number of products,
countries, especially those with low incomes may increase their degree of vulnerability to
external shocks. Policymakers must therefore adopt strategies to handle the trade–off
between efficiency and vulnerability. This vulnerability is considered to be very severe for
economies that have comparative advantage in the production and export of primary products
(Osakwe, 2007).
Furthermore, it has been pointed out that the prediction of the classical trade theories that
specialisation is efficient hinges partly on the assumption that there exists no uncertainty in
production and exports of commodities (Osakwe, 2007). Evidence is available in the
literature to the effect that in the presence of uncertainty and risk aversion, diversification
may prove a better policy option than specialisation (Turnovsky, 1974; Ruffin, 1974). This is
because in most developing countries, majority of people live in rural communities, with
imperfect and underdeveloped financial markets, and access to borrowing is limited
(Osakwe, 2007). According to the World Bank (2011), 48 percent of the world’s population
live in rural areas; 64 percent and 69 percent of the population of SSA and South Asia
respectively live in rural areas. Diversification therefore serves as a mechanism to cushion
agents against income fluctuations in such rural economies associated with market
imperfections and unavailable social safety nets. For these reasons, notwithstanding the
theoretical arguments for specialisation from comparative advantage, policymakers in
developing countries may consider diversification of their production and export structure as
a means of minimising the vulnerability of their economies to external shocks.
University of Ghana http://ugspace.ug.edu.gh

19
Yokoyama and Alemu (2009) see export diversification as a means of widening a country’s
comparative advantage and further present three main theoretical arguments that may be
considered in explaining the possible reasons why export diversification may positively
affect economic growth. These are the traditional argument, the endogenous growth theory,
and the structural models of economic development. These are subsequently discussed as
follows.
The traditional argument is of the view that less developed countries are exporters of a
limited number of primary products which are highly vulnerable to international market
demand. The instability in their export demand results in unstable export earnings, and since
most developing countries depend to a very large extent on export earnings for income,
growth in national income also becomes volatile. The point is that diversification of a
country’s export portfolio has the ability to smoothen export earnings in the face of unstable
world market conditions, thereby ensuring stability in income earnings. It has been argued
that in the absence of export diversification, developing countries are highly likely to
experience foreign exchange and balance of payments instability, which have negative
implications for debt servicing, economic management and investment planning (Osakwe,
2007). These implications consequently create uncertainty in the macroeconomic front,
thereby discouraging domestic investment, especially for risk–averse investors (Ali et al,
1991). For this reason, a more diversified export mix may enhance economic stability and
growth of countries. Export diversification has therefore been projected for its ability to avert
the problem of unstable foreign demand and thereby shielding developing countries from its
detrimental economic consequences.
University of Ghana http://ugspace.ug.edu.gh

20
From the perspective of the endogenous growth theory, aside the ability of export
diversification to smoothen export earnings, it also has the capacity to bring about benefits in
terms of new comparative advantage associated with the diversification of a country’s
production structure. It is considered to widen the comparative advantage of developing
countries from a few primary production sectors to higher value production sectors which
may result in better allocation of productive resources. The argument is further forwarded
that through backward and forward linkages, new industries will be created through
diversification of the production structure. Export diversification generates new production
technologies and management efficiencies through international competition, thereby leading
to increasing returns to scale and spillover effects which ultimately affect growth in the long–
run. In effect, export diversification enables countries to benefit from dynamic gains from
trade as it leads to an expansion in the production possibility frontier of the exporting
economy.
The structural models of economic growth indicate that in order to attain meaningful
sustainable growth, export diversification policies should be targeted at moving away from
primary commodities towards manufactured goods. This is likely to generate backward and
forward linkages which are capable of creating new industries and expanding existing ones
(Chenery, 1979; Syrquin, 1989). The structural argument seems to suggest that vertical
export diversification possesses greater ability to impact growth as compared to horizontal
export diversification. This suggests that the content rather than the number of products in a
country’s export basket is very essential to its economic prosperity.
Following Yokoyama and Alemu (2009), the means by which export diversification may
influence a country’s national income or growth may be summarised in five (5) essential
University of Ghana http://ugspace.ug.edu.gh

21
points as follows. First of all, since export diversification generates spillover effects in an
economy, it may be considered as a production catalyst (a production factor) that increases
the productivity of the other factors of production (Romer, 1990). Secondly, export
diversification may increase income by expanding the possibilities to spread investment risks
over a wider portfolio of economic sectors. Thirdly, export diversification is considered as a
component of Total Factor Productivity (TFP) and is expected to exert positive impact on
TFP growth, thereby promoting economic growth. TFP has been identified as the single most
influential factor affecting the growth of SSA countries (Fosu, 2012). Fourthly, export
diversification may also have a positive effect on growth because of the existence of
economies of scope in production. This exists when a given level of inputs generates greater
inputs per unit profits when spread across many outputs than when dedicated to any one
output. Finally, through forward and backward linkages, production of a diversified export
structure is also likely to induce the creation of new industries and expansion of existing ones
in the economy.
Notwithstanding the various arguments and the theoretical explanations forwarded for the
channel through which export diversification translates into growth, the evidence as to
whether export diversification impacts growth for countries and regions of the world remains
an empirical issue. The next section provides a review of the recent and relevant empirical
literature available on the diversification–growth nexus.
University of Ghana http://ugspace.ug.edu.gh

22
3.3 Empirical Literature
The literature over the years seeks to establish a link between export diversification and
economic growth through cross–country, regional, country–level and firm–level studies. The
findings of the available studies are however mixed as some find a monotonic relationship
between export diversification and economic growth while others find a non–monotonic
relationship. Even with those that find a monotonic relationship, there seems to be ambiguity
regarding the effect of export diversification on growth; as some find a positive effect (see
inter alia Al-Marhubi, 2000; Herzer and Nowak-Lehman, 2006; Agosin 2007; Lederman and
Maloney, 2007) while others find a negative effect (see Guiterez de Pineres and Ferrantino,
2000).
Though the theoretical and empirical literature largely points to a positive relationship
between export diversification and growth, there exists literature (using cross–country and
regional data) suggesting that some countries gain from export concentration while others
benefit from export diversification. This mixed evidence was first introduced into the
literature by Imbs and Wacziarg (2003) who provide theoretical and empirical proof of a U–
shaped relationship between export concentration and economic growth. The paper shows
that countries first diversify by spreading economic activity more equally across sectors, but
there exists a point in the development process at which they start specialising again. Using a
wide panel of countries, the paper informs the theoretical debate about the evolution of
sectoral diversification across time and across countries. The empirical results show a non–
monotonic relationship between export diversification and per capita income; implying that
as poor countries begin to diversify, it is not until they attain relatively high levels of income
per capita that incentives to specialise become relevant to their economic growth. The
University of Ghana http://ugspace.ug.edu.gh

23
evidence of a non–monotonic (hump–shaped) relationship means that export diversification
is associated with production in the early stages of a country’s development; and then turns
to specialisation as the country attains higher income per capita of about US$25,000 GDP per
capita in PPP.
This finding is a departure from the monotonic relationship predicted by existing trade and
growth theories between income growth and export diversification; and therefore generated
much interest in the literature, resulting in similar studies among others as Klinger and
Lederman (2006), Cabellero and Cowan (2006), Hesse (2008), and Cadot et al (2009) which
use different data periods and methodologies but find evidence in support of the non–
monotonic relationship between export diversification and growth in per capita income.
Hesse (2008) for instance, estimating an augmented Solow growth model using the system
GMM estimator for a sample of ninety–nine (99) countries finds some evidence of a non–
monotonic relationship. Klinger and Lederman (2006) also show that the exports of countries
evolve in a manner similar to that of domestic production and reveal that the per capita
income level beyond which export concentration will benefit a country is about US$25,000;
implying that low income countries will benefit from export diversification while advanced
countries benefit from export concentration. Similar results emerged from the study by
Cadot et al (2009), who use data of a hundred and fifty–six (156) countries over nineteen
(19) years and find a hump–shaped relationship between economic development and export
diversification. However, Cadot et al (2009), unlike Klinger and Lederman (2006), and Imbs
and Wacziarg (2003), find the turning point at which export specialisation will benefit a
country to be about $22,000 GDP per capita at purchasing power parity (PPP). The
implication of the non–linear relationship is that as poor countries begin to diversify, it is not
University of Ghana http://ugspace.ug.edu.gh

24
until they attain relatively high levels of income per capita that incentives to specialise
become relevant to their economic growth. It is therefore concluded that developing
countries would benefit from export diversification and developed countries would benefit
from export concentration. The problem with these studies is that conclusions are drawn for
all developing regions lumped together; without taking into account the specific
developmental challenges of the various developing regions of the world. It is in this
consideration that this current study specifically aims at assessing the relationship between
export diversification and economic growth in SSA.
Aside the literature suggesting a hump–shaped relationship between export diversification
and growth, other studies provide evidence of a positive monotonic relationship. This
evidence is widely established across country–specific, regional and cross–country findings
using diverse methodological approaches.
First of all, a widely cited work in the literature, Al–Marhubi (2000), using a cross–country
sample of ninety–one (91) countries for the period 1961–1988, finds evidence across
different model specifications and different measures of export diversification that export
diversification leads to faster growth. A major drawback of this paper is that it fails to test the
hypothesis of non –monotonic relationship between ED and growth which was found to be
significant in similar cross–country studies such as Imbs and Wacziarg (2003), Hesse (2008)
and Cadot et al (2009). Other cross–country studies such as Herzer and Nowak-Lehman
(2006); Agosin (2007); and Lederman and Maloney (2007) provide evidence of a positive
effect of export diversification on economic growth but fail to account for the non–
monotonic relationship between export diversification and economic growth. The non–
monotonic hypothesis is very essential in cross–country studies as it provides an idea about
University of Ghana http://ugspace.ug.edu.gh
25
whether countries are likely to benefit from export diversification or export specialisation
(concentration). Failure to test this hypothesis may lead to misleading policy prescriptions.
For instance, if there is evidence of a non–monotonic relationship which is not accounted for,
a country that should benefit from export specialisation may embark on an export
diversification policy which may result in declining economic growth rates. This current
study considers the non–monotonic hypothesis in its analysis so as to establish a clear export
diversification policy prescription for countries in Sub–Saharan Africa.
The literature on export diversification and growth is not limited to cross–country studies; it
also extends to some regional and specific country studies. For instance, Herzer and Nowak-
Lehmann (2006) analyses the diversification and growth experience of Chile, establishing a
positive effect of diversification on growth. Naudé and Rossouw (2008) find evidence of a
U–shaped relationship between GDP per capita and export specialisation for the period
1962–2000 in South Africa using a Computable General Equilibrium Framework; providing
further evidence in the same study that export diversification Granger causes GDP per capita.
Contrary to the findings of Herzer and Nowak–Lehmann (2006) and Naudé and Rossouw
(2008), Guiterez de Pineres and Ferrantino (2000) earlier in their study rejected the
hypothesis that export diversification promotes economic growth. Using time series analysis
for Chile and Colombia, they find a negative relationship between export diversification and
growth. However, Herzer and Nowak–Lehmann (2006), in a critique to the work of Guiterez
de Pineres and Ferrantino (2000) reveal many flaws in their methodological approach; to the
extent that standard time series statistical tests as cointegration, normality, heteroscedasticity
and autocorrelation tests were not conducted. The statistical integrity of the findings of
Guiterez de Pineres and Ferrantino (2000) is therefore in question. Many other specific
University of Ghana http://ugspace.ug.edu.gh

26
country studies are in conformity with the findings of Herzer and Nowak-Lehmann (2006) by
producing evidence of a positive relationship between export diversification and economic
growth (see Agosin 1999, Arip et al, 2010).
Notwithstanding the relatively vast number of studies in the field of export diversification
and growth, only a handful of studies specifically attempt to test the diversification–growth
hypothesis for Sub–Saharan Africa (see Yokoyama and Alemu, 2009; Songwe and Winkler,
2012; Cabral and Veiga, 2012). Yokoyama and Alemu (2009) examine the effects of export
diversification on growth in SSA in comparison to East Asia. Using a panel data of forty–one
(41) countries from SSA (9 countries) and East Asia (32 countries) for the period 1975–2004,
the paper empirically investigates the separate effects of vertical and horizontal export
diversification on economic growth. The study shows that East Asian countries have been
successful in diversifying their exports; whereas diversification attempts of SSA were weak
and its contribution to growth and structural change on the economy was largely
insignificant. The study also reveals that though horizontal diversification positively affects
growth, its contribution is inferior as compared to vertical diversification for economic
growth. The reason is forwarded that whilst vertical diversification focuses on growth and
possesses strong dynamic spillover effects on an economy, horizontal diversification aims at
economic stability, with minimal spillover effects and is therefore not very impressive at
promoting economic growth. The paper therefore challenges the recommendations of certain
researchers that African countries should increase their primary export base. The paper
argued that SSA should rather promote vertical diversification through the production of
value–added goods which provide forward and backward production linkages, and therefore
University of Ghana http://ugspace.ug.edu.gh

27
results in the creation of sufficient levels of human and physical capital, infrastructure,
appropriate policies and strong institutions.
Though the study by Yokoyama and Alemu (2009) is intensive and widely cited in the
literature, the paper did not test the non–monotonic relationship between export
diversification and economic growth in SSA and East Asia. This current study fills that gap
by testing the hypothesis of a non–monotonic relationship between export diversification and
economic growth. It also includes dummies for the various regional blocks of SSA so as to
capture the specific effects of export diversification on economic growth for the various sub–
regions.
Generally, a survey of the available empirical literature shows that whilst some studies
indicate a positive monotonic relationship between export diversification and economic
growth (Al-Marhubi, 2000; Herzer and Nowak-Lehman, 2006; Agosin 2007; Lederman and
Maloney, 2007), others reveal a non–monotonic (hump–shaped) relationship between export
diversification and economic growth (Imbs and Wacziarg, 2003; Klinger and Lederman,
2006; Aditya and Roy, 2007; Hesse, 2008). These studies largely use datasets for different
time periods and regions across different methodologies. There seems to be mixed evidence
in the empirical literature regarding the specific functional relationship between export
diversification and growth; which calls for further studies in the field. This study contributes
to the literature by investigating this relationship in the context of SSA since the functional
relationship between export diversification and growth matters for policy.
University of Ghana http://ugspace.ug.edu.gh

28
3.4 Concluding Remarks
While some empirical studies provide evidence of a positive monotonic relationship between
export diversification and economic growth, others find a negative relationship while others
also find a non–monotonic relationship. This obvious ambiguity in the empirical literature
regarding the functional relationship between export diversification and economic growth
necessitates further research in the field to provide new evidence using recent data. The study
therefore aims at providing further evidence on the relationship between export
diversification and economic growth in SSA. The next chapter of the study provides a
discussion of the methodology that would be employed in determining the relationship
between export diversification and economic growth in SSA.
University of Ghana http://ugspace.ug.edu.gh

29
CHAPTER FOUR
METHODOLOGY
4.1 Introduction
This chapter discusses the theoretical framework and statistical techniques employed in
determining the relationship between export diversification and economic growth. This
chapter has seven (7) sections. The theoretical framework is discussed in the next section.
Section 4.3 discusses the explanatory variables and data sources, followed by the model for
empirical estimation in Section 4.4. The estimation technique employed is discussed in
Section 4.5. In Section 4.6, some diagnostic tests on the model are discussed, followed by the
chapter conclusion in the Section 4.7.
4.2 Description of Variables and Data Sources
Economic theory and existing empirical studies inform the choice of the explanatory
variables for the study. The study includes the following explanatory variables which are
considered as essential for economic growth in SSA. The variables are: Initial Real GDP per
Capita, Human Capital, Physical Capital, Population Growth, Foreign Direct Investment
(FDI), Export Diversification, Export Diversification Squared, Regional Dummies and
Interacted Variables of Export Diversification with the Regional Dummies. These variables
are discussed in the ensuing paragraphs with focus on their expected relationship with Real
GDP per Capita growth and their proxies. Data on all the variables are sourced from the
World Development Indicators (WDI) Online Database of the World Bank, 2012.
University of Ghana http://ugspace.ug.edu.gh
30
Initial Real GDP per Capita: In a dynamic panel model, the coefficient of the lagged
dependent variable measures the speed of adjustment of the dependent variable. A good
reason for introducing this variable as a regressor is to control for specification bias and also
account for the persistence in real GDP per capita growth over time. It is expected from the
theory of convergence that the coefficient of this variable would be negative. The first lag of
real GDP per capita is used as a proxy for initial GDP per capita.
Human Capital: Mincer (1981) posits that national income growth is affected by human
capital in the same way as accumulation of personal human capital yields individual income
(economic) growth. He further argues that the contribution of human capital to growth far
outweighs that of physical capital. He considers human capital as both “a condition and
consequence of growth”. The point is also made that human capital goes beyond the
accumulation of existing knowledge to the creation of new knowledge which is the bedrock
of innovation and technological change; ultimately resulting in increased productivity and
economic growth. As Mincer (1981) puts it, the benefit accruing from the new knowledge
generated by human capital is not limited to the domestic country alone, but spills over to the
entire world, leading to global economic growth. It is widely accepted in the literature that
human capital stock contributes positively to economic growth. According to Yokoyama and
Alemu (2009), developing human capital within an economy should be seen as a long–term
process which would enhance the innovative ability of the economy. Many empirical studies
provide evidence that human capital influences growth positively (see Mincer, 1981; Mankiw
et al, 1992). Gross secondary school enrolment is commonly used in the literature as a proxy
for human capital and this study follows in that line. From the human capital augmented
University of Ghana http://ugspace.ug.edu.gh

31
Solow model, it is therefore expected that human capital would positively affect growth in
this study.
Physical Domestic Capital: This according to the predictions of the augmented Solow model,
would raise the steady state of capital per worker, thereby resulting in an increase in output
per effective worker; therefore higher growth. Mankiw et al (1992) empirically demonstrate
that accumulation of physical capital has significant positive effects on growth. The
coefficient of physical domestic capital in the estimation model is therefore expected to be
positive. Following the usual practice in most growth estimation models, gross fixed capital
formation as a percentage of GDP is used as a proxy for physical domestic capital.
Foreign Direct Investment (FDI): The literature on FDI–growth nexus gives conflicting
theoretical predictions with regards to the effects of FDI on economic growth. It is widely
known that the flow of FDI has been increasing over the years; and developing nations
especially are implementing FDI–inducing policies to attract foreign investment. On one
hand, it is believed that technological transfers and spillovers accompany FDI flows; and
since there is an existing knowledge gap between poor and rich countries, such gaps could be
bridged through FDI flows. Further, technology plays a vital role in the production process;
hence productivity would increase in the domestic economy alongside other spillover effects
in the entire economy. FDI is also expected to positively affect growth due to its ability to
make scarce capital resources available and also increase competition in the domestic
economy. On the other hand, it is argued that the introduction of FDI into the domestic
economy would result in distortions (in prices and financial markets) which are detrimental
to resource allocation and subsequently slows growth (Carkovic and Levine, 2002). Other
theories also suggest that FDI can only be growth–inducing under certain conditions. These
University of Ghana http://ugspace.ug.edu.gh

32
conditions include the availability of efficient domestic financial markets, level of education
in the domestic economy, availability of skilled labour and other factors that strengthen the
capacity of the domestic economy to absorb the gains accruing from FDI. Empirically, while
some researchers find positive effect of FDI on growth (see Alfaro et al, 2004), others find
no significant effect of FDI on economic growth (see Blomstrom, Lipsey and Zejan, 1994;
Carkovic and Levine, 2002). The precise effect of FDI on economic growth therefore
remains theoretically ambiguous. Net FDI inflows as a percentage of GDP is used as the
measure of FDI.
Export Diversification: According to Imbs and Wacziarg (2003), export diversification
would positively affect growth up to a certain level of per capita income beyond which it
would affect growth negatively. Again, assessing export diversification in terms of its
contribution to economies of scale, dynamic spillover effects and total factor productivity
gives convincing belief that it has positive inducements on economic growth (Matthee and
Naudé, 2007). The export product diversification index2 is used to measure export
diversification. Following Al–Marhubi (2000), Yokoyama and Alemu (2009), and Hesse
(2008) among others, we expect a positive relationship between export diversification and
growth in real per capita GDP.
Export Diversification Squared: This variable is included in the model of estimation in order
to capture the possible non–linear (hump–shaped) relationship between ED and economic
2 The index is measured as:
/ / / /
2
ij i
ij
h h
ED , where ijh is the share of commodity i in total exports of
country j and ih is the share of commodity i in world exports. Its value ranges between 0 (for less diversified
exports) and 1 (for more diversified exports).
University of Ghana http://ugspace.ug.edu.gh

33
growth. The coefficient of this variable is expected to be negative since a non–linear
relationship is expected between export diversification and real per capita GDP growth (Imbs
and Wacziarg, 2003; Hesse, 2008). The point is that there would be a hump–shaped
relationship between export diversification and economic growth if the coefficient of ED is
positive and that of its squared term is negative. Evidence of a hump–shaped pattern would
mean that not all countries in SSA would benefit from diversifying their exports. The critical
diversification index (CDI) for SSA would be computed subject to the evidence of a hump–
shaped relationship between export diversification and growth.
Population Growth: From the literature, the precise relationship between population growth
and economic growth is theoretically ambiguous. According to the augmented Solow model,
countries with high population growth rate would have very low capita per worker and
therefore record low growth rates. This idea is empirically tested by Mankiw et al (1992)
with the evidence that high population growth negatively affects growth. The argument
forwarded is that in the presence of high population growth, the available capital spread over
a very large population would lead to very low capital per labour which reduces output per
labour and ultimately slows growth. On the contrary, the endogenous growth model predicts
that larger economies would perform better than smaller ones. Simon (1989) argues that
population growth essentially promotes growth as it forms the labour supply of an economy.
It is further argued that a larger population size if given the required training and skills would
culminate into a very strong human capital base which promotes economic growth. In
addition, large population size would provide a very large market size for domestic
producers; and this would lead to large scale production thereby resulting in the benefits of
University of Ghana http://ugspace.ug.edu.gh

34
economies of scale. The coefficient of population could therefore be either positive or
negative.
Regional dummies: These are introduced into the estimation equation to determine if
significant differences exist between the various regional blocks of SSA regarding the effect
of the explanatory variables on economic growth. The regional dummies are for East Africa,
Central (Middle) Africa, Southern Africa and West Africa. The regional dummies are
generated in such a way that for a particular regional dummy, countries in that region assume
a value of 1 and all other countries assume 0 values in that data column. These dummies are
further interacted with the export diversification index in order to determine if the effect of
export diversification on growth differs across the sub–region. East Africa is used as a
reference region since the region performs better relative to the other regions in terms of ED
and GDP per capita growth in the sample (see Table 2.1). Table 4.1 below provides a
summary of the explanatory variables, their proxies, and the expected sign of their coefficient
in relation to real per capita GDP growth.
Table 4.1: Summary of Explanatory Variables, their Expected Signs and Data Sources
Variable Indicator Expected Sign of
Coefficient
Initial Real GDP per
Capita
Initial GDP per capita (constant 2000 US$) Negative
Export Diversification
ED Squared
Export Product Diversification Index
Squared term of ED
Positive
Negative
FDI Net FDI as a percentage of GDP Positive/Negative
Human Capital Gross Secondary School Enrolment Positive
Physical Capital Gross fixed capital formation (%GDP) Positive
Population Annual Population Growth Rate Positive/Negative
Note: Data for all the variables are sourced from the World Development Indicators (WDI)
Online Database of the World Bank.
University of Ghana http://ugspace.ug.edu.gh

35
4.3 Theoretical Framework
In order to analyse the effect of export diversification on economic growth, a dynamic panel
growth regression model is estimated from the human capital augmented Solow growth
model introduced by Mankiw et al (1992). According to the human capital augmented Solow
growth model, growth in output per worker is a function of the initial output per worker, the
initial level of technology, the rate of technological progress, rate of depreciation, rate of
savings, and human capital accumulation.
The study adopts the dynamic panel growth framework in order to account for temporal
autocorrelation, reduce the level of potential spurious regression which may lead to
inaccurate inferences and inconsistent estimates. It also includes the lagged dependent
variable as a regressor in order to capture the lagged effects (persistence) of the dependent
variable.
The dynamic panel growth model is specified as:
'
, 1it i t it ity y x (4.1)
Where
it i it .
That is, the error term in equation (4.1) is decomposed into two components with the first
component measuring the unobserved country–specific effects while the second component
is the idiosyncratic error term.
Equation (4.2) can therefore be re-written as:
University of Ghana http://ugspace.ug.edu.gh

36
'
, 1it i t it i ity y x (4.2)
Where i indexes the countries under study, t denotes the years, ity is the real GDP per capita
growth, , 1i ty is the lagged real GDP per capita, itx is a matrix of all the explanatory
variables including export diversification, i is an unobserved country–specific time–
invariant effect, and it is the idiosyncratic error term.
4.4 Model for Empirical Estimation
From the dynamic panel equation (4.2) and following Al–Marhubi (2000); Hesse (2008); and
Alemu and Yokohama (2009) with few modifications based on the description of the
variables in Section 4.3, the model to be estimated is therefore written as:
2
1 , 1 2 3 4 5 6
4 4
7 8 9
1 1
* ..........................................................................(4.3)
it i t it it it it it
it i i it
RGDPPCG RGDPPC GFCF ED ED POP ENROL
FDI D ED D
Where
itRGDPPCG = Real GDP per capita growth.
, 1i tRGDPPC = Initial real GDP per capita.
itGFCF = Gross fixed capital formation (used as a proxy for domestic physical capital or
domestic investment).
itED = Index of export diversification.
University of Ghana http://ugspace.ug.edu.gh

37
2
itED = Squared term of the index of export diversification.
itPOP = Population growth rate.
itENROL = Gross secondary school enrolment rate (a proxy for human capital).
itFDI = Foreign direct investment as a percentage of GDP.
iD = Regional dummy for four regional blocks (East, Central, Southern and West Africa
sub–regions).
* iED D = Product (interaction) of export diversification index and the regional dummies.
it = Idiosyncratic error term.
The index i represents the countries and t indexes the time period in years. In exception of the
regional dummies ( iD ), natural logarithms are taken for all the variables in the regression
model.
The Critical Diversification Index (CDI) is derived by setting the partial derivative of real
GDP per capita with respect to the index of export diversification to zero from equation (4.3).
The CDI indicates the point at which turn around in real GDP per capita occurs in relation to
export diversification.
Hence, 3 42 0itit
it
RGDPPCED
ED
This gives: * 3
4
02
itED (4.4)
University of Ghana http://ugspace.ug.edu.gh

38
Equation (4.4) gives the Critical Diversification Index that will be computed if there is
evidence of a hump–shaped relationship between export diversification and economic
growth.
It can be shown that the second order condition is satisfied in the optimisation process above.
Thus, 2
422 0it
it
RGDPPC
ED
The export diversification index is measured using the Absolute Deviation of Country
Commodity Shares, which is widely used by UNCTAD. It measures the extent of the
difference between the structures of trade of a particular country and the world average. The
index signals whether the structure of exports of a given country or group of countries differ
from the export structure of the world. It is given by the formula:
/ / / /
2
ij i
ij
h h
ED (4.5)
Where ijh is the share of commodity i in total exports of country j and ih is the share of
commodity i in world exports.
The diversification index ranges from 0 (for less diversified exports) to 1 (for more
diversified exports), revealing the extent of the differences between the structure of trade of
the country or country group and the world average. The index values closer to 1 indicate a
bigger difference from the world average.
University of Ghana http://ugspace.ug.edu.gh

39
4.5 Estimation Technique
The perceived endogeneity associated with the model for empirical estimation will render
estimates using the Ordinary Least Squares (OLS) estimator biased and inconsistent. Many
other estimation techniques could be used to estimate equation (4.3) in the presence of
endogeneity; but the dynamic panel model is best estimated using the General Method of
Moments (GMM) estimation techniques. The GMM procedure is best suited for dynamic
panel models because it resolves the “dynamic panel bias” problem resulting from
endogeneity associated with such models. The dynamic panel equation (4.2) is confronted
with the dynamic panel bias problem; and in the presence of dynamic panel bias, estimations
using Ordinary Least Squares (OLS) produce inconsistent and positive biases as the lagged
dependent variable correlates with the error term.
There are two estimation techniques which are considered as special cases of the GMM
estimation procedure. These are the Instrumental Variable (IV) and the Two–Stage Least
Squares (2SLS) estimation techniques. These techniques could equally be used to estimate
the regression equation in which some variables are suspected to be endogenous; but the
limitation is that they make use of “external” instruments. The problem with using external
instruments is that they are usually weak and hardly satisfy the conditions of “validity and
relevance” in order to yield unbiased estimates. It is also very difficult to obtain instruments
which are correlated with the endogenous variables and at the same time uncorrelated with
the stochastic error terms. In this case, the GMM technique is preferable as it uses the lags of
the endogenous variables as instruments; in which case the endogenous variables are
predetermined and are therefore not correlated with the stochastic error terms. According to
University of Ghana http://ugspace.ug.edu.gh

40
Baum et al (2003), in the presence of heteroscedasticity, the GMM estimation techniques
yield more efficient estimates than the 2SLS and the IV.
Generally, the GMM estimation techniques yield consistent and efficient estimates when the
data–generating process exhibits the following features:
Some explanatory variables are endogenous.
There is a lagged dependent variable which affects the dependent variable.
There exist country–specific fixed effects which are randomly distributed.
There is country–specific serial correlation and heteroscedasticity in the stochastic
error term.
There is no correlation between the stochastic error terms across countries.
The instruments are “internal”, that is, they are lags of the endogenous regressors.
The time period (T) is small and the number of countries (N) is large.
Two types of GMM estimation procedures are identified in the literature. These are the
differenced GMM introduced by Arellano and Bond (1991) and the system GMM introduced
by Arellano and Bover (1995) and Blundell and Bond (1998). The differenced GMM
estimation procedure resolves the inconsistency problem resulting from the endogeneity of
some regressors. This procedure eliminates the source of the inconsistency in the estimation
by applying the first difference operator to the estimation equation. After differencing, the
equation is subsequently estimated by the differenced GMM by including the lags of the
regressors as instruments. The differenced equation is of the form:
University of Ghana http://ugspace.ug.edu.gh

41
, 1 1 , 1 , 2 2 , 1 , 1( ) ( ) ( )it i t i t i t it i t it i ty y y y x x (4.6)
As stated earlier, equation (4.6) removes the unobserved country–specific effect by taking
first differences of equation (4.3); thereby tackling the inconsistency and biases resulting
from the endogeneity of the explanatory variables by using lagged values of the endogenous
explanatory variables as instruments. The differenced GMM estimator is based on the
following moment conditions under the assumptions that the regressors are weakly
exogenous and the error term is not serially correlated.
, 1 , 1[ .( )] 0i t it i tE y , for t = 3, 4, ……, T (4.7)
, 1 , 1[ .( )] 0i t it i tE x , for t = 3, 4, ……,T (4.8)
The differenced GMM is not without statistical and conceptual shortcomings. In the first
place, the time–invariant country–specific effects may be of interest in the estimation
process. Therefore, completely eliminating them may lead to misspecification problems.
Secondly, the procedure poses serious biases when the dependent variable is highly
persistent, and there is a weak correlation between the instruments and the endogenous
variables (weak instruments). Weak instruments are harmful to the small–sample and
asymptotic properties of the differenced estimator. The weak instruments actually increase
the variance of the coefficients and bias the coefficients in small samples. The real per capita
GDP in the estimation model is considered to be highly persistent, thereby rendering the
differenced GMM estimator not very appropriate for estimating equation (4.3).
The system GMM estimator is intended to overcome the problem of weak instruments
associated with the differenced GMM by using a system of two equations, which are, the
University of Ghana http://ugspace.ug.edu.gh

42
level equation and the differenced equation. The endogenous variables in the level equation
are instrumented by lag differences. These instruments are appropriate under the following
additional moment conditions, given the assumptions that there may be correlation between
the country–specific fixed effects and the right–hand side variables; and that the lagged
differences and the country–specific fixed effects are uncorrelated. The additional moment
conditions are stated below:
, 1 , 2[( ).( )] 0i t i t i itE y y , t = 3, 4, ……… ,T (4.9)
, 1 , 2[( ).( )] 0i t i t i itE x x , t = 3, 4, ………. ,T (4.10)
The argument made is that efficiency of the estimation equation would be greatly improved
when the moment conditions of its level form and first difference forms are combined
(Roodman, 2006). Hence the system GMM estimator is preferred to the differenced GMM
when the dependent variable is persistent.
However, the instruments used must be valid in order for the system GMM estimator to give
consistent and reliable estimates. Two main tests are therefore conducted to determine the
validity of the instruments. First of all, a Sargan test of overidentifying restrictions which
tests the null hypothesis that the overidentifying restrictions are valid would is conducted.
Secondly, Arellano–Bond test is used to examine the hypothesis that there exists no serial
correlation between the error terms.
In summary, the system GMM is preferable to the other estimation techniques because:
It overcomes the problem of endogeneity through the use of lagged values of
explanatory variables as instruments.
University of Ghana http://ugspace.ug.edu.gh
43
It eliminates the problem of information loss in cross–sectional regressions as it
allows for multiple observations for each country across time.
It allows for the use of level and lagged values of the variables in the estimation
equation.
It is able to give consistent estimates even when T (time periods in years) is small and
N (countries) is large.
4.6 Diagnostic Tests
4.6.1 Endogeneity
Equation (4.2) specified above may suffer from the problem of endogeneity. There is
endogeneity when there is correlation between any of the explanatory variables and the
random error term. This phenomenon may occur as a result of omitted variable bias,
measurement error or reverse causality.
Thus, in the presence of endogeneity, ,( ) 0i itCov x
Where i is the time–invariant country–specific effect; and itx is the set of explanatory
variables.
Introducing lagged real per capita GDP as an explanatory variable is suspected to give rise to
endogeneity. This is because the value of current real per capita GDP depends on previous
ones; hence its values are likely to correlate with the error terms. Also, Imbs and Wacziarg
(2003) both theoretically and empirically provide evidence of reverse causality between
export diversification and economic growth. There also exists evidence of reverse causality
University of Ghana http://ugspace.ug.edu.gh

44
between domestic investment and economic growth (Barro and Sala-i-Martin, 1998). The
evidence on reverse causality implies that these variables are likely to be endogenous in the
regression model. In order to confirm endogeneity in the model, a Durbin–Wu–Hausman
(DWH) test for endogeneity would be conducted for the residuals of all suspected
endogenous explanatory variables as a function of all the exogenous variables (Alemu and
Yokoyama, 2009). The suspected endogenous variables are lagged real GDP per capita,
physical capital, human capital, and openness. The presence of endogeneity would render
estimates using the OLS estimation technique biased and unreliable; but the system GMM
estimator produces consistent estimates under this condition. Endogeneity in the explanatory
variables would therefore favour the system GMM estimation technique as most appropriate
for the estimation of the specified model.
4.6.2 Autocorrelation and Heteroscedasticity
The dynamic panel model in equation (4.2) is known to be associated with two main sources
of persistence over time. First of all, there is the case of autocorrelation as a result of the
presence of the lagged dependent variable as a regressor. This is the case because if the
dependent variable is a function of a component of the error term, then its lag is also a
function of the error term. Taking a lag of equation (4.2) gives the following equation:
'
, 1 , 2 , 1 , 1i t i t i t i i ty y x (4.11)
From equations (4.3) and (4.11), we observe that the dependent variable and its lag are both
functions of the country–specific time–invariant component of the error term.
University of Ghana http://ugspace.ug.edu.gh

45
That is: ( )it iy f and , 1 ( )i t iy f . This means that the lagged dependent variable is
correlated with the error term in the model. The dynamic panel model is therefore associated
with the problem of autocorrelation.
The second source of persistence associated with the dynamic panel model is heterogeneity
among the countries as a result of individual country–specific effects. This is the case
because the countries under study possess unique economic, social and geographical
characteristics which must be considered in the estimation process. The presence of these
sources of persistence renders the ordinary least squares (OLS) estimator inappropriate for
estimation; since it gives biased and inconsistent estimates even if the error term ( it ) is not
serially correlated.
4.6.3 Fixed Effects (FE) versus Random Effects (RE)
Two different assumptions are made regarding correlation between the time–invariant error
term ( i ) and the explanatory variables in the econometrics literature. These assumptions
result in the Fixed Effects (FE) and Random Effect (RE) models.
The RE model assumes that the unobserved country–specific time–invariant effects are
uncorrelated with the explanatory variables. The model is used when variation across
countries is assumed to be random and uncorrelated with the explanatory variables.
Thus, ( , ) 0i itCov x .
University of Ghana http://ugspace.ug.edu.gh

46
The model therefore includes the country–specific characteristics as explanatory variables in
the estimation equation. These country–specific characteristics may include institutional,
cultural, historical and geographical factors which are mostly unique for each country and are
time–invariant. The RE model assumes that the country–specific time–invariant error terms
are not correlated with the regressors, therefore allowing for time–invariant variables to be
included in the model as explanatory variables. These individual characteristics which may
either influence the explanatory variables or not need to be well specified.
The point however is that, even if the country–specific time–invariant characteristics are not
correlated with the explanatory variables, such effects must be well specified in the
estimation model. From equation (4.2), while the explanatory variables ( itx ) can be easily
observed, the time–invariant country specific effects ( i ) cannot be easily observed.
The fixed effects (FE) model on the other hand assumes that the country–specific time–
invariant effects are correlated with the explanatory variables, and thereby controls for them.
The FE model is therefore used when it is assumed that the countries possess certain
individual characteristics which are unique to them and are time–invariant. The presence of
these country–specific time–invariant effects leads to the problem of endogeneity and
subsequently biases the estimates. The FE model eliminates the time–invariant effects from
the estimation by using the within transformation to demean the variables. From equation
(4.2), the within transformation process is described in the equation below:
( ) ( ) ( )it i it i i i it iy y x x (4.12)
Where1
1 T
i it
i
y yT
,1
1 T
i it
i
x xT
,1
1 T
i it
iT, and i i .
University of Ghana http://ugspace.ug.edu.gh

47
In the within transformation process described in equation (4.12), the mean of the variables
are calculated and subsequently subtracted from their actual values; and since the country–
specific error terms (i) do not change over time, its mean value ( i ) is the same as the
actual values. This process therefore eliminates the country–specific effects from the
equation. The presence of heteroscedasticity in the estimation model would therefore favour
the FE model, as it assumes heterogeneity in the error term across countries. The Hausman
test is used to choose between random effect and fixed effect for the estimation. The GMM
estimation procedure would yield reliable estimates if the data fits the fixed effects model.
4.6.4 Stationarity (Unit Root) Test
Although Unit Root problem is usually regarded as a time series problem, conducting unit
root test in panel datasets could also be very appropriate in order to ensure that the variables
under study are stationary thereby avoiding the trap of spurious regressions which relates to
the occurrence of unrelated regressions. As stated by Gujarati (2003 pp.713), “a stochastic
process is said to be stationary, if its Mean, and Variance are constant overtime and the value
of Covariance between two time periods depends only on the distance between the two time
periods and not on the actual time at which the Covariance is computed”. This study adopts
the Fisher test. According to Choi (2001), the Fisher test may be preferred to other tests
because of the following reasons:
It does not require a balanced panel as in the case of the IPS test
Different lag lengths can be used in the individual ADF regressions.
It can be carried out for any unit root test.
University of Ghana http://ugspace.ug.edu.gh

48
It does not require simulating adjustment factors that are specific to the sample size
and specification.
4.6.5 Other Diagnostic Tests
In order to ensure reliable estimates from the system GMM estimation procedure, certain
essential conditions must be fulfilled. First of all, the results from the system GMM
estimations can only be deemed valid if there is no higher order autocorrelation in the error
terms. The Arellano–Bond test for second order autocorrelation in first differenced errors
will therefore be conducted to test for serial autocorrelation in the idiosyncratic errors.
Secondly, for the system GMM estimator to give reliable estimates, it is required that the
instruments used must be valid. For the instruments to be valid, the conditions of relevance
(correlation between the instruments and the endogenous explanatory variables) and
exogeneity (instruments are orthogonal to the residuals) must be satisfied. The validity
condition therefore implies that the instruments used must be truly exogenous; that is, there
should be no correlation between the residuals and the explanatory variables and the
instruments must be correlated with the endogenous explanatory variables. This condition
can be tested by using the Sargan test under the null hypothesis that the overidentifying
restrictions are valid. A test procedure suggested by Hansen (1982) could also be used to test
the validity of the instruments, but the test becomes weaker as the number of instruments
increases; making the Sargan test more appropriate.
University of Ghana http://ugspace.ug.edu.gh

49
4.7 Concluding Remarks
In summary, the dynamic panel growth equation for the estimation is specified from the
human capital augmented Solow growth model. It is perceived that certain sensitivity issues
such as endogeneity, heteroscedasticity, autocorrelation and some other estimation problems
are likely to be associated with the estimation equation. These will be verified in the next
chapter of the study. The study adopts the system GMM estimation technique in order to
obtain consistent and efficient estimates of the effect of export diversification on economic
growth. In relation to most previous empirical studies, this study takes the time series
variations in the data into consideration, captures the unobserved country–specific time–
invariant effects, allows for the inclusion of the lagged real GDP per capita as an explanatory
variable and also controls for endogeneity in the estimation model. The discussion of the
results emerging from the estimations using the system GMM approach is presented in the
next chapter.
University of Ghana http://ugspace.ug.edu.gh

50
CHAPTER FIVE
RESULTS AND DISCUSSION
5.1 Introduction
This chapter presents the estimation and discussion of the results. StataCorp’s statistical
package version 12 (STATA 12) is used for the computation of the empirical estimations.
The chapter is in four main sections. The next section provides descriptive analysis of the
variables under consideration; followed by Section 5.3 which presents the results of some
diagnostic tests. The discussion of the empirical findings is presented in Section 5.4;
followed by the conclusion in Section 5.5.
4.2 Descriptive Analysis
The descriptive statistics pertain to forty–two (42) SSA countries for the period 1995–2010.
The statistics under consideration are the mean, the standard deviation and the minimum and
maximum values of the variables. Table 5.1 reports on the descriptive statistics.
Over the period 1995–2010, the average real per capita GDP of SSA was US$1,047.57. The
range is between US$54.51 and US$8,787.77. This range gives an indication of the wide
income disparity gap among countries in the SSA region. Concerning real GDP per capita
growth, the region recorded an average of 2.7 percent growth rate during the period.
University of Ghana http://ugspace.ug.edu.gh

51
Table 5.1: Descriptive Statistics of Real GDP per Capita (Growth) and its
Determinants, 1995–2010.
Variable Mean Standard
Deviation
Minimum Maximum
Real GDP per Capita Growth (annual
%)
2.7 7.3 -33.8 92.6
Real GDP per Capita (US$) 1,047.5
7
1,644.96 54.51 8,787.77
Gross Fixed Capital Formation (%
GDP)
20.7 11.2 2.0 113.6
Export Diversification Index 0.77 0.07 0.38 0.92
Population Growth (annual %) 2.4 1.0 -1.4 9.8
Enrolment (gross secondary school % ) 37.3 25.7 5.2 122.9
FDI (net inflows % GDP) 5.3 13.1 -82.9 145.2
Source: Author’s Computation Using STATA 12.
Some countries recorded negative growth rates while others performed very well. A critical
look at the data shows that such countries as Burundi, Chad, Congo DR, Congo Republic,
Cote d’Ivoire, Niger and Zimbabwe performed below the regional average; while countries
such as Cape Verde, Equitorial Guinea, Ghana, Mauritius, South Africa, Sudan and Uganda
performed quite above the regional average over the period.
The average export product diversification index for the region over the period is 0.77;
indicating that on average, SSA countries are slowly picking up in their efforts at
diversifying exports. This performance could however be attributed to an increase in the
number of primary exports, which may not bring much gains to countries in the sub–region
as compared to manufactured exports (Yokoyama and Alemu, 2009).
The average secondary school enrolment rate over the period is 37.3 percent, with a
minimum of 5.2 percent and a maximum of 122.9 percent. The average net FDI as a
percentage of GDP is 5.3 percent with a minimum of -82.9 percent and a maximum of 145.2
University of Ghana http://ugspace.ug.edu.gh

52
percent. This seems to imply that a wide disparity gap exists among SSA countries in terms
of FDI inflows into the region. Average population growth rate in SSA over the period is 2.4
percent.
5.3 Estimation Results
This section presents the results from the estimations based on the augmented Solow growth
model using the system GMM estimator. Table 5.2 displays the regression results based on
the forty–two (42) SSA countries for the period 1995–2010. The first regression model
involves all the explanatory variables with the exception of the regional dummies and the
interacted variables (i.e. export diversification with the regional dummies). In the second
regression model, the regional dummies are added to the variables of the first model. In the
third regression model, the interacted variables of export diversification with the four
regional dummies are introduced into the model together with the other explanatory
variables. The regional dummies, export diversification and the squared term of export
diversification are not included in the third regression model because they show severe
collinearity with the interacted variables (ED*MDUMMY, ED*SDUMMY and
ED*WDUMMY).
From Table 5.2, the significant Wald Chi–squared for all the regressions shows that the
explanatory variables are jointly significant. The Arellano–Bond test AR(2) in first
differences fails to reject the null hypothesis of no two–period serial correlation in the
residuals.
University of Ghana http://ugspace.ug.edu.gh
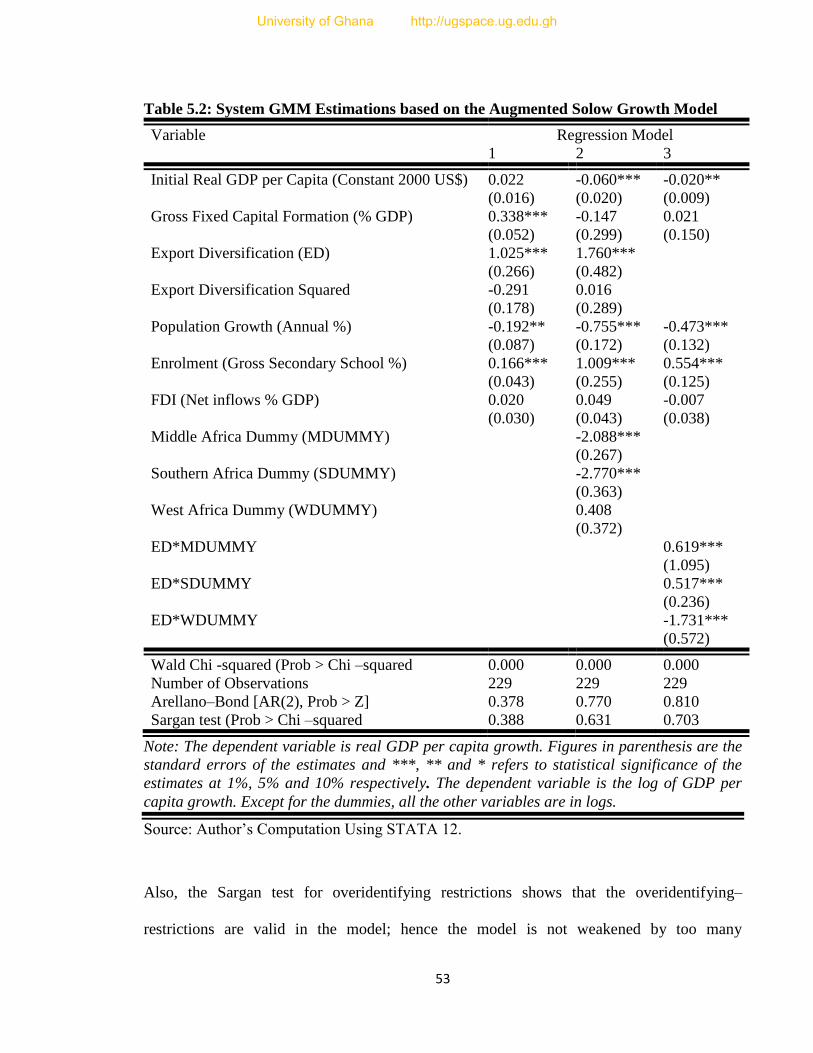
53
Table 5.2: System GMM Estimations based on the Augmented Solow Growth Model
Variable Regression Model
1 2 3
Initial Real GDP per Capita (Constant 2000 US$) 0.022 -0.060*** -0.020**
(0.016) (0.020) (0.009)
Gross Fixed Capital Formation (% GDP) 0.338*** -0.147 0.021
(0.052) (0.299) (0.150)
Export Diversification (ED) 1.025*** 1.760***
(0.266) (0.482)
Export Diversification Squared -0.291 0.016
(0.178) (0.289)
Population Growth (Annual %) -0.192** -0.755*** -0.473***
(0.087) (0.172) (0.132)
Enrolment (Gross Secondary School %) 0.166*** 1.009*** 0.554***
(0.043) (0.255) (0.125)
FDI (Net inflows % GDP) 0.020 0.049 -0.007
(0.030) (0.043) (0.038)
Middle Africa Dummy (MDUMMY) -2.088***
(0.267)
Southern Africa Dummy (SDUMMY) -2.770***
(0.363)
West Africa Dummy (WDUMMY) 0.408
(0.372)
ED*MDUMMY 0.619***
(1.095)
ED*SDUMMY 0.517***
(0.236)
ED*WDUMMY -1.731***
(0.572)
Wald Chi -squared (Prob > Chi –squared 0.000 0.000 0.000
Number of Observations 229 229 229
Arellano–Bond [AR(2), Prob > Z] 0.378 0.770 0.810
Sargan test (Prob > Chi –squared 0.388 0.631 0.703
Note: The dependent variable is real GDP per capita growth. Figures in parenthesis are the
standard errors of the estimates and ***, ** and * refers to statistical significance of the
estimates at 1%, 5% and 10% respectively. The dependent variable is the log of GDP per
capita growth. Except for the dummies, all the other variables are in logs.
Source: Author’s Computation Using STATA 12.
Also, the Sargan test for overidentifying restrictions shows that the overidentifying–
restrictions are valid in the model; hence the model is not weakened by too many
University of Ghana http://ugspace.ug.edu.gh

54
instruments. One period lags of the endogenous variables are used as instruments for the first
difference equation whilst first difference of the endogenous variables are used as
instruments for the levels equation.
5.4 Diagnostic Tests
In this section, diagnostic tests are conducted for endogeneity, heteroscedasticity,
autocorrelation, overidentifying restrictions, and the choice of fixed or random effects
models. Each of these is analysed in the ensuing sub–sections. The main aim of these tests is
to ensure that the data fits the model and that the results from the system GMM estimations
are valid and reliable.
5.4.1 Endogeneity
The study employed the Durbin–Wu–Hausman (DWH) test to verify the presence of
endogeneity among some of the variables. This is an augmented regression test which is
applied to the residuals of each endogenous explanatory variable as a function of all other
exogenous variables (Yokoyama and Alemu, 2009). If the null hypothesis that the regressors
are uncorrelated with the error term holds, then OLS would be appropriate because the
variables are not correlated with the error term. Otherwise, the rejection of the null
hypothesis indicates that the variables are endogenous; hence OLS estimators would be
inconsistent. The results of the Durbin–Wu–Hausman (DWH) test show that initial real GDP
per capita, gross fixed capital formation, export diversification, and enrolment are correlated
with the error term (see Table 5.3). This implies that the variables are endogenous; and
University of Ghana http://ugspace.ug.edu.gh
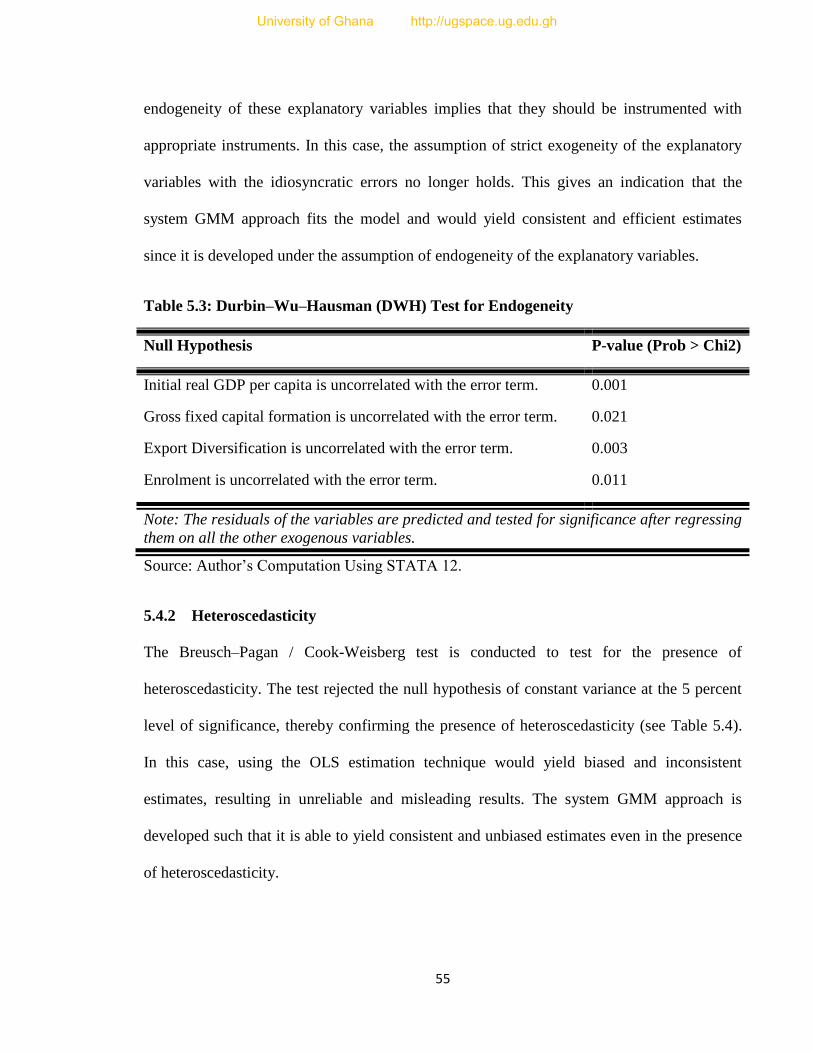
55
endogeneity of these explanatory variables implies that they should be instrumented with
appropriate instruments. In this case, the assumption of strict exogeneity of the explanatory
variables with the idiosyncratic errors no longer holds. This gives an indication that the
system GMM approach fits the model and would yield consistent and efficient estimates
since it is developed under the assumption of endogeneity of the explanatory variables.
Table 5.3: Durbin–Wu–Hausman (DWH) Test for Endogeneity
Null Hypothesis P-value (Prob > Chi2)
Initial real GDP per capita is uncorrelated with the error term.
Gross fixed capital formation is uncorrelated with the error term.
0.001
0.021
Export Diversification is uncorrelated with the error term. 0.003
Enrolment is uncorrelated with the error term. 0.011
Note: The residuals of the variables are predicted and tested for significance after regressing
them on all the other exogenous variables.
Source: Author’s Computation Using STATA 12.
5.4.2 Heteroscedasticity
The Breusch–Pagan / Cook-Weisberg test is conducted to test for the presence of
heteroscedasticity. The test rejected the null hypothesis of constant variance at the 5 percent
level of significance, thereby confirming the presence of heteroscedasticity (see Table 5.4).
In this case, using the OLS estimation technique would yield biased and inconsistent
estimates, resulting in unreliable and misleading results. The system GMM approach is
developed such that it is able to yield consistent and unbiased estimates even in the presence
of heteroscedasticity.
University of Ghana http://ugspace.ug.edu.gh

56
Table 5.4: Breusch –Pagan / Cook –Weisberg Test for Heteroscedasticity
Ho: Constant variance
Chi2 (6) = 5.80
Prob > Chi2 = 0.0164
Source: Author’s Computation Using STATA 12.
5.4.3 Autocorrelation
This test is conducted using the Arellano–Bond test for autocorrelation in the first difference
errors. The test results are reported together with the estimation results in Table 5.2. The test
fails to reject the null hypothesis of no autocorrelation in second order for all the regressions.
This means that the error terms are not correlated with each other and the condition of no
autocorrelation is therefore satisfied for the use of the system GMM estimation technique.
5.4.4 Validity of Overidentifying Restrictions
A major requirement for the use of the system GMM estimation technique is that the
instruments used must be valid in order to yield consistent estimates. The Sargan test of
overidentifying restrictions which tests the null hypothesis that the overidentifying
restrictions are valid is conducted; and the results are reported together with the regression
results in Table 5.2. The test fails to reject the null hypothesis, thereby showing that the
overidentifying restrictions are valid for all the regression equations. This therefore means
that together with the evidence of no autocorrelation, the condition of validity of the
instruments is satisfied for the system GMM estimator to yield consistent and reliable
estimates.
University of Ghana http://ugspace.ug.edu.gh

57
5.4.5 Fixed Effects and Random Effects
This sub–section presents the results of the Hausman test to determine whether the fixed or
random effects models fit the data for estimation. As indicated in the previous chapter, the
presence of heteroscedasticity would imply the existence of heterogeneity across countries
and therefore confirms the assumption of the fixed effects model that the unobserved
country–specific effects vary across countries. The Breusch–Pagan / Cook-Weisberg test for
heteroscedasticity (see Table 5.4) confirms the presence of heteroscedasticity thereby
indicating fixed effects model would be appropriate. The result of the Hausman test (see
Table 5.5) also confirms the appropriateness of fixed effects model by rejecting the null
hypothesis that favours random effects model at the 5 percent level of significance. The
system GMM estimation procedure can therefore be applied to the model as it requires a
model that fits fixed effects to yield consistent and reliable estimates.
The results of the foregoing diagnostic tests show that the system GMM estimation technique
is appropriate for the estimations and its estimates are reliable.
Table 5.5: Hausman Test for Fixed versus Random Effects
Ho: Difference in coefficients not systematic (there is random effect)
Chi2(6) = (b-B)'[(V_b-V_B)^(1)](b-B)
= 16.04
Prob > Chi2 = 0.0135
Source: Author’s Computation Using STATA 12.
University of Ghana http://ugspace.ug.edu.gh

58
5.4.6 Stationarity (Unit Root) Test
The results of the Fisher stationary (unit root) test of the variables in the model are shown in
Appendix VIII. The null hypothesis of the test is that the variables have no unit roots. As a
robust check, the four unit root test statistics are reported. The null hypothesis that all the
panels contain unit roots is rejected by all the four tests (see Table 5.6). According to Choi
(2001), when the number of panels is finite, the inverse chi–squared test becomes very
appropriate and powerful tool for testing unit roots. Since this study has a finite number of
panels, the null hypothesis of unit roots is therefore rejected for all the variables on the basis
of the inverse chi–squared test. Aside the other inverse chi–squared test, all the other tests
reported significant results of all the variables, thereby indicating that the variables are
stationary. The conclusion is therefore drawn that the panels are not associated with unit
roots hence there is no tendency for any possible spurious or unrelated regressions.
Table 5.6: Fisher–Type Stationarity (Unit Root) Test
Variable Inverse chi-
squared
Inverse normal Inverse logit t Modified inv. chi-
squared
Statistic Prob Statistic Prob Statistic Prob Statistic Prob
GDP/Capita Growth 288.470 0.000 -11.348 0.000 -12.005 0.000 15.775 0.000
Gross Fixed Capital
Formation
188.938 0.000 -6.701 0.000 -6.817 0.000 8.350 0.000
Export
Diversification (ED)
243.791 0.000 -9.619 0.000 -9.889 0.000 12.328 0.000
ED Squared 242.914 0.000 -9.585 0.000 -9.854 0.000 12.261 0.000
Population Growth 294.154 0.000 -10.175 0.000 -11.485 0.000 16.214 0.000
Enrolment 64.426 0.083 -0.984 0.063 -1.007 0.058 1.443 0.075
FDI 249.420 0.000 -9.594 0.000 -9.904 0.000 12.763 0.000
Source: Author’s Computation Using STATA 12.
University of Ghana http://ugspace.ug.edu.gh

59
4.5 Discussion of Results
The main findings on the relationship between real GDP per capita and the explanatory
variables, including export diversification are discussed below.
Export Diversification: In conformity with a priori expectations, the coefficient of export
diversification (ED) is positive. The coefficients of export diversification in regression
models (1) and (2) suggest that a percentage increase in the export diversification index of a
country in SSA will cause a further growth of about 1 percent and 1.8 respectively. This
finding of a positive relationship between ED and growth is not uncommon in the export
diversification literature. It follows the findings of many previous studies, for example Al-
Marhubi (2000); Hesse (2008); Yokoyama and Alemu (2009) and some other cross–country
studies on export diversification and economic growth. This result suggests that for Sub–
Saharan Africa, countries with higher levels of export diversification are likely to experience
a faster growth than those with low levels of export diversification.
Export Diversification Squared: The coefficient of the squared term of export diversification
is not significant in the regression models. The implication is that there is no evidence of a
hump–shaped relationship between export diversification and economic growth in SSA. This
finding does not follow that of Imbs and Wacziarg (2003), and Hesse (2008) who find a non–
linear relationship between export diversification and economic growth using cross–country
data. This means that countries in SSA can intensify export diversification in order to attain
higher growth.
University of Ghana http://ugspace.ug.edu.gh

60
Regional Dummies: The regional dummies are introduced in model (2). East Africa3 is used
as the reference region. With exception to the West Africa dummy, the coefficients of the
regional dummies indicate that the aggregate growth effect of the explanatory variables
differs across the sub–regions of SSA. It is observed from regression model (2) in Table 5.2
that the aggregate growth effect of the explanatory variables is lower for Middle (Central)
and Southern Africa countries as compared to countries in East Africa. The coefficient of the
West Africa dummy is however insignificant, implying that there exists no significant
difference between West and East Africa countries in terms of the aggregate growth effects
of the explanation variables.
Interacted Variables: The export diversification index is interacted with the regional
dummies in regression model (3) in order to determine if the effect of export diversification
on growth is the same for all the sub–regions in SSA or not. The coefficients of the interacted
variables are significant, implying that the effect of ED on growth is not the same for the
sub–regions. The results show that compared to East Africa, the effect of ED on growth is
higher for countries in Central (Middle) and Southern Africa countries. On the contrary, the
effect of ED on growth is lower in West Africa as compared to East Africa. The coefficient
of the first interacted variable in model (3) suggests that a percentage increase in the export
diversification index in the Central Africa region would result in about 0.6 percent higher
growth in that region than in East Africa.
Initial real GDP per capita: It is observed from the results in Table 5.2 that the coefficient of
the initial real GDP per capita is negative and statistically significant at 1 percent in model
3 The region is used as the reference region since it performs fairly better than the other regions in terms of real
GDP per capita (growth) and export diversification (see Table 2.1).
University of Ghana http://ugspace.ug.edu.gh

61
(2). It indicates that countries with lower initial real GDP per capita have the tendency to
grow faster than those with higher initial real GDP per capita. This result is in line with the
theoretical predictions of the convergence theory which predicts that income per capita of
countries would converge over time. It also confirms the findings of other previous studies
such as Hesse (2008) and Al–Marhubi (2000) who find a negative relationship between real
GDP per capita growth and initial real GDP per capita. This means that the income per capita
of countries in the SSA region have been converging over the period. The result however
contradicts the findings of other previous studies which find a positive relationship between
real GDP per capita growth and initial GDP per capita (see Slaughter, 2001; Aditya and Roy,
2007), though these studies use cross–country samples. The evidence of convergence is also
at odds with that of Yokoyama and Alemu (2009) who find no evidence of convergence in
SSA.
Gross Fixed Capital Formation: The augmented Solow growth model predicts a positive
relationship between physical capital and economic growth. This prediction is confirmed by
the positive and significant coefficient of gross fixed capital formation in the first regression
model in Table 5.2. The result indicates that capital formation has played a crucial role in the
economic growth of SSA countries over the period. The interpretation of the regression
coefficient in model (1) for instance is that a percentage increase in gross fixed capital
formation would lead to about 0.3 percent further increase in GDP per capita growth.
Population Growth: The relationship between population growth and economic growth has
not been theoretically unambiguous. The precise relationship is subject to empirical research
which also depends on the region and the time period under consideration. The available
empirical findings are also not devoid of the ambiguity associated with relationship between
University of Ghana http://ugspace.ug.edu.gh

62
economic growth and population growth. While some studies find a positive relationship
(Al–Marhubi, 2000; Yokoyama and Alemu, 2009), others find a negative relationship (Hesse
2008). This study supports the finding of the latter that population growth inversely affects
economic growth. The results in the regression models in Table 5.2 respectively imply that a
percentage increase in the population growth rate would reduce the pace of growth by about
0.2 percent, 0.8 percent and 0.5 percent. This indicates that rapid population growth slows
down the pace of economic growth in SSA.
Enrolment: The positive coefficient of gross secondary school enrolment in all the regression
models is also consistent with a priori expectation and findings in the existing empirical
literature. It confirms the prediction of the human capital augmented Solow growth model
that human capital is paramount for economic growth. The coefficient of enrolment in the
regression models respectively implies that a percentage increase in the school enrolment rate
would lead to about 0.2 percent, 1 percent and 0.6 percent further growth in SSA. Other
studies such as Mankiw et al (1992), Al–Marhubi (2000) and Hesse (2008) also find positive
relationship between human capital and economic growth.
4.6 Concluding Remarks
The data for estimation favours fixed effects model which is a requirement for the use of the
system GMM estimation procedure. The other diagnostic tests: autocorrelation,
heteroscedasticity, and overidentifying restrictions yield results that are favourable for the
use of the system GMM estimation technique. The estimation results show that export
diversification positively affects growth in real GDP per capita SSA. The findings do not
University of Ghana http://ugspace.ug.edu.gh

63
support the hypothesis of a non–monotonic (hump–shaped) relationship between export
diversification and economic growth in SSA. Since there is no evidence of a hump–shaped
relationship, the critical diversification index (CDI) could not be computed for SSA. The
estimation results also show that other control variables; that is, gross fixed capital formation,
human capital, foreign direct investment are significant determinants of economic growth in
SSA. The population growth rate on the other hand is found to affect economic growth
negatively in SSA.
University of Ghana http://ugspace.ug.edu.gh

64
CHAPTER SIX
SUMMARY, CONCLUSIONS AND POLICY RECOMMENDATIONS
6.1 Introduction
This chapter presents the summary, conclusions and policy recommendations based on the
findings of the study. The next section is dedicated to the summary and conclusions drawn
from the findings in the study. Section 6.2 gives policy recommendations based on the
findings and Section 6.3 discusses the limitations of the study and suggests areas for further
research.
6.2 Summary and Conclusions
The growth performance of Sub–Saharan Africa (SSA) countries has been an issue of
concern to individuals, governments, organisations and researchers over the years. Research
shows that developing countries that diversified their exports like those in East Asia have
been able to achieve higher growth; even though they were at a similar level of growth with
SSA countries about five decades ago (Yokoyama and Alemu, 2009). The main objective of
this study is to assess the effect of export diversification on growth in SSA; and also to test
the hypothesis of a hump–shaped (non–linear) relationship between export diversification
and growth as well as compute the critical diversification index (CDI) for SSA; given that a
non–linear relationship exists.
The empirical literature shows mixed evidence on the exact relationship between export
diversification and economic growth. While some studies attest to a positive monotonic
University of Ghana http://ugspace.ug.edu.gh

65
relationship between export diversification and economic growth, others show a hump–
shaped (non–monotonic) relationship. Others also show negative relationship between export
diversification and economic growth. These conflicting results coupled with the existence of
just a few studies on SSA are the motivations for this study.
In order to empirically establish a relationship between export diversification and economic
growth, the model for estimation is specified from the dynamic panel growth framework
based on the predictions of the human capital augmented Solow model, and estimated using
the system GMM estimation procedure. This procedure overcomes the estimation problems
commonly associated with other estimation techniques such as the OLS, IV and the
traditional panel estimations.
The estimation results from this study show a positive relationship between export
diversification and economic growth in SSA. This satisfies the first objective of the study.
Concerning the second objective which seeks to test the hypothesis of a hump–shaped
relationship, the results do not show evidence of a hump–shaped (non–monotonic)
relationship between export diversification and economic growth. The third objective of
computing the critical diversification index (CDI) for SSA could not be realised since it is
conditioned on the evidence of a hump–shaped relationship between ED and growth.
6.3 Policy Recommendations
The major conclusion drawn from the results in the previous chapter is that export
diversification positively affects economic growth and that there is no evidence of a non–
monotonic relationship between export diversification and economic growth in SSA. This
University of Ghana http://ugspace.ug.edu.gh

66
implies that for countries in SSA, further diversification would propel the pace of growth.
Export diversification should therefore be promoted in the region.
First of all, in order to promote further diversification, it is recommended that governments
of countries in SSA should implement entrepreneurship support schemes and create a
favourable investment climate in order to encourage investment in new production sectors,
and also expand existing sectors for exports. Diversification in domestic production is
required for export diversification which would ultimately lead to economic growth in the
long run.
Countries in SSA can also promote export diversification and reduce their dependence on a
few primary products through trade facilitation measures to reduce trade costs.
Administrative bottlenecks which take the form of domestic entry barriers, trade restrictions,
huge costs and delays in business registration among other trade inhibiting procedures should
be scaled down to the barest minimum.
Governments in the sub–region should also initiate policies targeted at promoting research
into new production sectors, especially agriculture which is the main production activity of
countries in the sub–region and also into agro–processing to add value to the raw agriculture
exports, since value added products command higher and stable prices on the international
market and also ensure sustained foreign exchange earnings.
It is suggested by endogenous growth theory that export diversification can occur through
learning–by–doing and learning–by–exporting and also through the imitation of the
production activities of developed economies (Guiterez de Pineres and Ferrantino, 1997).
Governments of SSA should seriously consider this recommendation in their economic and
University of Ghana http://ugspace.ug.edu.gh

67
development policy objectives as it has the propensity to trigger export diversification and
make meaningful contributions to the overall economic progress of the economies in the
region.
It is also recommended that governments in SSA should create the business environment for
FDI inflows which show positive effects on growth in real GDP per capita. Investment in
human capital in the form of education and skills training should be promoted rigorously to
propel growth. Population growth should however be kept under control since the coefficient
of population in the study is negative with implication that high population growth slows
down the pace of growth in the region.
Notwithstanding these findings, governments of SSA countries should avoid introducing
unnecessary distortions to domestic production as a means of promoting export
diversification in order to attain long–term growth. This is because, according to Al–Marhubi
(2000), unnecessary distortions to international trade and market–oriented resource allocation
that are contrary to a country’s comparative advantage are not healthy for economic
efficiency and growth performance. Export diversification policies should therefore be
targeted at sectors in which countries have comparative advantage in order to yield the
expected economic benefits.
Finally, as Yokoyama and Alemu (2009) put it, export diversification is just one of the key
policy measures to be undertaken for structural transformation and economic growth. It
should therefore not be regarded as a panacea for the economic problems of countries in
Sub–Saharan Africa.
University of Ghana http://ugspace.ug.edu.gh

68
6.4 Limitations of the Study and Areas for Further Research
The study did not look at some other aspects of export diversification such as vertical and
horizontal dimensions of export diversification, various measures of export diversification,
comparison of the relationship between export diversification and economic growth across
the various developing regions of the world, and specific–country analysis of the relationship
between export diversification and economic growth for all the countries in the sample.
These areas of study would also make very meaningful contributions to the existing literature
and therefore should be considered by future studies on the diversification–growth nexus.
University of Ghana http://ugspace.ug.edu.gh

69
REFERENCES
Acemoglu, D. and Zilibotti, F. (1997); Was Prometheus Unbound by Chance? Risk
Diversification and Growth. The Journal of Political Economy, 105(4): 709–751.
Acharyya, R. (2007). Emerging Pattern of India’s Merchandise Exports: Prospects and
Possibilities: Vanijya, May (DGCI&S, Ministry of Commerce GOI).
Aditya, A. and Roy, S. S. (2007). Export diversification and economic growth: Evidence from
cross-country analysis. Mimeo, 1–25.
Agosin, M. R. (1999): Trade and growth in Chile, Cepal Review, 68: 79–100.
Agosin M. R. (2005). Export diversification and growth in emerging economies. Paper
presented at conference on growth and equity. CEPAL, Santiago
Agosin, M. R. (2007). Export Diversification and Growth in Emerging Economies. Working
Paper No. 233, Departamento de Economía, Universidad de Chile, Santiago
Agosin, M., Álvarez, R., Bravo–Ortega, C., and Puentes, E. (2011): Determinants of Exports
Diversifications around the World: 1962–2000. Working Paper No. 605, Central Bank
of Chile
Alfaro, L., Chand, A., Kalemli–Ozcan, S. and Selin Sayek, S. (2004). FDI and Economic
Growth: The Role of Local Financial Markets, Journal of International Economics, 64:
113–134.
University of Ghana http://ugspace.ug.edu.gh

70
Ali, R., Alwang, J. and Siegel, P. (1991): Is export diversification the best way to achieve
export growth and stability? A look at three African countries: Policy Research
Working Paper Series, No. 729, Washington, DC.
Al-Marhubi, F. (2000): Export Diversification and Growth: An Empirical Investigation, Applied
Economics Letters, 7(9): 559–562.
Arailym K. (2011). The Effect of Export Diversification on Country Growth, A Master of Arts
in Economics Thesis Presented to the Department of Economics of the Central
European University, Budapest, Hungary.
Arellano, M. and Bond S. (1991): Some Tests of Specification for Panel Data: Monte Carlo
Evidence with an Application for Employment Equations, Review of Economic Studies,
58: 277–297.
Arellano, M. and Bover O. (1995): Another Look at the Instrumental-variable Estimation of
Error-Component Models, Journal of Econometrics, 68 (1): 29–51.
Arip, M., Yee, L. and Abdul Karim, B. (2010): Export diversification and economic growth in
Malaysia, MPRA Paper No. 20588; Reitaku University. Unimas
Athukorala, P. (1991). An Analysis of Demand and Supply Factors in Agricultural Exports from
Developing Asian Countries, Weltwirtschaftliches Archiv, 127(4): 746–791.
Baltagi, B. H. (1996). Econometric Analysis of Panel Data, Chichester: John Wiley & Sons Ltd.
Barro, R. and Sala-i-Martin, X. (1998): Economic Growth, Cambridge, Massachusetts: MIT
Press.
University of Ghana http://ugspace.ug.edu.gh

71
Baum, C. F., Schaffer, M. E. and Stillman S. (2003): Instrumental Variables and GMM:
Estimation and Testing, Stata Journal 3: 1–31.
Bebczuk, R. N. and Berrettoni, N. D. (2006); Explaining Export Diversification: An Empirical
Analysis: CAF Research Program on Development Issues.
Bernard, A. B. and Jones C.I. (1996): Comparing Apples to Oranges: Productivity Convergence
and Measurement across Industries and Countries, American Economic Review 86:
1216–1238.
Blomstrom, M., Lipsey, R. and Zejan, M. (1994): Is Fixed Investment the Key to Economic
Growth? CEPR Discussion Papers, 870
Blundell, R. and Bond S. (1998): Initial Conditions and Moment Restrictions in Dynamic Panel
Data Models, Journal of Econometrics 87: 115–143.
Bond, S. (2002). Dynamic Panel Data Models: A Guide to Micro Data Methods and Practice,
Portuguese Economic Journal 1: 141–162.
Branson, H.W. (1989). Macroeconomic Theory and Policy, 3rd Edition, 129–256, New York:
Harper & Row Publishers.
Cabellero, R.J. and K. Cowan (2006). Financial Integration without the Volatility, MIT Mimeo
Cabral, C.H.M and Veiga P. (2012): Export Diversification and Sophistication and Economic
Development in Sub-Saharan Africa. Part of an NBER project on African development
successes described in Macedo and Pereira (2009).
University of Ghana http://ugspace.ug.edu.gh

72
Cadot, O., Carrère, C. and Strauss-Kahn, V. (2009): Export Diversification: What’s Behind the
Hump? Centre for Economic Policy Research Discussion Paper No. 6590.
Carkovic, M. and Levine R. (2002): Does Foreign Direct Investment Accelerate Economic
Growth? Working Paper, University of Minnesota
Chang, K. (1991). Export Diversification and International Debt under Terms-of-Trade
Uncertainty. Journal of Development Economics, 36(2): 259–279.
Chenery, H. (1979). Structural Change and Development Policy, New York, Oxford University
Press.
Choi, I. (2001). Unit Root Tests for Panel Data, Journal of International Money and Finance
20 (2001), 249–272
Collier, P. (2003). Primary Commodity Dependence and Africa’s Future, in B. Pleskovic and N.
Stern (eds.), Annual Proceedings of the World Bank Conference on Development
Economics, Oxford University Press and World Bank, New York.
Davidson, R. and Mackinnon (1993): Estimation and Inference in Econometrics, New York:
Oxford University Press.
De Ferranti, D., Perry, G.E., Lederman, D., and Maloney, W. (2002): From Natural Resources
to the Knowledge Economy, Washington, DC: The World Bank.
DeRosa, D.A. (1991). Increasing Export Diversification in Commodity-Exporting Countries: A
Theoretical Analysis, IMF Working Paper WP/91/105, Washington DC: The IMF.
University of Ghana http://ugspace.ug.edu.gh

73
Dennis, A. and Shepherd, B. (2007): Trade Costs, Barriers to Entry, and Export Diversification
in Developing Countries. Policy Research Working Paper No.4368, World Bank.
Dornbusch, R., Fischer, D. and Samuelson, P.A. (1977): Comparative Advantage, Trade, and
Payments in a Ricardian Model with a Continuum of Goods: American Economic
Review, 67(5): 823–839.
Easterly, W and Levine, R. (1997), "Africa’s Growth Tragedy: Policies and Ethnic Divisions,”
Quarterly Journal of Economics. CXII (4), 1203-125.
Eberechukwu, U. (2013). The relation between capital formation and economic growth:
evidence from sub-Saharan African countries, Journal of Economic Policy Reform,
Available at http://dx.doi.org/10.1080/17487870.2013.799916.
Economic and Social Commission for Asia and the Pacific – ESCAP (2004): Export
Diversification and Economic Growth: the experience of selected Least Developed
Countries. Development papers No. 24, United Nations, New-York.
Economic Commission for Africa–ECA (2006): Diversification: Towards a New Paradigm for
Africa’s Development, Work in progress No. 35, African Trade Policy Centre, 2006.
Elbadawi, I. (1999). Can Africa Export Manufactures: The Role of Endowment, Exchange
Rates, and Transaction Costs. World Bank policy Research Working Paper: No. 2120.
Fosu, A. K. (1990). Export Composition and the Impact of Export on Economic Growth of
Developing Economies. Economics Letters 13(1990): 67–71.
University of Ghana http://ugspace.ug.edu.gh

74
Fosu, A. K. (1996). Primary Exports and Economic Growth in Developing Countries. World
Economy, 19(4): 466–475.
Fosu, A. K. (2012). Growth of African Economies: Productivity, Policy Syndromes and the
Importance of Institutions. CSAE Working Paper WPS/2012–11, Centre for the Study
of African Economies.
Fukuda S. and Toya H. (1995) Conditional Convergence in East Asian Countries: The Role of
Exports in Economic Growth. University of Chicago Press, Vol. 4.
Greene W. H., (2003): Econometric analysis, 5th
Edition: Prentice Hall.
Gutierrez de Pineres, S.A. and Ferrantino M. J. (1997): Export Diversification and Structural
Dynamics in the Growth Process: The Case of Chile, Journal of Development
Economics, 52: 375–391.
Guitierrez de Pineres, S. A. and Ferrantino, M. J. (2000): Export Dynamics and Economic
Growth in Latin America. Vermont: Ashgate Publishing Ltd, Burlington.
Gujarati N. D. (2003). Basic Econometrics, Tata: McGraw-Hill Publishing Company.
Habiyaremye, A. and Ziesemer, T. (2006): Absorptive Capacity and Export Diversification in
Sub-Saharan African Countries, Working Paper Series No. 2006-030. United Nations
University, UNU–Merit.
Hammouda, B. H., Karingi, S.N., Njuguna, A.E. and Sadni-Jallab M. (2006): Africa’s (Mis)
fortunes in Global Trade and the Continent’s Diversification Regimes, Journal of
World Investment and Trade, 7(4): 587–616.
University of Ghana http://ugspace.ug.edu.gh
75
Hansen, L. P., (1982). Large Sample Properties of Generalised Method of Moments Estimators,
Econometrica, 50: 1029 –1054.
Hausman, J. A. (1978). Specification Test in Econometrics: Econometrica, 46: 125 –1272.
Hausmann, R. and Klinger, B. (2006): South Africa’s Export Predicament. CID Working Paper
No 129. Cambridge, MA: Centre for International Development, Harvard University.
Hausmann, R., and B. Klinger, B. (2007): The Structure of the Product Space and the Evolution
of Comparative Advantage: CID Working Paper No. 146, Centre of International
Development, Harvard University.
Hausmann, R. and Rodrik D. (2003): Economic Development as Self–Discovery, Journal of
Development Economics 72(2): 603–633.
Hausmann, R. and Rodrik, D. (2006): Doomed to Choose: Industrial Policy as Predicament.
Paper presented at the first Blue Sky seminar, 9 September. Cambridge, MA: Centre
for International Development, Harvard University.
Hausmann, R., Hwang, J. and Rodrik, D. (2007): What you export matters. Journal of
Economic Growth 12 (1), 1–25.
Hernandez–Cata, E. (2000), Raising Growth and Investment in Sub-Saharan Africa: What Can
Be Done? Finance & Development, 32(4): Available at:
http://www.imf.org/external/pubs/ft/fandd/2000/12/hernande.htm.
Herzer D. and Nowak-Lehnmann F. (2006): What Does Export Diversification do for Growth?:
An Econometric Analysis. Applied Economics, 38(15): 1825–1838.
University of Ghana http://ugspace.ug.edu.gh
76
Hesse, H. (2008). Export Diversification and Economic Growth. The World Bank Commission
on Growth and Development, Working Paper 21: 1–25.
Hirschman, A. (1958). The Strategy of Economic Development, Yale University Press: New
Haven.
Gerber, J. (2005). International Economics (3rd Edition), New Jersey: Pearson Education, Inc.
Imbs, J. and Wacziarg R. (2003): Stages of diversification, American Economic Review 93 (1):
63–86.
IMF (2002): Finance & Development, vol. 29, No. 3 (September), available at
http://www.imf.org/external/pubs/ft/fandd/2002/09/index.htm.
Jawaid, S.T and Raza, S.A (2012): Foreign Direct Investment, Growth and Convergence
Hypothesis: A Cross –Country Analysis. Munich Personal RePEc Archive
Klinger, B. and Lederman D. (2004): Discovery and Development: An Empirical Exploration of
New Products. World Bank Policy Research Working Paper No. 3450: Washington,
DC.
Klinger, B. and Lederman D. (2006): Diversification, Innovation, and Imitation inside the
Global Technological Frontier: World Bank Policy Research Working Paper. No 3872,
Washington, DC.
Koren, M. and Tenreyro, S. (2007): Volatility and Development, Quarterly Journal of
Economics, 122(1): 243–287.
University of Ghana http://ugspace.ug.edu.gh

77
Krugman P. (1981). Intra-industry Specialisation and Gains from Trade, Journal of Political
Economy, 89(5): 959–973.
Lederman, D. and Maloney, W. F. (2003): Trade Structure and Growth, Policy Research
Working Paper No. 3025, World Bank, April.
Lederman, D. and Maloney, W. F. (2007): ‘Trade Structure and Growth, In Natural Resources:
Neither Curse nor Destiny, D. Lederman and Maloney W., eds. Palo Alto, Stanford
University Press.
Levine R. and Renelt D. (1992): A Sensitivity Analysis of Cross Country Growth Regression,
America Economic Review 82(4): 942–963.
Mankiw, N.G., Romer, D. and Weil, D. N. (1992): A Contribution to the Empirics of Economic
Growth, Quarterly Journal of Economics, 107(2): 407–437.
Matthee M. and Naudé W. (2007): Export Diversity and Regional Growth. Empirical Evidence
from South Africa: United Nations University, Research Paper. No. 11, 2007
Matthee, M. and Naudé, W. (2008): Export Diversity and Regional Growth in a Developing
Country Context: Empirical Evidence, Paper submitted to the Regional Studies
Association International Conference: Regions: The Dilemmas of Integration and
Competition, Prague.
Mejia, J. F. (2011). Export Diversification and Economic Growth: An Analysis of Colombia’s
Export Competitiveness in the European Union’s Market. Heidelberg: Springer-Verlag
Berlin Heidelberg.
University of Ghana http://ugspace.ug.edu.gh

78
Michaely, M. (1962): Concentration in International Trade, Amsterdam: North Holland
Publishing Company.
Mincer J. (1981): Human Capital and Economic Growth, NBER Working Paper Series,
Working Paper No. 803.
Naudé, W. and Rossouw, R. (2008): Export Diversification and Specialisation in South Africa:
Extent and Impact. Working Papers RP2008/93: World Institute for Development
Economic Research (UNU–WIDER).
Naudé, W. and Rossouw R. (2011): Export Diversification and Economic Performance:
Evidence from Brazil, China, India and South Africa. Economic Change and
Restructuring, 44(1): 99–134.
Osakwe, Patrick. (2007). Foreign Aid, Resources, and Export Diversification in Africa: A New
Test of Existing Theories. African Trade Policy Paper 61, Economic Commission for
Africa, Addis Ababa.
Pesaran, M.H. (2004). General Diagnostic Tests for Cross-Section Dependence in Panels,
Mimeo: University of Cambridge.
Pinaud, N. and Wegner, L. (2004): African Economic Performance in 2004: A Promise of
Things to Come? Policy Insights, No.6: OECD.
Prebisch, R. (1950). The Economic Development of Latin America and its Principal Problems
reprinted in Economic Bulletin for Latin America 7, 1962: 11–22.
Ricardo, D. (1817). On the Principles of Political Economy and Taxation: London.
University of Ghana http://ugspace.ug.edu.gh
79
Rodriguez, F. and Rodrik, D. (2001): Trade Policy and Economic Growth: A Sceptic’s Guide to
the Cross-national Evidence. NBER Macroeconomics Annual 15: 261–338.
Rodrik, D. (2005). Policies for Economic Diversification, CEPAL Review, 87: 7–23.
Rodrik, D. (2006). What’s so special about china’s exports? China & World Economy 14 (5): 1–
19.
Rodrik D. (1997): Trade Policy and Economic Performance in Sub-Saharan Africa: Swedish
Ministry for Foreign Affairs.
Romer, P. M. (1986); Increasing returns and long–run growth, Journal of Political Economy, 94
(5): 1002–1037.
Romer, P. M. (1990): Endogenous Technological Change, Journal of Political Economy, 98:
71–102.
Roodman, D. (2006). How to do xtabond2: An Introduction to Difference and System GMM in
Stata. Working Paper 103, Centre for Global Development.
Ruffin, R. J. (1974): International Trade under Uncertainty, Journal of International Economics,
4(3): 243–259.
Sachs, J. and Warner A. (1995): Natural Resource Abundance and Economic Growth, NBER
Working Paper No. 5398, Cambridge, MA: National Bureau of Economic Research.
Samen S. (2010). A Primer on Export Diversification: Key Concepts, Theoretical
Underpinnings and Empirical Evidence. Growth and Crisis Unit World Bank Institute
University of Ghana http://ugspace.ug.edu.gh

80
Simon, J. L. (1989). On Aggregate Empirical Studies Relating Population Variables to
Economic Development, Population and Development Review. 15: 323–332.
Singer, H. (1950). The Distribution of Gains between Investing and Borrowing Countries,
American Economic Review, Papers and Proceedings 40: 473–485.
Slaughter, M.J (2001): Trade Liberalisation and per Capita Income: A Difference–in–
Differences Analysis, Journal of International Economics, 55(1):203–228.
Smith, A. (1776). An Inquiry into the Nature and Causes of the Wealth of Nations, London:
Strahem and Caddell.
Solow, R. M. (1956). A Contribution to the Theory of Economic Growth, Quarterly Journal of
Economics, 70(10): 65–94.
Songwe, V. and Winkler D. (2012): Exports and Export Diversification in Sub–Saharan Africa:
A Strategy for Post–Crisis Growth. Working Paper 3, Africa Growth Initiative,
Brookings.
StataCorp (2011), Stata Longitudinal Data/Panel–Data Reference Manual Release 12, Texas:
Stata.
StataCorp (2011): Stata: Release 12. Statistical Software, College Station, TX: StataCorp LP.
Syrquin, M. (1989): Patterns of Structural Change, Handbook of Economic Development,
Amsterdam: Elsevier Science Publishers.
Turnovsky, S. J. (1974). Technological and Price Uncertainty in a Ricardian Model of
International Trade, Review of Economic Studies, 41(2): 201–217.
University of Ghana http://ugspace.ug.edu.gh

81
UNCTAD (2003): Economic Development in Africa: Trade performance and Commodity
Dependence. New York and Geneva: United Nations
United Nations Economic Report on Africa (2007): Accelerating Africa’s Development through
Diversification, Addis Ababa, Ethiopia: United Nations Economic Commission for
Africa.
United Nations Economic Report on Africa (2012): Unleashing Africa’s Potential as a Pole of
Global Growth. Addis Ababa, Ethiopia: United Nations Economic Commission for
Africa.
Vernon, R. (1966). International Investment and International Trade in the Product Cycle,
Quarterly Journal of Economics, 80(1966): 90–207.
Viner, J. (1952): International Trade and Economic Development, Glencoe: The Free Press
Wood, A. and Mayer, J. (2001): Africa’s Export Structure in a Comparative Perspective,
Cambridge Journal of Economics, 25(3): 369–394.
Wooldridge, J. (2002). Econometrics Analysis of Cross Section and Panel Data, Massachusetts:
MIT Press.
World Bank (1993): The Asian Miracle: Economic Growth and Public Policy. Oxford: Oxford
University Press.
World Bank (2005): Economic Growth in the 1990s: Learning from a Decade of Reform. World
Bank, Washington, D. C.
World Bank (2011): World Development Indicators (WDI), Washington, DC: World Bank.
University of Ghana http://ugspace.ug.edu.gh

82
World Bank (2012): African Development Indicators (ADI), Washington, DC: World Bank.
World Bank (2012): World Development Indicators (WDI),. Washington, DC: World Bank.
Yokoyama K. and Alemu M. A. (2009): The Impacts of Vertical and Horizontal Export
Diversification on Growth: An Empirical Study on Factors Explaining the Gap between
Sub-Sahara Africa and East Asia's Performances. Ritsumeikan International Affair,
17(41), Institute of International and Area Studies: Ritsumeikan University.
University of Ghana http://ugspace.ug.edu.gh

83
APPENDIX
Appendix I: List of the 42 SSA countries in the study by region
East Africa Middle Africa Southern Africa West Africa
Burundi Angola Botswana Benin
Ethiopia Cameroon Lesotho Burkina Faso
Kenya Chad Namibia Cape Verde
Madagascar Congo, Dem. Rep. South Africa Cote d'Ivoire
Malawi Congo, Rep. Swaziland Gambia, The
Mauritius Equatorial Guinea Zambia Ghana
Mozambique Gabon Guinea
Rwanda Sudan Guinea-Bissau
Seychelles Liberia
Tanzania Mali
Uganda Mauritania
Zimbabwe Niger
Nigeria
Senegal
Sierra Leone
Togo
Source: Based on United Nation’s Classification of Countries
University of Ghana http://ugspace.ug.edu.gh

84
Appendix II: GDP per Capita (growth) and Export Diversification for SSA, 1995–2010.
Years GDP per Capita
(constant 2000 US$)
GDP per Capita Growth
(annual %)
Export Product
Diversification Index
1995 491.32 1.0 0.53
1996 502.29 2.2 0.54
1997 507.21 1.0 0.52
1998 505.98 -0.2 0.51
1999 505.73 -0.1 0.56
2000 510.80 1.0 0.61
2001 516.71 1.2 0.60
2002 520.64 0.8 0.59
2003 528.89 1.6 0.59
2004 547.80 3.6 0.60
2005 563.84 2.9 0.61
2006 583.26 3.4 0.60
2007 605.15 3.8 0.60
2008 619.34 2.4 0.61
2009 617.92 -0.2 0.60
2010 633.54 2.5 0.58
Source: Author’s Computation Using STATA 12.
University of Ghana http://ugspace.ug.edu.gh

85
Appendix III: Summary of Some Key and Recent Literature Reviewed
Author
&year
Study Period
& Region
Methodology &
Variables
Findings Gaps in the study
Al–
Marhubi
(2000).
Cross-
country
sample of 91
countries
including
SSA
(1961 -1988).
(Traditional Panel
Model). Real GDP per
capita, Initial GDP per
capita, Secondary
enrolment, Investment,
Population growth,
Openness, Share of
manufactures in total
exports, three different
measures of ED.
ED is associated
with faster growth
and the
relationship is
robust to different
model
specifications and
different measures
of export
diversification.
Did not consider the
non–linear
relationship ED and
growth. Did not
discuss sensitivity
issues associated with
panel data.
Imbs and
Wacziarg
(2003)
A sample of
93 countries
including
SSA (1963–
1997.
GDP per capita, and
various measures of
domestic sectoral
concentration across
countries.
U–shaped
relationship
between income
per capita and
domestic sectoral
concentration
across countries.
Did not control for
other variables
affecting growth.
Agosin
(2007).
Cross –
country data
of 106
countries
over the
period 1980-
2003.
(OLS and IV
techniques). Real GDP
per capita, initial real
GDP per capita, gross
fixed capital formation,
ED, openness.
A positive effect of
export
diversification on
economic growth.
Did not test the non–
monotonic
relationship between
export diversification
and growth.
Hesse
(2008).
Cross–
country
sample of 99
countries for
the period
1965 – 2000.
(System GMM
Estimation) real GDP
per capita growth,
Initial GDP per capita,
Schooling, Population
growth, Investment,
Export concentration,
Openness
Non–linear link
between export
diversification and
growth.
Did not consider
regional diversities in
among developing
regions of the world.
Yokoyam
a and
Alemu
Data for 41
countries, 32
from SSA
(SURE, 3SLS and IV),
GDP per capita, initial
GDP per capita,
Both horizontal
and vertical ED
affects growth
Did not account for
the functional
relationship between
University of Ghana http://ugspace.ug.edu.gh

86
(2009). and 9 East
Asia for the
period 1975 –
2004.
vertical ED, horizontal
ED, domestic capital,
human capital,
population growth,
FDI, exchange rate,
openness, political
instability, rule of law.
positively; but the
latter has greater
effect than the
former. East Asia
performed better
than SSA in terms
of ED and
economic growth.
export diversification
and economic growth.
Cadot et
al, (2009)
Cross–
country
sample of 156
countries
including
SSA (1988–
2006).
(System GMM
Estimation), various
measure of ED, GDP
per capita, squared
term of GDP per
capita, raw materials.
Find a hump-
shaped relationship
between economic
development and
export
diversification.
Did not consider the
effect of regional
differences in the
sample.
Source: Author’s Compilation.
University of Ghana http://ugspace.ug.edu.gh