Embed Size (px)
Citation preview

Agro export and global value chainAgro‐export and global value chain
Rubén Velarde

Global ChainsGlobal Chains
I t ti f thOpening of theinternational market in the 90’s
Integration of the non‐traditional agricultural and livestock sector to theinternational marketinternational market
Agro‐industry for export takes advantage of largeirrigation projects in Northern Peru and of a legal framework that favors investments in the agrariansector.
2003 2013Increased 5 5 times
Export Value: (US$ Millions) 623.59 3,431.33Increased 5.5 times
Global Chain Development ConditionsGlobal Chain Development ConditionsChanges in demand nature.New model of food consumption. It demands quality, safety, harmlessness, availability, opportunity and convenience.
Distribution channels.T diti l h l l d l d t il l ti i ti LTraditional wholesale dealers and retailers lose participation. Largerincidence of supermarkets demanding more quality, commercialservice and direct sales policies at international level.
Market liberalization and deregulation process.Market liberalization process is kept.
Development of Information Technology, Communication and Transportation.It aids company internationalization reducing costs and fomenting innovationIt aids company internationalization, reducing costs and fomenting innovation. It promotes competition among companies from different origins.

Global ChainsGlobal Chains
Suitable offer to respond to a market that demands better quality productionSuitable offer to respond to a market that demands better quality, productionstandards and product presentation. Origin does not matter, but fitting marketconditions.
A2
A3 A4
Diapositiva 5
A1 BiodiversityEnhancement by natural selection
SeedsFertilizersMachinery and equipmentPesticides
Supplies
Adriana, 18/06/2014
A2 TariffsSanitary regulationsFinancing
Promotion mechanisms
Public sectorAdriana, 18/06/2014
A3 Medium and small-sized producers
Land leasingAssociated producersAgriculture and livestock wage earners
Agro-industrial companies vertically integrated
Agricultural production
Harvest and post-harvest treatment
Agro-industrial classification and transformationAdriana, 18/06/2014
A4 IndustryPacking and refrigeration
Cooling chain

Diapositiva 5 (continuación)
Large Retail ChainsSupermarketsWholesale distributionRetail marketsGourmet
HO RE CA distribution
Organic products
Adriana, 18/06/2014
Agro‐export companiesAgro export companies
• Development of strategies for vertical integrationDevelopment of strategies for vertical integration.
• Agro‐export companies control from productionprocess through export operation (fresh productsprocess through export operation (fresh productsand with a certain level of transformation).
• Use of state‐of‐the‐art technology and high• Use of state‐of‐the‐art technology and highinvestment level.
• They reach high efficiency levels in trade• They reach high efficiency levels in tradeoperations.

Peru: agricultural and livestock exportsPeru: agricultural and livestock exportsExport of non‐traditional products:
USD11,005.58 millionsUSD11,005.58 millionsNon‐traditional agro‐exports: 31.22%
FOB 2012 FOB 2013 Var % 2013 / Contrib %Product
FOB 2012USD Millions
FOB 2013USD Millions
Var.% 2013 / 2012
Contrib.% 2013
Other agricultural, livestock and agro-industrial products
1 005.39 1 108.67 10,27 % 32,31 %
Fresh, dehydrated, frozen and/or cooledFresh, dehydrated, frozen and/or cooledfruits
820,37 1.020,52 24,40 % 29,74 %
Other fresh, frozen and cooled vegetables 542,57 615,66 13,47 % 17,94 %
Canned vegetables and/or fruits 495,21 473,23 -4,44 % 13,79 %
Other agro-industrial and fishing products 165,48 166,79 0,79 % 4,86 %
Drinks 32,64 29,69 -9,04 % 0,87 %
Flowers 11,81 13,66 15,67 % 0,40 %
ff b dCoffee, tea, yerba mate and spices 3,76 3,11 -17,18 % 0,09 %
TOTAL 3 077.23 3 431.33 11,51 % 100,00 %
Source: SUNAT
Agricultural and Livestock Products – 2013 ExportsMain Country Net Weight Kg. FOB Value - USD. Share
United States 530,027,178.19 1,050,557,371.23 30.85%
The Netherlands 261,309,336.45 446,524,959.56 13.11%
Maindestinationmarkets
The five main agro‐export
Rank Position
EXPORTER
36 CAMPOSOL S AThe five main agro exportcompanies in 2013
36 CAMPOSOL S.A.
40 ALICORP SAA
54 DANPER TRUJILLO S.A.C.57 COMPLEJO AGROINDUSTRIAL BETA S.A.64 SOCIEDAD AGRICOLA VIRU S.A.
Value of agro exportsCompany FOB Value in USD millions
Value of agro‐exportscompanies located in Viru Valley (2013)
2010 2011 2012 2013
Camposol S.A. 100.05 146.97 151.84 179.92
Sociedad Agrícola Virú S.A. 100.27 129.06 100.00 87.56
TAL S.A. 16.49 20.52 20.34 27.56
Total non traditional agricultural 2 201 53 2 834 42 3 081 23 3 432 45
Source: SUNAT
Total non‐traditional agricultural
and livestock exports
2 201.53 2 834.42 3 081.23 3 432.45

Exports of Agro‐Industrial Companies in Viru Valley (USD thousands)Period 2011‐ April 2014)
Product Camposol S.A.* Sociedad Agrícola Virú TAL S.A.
Value in USD % Value in % Value in %
Period 2011 April 2014)
Value in USD
Thousands
%
Share
Value in
USD
Thousands
%
Share
Value in
USD
Thousands
%
Share
Fresh asparagus 62,920.63 5.61% 23,500.54 2.10%
Processed
asparagus 116,719.55 24.32% 126,323.0 26.32% 40,595.46 8.46%
Frozen asparagus 13,147.21 8.04% 4,558.18 2.79%
Avocados 3 498 14 0 69%Avocados 88,726.89 17.55% 3,498.14 0.69%
Fresh Mangos 43,494.86 9.08%
Artichoke 24 553.56 6,92% 112 860.80 31,81%
Piquillo pepperPiquillo pepper 41 365.75 25,89% 35 984.97 22,52%
Grapes 58 025.24 4,36%
Tangerines 3,699.85 2.55%
Shrimp export is not included.
Source: SUNAT
Workers hired by companies:‐ Camposol S.A (14,210), ‐ Sociedad Agrícola Virú (16,987), andg ( , ),‐ TAL S.A. (4,297). These companies operate also in South and Central Peru (SUNAT, 2013)
Companies and Labor RelationsCompanies and Labor Relations

Labor Relations are Ruled by Law N°27360 for Promotion of the AgrarianSector (Issued in October 2000, In force until 2021)( , )
This law Hiring workers under temporary and non‐continuos labor conditionsallows
Hiring workers under temporary and non continuos labor conditions(permanent duties but intermittent, with periods from two to fourmonths, especially in harvest time.)
Flexible, variable, accumulative, atypical and compensable work day of 48 effective weekly working hours, with a schedule to be determined by the employer.
Overtime is compensated with equivalent time off periods.
Agrarian daily wage includes the severance payment, special bonuses forNational Independence Day and Christmas, and time effectively worked.
Daily amount:S/. 29.26 per day (as of June 2012)
WagesThis is equivalent to a monthly payment of S/. 877.8
This only covers 84.4% of the most basic family basketrequired family subsistence (four person family)required family subsistence (four‐person family)
Work days of more than 8 hours. Overtime is not recognized.
Unionization
Agrarian workers are poorly organized (they represent 2.69% from total unionizedworkers all over the country).
Companies threaten workers in order to discourage union organization (by giving themtemporary time‐off notes or dismissing them).In March, the Secretary General of SITECASA was dismissed (Camposol), along with 14 workers.workers.
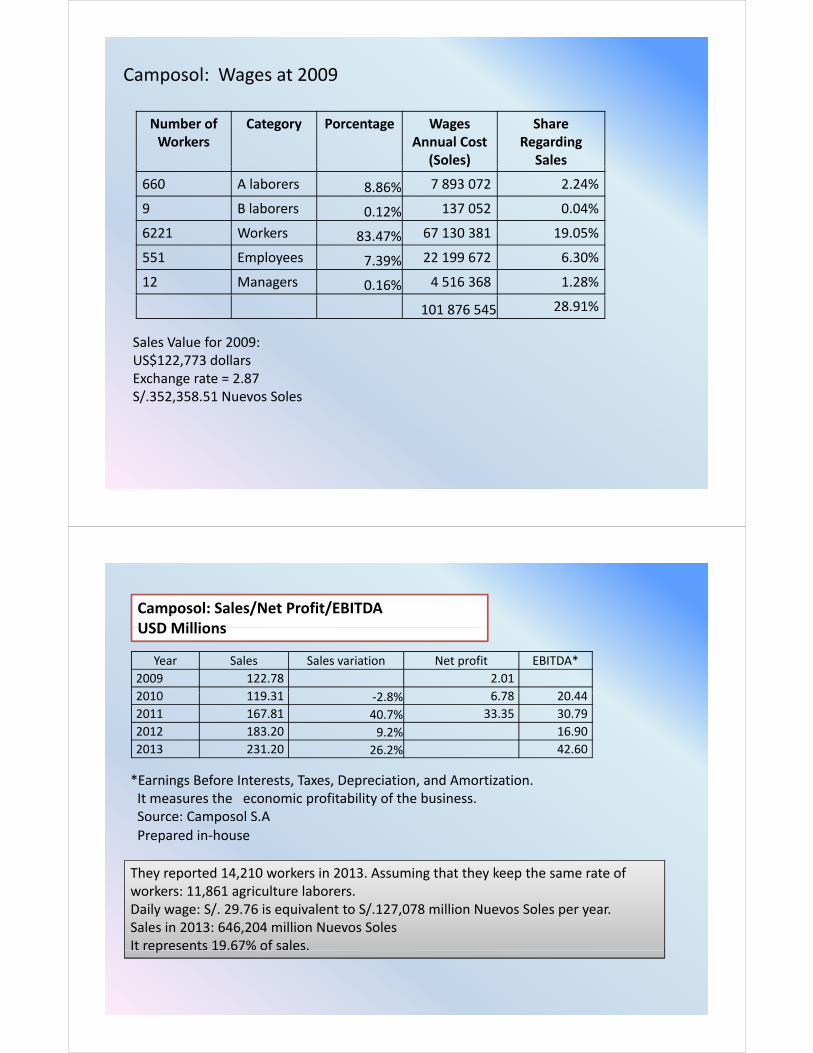
Camposol: Wages at 2009
Number of Workers
Category Porcentage WagesAnnual Cost
(Soles)
ShareRegardingSales( )
660 A laborers 8.86% 7 893 072 2.24%
9 B laborers 0.12% 137 052 0.04%
6221 Workers 67 130 381 19 05%6221 Workers 83.47% 67 130 381 19.05%
551 Employees 7.39% 22 199 672 6.30%
12 Managers 0.16% 4 516 368 1.28%
101 876 545 28.91%
Sales Value for 2009: US$122 773 dollarsUS$122,773 dollarsExchange rate = 2.87S/.352,358.51 Nuevos Soles
Camposol: Sales/Net Profit/EBITDAUSD Millions
Year Sales Sales variation Net profit EBITDA*
2009 122.78 2.01
2010 119 31 6 78 20 44
USD Millions
2010 119.31 ‐2.8% 6.78 20.44
2011 167.81 40.7% 33.35 30.79
2012 183.20 9.2% 16.90
2013 231.20 26.2% 42.60
*Earnings Before Interests, Taxes, Depreciation, and Amortization.It measures the economic profitability of the business.Source: Camposol S.Ap
Prepared in‐house
They reported 14,210 workers in 2013. Assuming that they keep the same rate of k i l l bworkers: 11,861 agriculture laborers.
Daily wage: S/. 29.76 is equivalent to S/.127,078 million Nuevos Soles per year.Sales in 2013: 646,204 million Nuevos SolesIt represents 19.67% of sales.p

Certifications and Social Responsibility
Companies fit market
IPM (Integrated Pest Management).GlobalGAP (Certification on Good AgriculturalPractices), Companies fit market
demands in relation toproduction and environmental aspects
),Tesco Nature Choice for avocado crops.
At the processing plant: HACCP (Hazard Analysis and Critical Control Point)
pHACCP (Hazard Analysis and Critical Control Point), GMP‐GAP ), Good Manufacturing Practices – Good Agricultural Practices), Kosher Certification (issued by the Jewish community),GMA‐SAFE, BASC (Business Alliance for Secure Commerce), BRC V 5 0 (British Retail Consortium)BRC V. 5.0 (British Retail Consortium)
However, in the labor aspect, they consider that by following Law N°27360 i h Thi ff k ’ i h h i l di i i his enough. This affects workers’ rights, who are in lower conditions withregards to other labor sectors.
Peru: Presence of main agricultural and livestock products in theinternational market
Product The Netherlands Other Representative Country Total for Period
Exports for Period 2011‐ April 2014 ‐ USD FOB Value
Product The Netherlands Other Representative Country Total for Period
FOB Value Share FOB Value Share FOB Value
Fresh asparagus 146,418,364 13.06% U.S.A. 677,543,362 60.43% 1,121,268,776
Processed asparagus 10,379,345 2.16% Spain 135,284,474 28.19% 479,874,581
Frozen asparagus 6,613,190 4.05% U.S.A. 80,589,627 49.30% 163,479,445
Avocados 232,347,795 46.00% Spain 114,791,931 22.7% 505,470,283
Mangos 186,407,447 38.93% U.S.A. 151,319,589 31.60% 478,839,048
00 26 2 00% S 9 86 326 92% 3 82 90Artichoke 7 100 526 2,00% U.S.A. 194 861 326 54,92% 354 827 490
Piquillo pepper 790753 0,49% Spain 136406019 85,37% 159 779 961
Grapes 203535477 15,30% U.S.A. 271249493 20,38% 1 330 674 237
Tangerines 22 220 716 15,33% United 44 335 604 30,60% 144 907 403gKingdom
Source: SUNAT

Peru: Exports to The NetherlandsFOB Value, USD Thousands / Net Weight in Tons
Principales Productos agropecuarios
, / g
Tariff code Description TONSFOB USD
Thousands% Shared
Thousands
804400000 AVOCADOS, FRESH OR DEHYDRATED 50,460.84 84,494.99 18.92%
806100000 FRESH GRAPES 34,625.61 80,571.16 18.04%
804502000MANGOS AND MANGOSTEENS, FRESH OR
49 549 70 50 119 06804502000DEHYDRATED
49,549.70 50,119.0611.22%
709200000 ASPARAGUS, FRESH OR FROZEN 11,109.53 44,180.76 9.89%
803901100 «CAVENDISH VALERY» BANANA 57,888.61 42,102.38 9.43%
1801001900 RAW CACAO EXCEPT FOR SEEDING 7,728.24 19,680.734.41%
2009892000 PASSION FRUIT (PASSIFLORA EDULIS) 3,091.14 16,698.713.74%
805202000 TANGELO ORANGE (CITRUS RETICULATA X 15 898 88 14 118 06
805201000 CITRUS PARADISIS) AND TANGERINE15,898.88 14,118.06
3.16%
Others 30,956.81 94,559.10 21.18%
TOTAL 261,309.34 446,524.96
Source: SUNATPrepared by: PROMPERU
Fruits: Imports from The NetherlandsFruits: Imports from The Netherlands
Category: FruitsCategory: Fruits
Holland imports grapes, oranges, apples and tangerines, whichrepresent 37% of its imports for period 2006‐2010.
Mangos and avocados are among its imports of exotic fruits.
Re‐exports: 45% of fresh fruits imports are re‐exported toGermany, United Kingdom and France.
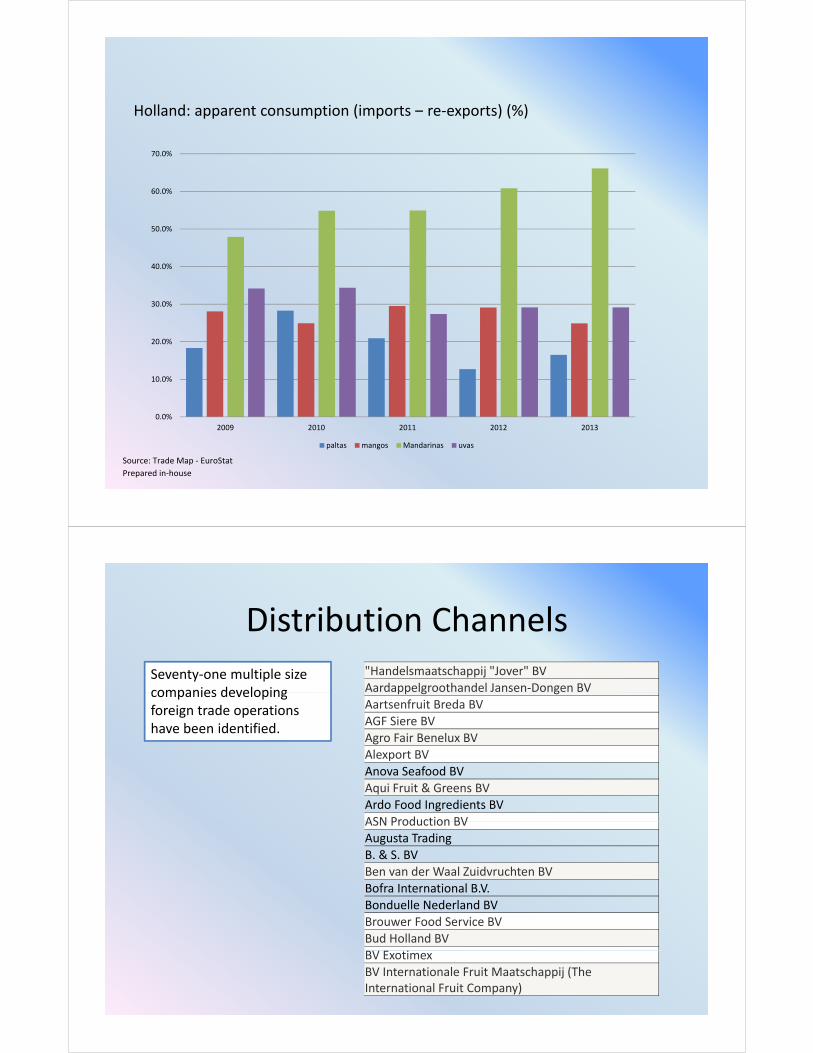
Holland: apparent consumption (imports – re‐exports) (%)
70.0%
50.0%
60.0%
40.0%
50.0%
20.0%
30.0%
0.0%
10.0%
Source: Trade Map ‐ EuroStat
Prepared in‐house
2009 2010 2011 2012 2013
paltas mangos Mandarinas uvas
Distribution Channels
Seventy‐one multiple sizecompanies developing
Distribution Channels"Handelsmaatschappij "Jover" BVAardappelgroothandel Jansen‐Dongen BVcompanies developing
foreign trade operationshave been identified.
pp g gAartsenfruit Breda BVAGF Siere BVAgro Fair Benelux BVAlexport BVAlexport BVAnova Seafood BVAqui Fruit & Greens BVArdo Food Ingredients BVASN Production BVASN Production BVAugusta TradingB. & S. BVBen van der Waal Zuidvruchten BVB f I t ti l B VBofra International B.V.Bonduelle Nederland BVBrouwer Food Service BVBud Holland BV
iBV ExotimexBV Internationale Fruit Maatschappij (TheInternational Fruit Company)

Holland: Distribution Channels
Th G S i L d B kk B d ht
Holland: Distribution Channels
The Greenery, Superunie, Laurus and Bakker Barendrecht are the most important companies in fruit trade.
Almost 70%‐80% of fresh fruits are offered through supermarkets:Albert Heijn (Ahold Group), 33.6%;Jumbo, (22,5%),, ( , ),Aldi, (7.9%),
The balance is distributed among stores specialized in selling fruits and
vegetables.
Consumption per person per year in kilos ‐ Selected Products2009 2010 2011 2012 2013
Avocados 0.98 1.81 1.32 0.91 1.41Mangos 1.94 2.14 2.77 2.47 2.18Tangerines 5.53 7.41 6.31 6.70 7.10Grapes 8.98 8.51 6.28 7.04 7.23Grapes 8.98 8.51 6.28 7.04 7.23Fresh asparagus 0.09 0.21 ‐0.18 ‐0.23 ‐0.08Frozen asparagus ‐0.04 ‐0.10 ‐0.08 ‐0.13 ‐0.01
Source: Trade Map ‐ EuroStat
Prepared in‐house