Embed Size (px)
Citation preview
Student: Class: Date:
Exponential functions and equations Student Activity Sheet 3; use with Exploring “Growth and decay”
Copyright 2015 Agile Mind, Inc. ® Content copyright 2015 Charles A. Dana Center, The University of Texas at Austin
Page 1 of 14 With space for student work
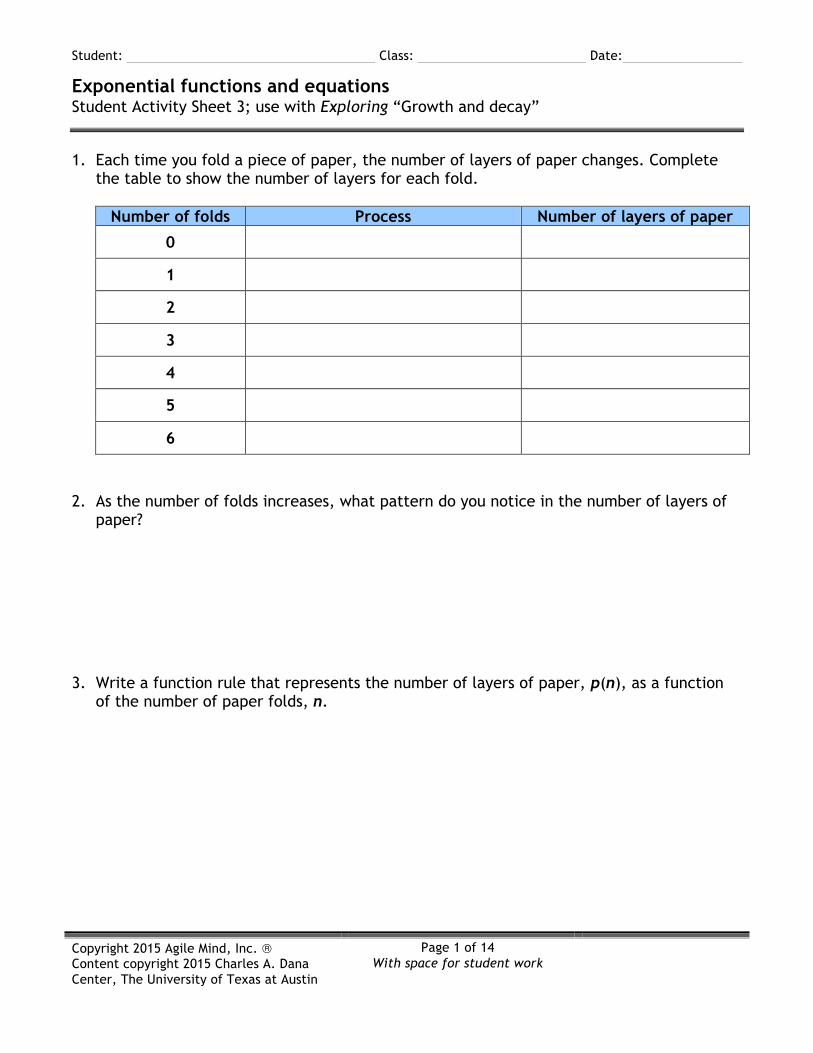
1. Each time you fold a piece of paper, the number of layers of paper changes. Complete the table to show the number of layers for each fold.
Number of folds Process Number of layers of paper
0
1
2
3
4
5
6
2. As the number of folds increases, what pattern do you notice in the number of layers of
paper?
3. Write a function rule that represents the number of layers of paper, p(n), as a function
of the number of paper folds, n.
Student: Class: Date:
Exponential functions and equations Student Activity Sheet 3; use with Exploring “Growth and decay”
Copyright 2015 Agile Mind, Inc. ® Content copyright 2015 Charles A. Dana Center, The University of Texas at Austin
Page 2 of 14 With space for student work
4. Draw a scatterplot of the paper folding experiment.
5. Using the function rule you wrote for question 3, calculate how many layers a paper would have if you folded the paper 18 times.
6. How many folds would create 1024 layers of paper? Use your function rule and guess and
check to find the answer.
Student: Class: Date:
Exponential functions and equations Student Activity Sheet 3; use with Exploring “Growth and decay”
Copyright 2015 Agile Mind, Inc. ® Content copyright 2015 Charles A. Dana Center, The University of Texas at Austin
Page 3 of 14 With space for student work
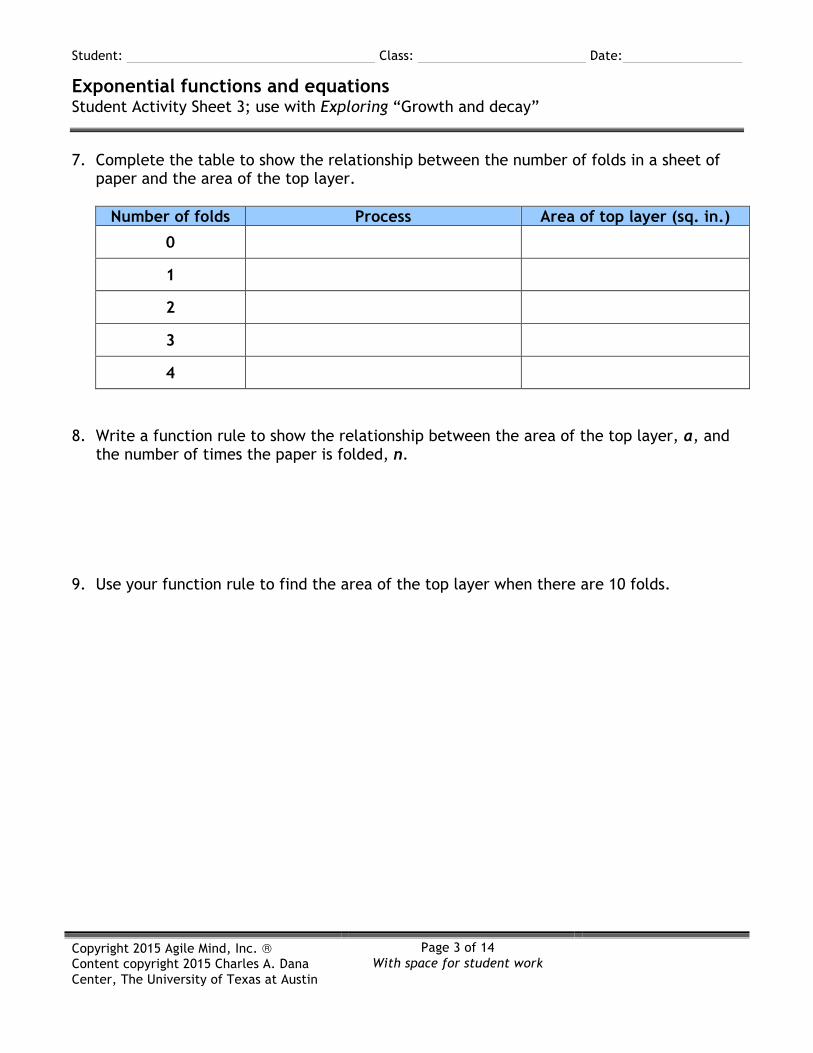
7. Complete the table to show the relationship between the number of folds in a sheet of paper and the area of the top layer.
Number of folds Process Area of top layer (sq. in.)
0
1
2
3
4
8. Write a function rule to show the relationship between the area of the top layer, a, and
the number of times the paper is folded, n.
9. Use your function rule to find the area of the top layer when there are 10 folds.

Student: Class: Date:
Exponential functions and equations Student Activity Sheet 3; use with Exploring “Growth and decay”
Copyright 2015 Agile Mind, Inc. ® Content copyright 2015 Charles A. Dana Center, The University of Texas at Austin
Page 4 of 14 With space for student work
10. Use your function rule to find the number of folds when the area of the top layer is 2.5 square inches.
11. Draw a scatterplot of the data from the paper folding experiment.

Student: Class: Date:
Exponential functions and equations Student Activity Sheet 3; use with Exploring “Growth and decay”
Copyright 2015 Agile Mind, Inc. ® Content copyright 2015 Charles A. Dana Center, The University of Texas at Austin
Page 5 of 14 With space for student work
12. If you were able to continue folding the paper, what would happen to the area of the top layer? How would you see this on the graph?
13. Compare the two paper-folding graphs. a. How are the graphs the same? Why?
b. How are the graphs different? Why?
Student: Class: Date:
Exponential functions and equations Student Activity Sheet 3; use with Exploring “Growth and decay”
Copyright 2015 Agile Mind, Inc. ® Content copyright 2015 Charles A. Dana Center, The University of Texas at Austin
Page 6 of 14 With space for student work
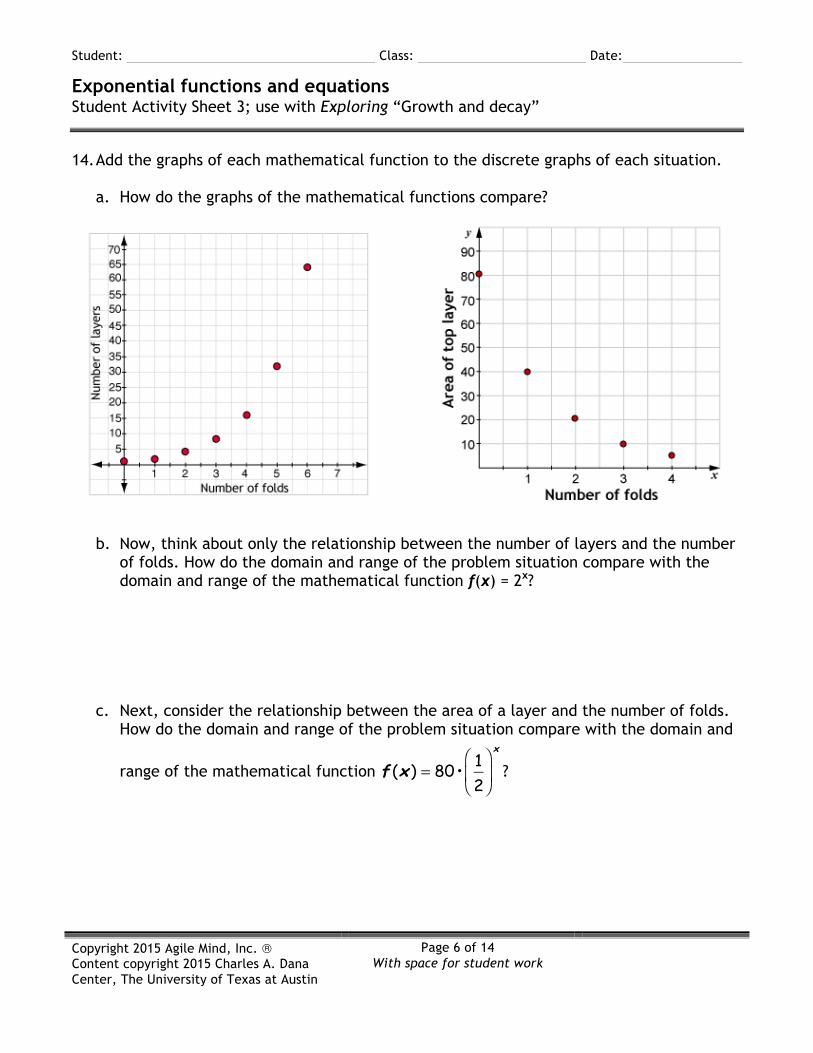
14. Add the graphs of each mathematical function to the discrete graphs of each situation.
a. How do the graphs of the mathematical functions compare?
b. Now, think about only the relationship between the number of layers and the number
of folds. How do the domain and range of the problem situation compare with the domain and range of the mathematical function f(x) = 2x?
c. Next, consider the relationship between the area of a layer and the number of folds. How do the domain and range of the problem situation compare with the domain and
range of the mathematical function f (x ) = 80• 1
2
⎛
⎝⎜
⎞
⎠⎟
x
?
Student: Class: Date:
Exponential functions and equations Student Activity Sheet 3; use with Exploring “Growth and decay”
Copyright 2015 Agile Mind, Inc. ® Content copyright 2015 Charles A. Dana Center, The University of Texas at Austin
Page 7 of 14 With space for student work
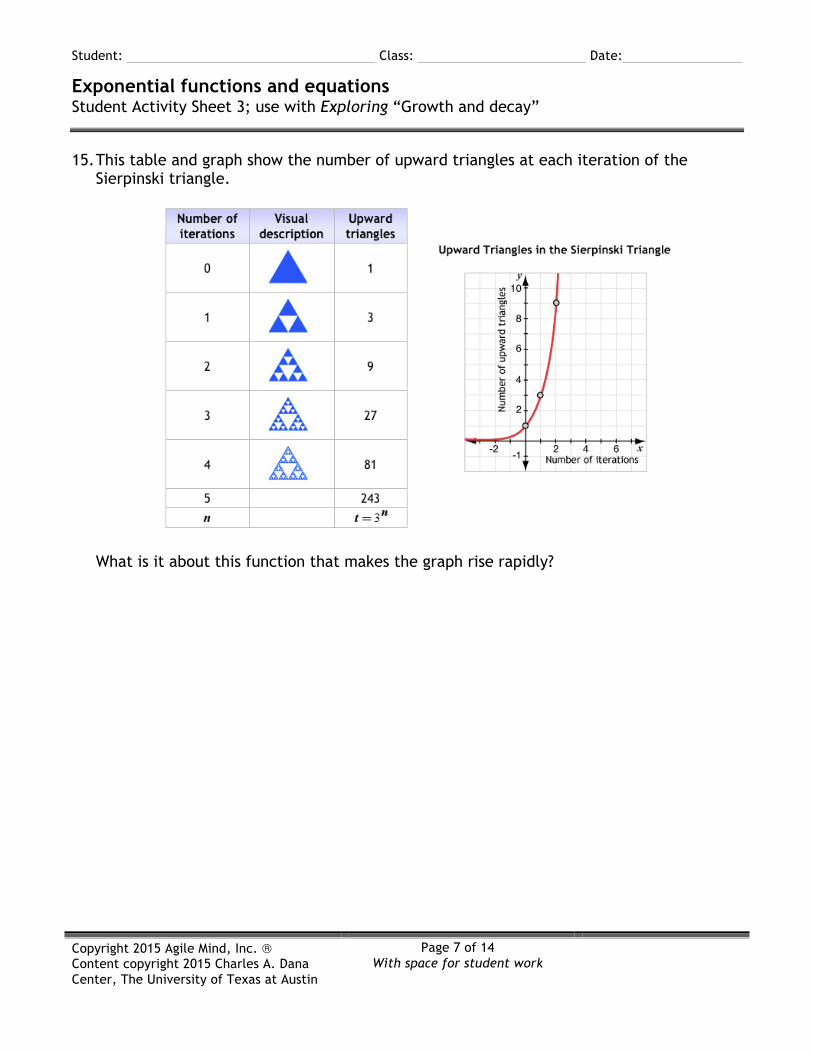
15. This table and graph show the number of upward triangles at each iteration of the Sierpinski triangle.
What is it about this function that makes the graph rise rapidly?
Student: Class: Date:
Exponential functions and equations Student Activity Sheet 3; use with Exploring “Growth and decay”
Copyright 2015 Agile Mind, Inc. ® Content copyright 2015 Charles A. Dana Center, The University of Texas at Austin
Page 8 of 14 With space for student work
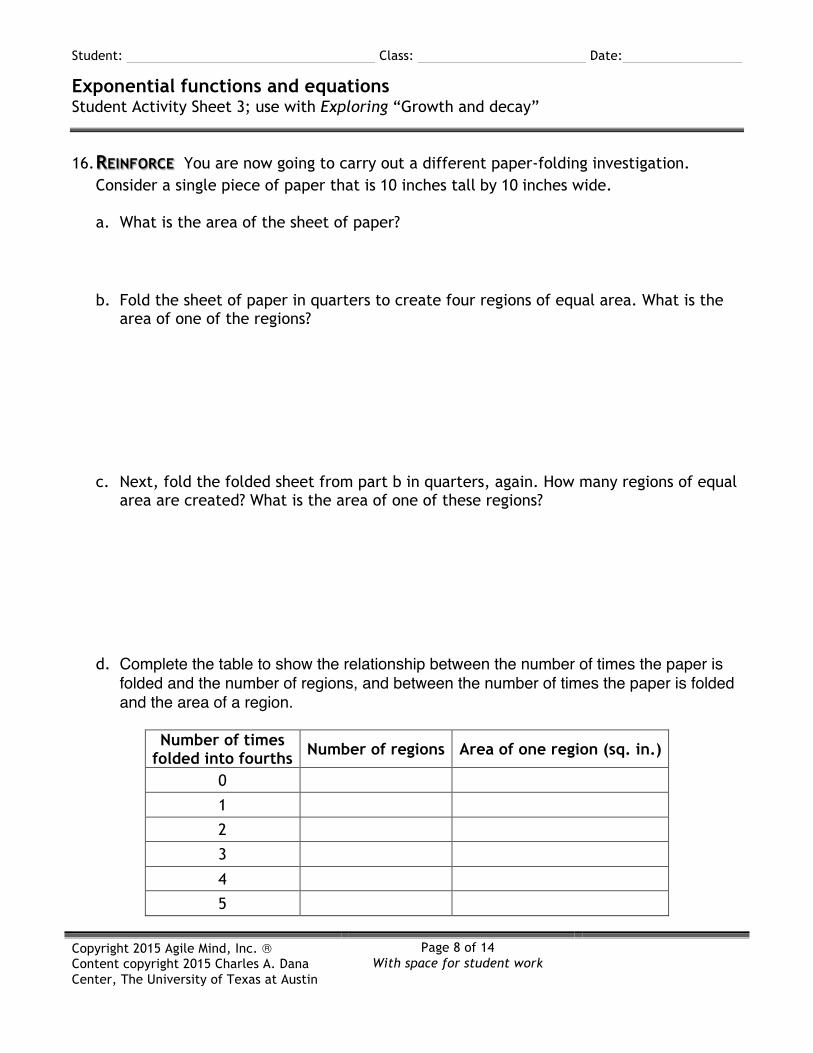
16. You are now going to carry out a different paper-folding investigation.REINFORCEConsider a single piece of paper that is 10 inches tall by 10 inches wide.
a. What is the area of the sheet of paper?
b. Fold the sheet of paper in quarters to create four regions of equal area. What is the
area of one of the regions?
c. Next, fold the folded sheet from part b in quarters, again. How many regions of equal
area are created? What is the area of one of these regions?
d. Complete the table to show the relationship between the number of times the paper is
folded and the number of regions, and between the number of times the paper is folded and the area of a region.
Number of times
folded into fourths Number of regions Area of one region (sq. in.)
0
1
2
3
4
5

Student: Class: Date:
Exponential functions and equations Student Activity Sheet 3; use with Exploring “Growth and decay”
Copyright 2015 Agile Mind, Inc. ® Content copyright 2015 Charles A. Dana Center, The University of Texas at Austin
Page 9 of 14 With space for student work
e. Will an exponential function model each of these relationships? Explain.
f. Write a function rule to model each of these relationships.
Student: Class: Date:
Exponential functions and equations Student Activity Sheet 3; use with Exploring “Growth and decay”
Copyright 2015 Agile Mind, Inc. ® Content copyright 2015 Charles A. Dana Center, The University of Texas at Austin
Page 10 of 14 With space for student work
g. Graph the two rules. Describe how the key characteristics of each graph represent what happens in each situation.
Student: Class: Date:
Exponential functions and equations Student Activity Sheet 3; use with Exploring “Growth and decay”
Copyright 2015 Agile Mind, Inc. ® Content copyright 2015 Charles A. Dana Center, The University of Texas at Austin
Page 11 of 14 With space for student work
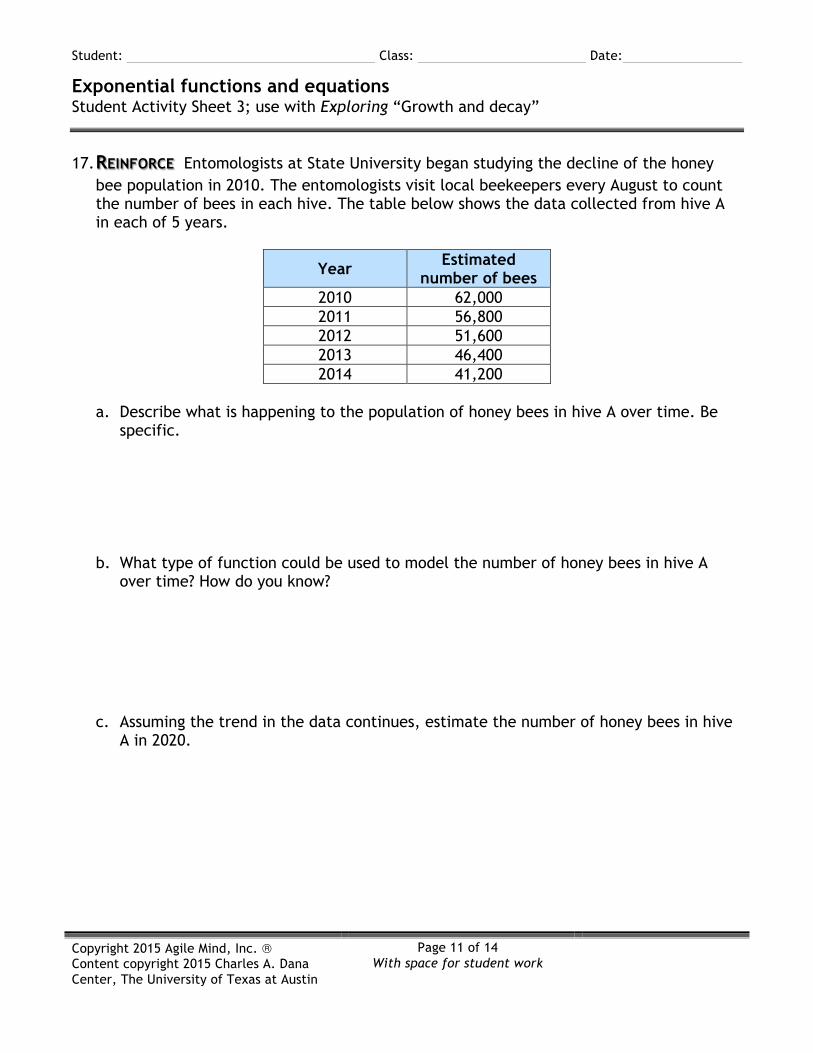
17. Entomologists at State University began studying the decline of the honey REINFORCEbee population in 2010. The entomologists visit local beekeepers every August to count the number of bees in each hive. The table below shows the data collected from hive A in each of 5 years.
Year Estimated number of bees
2010 62,000 2011 56,800 2012 51,600 2013 46,400 2014 41,200
a. Describe what is happening to the population of honey bees in hive A over time. Be
specific.
b. What type of function could be used to model the number of honey bees in hive A over time? How do you know?
c. Assuming the trend in the data continues, estimate the number of honey bees in hive A in 2020.
Student: Class: Date:
Exponential functions and equations Student Activity Sheet 3; use with Exploring “Growth and decay”
Copyright 2015 Agile Mind, Inc. ® Content copyright 2015 Charles A. Dana Center, The University of Texas at Austin
Page 12 of 14 With space for student work
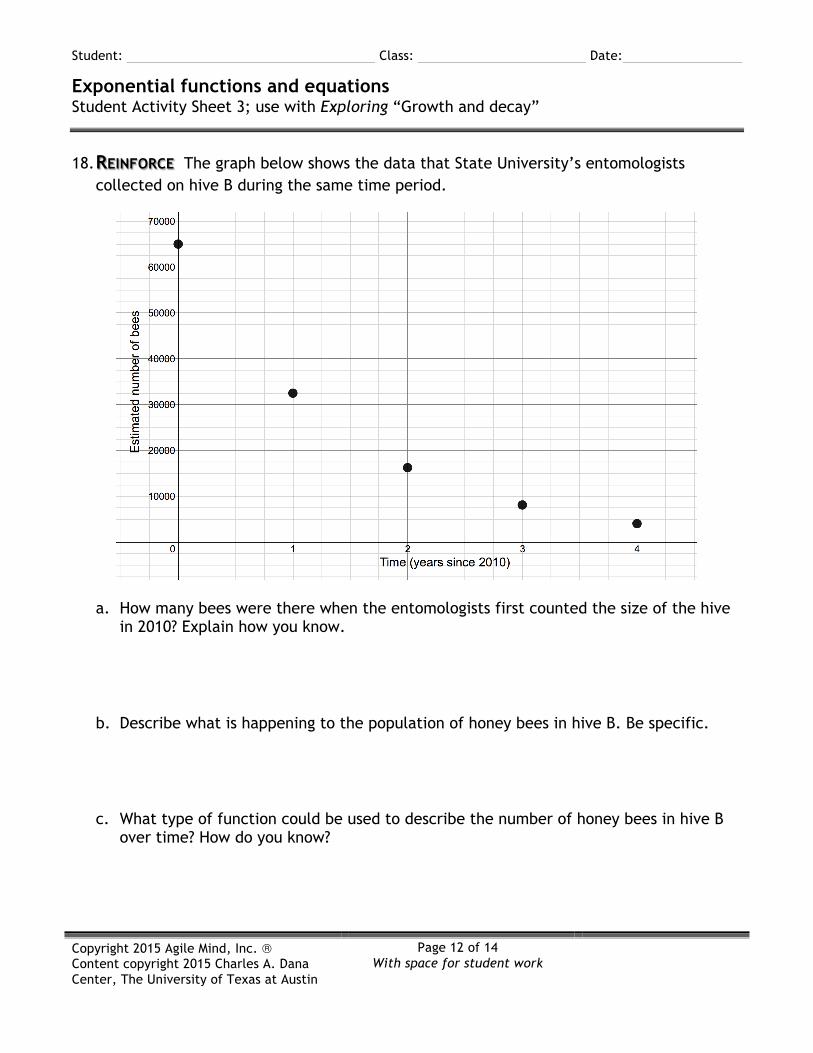
18. The graph below shows the data that State University’s entomologists REINFORCEcollected on hive B during the same time period.
a. How many bees were there when the entomologists first counted the size of the hive in 2010? Explain how you know.
b. Describe what is happening to the population of honey bees in hive B. Be specific.
c. What type of function could be used to describe the number of honey bees in hive B over time? How do you know?
Student: Class: Date:
Exponential functions and equations Student Activity Sheet 3; use with Exploring “Growth and decay”
Copyright 2015 Agile Mind, Inc. ® Content copyright 2015 Charles A. Dana Center, The University of Texas at Austin
Page 13 of 14 With space for student work
19. The entomologists discovered that the equation b = 63,500(0.75)t models the REINFORCEpopulation of hive C, where b represents the number of honey bees in hive C and t represents the number of years since 2010. a. Use a calculator to create a table of the number of honey bees in hive C from 2010 to
2014. Then use the values in the table to create a graph.
b. How many honey bees were in the hive in 2010?
c. If the model continues to be accurate over time, estimate the number of honey bees in 2020.
Student: Class: Date:
Exponential functions and equations Student Activity Sheet 3; use with Exploring “Growth and decay”
Copyright 2015 Agile Mind, Inc. ® Content copyright 2015 Charles A. Dana Center, The University of Texas at Austin
Page 14 of 14 With space for student work
20. Which hive (A, B, or C) is in the greatest danger? Explain your reasoning. REINFORCE
21. Can you demonstrate that exponential functions change by equal factors LITERACY TASKover equal intervals? After analyzing the different exponential functions in this topic, write an explanation in which you justify the statement “Exponential functions change by equal factors over equal intervals.”