Embed Size (px)
Citation preview

EXPONENTIAL CLIMATE ACTION ROADMAP

This report has been produced with sustainability in mind by Greenerprinter. Its carbon emissions have been balanced through Tricorona Climate Partner Gold Standard CDM. Once you have read it, please pass it along to someone else so it can have a second and a third life.
More and more people are taking steps to halve their own emissions. Take the Citizens Climate Pledge and become a climate leader:
https://climatepledge.global/
NAME
NAME
NAME
NAME
NAME
NAME EXPONENTIALROADMAP.ORG

The Paris Agreement’s goal to reduce the risk of dangerous climate change can be achieved if greenhouse gas emissions peak by 2020, halve by 2030 and then halve again by 2040 and 2050. This is now technologically feasible and economically attractive but the world is not on this path. This roadmap focuses on the immediate priorities, and has three purposes:
• To communicate the pace, scale and systemic nature of the necessary economic transformation.
• To connect the exponential scaling potentials in the digital revolution to the climate challenge.
• To support momentum across policy, markets and technology.
PRODUCED BY LEAD PARTNERS
SUPPORTING PARTNERS
FOREWORD ........................................ 05EXECUTIVE SUMMARY ........................ 07ABOUT THIS REPORT ........................... 13HALVING EMISSIONS BY 2030 .............. 15ENERGY SUPPLY .................................. 19INDUSTRY .......................................... 28DIGITAL INDUSTRY ............................. 36BUILDINGS ........................................ 44TRANSPORT ....................................... 52FOOD CONSUMPTION ......................... 61AGRICULTURE & FORESTRY .................. 69CITIES ................................................ 77CLIMATE LEADERSHIP ......................... 81POLICY ............................................... 86EXPONENTIAL TECHNOLOGY ............. 90FINANCING THE TRANSITION ............. 93OPEN DATA FOR CLIMATE ACTION ...... 98REFERENCES .................................... 100IMAGE CREDITS ............................... 105CONTRIBUTORS ............................... 106

EXPONENTIALROADMAP.ORGGLOBAL CL IMATE ACTION SUMMIT 2018
Disruption is here. Three unstoppable forces are pushing us towards a future of prosperity, growth and clean energy: climate leadership, market forces and the digital revolution. This roadmap provides an insight into how these will combine to create the future we all want.
Christiana Figueres Convenor, Mission 2020
FOREWORD
Leaders from cities, investors and corporates are forming alliances for climate action to inspire governments and peers to step up their efforts to reduce emissions. These include setting ambitious targets based on science, implementing these through increased entrepreneurship, and accelerating high impact innovation. We must do this if we are to have a future where people can live in harmony with nature.
Manuel-Pulgar-Vidal, leader of WWF’s global climate and energy programme
The world is at a critical juncture and the stakes could not be higher. Greenhouse gas emissions need to peak by 2020 and then fall dramatically – approximately halving every decade in order to reach the Paris Agreement’s terms. The consequences of missing this goal are potentially catastrophic for humanity. Yet all solutions exist to begin halving emissions immediately. Now is the moment to move from incremental to exponential action.
Johan Rockström, Executive Director, Stockholm Resilience Centre, co-chair Future Earth, incoming co-director Potsdam Institute for Climate Impact Research
The world has crossed the Rubicon where incremental change is no longer adequate to address climate change. Fortunately, research and innovation have given us what we need – save time – to tackle the climate crisis. This roadmap shows how business, politicians and civic groups can leverage this knowledge to scale up progress exponentially. We’ve got the knowledge and the tools. And we increasingly, we have the economics behind us. Now we just need the drive to accelerate forward.
Amy Luers Executive Director, Future Earth
5 FO
RE
WO
RD
EXPONENTIALROADMAP.ORGGLOBAL CL IMATE ACTION SUMMIT 2018
6 FO
RE
WO
RD
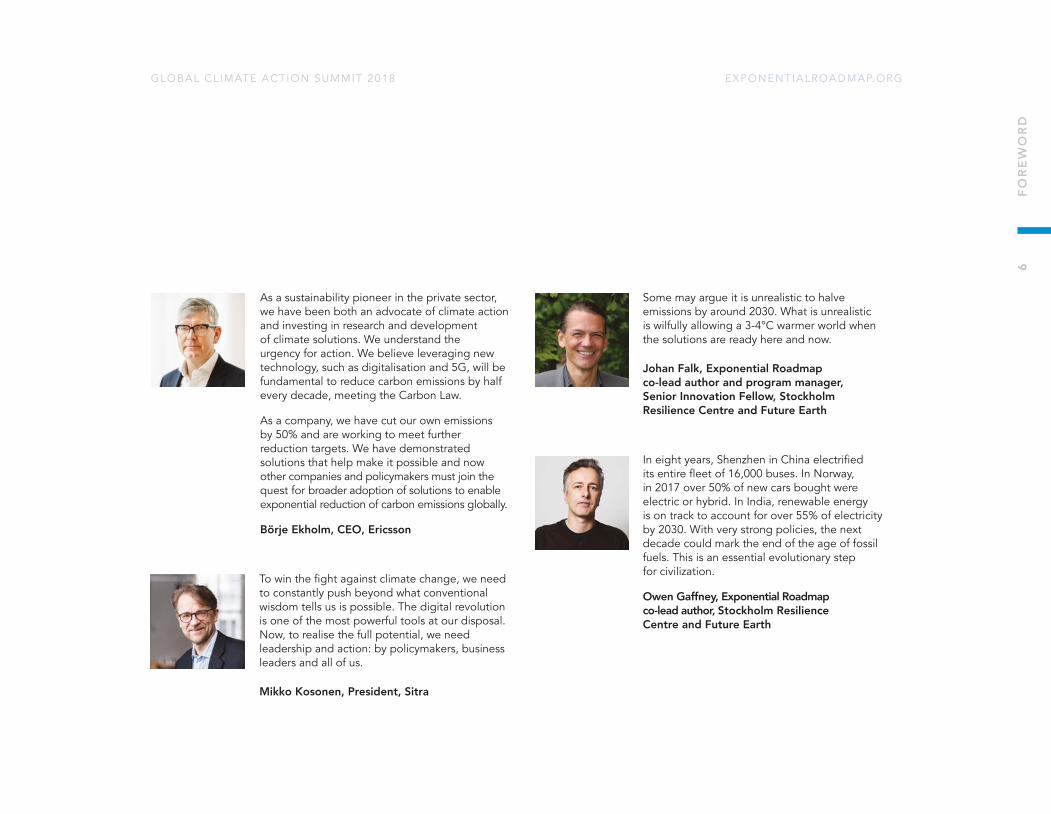
As a sustainability pioneer in the private sector, we have been both an advocate of climate action and investing in research and development of climate solutions. We understand the urgency for action. We believe leveraging new technology, such as digitalisation and 5G, will be fundamental to reduce carbon emissions by half every decade, meeting the Carbon Law.
As a company, we have cut our own emissions by 50% and are working to meet further reduction targets. We have demonstrated solutions that help make it possible and now other companies and policymakers must join the quest for broader adoption of solutions to enable exponential reduction of carbon emissions globally.
Börje Ekholm, CEO, Ericsson
Some may argue it is unrealistic to halve emissions by around 2030. What is unrealistic is wilfully allowing a 3-4°C warmer world when the solutions are ready here and now.
Johan Falk, Exponential Roadmap co-lead author and program manager, Senior Innovation Fellow, Stockholm Resilience Centre and Future Earth
In eight years, Shenzhen in China electrified its entire fleet of 16,000 buses. In Norway, in 2017 over 50% of new cars bought were electric or hybrid. In India, renewable energy is on track to account for over 55% of electricity by 2030. With very strong policies, the next decade could mark the end of the age of fossil fuels. This is an essential evolutionary step for civilization.
Owen Gaffney, Exponential Roadmap co-lead author, Stockholm Resilience Centre and Future Earth
To win the fight against climate change, we need to constantly push beyond what conventional wisdom tells us is possible. The digital revolution is one of the most powerful tools at our disposal. Now, to realise the full potential, we need leadership and action: by policymakers, business leaders and all of us.
Mikko Kosonen, President, Sitra

EXPONENTIALROADMAP.ORGGLOBAL CL IMATE ACTION SUMMIT 2018
EXECUTIVE SUMMARY The Exponential Climate Action Roadmap charts essential steps to 2030 to catalyse action at the speed and scale now required to combat climate change. It underpins the declarations to be announced at the Global Climate Action Summit, particularly the Step Up Declaration from climate leaders in business, and the Entrepreneurs Call to Action. The roadmap is supported by a digital Climate Action Dashboard – a tool now being used by Sweden to track progress towards a fossil-free economy by 2045.
1. Rapid Transformation is Essential• Playing with fire. In August 2018, an international team of researchers
re-emphasised that unmitigated greenhouse gas emissions increases risk of crossing Earth-system tipping points. This could cause a domino effect, where self-reinforcing cycles kick in that significantly amplify human-induced warming, potentially leading to a “Hothouse Earth” state.1
• Skin in the game. Climate change is already here and cities, businesses, citizens and governments are increasingly affected by it. For example, the 2018 northern hemisphere heatwave is likely to have been exacerbated by greenhouse gas emissions, according to early analyses.
• Peak and halve. The remaining carbon budget to pursue efforts to limit Earth’s temperature increase to 1.5°C, as outlined by the Paris Agreement, is vanishingly small and will be exhausted by 2030 at current emissions rates. Even aiming to limit temperature rise to well below 2°C will require unprecedented action in four areas:
– Greenhouse gas emissions peaking by 2020 at the latest, and approximately halving every decade afterwards in a trajectory known as the Global Carbon Law. This translates to around a 7% reduction per year. Many companies can reduce emissions significantly faster.
– Farming and other land use must stop expanding and adopt solutions to store carbon rather than emit it.
– Large-scale reforestation and forest, wetland and peatland management to protect the resilience of these vital systems.
– Develop and scale robust solutions for storing carbon safely.
• Don’t delay. Delaying action increases the humanitarian and economic cost and makes climate stabilisation more difficult. Every five-year delay before emissions peak could result in an additional 20 centimetre rise in sea-level in the future.2 Around 90% of urban areas lie on coasts and vulnerable deltas. Climate change is increasingly an existential threat to low-lying island states and many coastal populations. Infrastructure built between now and 2030 will largely determine whether the world can limit warming to well below 2°C.3
2. From Incremental to Exponential Action• Hitting the accelerator. The potential exists to reduce emissions
by about 70%, through rapid diffusion of existing technologies and behavioural change.4 This roadmap assumes the world reduces emissions by approximately 50% by 2030.
• Solutions exist in energy, industry, buildings, transport, food, and agriculture and forestry to halve emissions by 2030, but they must be accelerated to reach the necessary scale through climate leadership, policy and exponential technology.
7 E
XE
CU
TIV
E S
UM
MA
RY

EXPONENTIALROADMAP.ORGGLOBAL CL IMATE ACTION SUMMIT 2018
8 E
XE
CU
TIV
E S
UM
MA
RY
Energy supply• A 50% cut in global carbon dioxide emissions from electricity
generation by 2030 could become a reality if the current exponential trajectories of wind and solar installation continue. In order to cut energy sector (electricity and heat) emissions by half in 2030, solar needs to continue growing exponentially at a pace of 23% per year, or about half of the historical growth rates, meaning that this solution could potentially drive emissions down even faster – if investments ramp up. The exponential nature of these technologies should not be underestimated, particularly as prices continue to drop below conventional power in costs per unit of energy across regional markets.
• Trajectories for future energy use vary widely. While most anticipate
an increase in energy use, a recent scenario estimates that global final energy demand could fall 40% by 2050, compared with today, even though population, income and activities rise. Social and technological innovations are already scaling, for example, shared and ‘on-demand’ fleets of more energy-efficient electric vehicles could reduce global energy demand for transport by more than 50% by 2050 while reducing the number of vehicles on the road. 5
Transformative climate investments• Transformation of the global energy system does not need a major
increase in investments. But a pronounced reallocation of the investment portfolio is, however, inevitable. New investments in clean energy must significantly surpass fossil-fuel investments between 2020 and 2025.6
• Green bonds are on course to reach $1 trillion by 2021 and the divestment movement is accelerating with commitments to divest from investment funds with over $6 trillion under management.
Industry and production• Adopting circular-economy approaches has the potential to reduce
global emissions from industry by 45% by 2050.7 The world’s highest valued company, Apple, has announced a vision to be 100% circular.
• Heavy industries such as steel, aluminium, cement and plastic production can reduce emissions by 50% using current technologies and efficiencies.
• Consumer demand is increasingly mediated by technology, from E-commerce, social media, search engines, mobile devices and increasingly artificial intelligences like Siri and Alexa. In the next decade it is likely that many consumer purchases will increasingly be delegated to algorithms with significant potential to influence consumer behaviour related to greenhouse gas emissions.
Transport• Every 5 weeks, China adds a fleet of electric buses equivalent to
the entire London bus fleet – 9500 buses. Technologies are now market ready, societally acceptable and economically attractive to reduce greenhouse gas emissions from transport by 51% by 2030, through electric vehicles, mass transit and adapting the global shipping fleet. A complete global and technological shift to electric vehicles now looks very likely and, given recent announcements from cities, countries and car manufacturers, is possible between 2020 and 2030. However, the transformation will slow dramatically without strong national and city policies, for example setting target dates to ban internal combustion engines.
EXPONENTIALROADMAP.ORGGLOBAL CL IMATE ACTION SUMMIT 2018
Reduced food waste
Plant-based diet
Composting
2020Current emissions
2030First halving
Ann
ual e
mis
sion
s (%
)
50
Sustainable agricultureAgroforestryPrecision agricultureFarmland restorationForest managementPeatlands and wetlands
2020Current emissions
2030First halving
Ann
ual e
mis
sion
s (%
)
50
Digital automation
Retrofitting
Low-carbonheating and coolingLow-carbonconstruction
2020Current emissions
2030First halving
Ann
ual e
mis
sion
s (%
)
50
ENERGY SUPPLY INDUSTRY BUILDINGS
Solar photovoltaicsConcentrated solar powerWind powerReduced methane emissionsGrid flexibility and storageOther low-carbon energy
2020Current emissions
2030First halving
Ann
ual e
mis
sion
s (%
)
50
Circular economy
Supply side efficienciesRefrigerant management
2020Current emissions
2030First halving
Ann
ual e
mis
sion
s (%
)2525 25
7575 75
50
TRANSPORT FOOD CONSUMPTION AGRICULTURE AND FORESTRY
Mass transitBikesElectric vehiclesMobility and accessibilityReduced air transportEfficient shippingRemote work and meetingsLow-emission trucks
2020Current emissions
2030First halving
Ann
ual e
mis
sion
s (%
)
25 2525
75 7575
50
18.2
9.1
16.9
7.9
9.7
4.6
8.4
4.1
5.6
3.1
6.6
3.2
ENERGY’S OWN EMISSIONS BUILDINGS TRANSPORT FOOD
CONSUMPTIONAGRICULTURE &
FORESTRYINDUSTRY
5.9 9.7 8.4 5.6 6.616.9
5.9 6.135.29 0.16 0.32 0.33
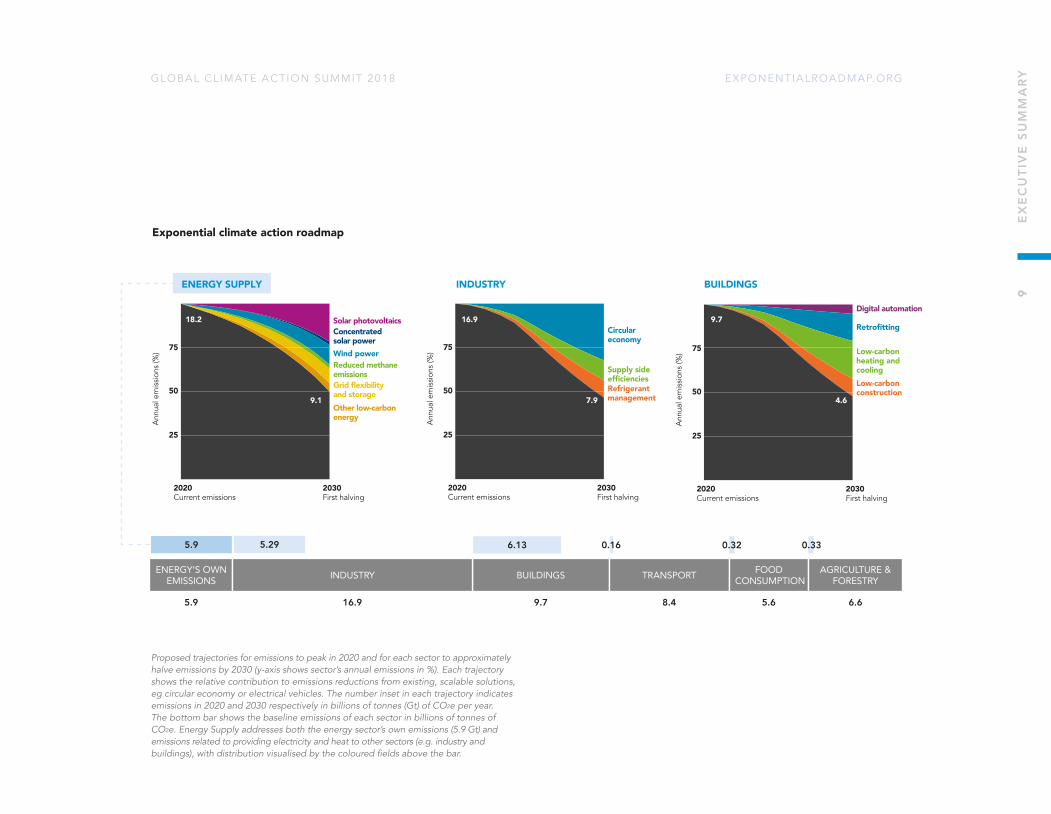
Proposed trajectories for emissions to peak in 2020 and for each sector to approximately halve emissions by 2030 (y-axis shows sector’s annual emissions in %). Each trajectory shows the relative contribution to emissions reductions from existing, scalable solutions, eg circular economy or electrical vehicles. The number inset in each trajectory indicates emissions in 2020 and 2030 respectively in billions of tonnes (Gt) of CO2e per year. The bottom bar shows the baseline emissions of each sector in billions of tonnes of CO2e. Energy Supply addresses both the energy sector’s own emissions (5.9 Gt) and emissions related to providing electricity and heat to other sectors (e.g. industry and buildings), with distribution visualised by the coloured fields above the bar.
Exponential climate action roadmap
9 E
XE
CU
TIV
E S
UM
MA
RY

EXPONENTIALROADMAP.ORGGLOBAL CL IMATE ACTION SUMMIT 2018
10
EX
EC
UTI
VE
SU
MM
AR
Y
Food consumption• Reducing food waste and dietary shifts of billions of people away from
high-fat, high-meat consumption towards healthier plant-based diets will reduce emissions. China has announced a target to halve meat consumption by 2030. France and other countries have outlawed food waste from supermarkets. Moreover, the food sector is facing immediate disruption by digitalisation. This offers a unique window of opportunity for digitalisation to support rapid dietary transformation towards lower meat consumption.
Agriculture and forestry • Effective forest management is one of the highest priorities to
attempt to stabilise the climate and provides many other economic and ecological benefits. There are significant opportunities to take great strides in the next decade, learning from, for example, China’s reforestation revolution. The roadmap outlines several key forest management solutions that have the potential to support the planting of tens of billions of trees to help halve emissions in this sector. Technologies can accelerate action – from digital online tools such as Global Forest Watch which improves transparency, to seed-planting drones – one company claims drones could plant 100,000 trees a day.
• Precision agriculture for water and fertiliser use, combined with behavioural change for farmers (for example, by keeping crop residue on land or reducing tilling of soil), offers essential solutions to contribute to halving greenhouse gas emissions from agriculture.
Reduced food waste
Plant-based diet
Composting
2020Current emissions
2030First halving
Ann
ual e
mis
sion
s (%
)
50
Sustainable agricultureAgroforestryPrecision agricultureFarmland restorationForest managementPeatlands and wetlands
2020Current emissions
2030First halving
Ann
ual e
mis
sion
s (%
)
50
Digital automation
Retrofitting
Low-carbonheating and coolingLow-carbonconstruction
2020Current emissions
2030First halving
Ann
ual e
mis
sion
s (%
)
50
ENERGY SUPPLY INDUSTRY BUILDINGS
Solar photovoltaicsConcentrated solar powerWind powerReduced methane emissionsGrid flexibility and storageOther low-carbon energy
2020Current emissions
2030First halving
Ann
ual e
mis
sion
s (%
)50
Circular economy
Supply side efficienciesRefrigerant management
2020Current emissions
2030First halving
Ann
ual e
mis
sion
s (%
)
2525 25
7575 75
50
TRANSPORT FOOD CONSUMPTION AGRICULTURE AND FORESTRY
Mass transitBikesElectric vehiclesMobility and accessibilityReduced air transportEfficient shippingRemote work and meetingsLow-emission trucks
2020Current emissions
2030First halving
Ann
ual e
mis
sion
s (%
)
25 2525
75 7575
50
18.2
9.1
16.9
7.9
9.7
4.6
8.4
4.1
5.6
3.1
6.6
3.2
EXPONENTIALROADMAP.ORGGLOBAL CL IMATE ACTION SUMMIT 2018
3. Creating unstoppable momentumThere are strong reasons to be optimistic that the economic transition can happen much faster than many have predicted. Three forces are aligning that can push the global economy towards a tipping point.
• Political momentum. Emissions have peaked in 49 countries (40% of global greenhouse gas emissions) and 10 countries have announced plans to become carbon neutral by 2050. 9,138 cities have committed to the Global Covenant of Mayors for climate and energy representing 10% of the global population. 430 companies have committed to science-based targets for reducing greenhouse gas emissions.
• Market forces. If current diffusion rates of renewable energy technology continue into the 2020s, the sudden drop in demand for fossil fuels before 2030 will create “stranded assets” – worthless pipelines, coal mines and oil wells – which could lead to losses on the scale of trillions of dollars by 2035. China and parts of Europe importing fossil fuels stand to benefit most from the bursting carbon bubble, while the US, Canada, Russia and others stand to lose an estimated $4 trillion if climate action falters now and so requiring stronger policies later to avoid catastrophes.8
• The digital revolution. The digital revolution may well be the biggest wildcard in the economic transformation. It has already disrupted many sectors and artificial intelligence (AI), cloud computing and the internet of things (IoT) are poised to create further disruption in the next decade – the very time disruption is needed most. Artificial intelligence, for example, is projected to contribute up to $15.7 trillion to the global economy by 2030.
Beyond coming innovations, online technologies influence the decisions of three billion people daily through E-commerce, search and social media and are at the heart of business and investor decisions. These existing technologies and the companies behind them have the potential to influence whether we live on a 1.5-2°C planet, or a +3°C world.
4. Reality checkDespite this momentum, emissions growth returned in 2017. Past energy transitions have taken at least 60 years and investment in fossil-fuel infrastructure continues. Moreover, beyond electricity generation, progress is sluggish or non-existent in other parts of the economy: food systems, industry, buildings and transport. And, while the digital revolution has created the modern world, it has yet to deliver on its potential to dent overall emissions. The climate commitments made by a vast majority of companies, cities and nations remain too weak, and the pace of change is too slow to meet the Paris agreement.
ConclusionsThis roadmap shows the speed and scale of transformation required to meet the Paris Agreement. It homes in on the immediate priorities necessary to make rapid progress towards halving emissions sometime around 2030.
This goal will not be easy. It is nothing short of a global economic transformation. But transformation appears assured through revolutions driven by digitalisation. Harnessing this power will help drive unstoppable momentum. If successful, we are at the start of one of the most exciting and dramatic changes in human history.
11
EX
EC
UTI
VE
SU
MM
AR
Y
EXPONENTIALROADMAP.ORGGLOBAL CL IMATE ACTION SUMMIT 2018
EIGHT GAME-CHANGING STRATEGIES
The world is on the verge of a tipping point. The analysis presented here confirms it is necessary, desirable and achievable to halve greenhouse gas emissions by 2030 in every sector of the economy with existing technologies, and momentum is growing. But crossing the tipping point will require large-scale behavioural change driven by greater climate leadership, stronger policies and the application of exponential technologies. By exponential technologies we mean both technologies and business models that are designed to reach a global scale rapidly – within a decade. Aligning their disruptive capability with climate goals will be crucial.
Here we propose strategies that aim to overcome the most significant obstacles in the next 12-18 months.
Policy1. Establish the following fast-track task forces to:
– Build immediate momentum to remove fossil-fuel subsidies.
– Incentivise carbon pricing instruments and effective emissions standards in the largest economies.
– Incentivise policy to catalyse large-scale behavioural change relating to production and consumption (businesses and consumers).
– Incentivise large-scale reforestation, forest management and agricultural changes to secure sustained resilience of key biomes in an integrated climate action agenda.
Climate Leadership2. Incentivise rapid adoption of combined digital, circular and sharing
economies in the largest economies.
3. Increase ambition:
– To attract more cities and businesses to climate action movements.
– And set stronger short-term and long-term emissions targets within these movements.
4. Establish executive leadership programmes on global sustainability in the boardrooms of all of the world’s leading companies by 2020.
5. Establish global sustainability programmes on the syllabus of every university course in every country by 2020.
Technology Leadership6. Launch an accelerator to align the digital revolution with the goal
to halve emissions rapidly. Such an accelerator can:
– Support development of exponential roadmaps for industries, businesses, cities, regions and nations.
– Support scale-up of circular economy business models to reduce material and energy use.
– And, given many decisions and actions are mediated through digital tools, create solutions that remove friction to climate action and make emissions reduction the easy, attractive, default choice for businesses and consumers.
7. Establish a global accelerator network connecting hundreds of thousands of entrepreneurs with the common goal of halving emissions every decade or faster. This accelerator should enable unprecedented exchange between accelerators and best practice learning across borders.
8. Establish a global marketplace to invest in, support and scale up the most promising exponential technologies and business models with very significant positive climate impact. Do not exploit technology and business models with negative climate impact.
12
EX
EC
UTI
VE
SU
MM
AR
Y
EXPONENTIALROADMAP.ORGGLOBAL CL IMATE ACTION SUMMIT 2018
ABOUT THIS REPORT Global Climate Action Summit The Global Climate Action Summit (12–14 September 2018, San Francisco) has been designed to create the momentum to move from incremental to exponential action on climate and rapidly scale solutions for a clean energy future. It will be a launchpad for deeper worldwide commitments and accelerated action from countries – supported by all sectors of society – that can put the globe on track to prevent dangerous climate change and realise the Paris Agreement.
This Exponential Climate Action Roadmap was produced between April and August 2018 for the summit. The roadmap is based on a recent analysis showing that peaking emissions around 2020 or before, and approximately halving annual emissions every decade to 2050 is consistent with the Paris Agreement on climate. This trajectory has been called the Carbon Law.1
This report explores how the Carbon Law can be implemented across all key sectors of the global economy. While the end goal is in 2050, it focuses on the road to 2030 – the first halving – and concludes that while solutions exist, the scale of transformation will require systems-wide action accelerated by climate leadership, much stronger policy and exponential technologies.
The roadmap is a Minimum Viable Product (MVP) developed using agile methodology. As a MVP, the roadmap will require ongoing and rapid iteration following feedback, new evidence and better information. Indeed, in the coming months new reports from the Intergovernmental Panel on Climate Change and the EAT-Lancet Commission, for example, may further refine solutions and trajectories.
Data and analysisThe report takes a backcasting, rather than forecasting, approach. It looks to approximately where the world needs to be in 2050 and works backwards to estimate the journey that might take the economy to this destination, then focuses on the first step to 2030. But it marries this with current data and trends, for example on exponential growth of photovoltaics and wind power.
The trajectory for this report is based on the Global Carbon Law – A Roadmap For Rapid Decarbonization, published in the journal Science in 20171 – plus other supporting research. The solutions database is drawn from Project Drawdown, also published in 20172 and research and reports from the the Finnish future fund Sitra, Roadmaps for Fossil Free Sweden competitiveness (Fossilfritt Sverige), International Energy Agency (IEA) and the World Wide Fund for Nature (WWF) Climate Solver and Sustainia 100. You can find a full description of the methodology and assumptions used to create the trajectories found in this report online at www.exponentialroadmap.org.
About the assumptions in this reportThe world is currently emitting as much as 53 billion tonnes (Gt) of CO2 equivalents per year, which we use as our baseline. These 53 Gt are distributed between the sectors addressed in the report, as described in the diagram on page 10. Our basic principle is that we allocate emissions to one sector and address it in this sector, for instance, emissions from gasoline combustion in cars is allocated to only the transport sector. However, in the case of energy, both demand and supply solutions are very important so emissions from electricity and heat are addressed in both the supply sector and demand sectors and emissions are distributed accordingly. This means that if all sectors, both those on the demand side and those on the supply side, achieve 50% reductions the overall reduction of emissions will be greater than 50%.
13
AB
OU
T TH
IS R
EP
OR
T
EXPONENTIALROADMAP.ORGGLOBAL CL IMATE ACTION SUMMIT 2018
14
AB
OU
T TH
IS R
EP
OR
T
A “Digital First” RoadmapWe want to make all the data from the roadmap available and interoperable with other roadmaps and planning tools. The roadmap introduces a new digital tool to track progress against the roadmap. The tool, developed by MapLauncher, is already being used by the Swedish government to map policy and action to reach a fossil fuel free economy by 2045. We have adapted the tool to track against what we call the Carbon Law trajectory of halving emissions every decade. For more information see the final chapter of the report.
Authors and Production TeamThis is co-designed report. We have put together a multidisciplinary team – from energy specialists, ICT analysts and urban researchers to exponential strategists, journalists, editors, designers and data visualisers.
This report is a first attempt to explore a method to operationalise Carbon Law trajectories. As such, values and models, including allocation between supply and demand side solutions, will be continuously updated based on new research, methods and data. We encourage any analysis to accelerate this process.
EXPONENTIALROADMAP.ORGGLOBAL CL IMATE ACTION SUMMIT 2018
HALVING EMISSIONS BY 2030 Human activities are causing Earth to heat up rapidly – at a rate of about 0.17°C per decade. The planet has warmed about 1°C (or about 1.8°F) since the start of the industrial revolution. This is the warmest period on Earth since the last Ice Age. There is no evidence that these changes are natural – instead, they are caused by greenhouse gases from industrial emissions rapidly building up in Earth’s atmosphere. Some of these gases will remain there for hundreds and thousands of years even if all human greenhouse gas emissions stopped tomorrow.
Agriculture and then civilization only emerged once the climate had settled into an unusual period of relative stability that has now lasted over 10,000 years – a period geologists call the Holocene. Research shows this relative stability could have been expected to last a further 50,000 years, but it’s now at risk.1 Since the 1950s, the rate of change of the Earth’s climate system, its life support system, has begun to accelerate. This uncontrolled experiment is unlikely to be conducive to long-term growth and development of a technologically advanced civilisation.2,3,4,5
What is the likelihood of a warming climate causing Earth feedbacks where forests die and decompose, pouring carbon into the atmosphere, and summer sea ice in the Arctic dwindles, exacerbating warming? Beyond 1°C, these risks rise. Besides these risks, rising sea levels present an existential threat to small islands and many coastal populations and droughts and heatwaves, such as the unprecedented northern hemisphere heatwave of 2018, are expected to become more common.
The Carbon BudgetIn 2015, nations successfully negotiated the Paris Agreement to protect people and the planet. This provides a political framework for action on climate and, to date, 178 countries have ratified the agreement. The agreement calls for action to keep global average temperature “well below 2°C above pre-industrial levels and to pursue efforts to limit the temperature increase even further to 1.5°C”.
For just a 50% chance of making the 1.5°C target, the remaining global carbon budget is about 400 billion tonnes of carbon dioxide from 2020 onwards6 (one billion tonnes is one Gigatonne or Gt). Going beyond this carbon budget will require pulling vast quantities of carbon dioxide out of the atmosphere to balance the budget. Some research groups suggest the budget may be even lower than this, others suggest it is a little higher*. The world currently emits about 400 Gt of carbon dioxide every decade. So it is likely the world will overshoot this target and therefore, in addition to reducing emissions to around zero, the world will need to draw carbon dioxide out of the atmosphere at scale to meet the Paris Agreement. This will take immediate, massive, globally-coordinated action.
From 2020, for just a 66% chance of keeping global temperatures below 2°C, the world economy has a remaining carbon budget of about 680 billion tonnes of carbon dioxide that it can emit to the atmosphere. More optimistic scenarios suggest 800 billion tonnes 7,8 or more, but even with a larger budget, with 400 billion tonnes emitted every decade, this only marginally reduces the risks of overshoot – even with dramatic emissions declines.
* In October 2018, the Intergovernmental Panel on Climate Change will publish a special report on 1.5 degrees that assesses the latest academic literature relating to carbon budgets consistent with a 1.5°C climate target. The budgets provided in this report may require updating accordingly.
15
HA
LVIN
G E
MIS
SIO
NS
BY
203
0
EXPONENTIALROADMAP.ORGGLOBAL CL IMATE ACTION SUMMIT 2018
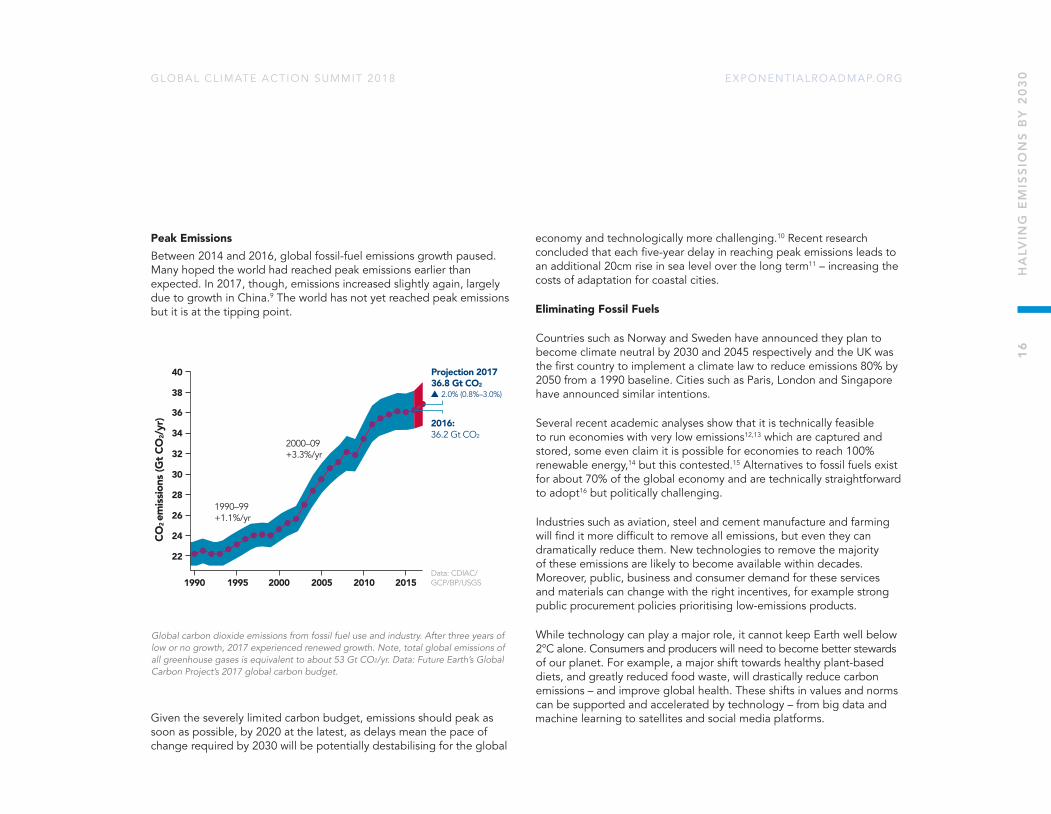
Peak EmissionsBetween 2014 and 2016, global fossil-fuel emissions growth paused. Many hoped the world had reached peak emissions earlier than expected. In 2017, though, emissions increased slightly again, largely due to growth in China.9 The world has not yet reached peak emissions but it is at the tipping point.
Given the severely limited carbon budget, emissions should peak as soon as possible, by 2020 at the latest, as delays mean the pace of change required by 2030 will be potentially destabilising for the global
economy and technologically more challenging.10 Recent research concluded that each five-year delay in reaching peak emissions leads to an additional 20cm rise in sea level over the long term11 – increasing the costs of adaptation for coastal cities.
Eliminating Fossil Fuels
Countries such as Norway and Sweden have announced they plan to become climate neutral by 2030 and 2045 respectively and the UK was the first country to implement a climate law to reduce emissions 80% by 2050 from a 1990 baseline. Cities such as Paris, London and Singapore have announced similar intentions.
Several recent academic analyses show that it is technically feasible to run economies with very low emissions12,13 which are captured and stored, some even claim it is possible for economies to reach 100% renewable energy,14 but this contested.15 Alternatives to fossil fuels exist for about 70% of the global economy and are technically straightforward to adopt16 but politically challenging.
Industries such as aviation, steel and cement manufacture and farming will find it more difficult to remove all emissions, but even they can dramatically reduce them. New technologies to remove the majority of these emissions are likely to become available within decades. Moreover, public, business and consumer demand for these services and materials can change with the right incentives, for example strong public procurement policies prioritising low-emissions products.
While technology can play a major role, it cannot keep Earth well below 2°C alone. Consumers and producers will need to become better stewards of our planet. For example, a major shift towards healthy plant-based diets, and greatly reduced food waste, will drastically reduce carbon emissions – and improve global health. These shifts in values and norms can be supported and accelerated by technology – from big data and machine learning to satellites and social media platforms.
1990
22
24
26
CO2 em
issio
ns (G
t CO
2/yr
)
Data: CDIAC/GCP/BP/USGS
28
30
32
34
36
38
40
1995 2000 2005 2010 2015
Projection 201736.8 Gt CO2
2.0% (0.8%–3.0%)
2016:36.2 Gt CO2
2000–09+3.3%/yr
1990–99+1.1%/yr
Global carbon dioxide emissions from fossil fuel use and industry. After three years of low or no growth, 2017 experienced renewed growth. Note, total global emissions of all greenhouse gases is equivalent to about 53 Gt CO2/yr. Data: Future Earth’s Global Carbon Project’s 2017 global carbon budget.
16
HA
LVIN
G E
MIS
SIO
NS
BY
203
0

EXPONENTIALROADMAP.ORGGLOBAL CL IMATE ACTION SUMMIT 2018
Speed and scale: a Carbon LawUntil recently, almost all computer-generated economic scenarios for a 2°C world (or lower) assumed a slow energy transition resulting in the world busting the carbon budget then removing carbon dioxide from the atmosphere on a colossal scale to rein in the overshoot of emissions. But in recent years these assumptions have been questioned. Can the world really capture such colossal volumes of carbon dioxide and store it for cenutries or millenia? And what are the risks to the planet of this overshoot – for biodiversity, for climate tipping points, for societies? The numbers are in and they don’t look good – negative emissions at the required scales may not be feasible economically, politically, technically or ecologically.
Others have argued the world should wait for the arrival of a single brilliant “unicorn” technology, like nuclear fusion, which will solve all problems quickly and cheaply. This scenario has also been studied in detail and it turns out to be the wrong horse to back. If the technology fails to materialise, or can’t scale, the cost of switching strategy towards roll out of existing technologies faster becomes prohibitively expensive and potentially destabilising for the global economy.17
Which leaves one remaining option: transitioning faster. Research shows that as a rule of thumb, halving emissions of greenhouse gases every decade is consistent with meeting the Paris Agreement. We have called this ambitious but plausible exponential scenario the “Carbon Law” in reference to Moore’s Law in the technology sector.18 Even though this trajectory is not sufficient for the 1.5°C limit and does not remove all risk of crossing the 2°C limit, it sets us off on the right track.
This Carbon Law framing is useful because:
• It applies at all scales – global, national, city, company, individual.
• It is aligned with the Paris Agreement.
• It turns a long-term goal into a near-term target – halve annual emissions in the next decade.
• Those with the biggest carbon footprint have to do most in the short term.
• Some industry sectors and companies can go much faster.
Halving emissions every decade is consistent with meeting the Paris Agreement on climate. Solutions need to go beyond primary energy and reach in to industry, transport, buildings, food, agriculture and forestry.
2020Currentemissions
2030First halving
2040Second halving
2050Third halving
Solution D
Solution C
Solution B
Solution A
17
HA
LVIN
G E
MIS
SIO
NS
BY
203
0
EXPONENTIALROADMAP.ORGGLOBAL CL IMATE ACTION SUMMIT 2018
History Need Not Repeat ItselfThe Carbon Law provides a pace and scale of emissions reductions consistent with the goal of the Paris Agreement – but, while many companies can reduce emissions faster than this, as shown in this report, it is at odds with economic and political reality. Historically, energy transitions have taken about 60 years for a new technology to reach 20% of the market. Vaclav Smil, one of the world’s foremost energy analysts, uses this data to pour cold water on those who are overly optimistic about the world’s chances of making a swift energy transition.19
While scalable solutions exist, key roadblocks that prevent the world from transitioning faster are largely political. But it is worth noting the renewable energy transition started at least two decades ago and renewable electricity capacity is doubling every 5.5 years. This exponential pace, if kept up, has the potential to transform the electricity sector on the scale required to meet the Paris Agreement targets by 2050.
By aiming to halve annual emissions each decade, starting with 2020-2030, we can not only retain our existing standards of living – brought to many through fossil fuels – but markedly improve them with co-benefits such as better health, cleaner cities and economic growth that an energy transition would bring. We have a real opportunity to transform the world for the better. Let’s take it.
18
HA
LVIN
G E
MIS
SIO
NS
BY
203
0
ENERGY SUPPLY
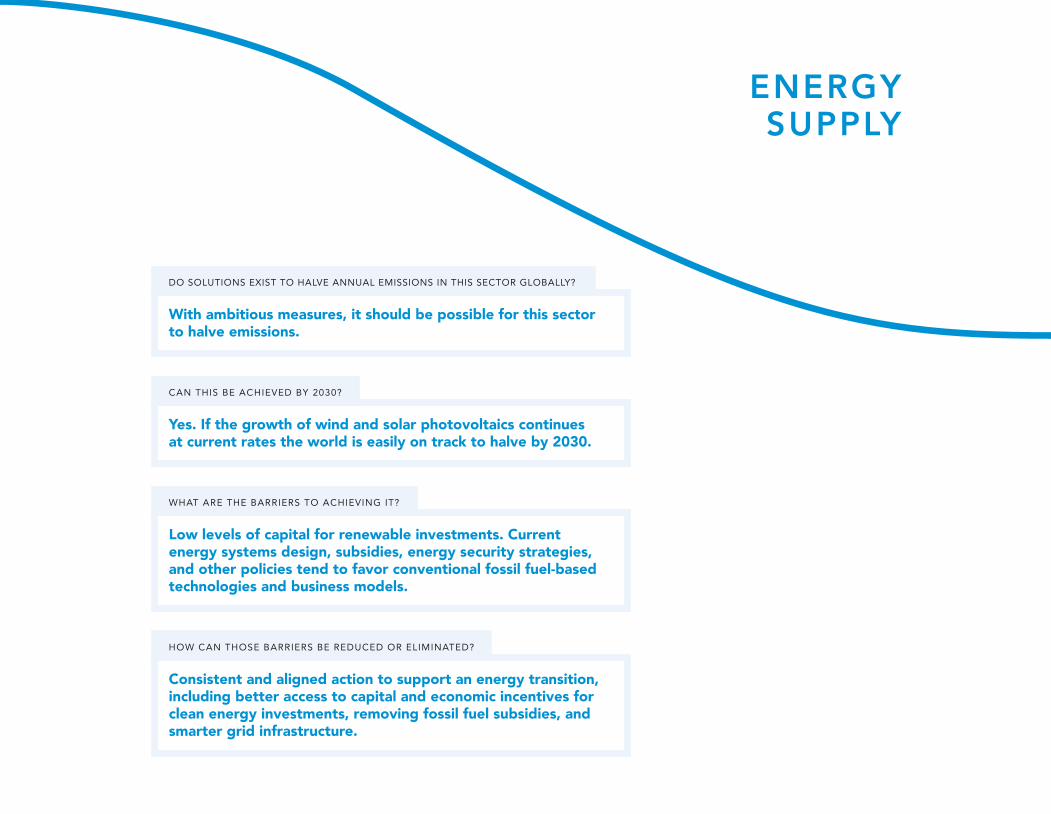
Yes. If the growth of wind and solar photovoltaics continues at current rates the world is easily on track to halve by 2030.
CAN THIS BE ACHIEVED BY 2030?
Low levels of capital for renewable investments. Current energy systems design, subsidies, energy security strategies, and other policies tend to favor conventional fossil fuel-based technologies and business models.
WHAT ARE THE BARRIERS TO ACHIEVING IT?
Consistent and aligned action to support an energy transition, including better access to capital and economic incentives for clean energy investments, removing fossil fuel subsidies, and smarter grid infrastructure.
HOW CAN THOSE BARRIERS BE REDUCED OR ELIMINATED?
With ambitious measures, it should be possible for this sector to halve emissions.
DO SOLUTIONS EXIST TO HALVE ANNUAL EMISSIONS IN THIS SECTOR GLOBALLY?

EXPONENTIALROADMAP.ORGGLOBAL CL IMATE ACTION SUMMIT 2018
CURRENT S ITUATION
Energy use is responsible for about 60% of global greenhouse gas emissions, with 32 Gt of annual CO2 emissions, plus 3.3 Gt of CO2 equivalent emissions (CO2e) from other greenhouse gases.1 This chapter addresses the 18.2 Gt CO2e per year that the sector can directly influence, which is 34% of total global emissions. These comprise 12.3 Gt direct emissions from electricity and heat production, and 5.9 Gt of the sector’s own emissions associated mainly with extraction, refineries, and distribution of fossil fuels. The 17 Gt of emissions from fuel use in other sectors, such as gasoline use in cars or coal in industry, are not included here but covered in other sectors. In 2017, energy sector emissions grew 1.6%, with a mean growth of 1.1% per year in the last decade.2
After being relatively constant for decades, CO2 intensity of electricity has decreased sharply over the last few years due to growth of gas power and renewable energy. The International Renewable Energy Agency projects that, with current policies and commitments, CO2 from energy will increase to ~ 35 Gt/yr by 2020 and remain at this level to 2050.
TRAJECTORY
Solar photovoltaics
Concentrated solar power
Wind power
Reduced methane emissions
Grid flexibility and storage
Other low-carbon energy
2020Current emissions
2030First halving
Ann
ual e
mis
sion
s (%
)
75
50
25
Estimated 50% reduction of annual emissions achieved for energy supply sector by 2030.
The halving described in this chapter targets the energy supply sector’s own emissions, as well as the emissions from producing heat and power. Blue fields show the scale of emissions addressed in this chapter – in total 18.2 billion tons of CO2 equivalents per year. The fields also show how emissions from heat and power can be attributed to the sectors that demand these services.
ENERGY’S OWN EMISSIONS BUILDINGS TRANSPORT FOOD
CONSUMPTIONAGRICULTURE &
FORESTRYINDUSTRY
5.9 9.7 8.4 5.6 6.616.9
5.9 6.135.29 0.16 0.32 0.33
20
EN
ER
GY
SU
PP
LY

EXPONENTIALROADMAP.ORGGLOBAL CL IMATE ACTION SUMMIT 2018
SOLUTIONS FOR FIRST HALVING
For the energy sector, the solutions to halve emissions by 2030 are available and a transition has already begun. The solutions described here focus on energy supply (i.e. extraction, conversion and distribution), as solutions to reduce energy demand are mainly covered in other sectors. The halving in this chapter refers to emissions generated directly by the energy sector. That represents extraction, refineries and distribution of fossil fuels (5.9 Gt) and the generation of electricity and heat (12.3 Gt). Hence, in total 18.2 Gt CO2e per year.
In addition, this chapter focuses mainly on strategies that can be scaled rapidly, suggesting five solutions that can be expected to play a major role. Other technology options are included in the trajectories as “other low-carbon energy”.
It’s worth noting that energy availability is unevenly distributed. There are almost a billion people who lack access to electricity,3 while 3.3 million people die prematurely each year from outdoor air pollution – mainly as a result of the burning of fossil fuels.4,5 Providing everyone with access to clean energy is one of the UN Sustainable Development Goals. Even though constant progress is being made, the current trajectory is that this goal will not be met by 2030.
Solar Photovoltaics (PV)Sunlight provides 885 million terawatt hours (TWh) of energy to our planet every year – about 6,000 times our current energy consumption. Solar PV uses the physical properties of materials to convert this sunlight to electricity. It is applied either off-grid (on rooftops or local energy systems), or on-grid (as grid-connected rooftop installations or large-scale solar parks). The maximum realistic supply that could be delivered from solar energy is somewhere between 50,000 and 400,000 TWh.6
Photovoltaics has strong exponential characteristics in terms of cost reductions and capacity growth. Global installed solar PV has expanded from 0.8 gigawatts (GW) in the year 2000 to 385 GW in 2017, with the highest relative growth – almost 80% in a year – in 2011.7 Global growth has slowed down to just below 30% per year in the last two years, with slower growth in the EU, but China and Japan have stepped in as the new major players and surpassed Germany in 2014 as leaders in installed capacity.8
To contribute to the 2030 goals for the energy supply sector, we estimate that solar needs to continue growing exponentially at a pace of 23% per year, reaching ~6,000 TWh/yr and reducing emissions in the sector by 3.8 Gt/yr in 2030. This rate represents less than half of historical growth rates, meaning that this solution could potentially drive emissions down even faster if the funding and policy situation is supportive.
Solar Photovoltaics in India
India has used strong policy and fi nancial incentives to rapidly increase its commitment to solar energy in the past decade.
In 2017, 40% of all new electricity capacity came from solar.
21
EN
ER
GY
SU
PP
LY
EXPONENTIALROADMAP.ORGGLOBAL CL IMATE ACTION SUMMIT 2018
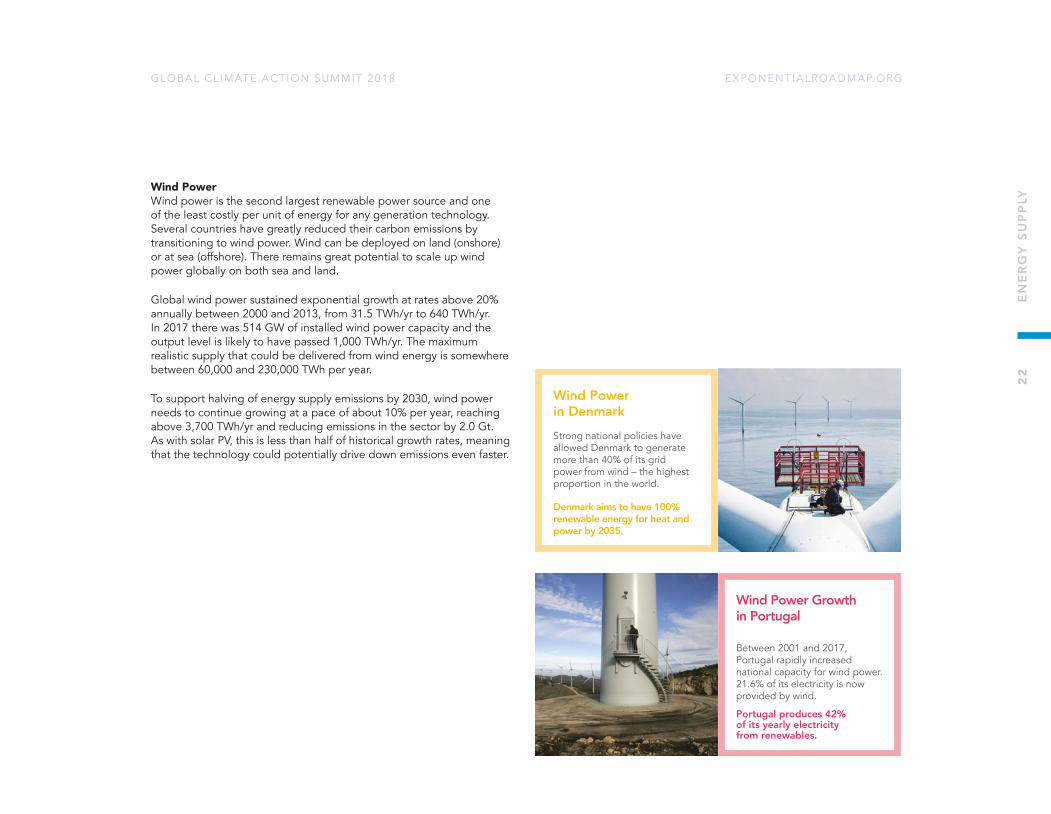
Wind Power Wind power is the second largest renewable power source and one of the least costly per unit of energy for any generation technology. Several countries have greatly reduced their carbon emissions by transitioning to wind power. Wind can be deployed on land (onshore) or at sea (offshore). There remains great potential to scale up wind power globally on both sea and land.
Global wind power sustained exponential growth at rates above 20% annually between 2000 and 2013, from 31.5 TWh/yr to 640 TWh/yr. In 2017 there was 514 GW of installed wind power capacity and the output level is likely to have passed 1,000 TWh/yr. The maximum realistic supply that could be delivered from wind energy is somewhere between 60,000 and 230,000 TWh per year.
To support halving of energy supply emissions by 2030, wind power needs to continue growing at a pace of about 10% per year, reaching above 3,700 TWh/yr and reducing emissions in the sector by 2.0 Gt. As with solar PV, this is less than half of historical growth rates, meaning that the technology could potentially drive down emissions even faster.
Wind Power in Denmark Strong national policies have allowed Denmark to generate more than 40% of its grid power from wind – the highest proportion in the world.
Denmark aims to have 100% renewable energy for heat and power by 2035.
Wind Power Growth in Portugal
Between 2001 and 2017, Portugal rapidly increased national capacity for wind power. 21.6% of its electricity is now provided by wind.
Portugal produces 42% of its yearly electricity from renewables.
22
EN
ER
GY
SU
PP
LY
EXPONENTIALROADMAP.ORGGLOBAL CL IMATE ACTION SUMMIT 2018
Concentrated Solar Power (CSP)Concentrated solar power works in a different way to solar photovoltaics. It functions by using mirrors or lenses to focus a large area of sunlight on a small receiver. The heat generated is then used to drive a turbine or engine. Unlike photovoltaics it only works in direct sunlight, and so is mainly used in arid regions. One advantage of CSP, however, is that it can collect and save heat energy, and use it to produce power at night. These plants are therefore able to balance out daily fluctuations in the energy system and complement solar PV.
CSP grew on average ~60% per year between 2009 and 2014,9 mainly due to incentive schemes in Spain, the US, and Italy. The withdrawal of some of these schemes, together with competition from solar PV – which has a lower cost per installed capacity and energy produced,10 has driven investors away and caused the cumulative capacity of CSP to flatline.
In order for CSP to contribute a significant portion of renewable energy production, this must change. The analysis in this report assumes a scenario where CSP continues slow linear growth until new policies come in around 2020, and then exponential growth of 40% per year until 2030. This contributes to a reduction of CO2e in the sector by 0.4 Gt/yr in 2030, not including the service provided to the energy system through energy storage. In most future scenarios, except those where PV and battery technologies both decrease in cost extremely fast, CSP is needed as an important technology for grid balancing.11
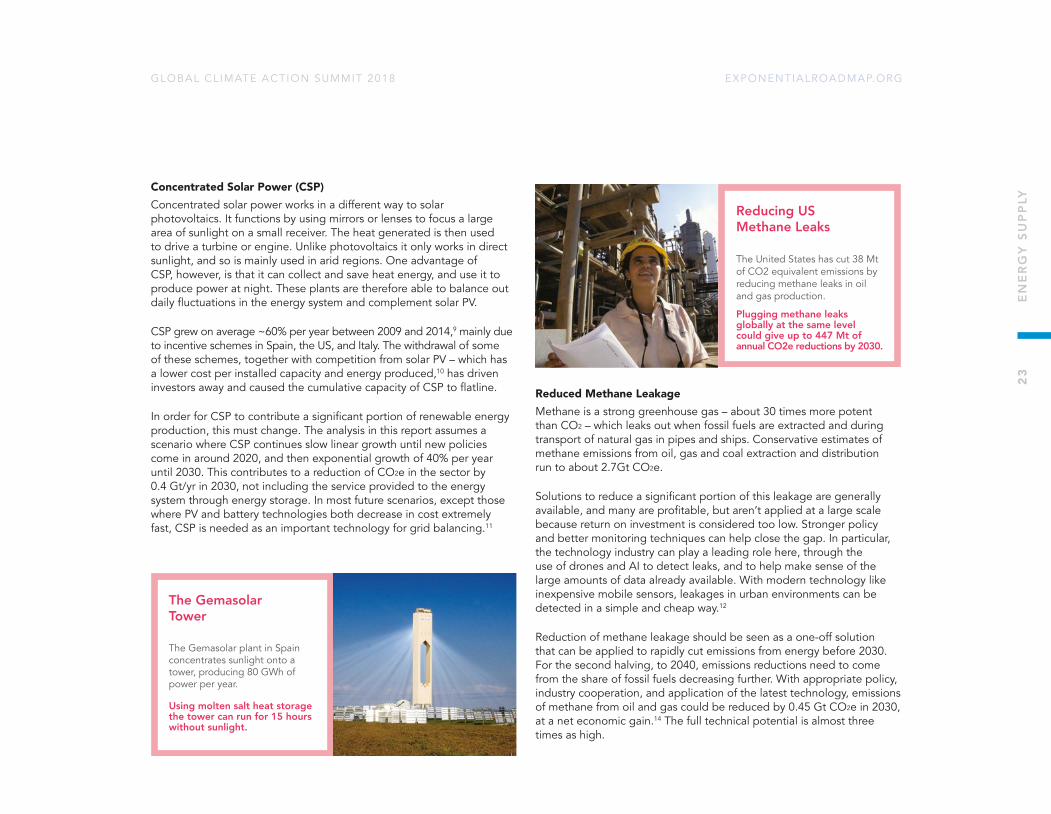
Reduced Methane LeakageMethane is a strong greenhouse gas – about 30 times more potent than CO2 – which leaks out when fossil fuels are extracted and during transport of natural gas in pipes and ships. Conservative estimates of methane emissions from oil, gas and coal extraction and distribution run to about 2.7Gt CO2e.
Solutions to reduce a significant portion of this leakage are generally available, and many are profitable, but aren’t applied at a large scale because return on investment is considered too low. Stronger policy and better monitoring techniques can help close the gap. In particular, the technology industry can play a leading role here, through the use of drones and AI to detect leaks, and to help make sense of the large amounts of data already available. With modern technology like inexpensive mobile sensors, leakages in urban environments can be detected in a simple and cheap way.12
Reduction of methane leakage should be seen as a one-off solution that can be applied to rapidly cut emissions from energy before 2030. For the second halving, to 2040, emissions reductions need to come from the share of fossil fuels decreasing further. With appropriate policy, industry cooperation, and application of the latest technology, emissions of methane from oil and gas could be reduced by 0.45 Gt CO2e in 2030, at a net economic gain.14 The full technical potential is almost three times as high.
The Gemasolar Tower
The Gemasolar plant in Spain concentrates sunlight onto a tower, producing 80 GWh of power per year.
Using molten salt heat storage the tower can run for 15 hours without sunlight.
Reducing US Methane Leaks
The United States has cut 38 Mt of CO2 equivalent emissions by reducing methane leaks in oil and gas production.
Plugging methane leaks globally at the same level could give up to 447 Mt of annual CO2e reductions by 2030.
23
EN
ER
GY
SU
PP
LY

EXPONENTIALROADMAP.ORGGLOBAL CL IMATE ACTION SUMMIT 2018
Grid Flexibility and StorageThe energy sector has not been disrupted by digital technology in the same way that other sectors have. One reason may be that energy is seen as strategic infrastructure so governments protect existing systems, utilities and power plants, rather than opening up for disruptive innovation.
However, there is great potential to cut emissions through the use of new technologies, such as smart meters, real-time pricing, artificial intelligence, the internet of things and distributed trading mechanisms such as blockchain. These support a more flexible and responsive grid system, which can reduce emissions by avoiding the disconnection of renewable energy generation due to low demand (even when the wind is blowing or the sun is shining), avoiding emissions from power plants ramping up and down, and less need to expand natural gas infrastructure for grid balancing. In a situation where the increase in renewables is faster than the growth in capacity of the transmission infrastructure, particularly for transmission between regions, optimizing the use of the existing grid can have large importance.
Batteries can also help stabilize the grid by providing immediate extra power, for instance when power plants fail, or balance the daily variations between production and demand. The global grid-connected battery capacity is currently <5 GW. Bloomberg New Energy Finance estimates that global battery capacity will grow exponentially, doubling every 28 months from 2016 to 2030.15 This would mean a capacity in 2030 of 125 GW / 305 GWh.
The effects of these measures on emissions are difficult to estimate for a number of reasons: emissions reductions are often secondary effects, feedback mechanisms can be present, and human behaviour is a major factor. Other reports have therefore chosen not to quantify these kinds of solutions.16 In this report, we have chosen a placeholder value: assuming that storage together with technologies for more flexible and optimised grids will decrease electricity use by 5% and increase the output of renewables by 5%. This will reduce emissions by 1.6 Gt per year by 2030.
Other Low-Carbon EnergyNew hydro, nuclear, biofuel, geothermal, and heat/power cogeneration capacity also contributes to emissions reductions in energy supply. Scaling these to 2030, it’s estimated that their combined contribution will be 0.92 Gt per year, with none of them contributing more than 0.22 Gt each.
Germany’s Flexible Grid
The German network operator 50Hertz has shown that it’s possible to run a grid with a share of variable renewables above 53%.
Germany has set a goal of 63% renewable power by 2030. 2
4 E
NE
RG
Y S
UP
PLY

EXPONENTIALROADMAP.ORGGLOBAL CL IMATE ACTION SUMMIT 2018
Climate Leadership Demanding 100% renewable electricity is an important step that cities, businesses and individuals can take to transition the energy system towards cleaner sources of power. Forty cities around the globe, as well as 138 large companies, have signed up for 100% renewable energy targets, and these numbers are growing rapidly.
But that’s not all – cities, businesses and pension funds can divest from fossil fuels and move assets towards closing the investment gap in new renewable energy instead. Individuals and small organisations can also drive the transition by investing in local energy solutions such as rooftop solar heating and PV, and through peer-to- peer lending.
PolicyEnergy supply and distribution is a deeply politicized sector of many economies because of its role as a strategic resource, for national security, societal stability, and industry production. Yet without rapid low-carbon progress, we will fail to address the societal threat of climate change. Policy has a key role to play in accelerating and sustaining momentum for the necessary energy transition.
Policymakers should adopt complete policy packages rather than singular measures to push the transition from several directions.17 This means removal of fossil fuel subsidies and stopping new long-term infrastructure investments based on unsustainable energy source use – like pipelines and power plants.18 Wasteful energy use should be controlled by energy efficiency standards. Other measures should be put in place to promote and scale renewable energy sources and storage with economic incentives, the opening up of energy markets, boosting R&D, and supporting energy innovation. Energy policies need to be consistent, have local and national acceptance, include social measures to combat energy poverty, and support people whose livelihoods are disrupted in the transition process.
Exponential TechnologyMany renewable energy technologies like wind, solar PV and battery storage get substantially cheaper as they are expanded and developed, due to the effects of modularity and the technology learning curve. Solar PV has dropped in price by an order of magnitude in the last 10 years and Li-Ion batteries have dropped almost 80% in cost in 7 years.19 The exponential nature of these technologies has tended to be underestimated in the past and should not be in the future, particularly as they have begun to drop below conventional power in costs per unit energy.
The difficulty of operating power grids with a high level of variable renewable energy – which produces power and heat irregularly over the course of days and seasons – has been highlighted as a possible blocker for decarbonisation of the sector. However, while there is some debate about the technical and economic possibilities of moving to an energy system that’s 100% powered by variable renewable energy,20,21 even modest claims support energy systems going to an 80% share at reasonable costs.22 This is in most cases enough for the first halving and there is the opportunity in the coming decade to develop new technologies that can further manage grid balancing and achieve a greater share of renewables.
ACCELERATORS
25
EN
ER
GY
SU
PP
LY
EXPONENTIALROADMAP.ORGGLOBAL CL IMATE ACTION SUMMIT 2018
2018 – 2025 2025 – 2030 2030+
CLI
MA
TE
LEA
DE
RSH
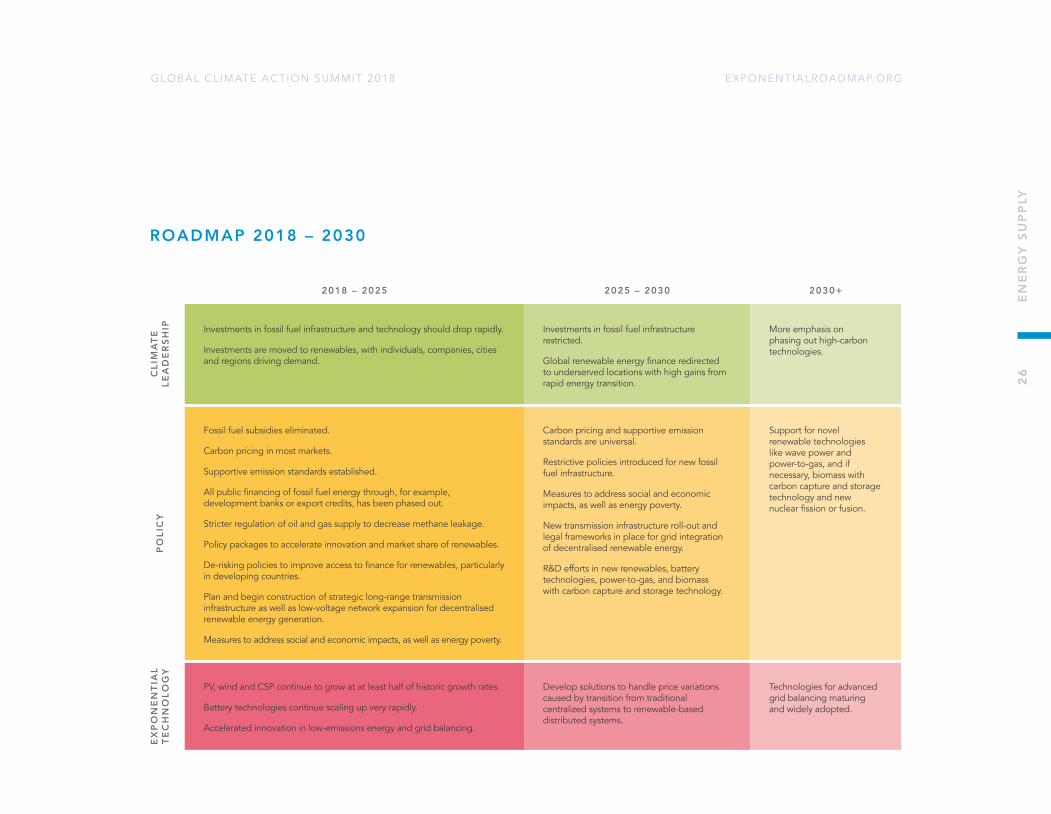
IP Investments in fossil fuel infrastructure and technology should drop rapidly.
Investments are moved to renewables, with individuals, companies, cities and regions driving demand.
Investments in fossil fuel infrastructure restricted.
Global renewable energy finance redirected to underserved locations with high gains from rapid energy transition.
More emphasis on phasing out high-carbon technologies.
PO
LIC
Y
Fossil fuel subsidies eliminated.
Carbon pricing in most markets.
Supportive emission standards established.
All public financing of fossil fuel energy through, for example, development banks or export credits, has been phased out.
Stricter regulation of oil and gas supply to decrease methane leakage.
Policy packages to accelerate innovation and market share of renewables.
De-risking policies to improve access to finance for renewables, particularly in developing countries.
Plan and begin construction of strategic long-range transmission infrastructure as well as low-voltage network expansion for decentralised renewable energy generation.
Measures to address social and economic impacts, as well as energy poverty.
Carbon pricing and supportive emission standards are universal.
Restrictive policies introduced for new fossil fuel infrastructure.
Measures to address social and economic impacts, as well as energy poverty.
New transmission infrastructure roll-out and legal frameworks in place for grid integration of decentralised renewable energy.
R&D efforts in new renewables, battery technologies, power-to-gas, and biomass with carbon capture and storage technology.
Support for novel renewable technologies like wave power and power-to-gas, and if necessary, biomass with carbon capture and storage technology and new nuclear fission or fusion.
EX
PO
NE
NTI
AL
TE
CH
NO
LOG
Y
PV, wind and CSP continue to grow at at least half of historic growth rates.
Battery technologies continue scaling up very rapidly.
Accelerated innovation in low-emissions energy and grid balancing.
Develop solutions to handle price variations caused by transition from traditional centralized systems to renewable-based distributed systems.
Technologies for advanced grid balancing maturing and widely adopted.
ROADMAP 2018 – 2030
26
EN
ER
GY
SU
PP
LY
EXPONENTIALROADMAP.ORGGLOBAL CL IMATE ACTION SUMMIT 2018
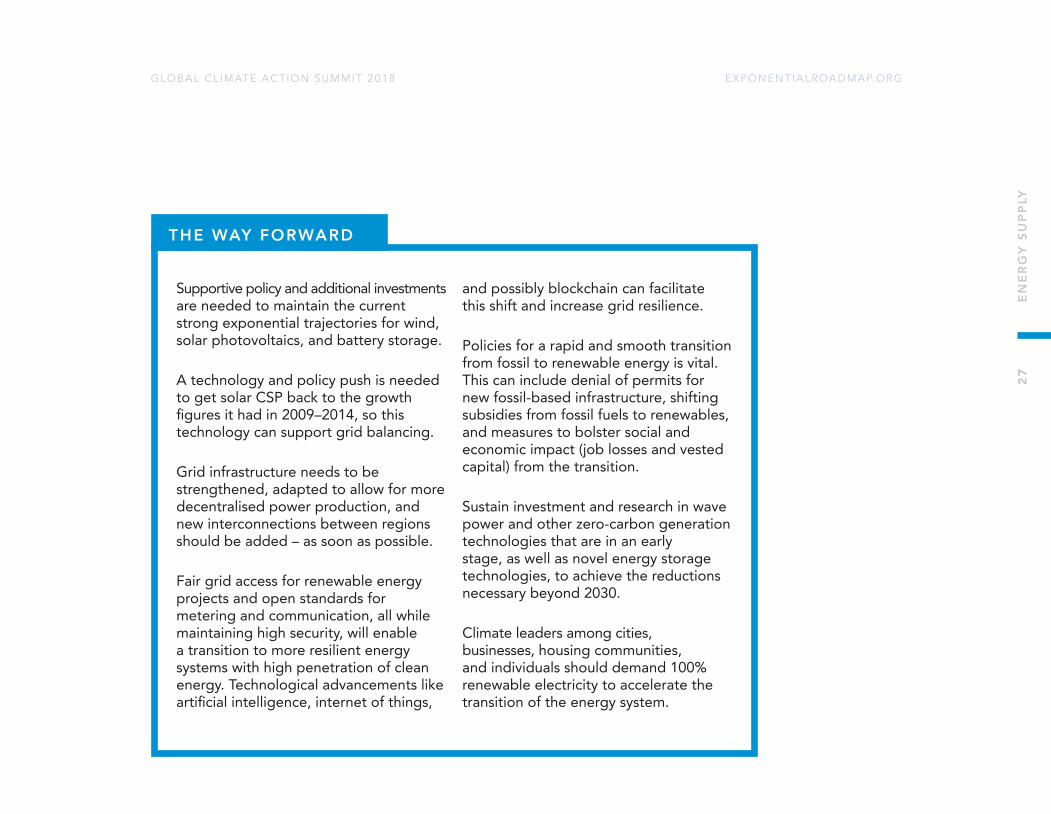
Supportive policy and additional investments are needed to maintain the current strong exponential trajectories for wind, solar photovoltaics, and battery storage.
A technology and policy push is needed to get solar CSP back to the growth figures it had in 2009–2014, so this technology can support grid balancing.
Grid infrastructure needs to be strengthened, adapted to allow for more decentralised power production, and new interconnections between regions should be added – as soon as possible.
Fair grid access for renewable energy projects and open standards for metering and communication, all while maintaining high security, will enable a transition to more resilient energy systems with high penetration of clean energy. Technological advancements like artificial intelligence, internet of things,
and possibly blockchain can facilitate this shift and increase grid resilience.
Policies for a rapid and smooth transition from fossil to renewable energy is vital. This can include denial of permits for new fossil-based infrastructure, shifting subsidies from fossil fuels to renewables, and measures to bolster social and economic impact (job losses and vested capital) from the transition.
Sustain investment and research in wave power and other zero-carbon generation technologies that are in an early stage, as well as novel energy storage technologies, to achieve the reductions necessary beyond 2030.
Climate leaders among cities, businesses, housing communities, and individuals should demand 100% renewable electricity to accelerate the transition of the energy system.
THE WAY FORWARD
27
EN
ER
GY
SU
PP
LY
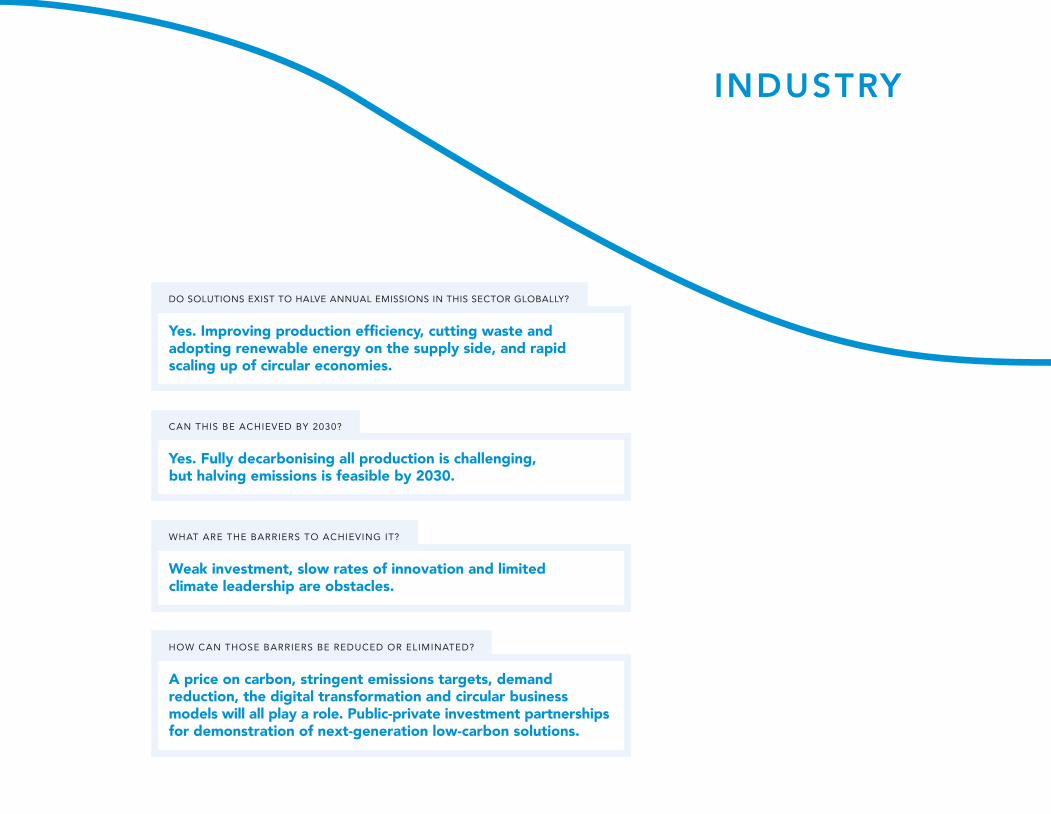
INDUSTRY
Yes. Improving production efficiency, cutting waste and adopting renewable energy on the supply side, and rapid scaling up of circular economies.
DO SOLUTIONS EXIST TO HALVE ANNUAL EMISSIONS IN THIS SECTOR GLOBALLY?
Yes. Fully decarbonising all production is challenging, but halving emissions is feasible by 2030.
CAN THIS BE ACHIEVED BY 2030?
Weak investment, slow rates of innovation and limited climate leadership are obstacles.
WHAT ARE THE BARRIERS TO ACHIEVING IT?
A price on carbon, stringent emissions targets, demand reduction, the digital transformation and circular business models will all play a role. Public-private investment partnerships for demonstration of next-generation low-carbon solutions.
HOW CAN THOSE BARRIERS BE REDUCED OR ELIMINATED?

EXPONENTIALROADMAP.ORGGLOBAL CL IMATE ACTION SUMMIT 2018
CURRENT S ITUATION
Industry is responsible for 18 Gt CO2e of global greenhouse gas emissions annually, which represents 34% of the global total.
This figure can be split into two parts. Firstly, less energy-intensive light industry, such as food, textiles, wood, printing, chemicals and metal processing. Secondly, the energy-intensive heavy industries, including metal fabrication, refineries, paper, fertilisers, chlorine and cement.
Heavy industry is growing exponentially. In the last decade, steel production grew 40%, with nearly 95% of this growth in China alone, and cement production tripled. Global plastics demand has been doubling about every 20 years.1 Without rapid transformation of the sector, concrete, steel and plastics will easily eat up the 1.5°C carbon budget for humanity’s remaining time on Earth.
TRAJECTORY
ENERGY BUILDINGS TRANSPORT FOOD AGRICULTURE & FORESTRYINDUSTRY
Circular economy
Supply side efficiencies
Refrigerant management
2020Current emissions
2030First halving
Ann
ual e
mis
sion
s (%
)
75
50
25
Estimated 54% reduction of the annual emission achieved for industry sector by 2030, which includes reduction of 2.83 Gt (31%) electricity and heat related emissions.
29
IND
UST
RY
EXPONENTIALROADMAP.ORGGLOBAL CL IMATE ACTION SUMMIT 2018
SOLUTIONS FOR FIRST HALVING
In the coming years, demand for consumer and industrial goods is expected to rise as the global middle class swells from 3.2 billion in 2016 to a projected 5.2 billion by 2030.2 Growing cities will fuel a demand for building materials, with 60% of the global population expected to live in urban areas by 2030.3 All this adds up to strong growth for industry and manufacturing, but what does it mean for emissions?
A digital revolution (oriented around technologies like artificial intelligence, internet of things and 3D printing) is underway with the potential to affect demand substantially in the coming decade. This chapter will explore this balance. It will not discuss distant innovations, for example using hydrogen in steel production.
Circular economy and closed-loop business modelsMore companies are adopting a circular economy model in their business operations and supply chains. The Ellen MacArthur Foundation – a leader in promoting this business model – defines a circular economy as “restorative and regenerative by design”. It relies on system-wide innovation, and “aims to redefine products and services to design waste out, while minimising negative impacts” underpinned by a transition to renewable energy sources. It is beyond recycling and includes replacing products with services and increased sharing. The Finnish future fund Sitra defines a circular economy as maximising the circulation of products, components and materials and the value bound to them as much as possible in the economy. This goes beyond environmental benefits and creates real economic and social benefits too.
A more circular economy could cut cumulative emissions from heavy industry by 56% by 2050 in the EU, and 45% of cumulative emissions from the steel, cement, plastic and aluminium products globally.4 In practice, this means dramatic increases in recycling rates, recovering more materials through disassembly factories, and making products more material-efficient, which means extending lifespan and reducing weight.
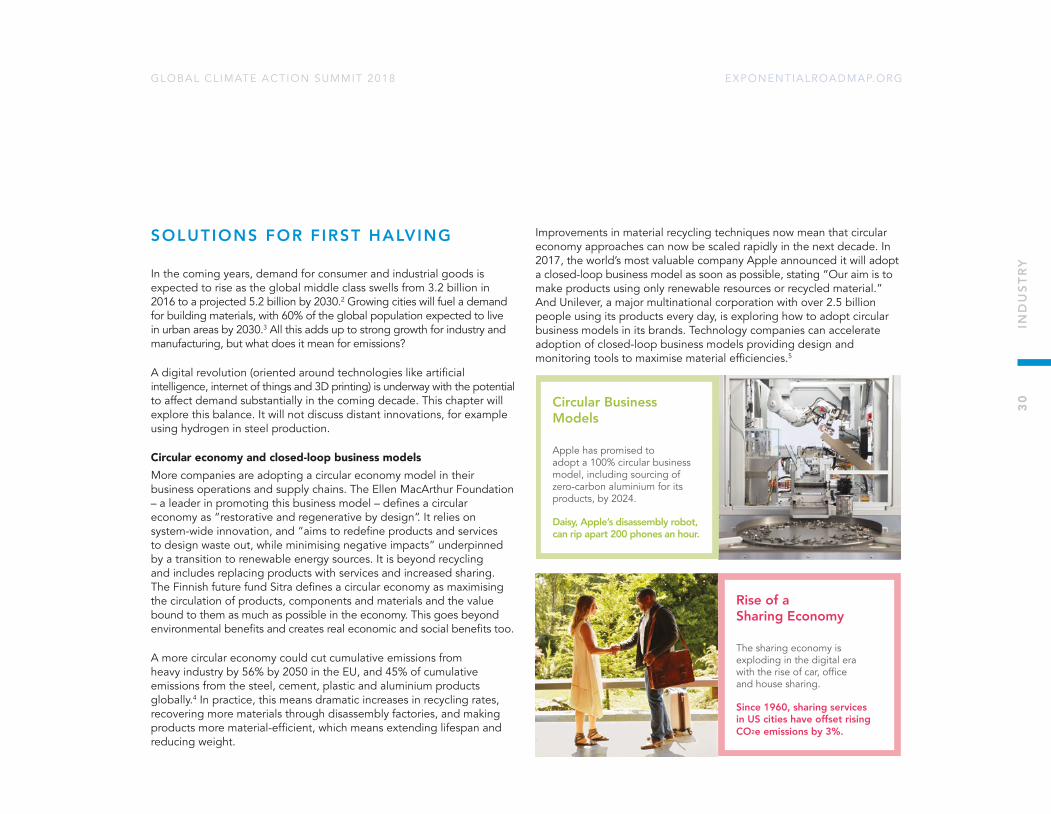
Improvements in material recycling techniques now mean that circular economy approaches can now be scaled rapidly in the next decade. In 2017, the world’s most valuable company Apple announced it will adopt a closed-loop business model as soon as possible, stating “Our aim is to make products using only renewable resources or recycled material.” And Unilever, a major multinational corporation with over 2.5 billion people using its products every day, is exploring how to adopt circular business models in its brands. Technology companies can accelerate adoption of closed-loop business models providing design and monitoring tools to maximise material efficiencies.5
Circular Business Models
Apple has promised to adopt a 100% circular business model, including sourcing of zero-carbon aluminium for its products, by 2024.
Daisy, Apple’s disassembly robot, can rip apart 200 phones an hour.
Rise of a Sharing Economy
The sharing economy is exploding in the digital era with the rise of car, offi ce and house sharing.
Since 1960, sharing services in US cities have offset rising CO2e emissions by 3%.
30
IND
UST
RY
EXPONENTIALROADMAP.ORGGLOBAL CL IMATE ACTION SUMMIT 2018
Supply-Side EfficienciesWhile major efforts to reduce demand for steel, cement, plastics, aluminium and other materials, are essential, so too are emissions reductions. The energy intensity of the sector could be reduced by up to 25% by 2030 by upgrading or replacing existing equipment with the best available on the market.
Additional reductions of approximately 20% in annual energy intensity are possible through the application of innovative technologies.6 By measuring processes and energy usage in real-time, machine learning techniques can be used to continuously reduce waste in terms of energy, materials and machinery in industrial processes.
Refrigerants In the wake of the discovery of the hole in the ozone layer in 1984, UN member states agreed to phase out the chlorofluorocarbon (CFC) refrigerants that were causing the problem. In their place, many industries shifted to to hydrofluorocarbon (HFC) refrigerants, which cause less damage to the ozone layer. However, HFCs happen to be powerful greenhouse gases, with a global warming potential thousands of times higher than carbon dioxide and a long lifespan in the atmosphere.
In Kigali, Rwanda in 2016, nations agreed to phase out these HFCs with some countries starting as early as 2019. Doing so has the potential to reduce cumulative emissions by the equivalent of 90 billion tonnes of carbon dioxide by 2050,7 making a significant contribution to meeting the Paris Agreement. More than 90% of the climate change impacts of HFCs can be avoided if emissions stop by 2030.8 Forty-one countries have now ratified the treaty, which is due to come in to force on 1 January 2019.9 Europe and the US have committed to acting first – rapidly cutting HFC emissions 10% by 2019, while middle-income countries such as China and Brazil plan to cap emissions in 2024.
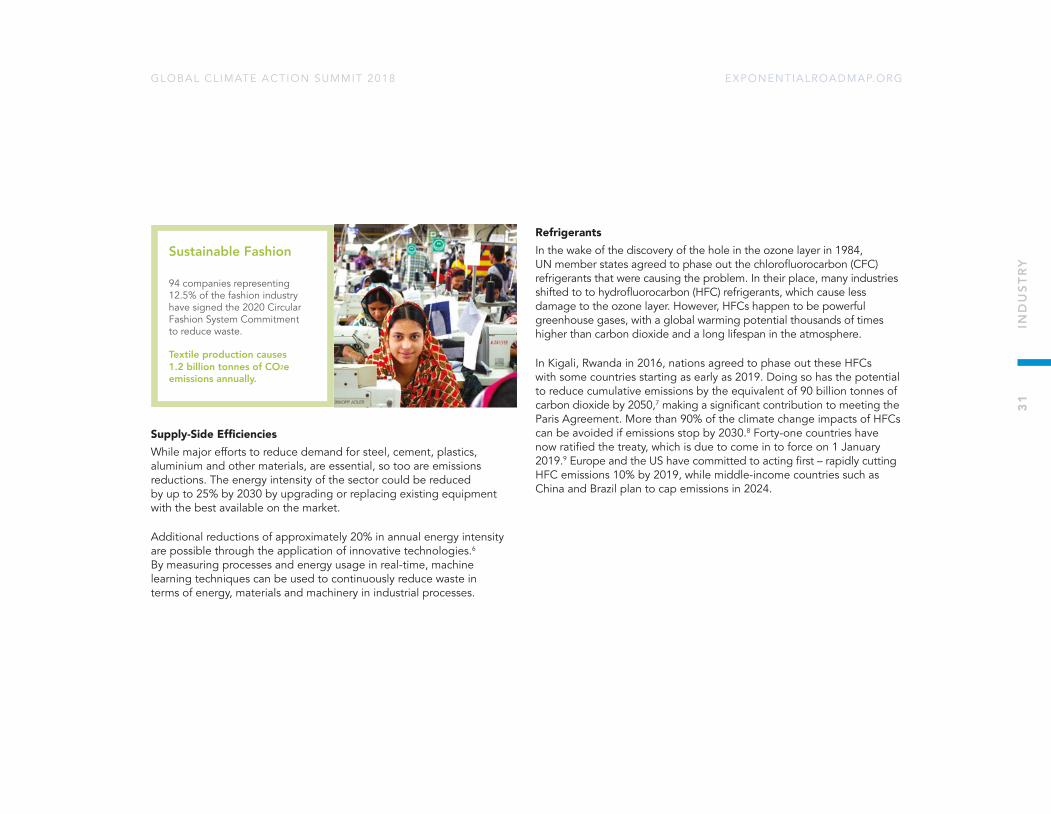
Sustainable Fashion
94 companies representing 12.5% of the fashion industry have signed the 2020 Circular Fashion System Commitment to reduce waste.
Textile production causes 1.2 billion tonnes of CO2e emissions annually.
31
IND
UST
RY
EXPONENTIALROADMAP.ORGGLOBAL CL IMATE ACTION SUMMIT 2018
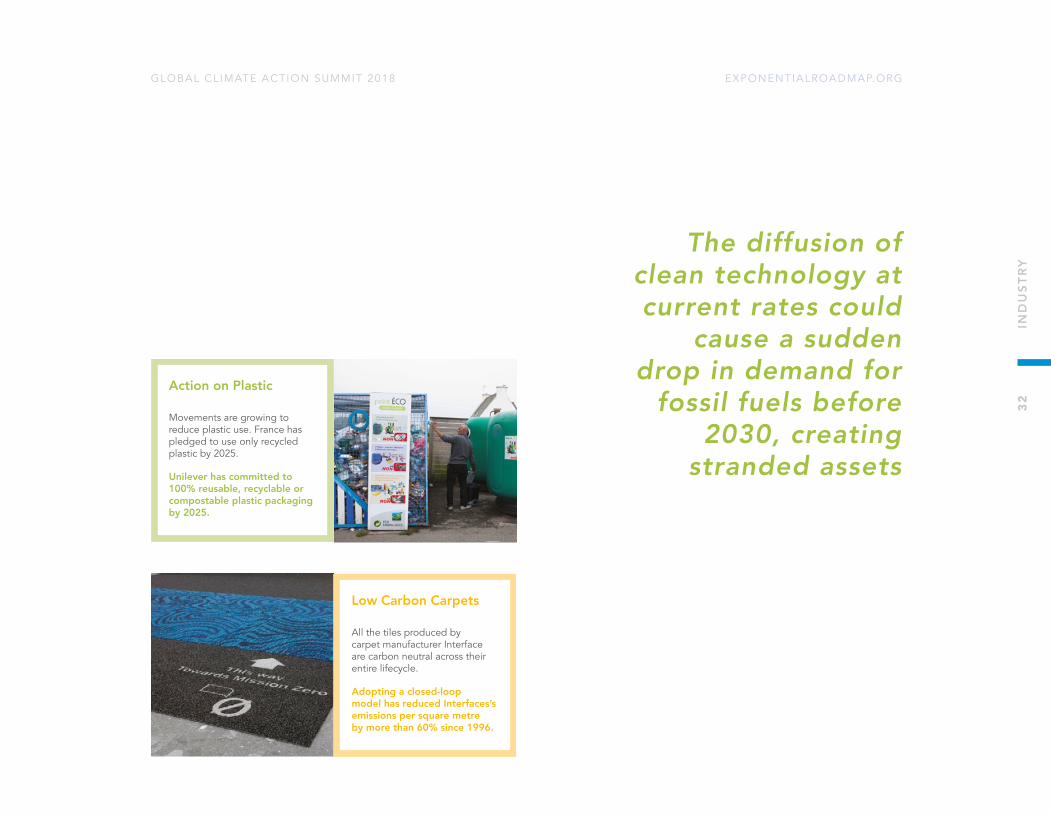
Low Carbon Carpets
All the tiles produced by carpet manufacturer Interface are carbon neutral across their entire lifecycle.
Adopting a closed-loop model has reduced Interfaces’s emissions per square metre by more than 60% since 1996.
Action on Plastic
Movements are growing to reduce plastic use. France has pledged to use only recycled plastic by 2025.
Unilever has committed to 100% reusable, recyclable or compostable plastic packaging by 2025.
The diffusion of clean technology at current rates could
cause a sudden drop in demand for
fossil fuels before 2030, creating
stranded assets
32
IND
UST
RY

EXPONENTIALROADMAP.ORGGLOBAL CL IMATE ACTION SUMMIT 2018
Climate Leadership In this sector, climate leadership means customers demanding low-carbon solutions and companies and industry setting targets and establishing roadmaps to halve emissions. The bandwagon effect means that sharing the knowledge gained in adopting circular business models with a wide audience will accelerate adoption elsewhere, and bring economies of scale. There is an opportunity to learn from the technology sector here: An open source approach to adopting new business models – sharing best practice and tools – means expanding the market. For example, as more companies offer recycled aluminium products, demand will rise.
PolicyUntil now, the most prevalent approach to emissions-reductions policy in this sector has been information campaigns. This is not sufficient to drive the level of change needed to achieve a halving of emissions by 2030. Instead, stringent standards for efficiencies on products and production processes should be implemented as soon as possible. Moreover, incentivising rapid shifts towards circular economies, accelerated by technology, and targeting material recirculation and material-use efficiencies offers many co-benefits beyond emissions reductions.
Other strategies for policymakers include regulating what happens at the end of a product’s life, mandating onsite manufacturing and material reuse in the construction industry, zoning for distributed manufacturing, adapting public procurement policies and more stringent waste regulation.
Exponential TechnologyLack of information and data is a key barrier to adoption of low-emissions solutions within industry, and this is where the technology sector can make a real difference. Practical tools must be developed to help companies implement circular business models to cut demand for carbon-intensive materials and processes.
The other major opportunity for the technology industry is in the influencing of consumer choice. Protocols and decision-making algorithms should consider planetary boundaries, promoting low-emissions and circular-economy options over those that consume more resources. Consumers can also be nudged towards low-impact products on digital storefronts and default choices in software solutions.
Finally, localised manufacturing technologies like 3D printing could, within in a decarbonisation policy framework, have a transformative effect on the industrial sector by 2030. The possibility to democratise production in this way can make communities far less dependent on global supply chains, and able to effortlessly share items without having to physically transport them. This has great potential to cut emissions, but developments in this space should be carefully monitored for unanticipated effects.
ACCELERATORS
33
IND
UST
RY
EXPONENTIALROADMAP.ORGGLOBAL CL IMATE ACTION SUMMIT 2018
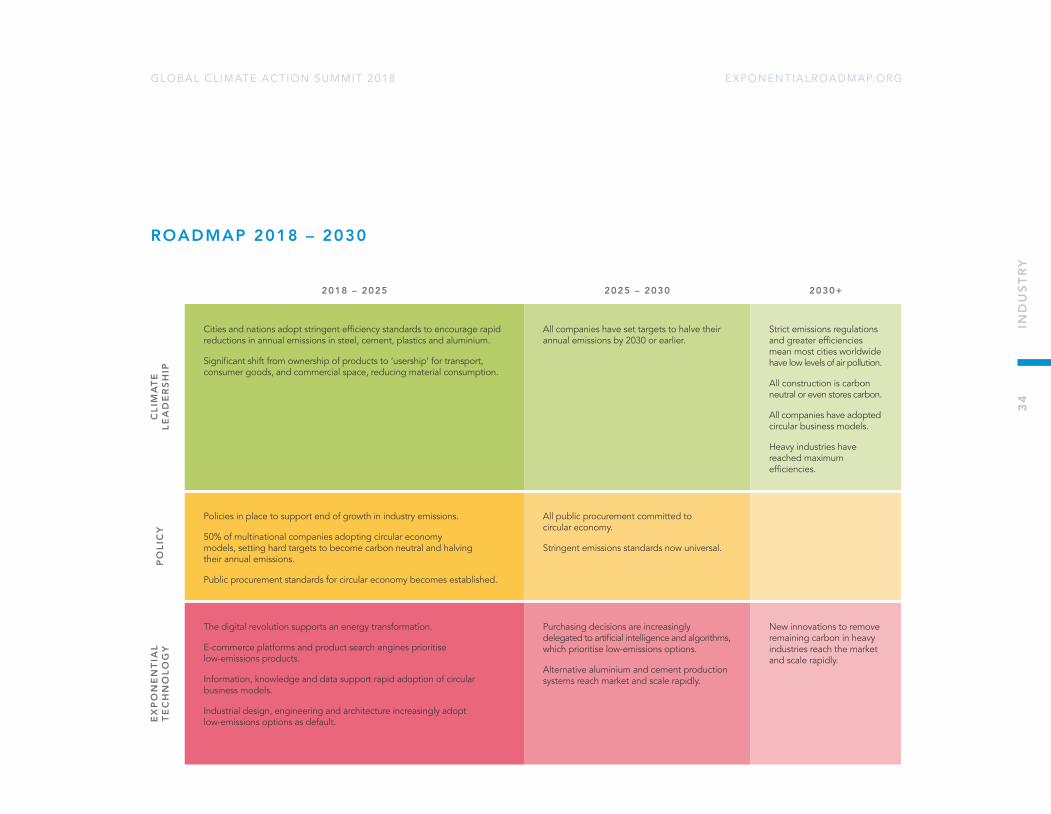
ROADMAP 2018 – 2030
2018 – 2025 2025 – 2030 2030+
CLI
MA
TE
LEA
DE
RSH
IP
Cities and nations adopt stringent efficiency standards to encourage rapid reductions in annual emissions in steel, cement, plastics and aluminium.
Significant shift from ownership of products to ‘usership’ for transport, consumer goods, and commercial space, reducing material consumption.
All companies have set targets to halve their annual emissions by 2030 or earlier.
Strict emissions regulations and greater efficiencies mean most cities worldwide have low levels of air pollution.
All construction is carbon neutral or even stores carbon.
All companies have adopted circular business models.
Heavy industries have reached maximum efficiencies.
PO
LIC
Y
Policies in place to support end of growth in industry emissions.
50% of multinational companies adopting circular economy models, setting hard targets to become carbon neutral and halving their annual emissions.
Public procurement standards for circular economy becomes established.
All public procurement committed to circular economy.
Stringent emissions standards now universal.
EX
PO
NE
NTI
AL
TE
CH
NO
LOG
Y
The digital revolution supports an energy transformation.
E-commerce platforms and product search engines prioritise low-emissions products.
Information, knowledge and data support rapid adoption of circular business models.
Industrial design, engineering and architecture increasingly adopt low-emissions options as default.
Purchasing decisions are increasingly delegated to artificial intelligence and algorithms, which prioritise low-emissions options.
Alternative aluminium and cement production systems reach market and scale rapidly.
New innovations to remove remaining carbon in heavy industries reach the market and scale rapidly.
34
IND
UST
RY
EXPONENTIALROADMAP.ORGGLOBAL CL IMATE ACTION SUMMIT 2018
There is an urgent need for stronger policy and industry action to prevent inefficient processes from being locked-in for the long term. The cost to industry of a low-carbon transition does not differ substantially from the costs of normal investment as part of business as usual.10 The financial case for rapid action is strong.
Policymakers must focus on incentivising energy efficiency through stringent standards and support for deployment of best available technologies, for example through public procurement incentives. Removal of energy price subsidies would contribute greatly. An immediate priority is accelerated reuse of materials through refunding schemes, and scrap collection and recycling rates.11
All manufacturing businesses and industries should set ambitious targets to aim to halve emissions by around 2030.
Establish a movement of companies adopting open-source circular economy business models and set target dates for of around 2030 for the full implementation of closed-loop models.
Physical retailers and e-commerce platforms should develop strategies to incentivise low-emissions products, recycling and longer product lifetimes.
THE WAY FORWARD
35
IND
UST
RY

Yes. Emissions can be halved through investment in renewable energy alone, and can be cut even further though other solutions detailed in this chapter.
CAN THIS BE ACHIEVED BY 2030?
The main barrier is availability of renewable energy globally.
WHAT ARE THE BARRIERS TO ACHIEVING IT?
Policies to incentivise adoption and purchase of renewables and the digital industry’s own capacity to invest in renewable energy production.
HOW CAN THOSE BARRIERS BE REDUCED OR ELIMINATED?
DIGITAL INDUSTRY
Yes, these solutions exist and are being implemented by the industry.
DO SOLUTIONS EXIST TO HALVE ANNUAL EMISSIONS IN THIS SECTOR GLOBALLY?
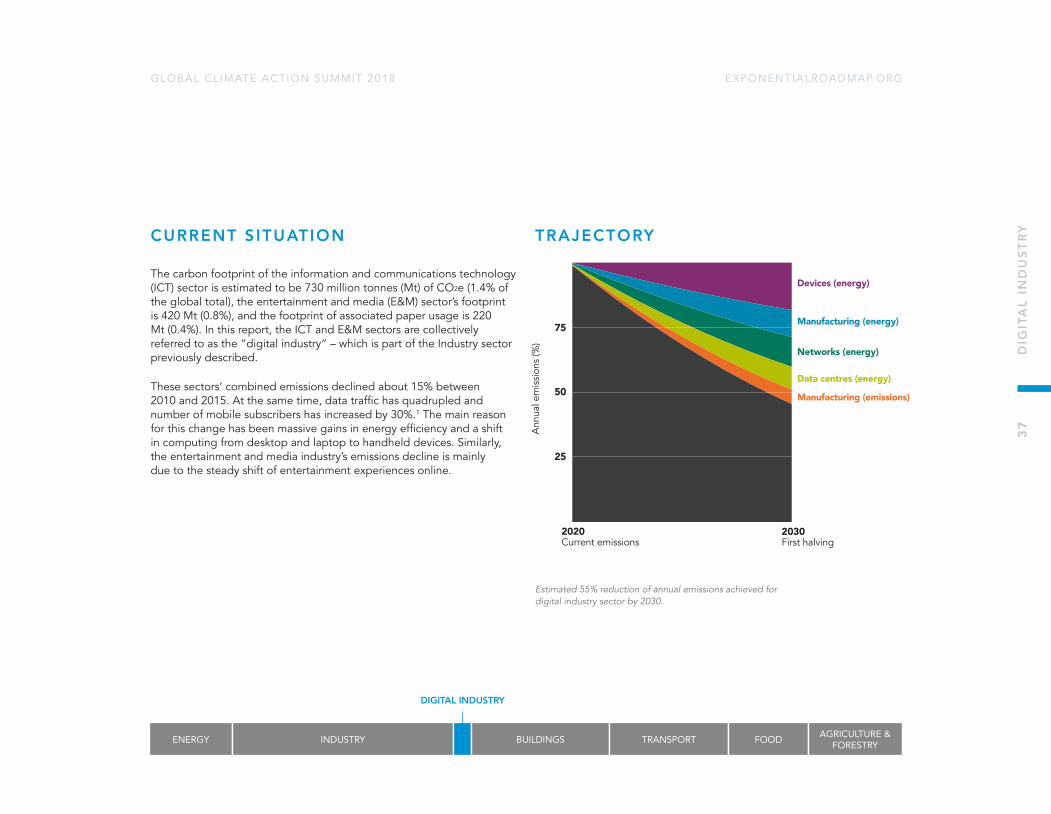
EXPONENTIALROADMAP.ORGGLOBAL CL IMATE ACTION SUMMIT 2018
CURRENT S ITUATION
The carbon footprint of the information and communications technology (ICT) sector is estimated to be 730 million tonnes (Mt) of CO2e (1.4% of the global total), the entertainment and media (E&M) sector’s footprint is 420 Mt (0.8%), and the footprint of associated paper usage is 220 Mt (0.4%). In this report, the ICT and E&M sectors are collectively referred to as the “digital industry” – which is part of the Industry sector previously described.
These sectors’ combined emissions declined about 15% between 2010 and 2015. At the same time, data traffic has quadrupled and number of mobile subscribers has increased by 30%.1 The main reason for this change has been massive gains in energy efficiency and a shift in computing from desktop and laptop to handheld devices. Similarly, the entertainment and media industry’s emissions decline is mainly due to the steady shift of entertainment experiences online.
TRAJECTORY
ENERGY INDUSTRY BUILDINGS TRANSPORT FOOD AGRICULTURE & FORESTRY
DIGITAL INDUSTRY
Devices (energy)
Manufacturing (energy)
Networks (energy)
Data centres (energy)
Manufacturing (emissions)
2020Current emissions
2030First halving
Ann
ual e
mis
sion
s (%
)
75
50
25
Estimated 55% reduction of annual emissions achieved for digital industry sector by 2030.
37
DIG
ITA
L IN
DU
STR
Y

EXPONENTIALROADMAP.ORGGLOBAL CL IMATE ACTION SUMMIT 2018
SOLUTIONS FOR FIRST HALVING
The digital sector has successfully been reducing its emissions for almost a decade, and both its strategies and its successes at continuous technological innovation can be instructive in other industries. Nonetheless, its emissions must halve by 2030, and this chapter presents the most likely ways for the industry to do so.
To date, the sector has been setting strong carbon reduction targets and can be a key catalyst for emissions revolutions globally. This has been made possible due to the strong growth in renewable energy, as well as demand from corporations, consumers and cities for low-carbon solutions.
Renewable ElectricityElectricity is a key part of the emissions of many industries, but perhaps none to such as great an extent as the digital sector. That’s why ensuring that its electricity comes from renewable sources is the most effective strategy to reduce those emissions fast.
Many of the largest technology companies – Microsoft, Intel, Apple and more – are already at or close to 100% renewable energy.2 However, outside of parts of the United States and the Nordic countries, the picture is mixed – many regions still lack renewables capacity. The digital industry is the largest buyer of renewable energy,3 but it can definitely raise that figure further. The authors estimate that just 50 TWh out of 835 TWh used by the industry came from certified renewable sources.2
Transitioning to Renewable Energy
Apple has achieved 100% renewable electricity for its operations in the U.S. and 93% worldwide.
Apple’s valuation is now greater than $1 trillion.
38
DIG
ITA
L IN
DU
STR
Y

EXPONENTIALROADMAP.ORGGLOBAL CL IMATE ACTION SUMMIT 2018
Data centres and NetworksAs well as powering data centres and networks with renewable electricity – either generated close by or purchased from the grid – operators can do even more.
Data centres and similar technical network sites benefit from efficiencies of scale, and many smaller, older locations can be replaced by fewer centralised units, with optimised operations. Cooling is a major component of data centre electricity use, so locating them in colder climates reduces emissions – the Nordic countries have recently attracted many large data centres for this reason. An additional benefit is that waste heat can be used to warm local communities. Data centres can also play an important role in smart electrical grids, allowing for energy storage and backup that reduces losses in the grid.
Similarly, in many areas there is large potential to replace multiple parallel legacy networks (eg older telephony and cable TV networks) with new, efficient fibre optic or cellular networks. This reduces maintenance needs, energy use and – again – network sites can form an important part of smart electrical grids.
Beyond measures to optimise the electricity usage of data centres and networks, operators can also address emissions related to the operation and maintenance of these including measures that targets buildings, transport strategies and fleet management.
Mobile Network Effi ciency
The energy performance of networks improves continuously through modernisation programmes and new product architectures.
Ericsson and Nokia have seen around 40% energy savings.
A Zero-Carbon Data Centre
Google’s data centre in Hamina, Finland is built in an old paper mill and uses water from the Baltic Sea to cool servers.
The data centre uses 100% wind power.
39
DIG
ITA
L IN
DU
STR
Y

EXPONENTIALROADMAP.ORGGLOBAL CL IMATE ACTION SUMMIT 2018
Devices and ManufacturingThe introduction of the smartphone has had a profound impact on the digital sector’s total footprint. Functionalities (such as media players, clocks, calculators, navigators etc), which previously required separate products and hardware, have been replaced by one single material- and energy-efficient device, which can be augmented and updated over time with new features.
On the other hand, device electricity consumption still remains a large part of the total electricity consumption of the sector, and its decentralised nature means that turning it 100% renewable is a greater challenge. It will either involve making sure that renewable electricity reaches most buildings on the planet, or developing new business models where devices are purchased with renewable energy credits, to cover charging throughout the lifecycle of the device.
The other key component of emissions in this sector is manufacturing. About two thirds of manufacturing-related emissions can be eliminated with a switch to 100% renewable electricity. The remaining third however is more difficult to address since it is split between materials, industrial processes, non-electrical energy, and transportation. Possible strategies here include regulation of the use of industrial gases with high global warming potential and accelerating development of alternatives, rethinking packaging systems, and a reduction in the use of air freight to transport goods.
Halving Chip Manufacturing Emissions
Intel has quickly and drastically reduced the fl uorinated gas emissions from its chip manufacturing plants.
From 1995 to 2010, Intel cut its chip production emissions by 50%.
40
DIG
ITA
L IN
DU
STR
Y
EXPONENTIALROADMAP.ORGGLOBAL CL IMATE ACTION SUMMIT 2018
Climate Leadership The digital sector is in a unique position to lead the world by example. With a rapid shift to 100% renewable electricity, and putting requirements on the electrification of vehicle fleets and other energy use, the digital sector can halve emissions rapidly and efficiently by 2030, and likely go beyond this target.
More important, however, is this sector’s role as an enabler, as an innovator, and as a provider of services and solutions to other sectors. Many of the technology platforms that allow other sectors to halve emissions will originate in the digital sector.
PolicyThe need for strong policy is not as important for the halving of emissions within the digital sector as it is in other sectors since it is already driving radical efficiency improvements and top companies are taking a lead on climate action. What will accelerate the transition, however, is strong policy in the energy sector – particularly around renewable electricity – to achieve the emissions reductions needed in the next halving in the 2030s.
Full transparency of the carbon footprint of digital services, to businesses and consumers, must be implemented in order to foster positive competition, but of greatest importance for emission reductions overall is probably how policy can support the use of digital technology in other sectors to enable large emissions reductions. You can find more detail on this in the exponential technology chapter.
Exponential TechnologyThe digital sector will no doubt continue to accelerate efficiency in data centres, networks and manufacturing aggressively based on the foundation of Moore’s Law. It can, however, take a even larger role in accelerating the halving of global emissions by developing new performance and energy-efficient technology for other sectors.
ACCELERATORS
41
DIG
ITA
L IN
DU
STR
Y

EXPONENTIALROADMAP.ORGGLOBAL CL IMATE ACTION SUMMIT 2018
ROADMAP 2018 – 2030
2018 – 2025 2025 – 2030 2030+
CLI
MA
TE
LEA
DE
RSH
IP
Digital companies train all staff in sustainable innovation.
The majority of digital companies set strong emissions reduction targets.
Investments in renewable electricity production.
Rapid increase in renewable energy produced “on site” and availability of renewable energy globally.
Digital companies become net producers of renewable electricity.
PO
LIC
Y Policy accelerates renewable electricity in all markets and for all customer types globally.
Carbon footprint information about digital solutions clearly provided to businesses and consumers.
Non-renewable energy used in production/manufacturing drastically reduced.
Non-renewable electricity in the electricity grid phased out.
EX
PO
NE
NTI
AL
TE
CH
NO
LOG
Y
Next-generation hyperscale data centres, 5G networks and energy techniques drive up efficiency further.
Innovation and development of technologies and platforms based on connectivity that support drastic carbon reduction in other industries.
A good number of technology products designed with circular economy in mind.
Standardised platforms for communication, automation and artificial intelligence that other industries can use to reduce emissions.
All technology products designed with circular economy in mind.
Full connectivity is implemented in all industries and seen as default functionality in product development.
42
DIG
ITA
L IN
DU
STR
Y
EXPONENTIALROADMAP.ORGGLOBAL CL IMATE ACTION SUMMIT 2018
The digital sector has a strong head start on emissions reductions, but this is not a reason for complacency. The most effective solution to reducing emissions in the digital sector is a rapid shift to 100% renewable electricity.
Digital companies should set requirements on suppliers and put positive pressure on regions to halve emissions before 2030.
As the largest buyer of renewable energy, digital companies can take a lead in accelerating the renewables revolution globally.
Other solutions include replacing legacy networks with more efficient digital networks, rebuilding and/or moving data centres to cooler countries with greater renewable electricity
production, and rethinking packaging and transport.
The biggest role that the digital sector can play is in contributing effective solutions to other sectors, influencing consumer and producer behaviour and leading the transformation of our energy systems.
THE WAY FORWARD
43
DIG
ITA
L IN
DU
STR
Y
Yes, the technology and knowledge exist to rapidly reduce building energy use by more than 50%.
CAN THIS BE ACHIEVED BY 2030?
Outdated regulations, combined with the projected need for constructing new buildings in the coming decades are key issues.
WHAT ARE THE BARRIERS TO ACHIEVING IT?
Smart urban planning with minimum requirements for energy efficiency in buildings and incentives for utilizing building space more efficiently and for using low-carbon construction materials.
HOW CAN THOSE BARRIERS BE REDUCED OR ELIMINATED?
BUILDINGS
Yes, solutions exist to halve emissions for existing buildings, and to ensure halved emissions in new buildings.
DO SOLUTIONS EXIST TO HALVE ANNUAL EMISSIONS IN THIS SECTOR GLOBALLY?

EXPONENTIALROADMAP.ORGGLOBAL CL IMATE ACTION SUMMIT 2018
CURRENT S ITUATION
Annual emissions related to existing buildings were about 9 Gt CO2e in 2016, and have decreased slightly since, with about 60% coming from residential and 40% from non-residential buildings. Annual emissions related to building construction, on the other hand, are increasing steadily and reached 3.7 Gt CO2e in 2016.1
As of 2016, there was 235 billion square metres of building space globally, which is more or less expected to double by 2050. Energy use per square metre is reducing by about 1.5% each year, but this is offset by an increase in floor area of 2.3% per year. This growth is mostly expected to come from China and India in the coming decade, and Africa from 2040.
TRAJECTORY
ENERGY BUILDINGS TRANSPORT FOOD AGRICULTURE & FORESTRYINDUSTRY
Digital automation
Retrofitting
Low-carbonheating and cooling
Low-carbonconstruction
2020Current emissions
2030First halving
Ann
ual e
mis
sion
s (%
)
75
50
25
52% reduction of the annual emission achieved for buildings sector by 2030, which includes reduction of 3.20 Gt (63%) electricity and heat related emissions.
45
BU
ILD
ING
S
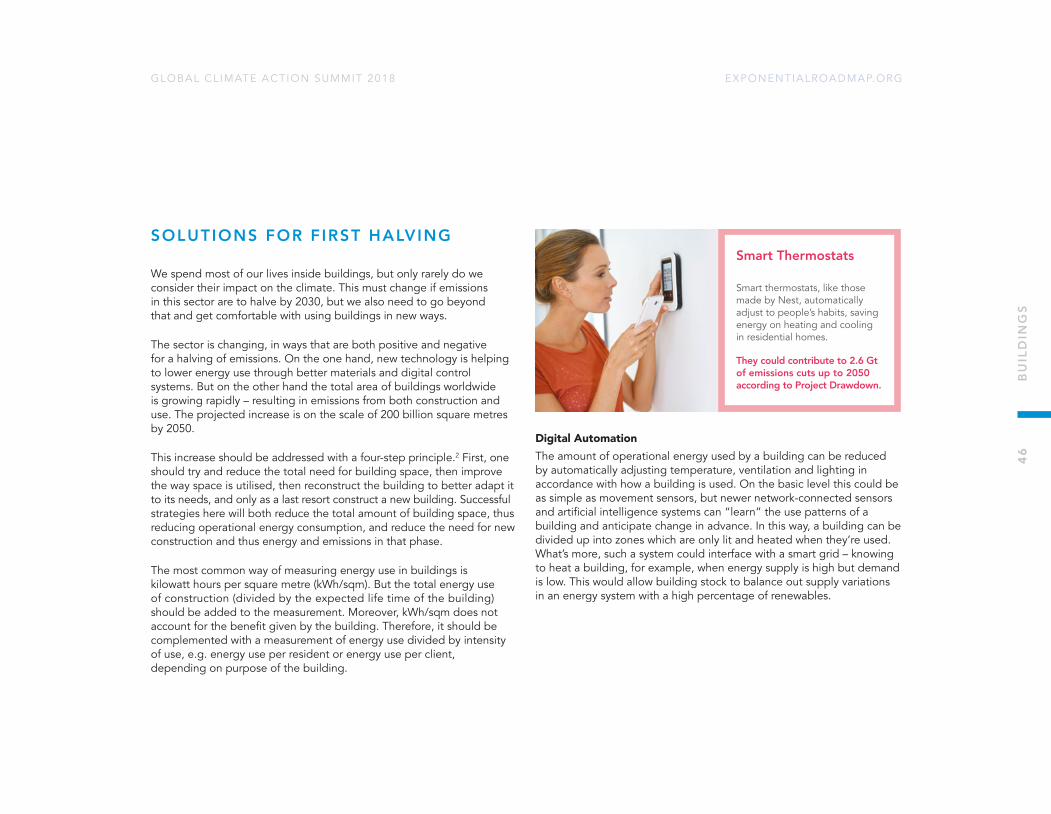
EXPONENTIALROADMAP.ORGGLOBAL CL IMATE ACTION SUMMIT 2018
SOLUTIONS FOR FIRST HALVING
We spend most of our lives inside buildings, but only rarely do we consider their impact on the climate. This must change if emissions in this sector are to halve by 2030, but we also need to go beyond that and get comfortable with using buildings in new ways.
The sector is changing, in ways that are both positive and negative for a halving of emissions. On the one hand, new technology is helping to lower energy use through better materials and digital control systems. But on the other hand the total area of buildings worldwide is growing rapidly – resulting in emissions from both construction and use. The projected increase is on the scale of 200 billion square metres by 2050.
This increase should be addressed with a four-step principle.2 First, one should try and reduce the total need for building space, then improve the way space is utilised, then reconstruct the building to better adapt it to its needs, and only as a last resort construct a new building. Successful strategies here will both reduce the total amount of building space, thus reducing operational energy consumption, and reduce the need for new construction and thus energy and emissions in that phase.
The most common way of measuring energy use in buildings is kilowatt hours per square metre (kWh/sqm). But the total energy use of construction (divided by the expected life time of the building) should be added to the measurement. Moreover, kWh/sqm does not account for the benefit given by the building. Therefore, it should be complemented with a measurement of energy use divided by intensity of use, e.g. energy use per resident or energy use per client, depending on purpose of the building.
Digital AutomationThe amount of operational energy used by a building can be reduced by automatically adjusting temperature, ventilation and lighting in accordance with how a building is used. On the basic level this could be as simple as movement sensors, but newer network-connected sensors and artificial intelligence systems can “learn” the use patterns of a building and anticipate change in advance. In this way, a building can be divided up into zones which are only lit and heated when they’re used. What’s more, such a system could interface with a smart grid – knowing to heat a building, for example, when energy supply is high but demand is low. This would allow building stock to balance out supply variations in an energy system with a high percentage of renewables.
Smart Thermostats
Smart thermostats, like those made by Nest, automatically adjust to people’s habits, saving energy on heating and cooling in residential homes.
They could contribute to 2.6 Gt of emissions cuts up to 2050 according to Project Drawdown.
46
BU
ILD
ING
S
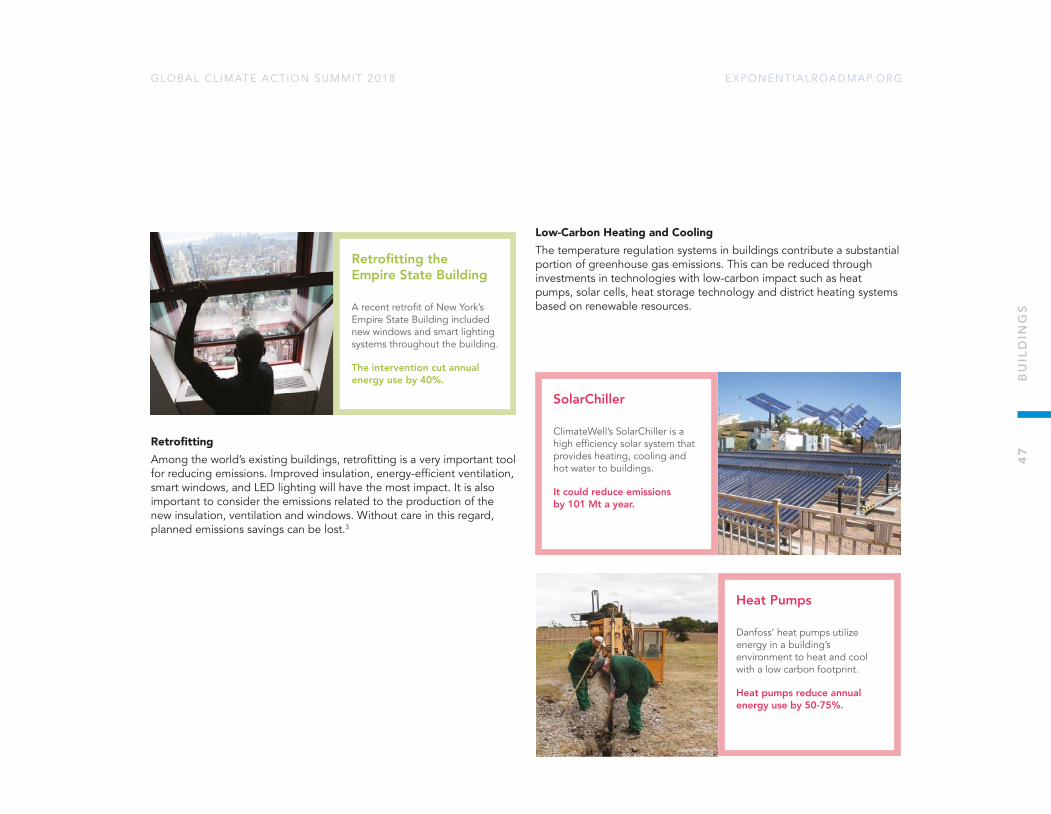
EXPONENTIALROADMAP.ORGGLOBAL CL IMATE ACTION SUMMIT 2018
RetrofittingAmong the world’s existing buildings, retrofitting is a very important tool for reducing emissions. Improved insulation, energy-efficient ventilation, smart windows, and LED lighting will have the most impact. It is also important to consider the emissions related to the production of the new insulation, ventilation and windows. Without care in this regard, planned emissions savings can be lost.3
Low-Carbon Heating and CoolingThe temperature regulation systems in buildings contribute a substantial portion of greenhouse gas emissions. This can be reduced through investments in technologies with low-carbon impact such as heat pumps, solar cells, heat storage technology and district heating systems based on renewable resources.
Retrofi tting the Empire State Building
A recent retrofi t of New York’s Empire State Building included new windows and smart lighting systems throughout the building.
The intervention cut annual energy use by 40%.
SolarChiller
ClimateWell’s SolarChiller is a high effi ciency solar system that provides heating, cooling and hot water to buildings.
It could reduce emissions by 101 Mt a year.
Heat Pumps
Danfoss’ heat pumps utilize energy in a building’s environment to heat and cool with a low carbon footprint.
Heat pumps reduce annual energy use by 50-75%.
47
BU
ILD
ING
S
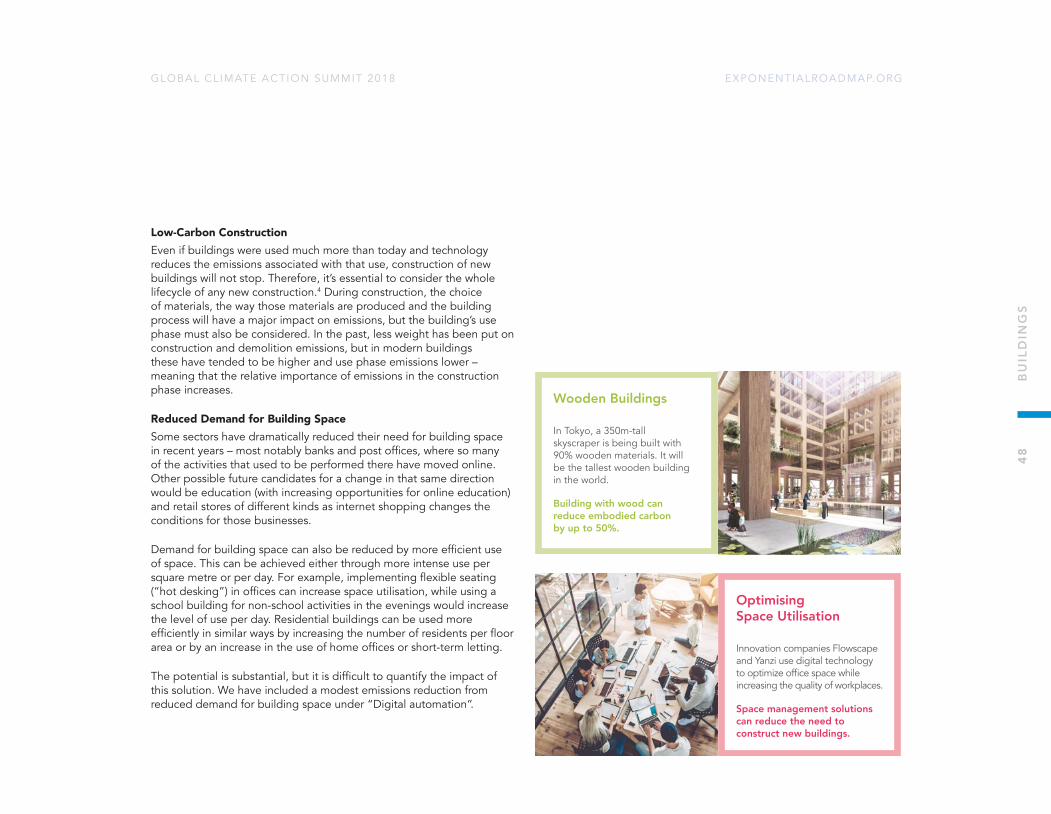
EXPONENTIALROADMAP.ORGGLOBAL CL IMATE ACTION SUMMIT 2018
Low-Carbon ConstructionEven if buildings were used much more than today and technology reduces the emissions associated with that use, construction of new buildings will not stop. Therefore, it’s essential to consider the whole lifecycle of any new construction.4 During construction, the choice of materials, the way those materials are produced and the building process will have a major impact on emissions, but the building’s use phase must also be considered. In the past, less weight has been put on construction and demolition emissions, but in modern buildings these have tended to be higher and use phase emissions lower – meaning that the relative importance of emissions in the construction phase increases.
Reduced Demand for Building SpaceSome sectors have dramatically reduced their need for building space in recent years – most notably banks and post offices, where so many of the activities that used to be performed there have moved online. Other possible future candidates for a change in that same direction would be education (with increasing opportunities for online education) and retail stores of different kinds as internet shopping changes the conditions for those businesses.
Demand for building space can also be reduced by more efficient use of space. This can be achieved either through more intense use per square metre or per day. For example, implementing flexible seating (“hot desking”) in offices can increase space utilisation, while using a school building for non-school activities in the evenings would increase the level of use per day. Residential buildings can be used more efficiently in similar ways by increasing the number of residents per floor area or by an increase in the use of home offices or short-term letting.
The potential is substantial, but it is difficult to quantify the impact of this solution. We have included a modest emissions reduction from reduced demand for building space under “Digital automation”.
Wooden Buildings
In Tokyo, a 350m-tall skyscraper is being built with 90% wooden materials. It will be the tallest wooden building in the world.
Building with wood can reduce embodied carbon by up to 50%.
Optimising Space Utilisation
Innovation companies Flowscape and Yanzi use digital technology to optimize offi ce space while increasing the quality of workplaces.
Space management solutions can reduce the need to construct new buildings.
48
BU
ILD
ING
S
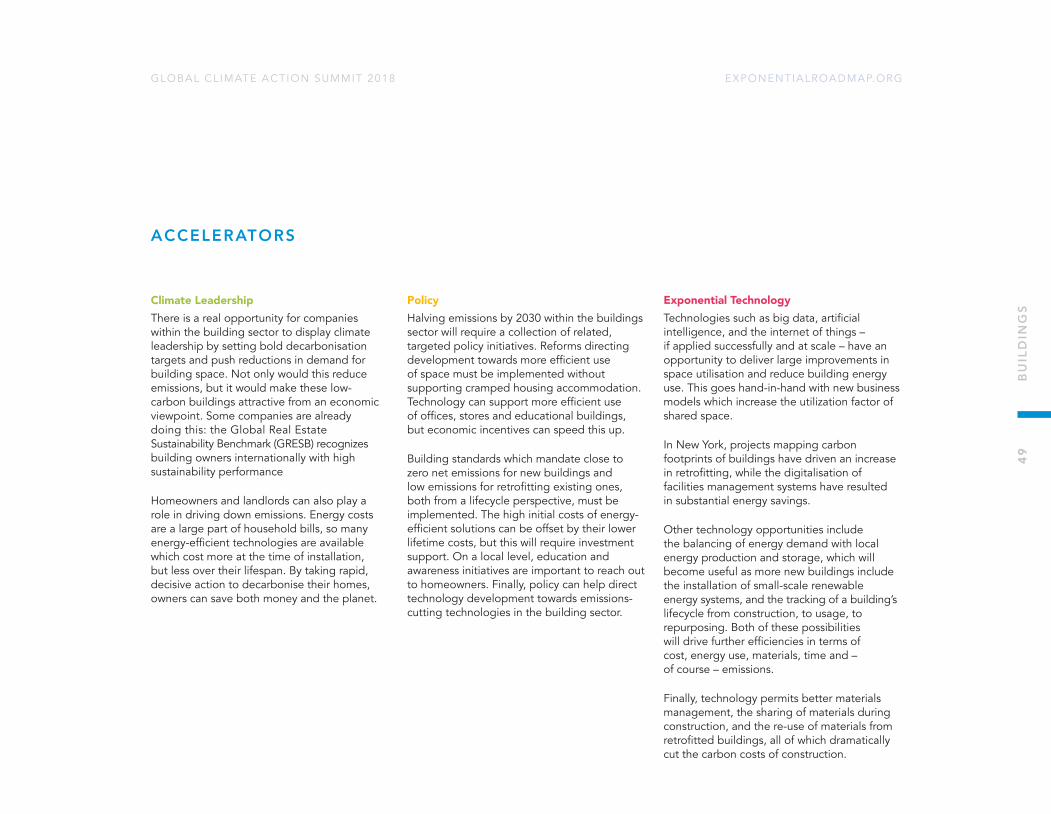
EXPONENTIALROADMAP.ORGGLOBAL CL IMATE ACTION SUMMIT 2018
Climate Leadership There is a real opportunity for companies within the building sector to display climate leadership by setting bold decarbonisation targets and push reductions in demand for building space. Not only would this reduce emissions, but it would make these low-carbon buildings attractive from an economic viewpoint. Some companies are already doing this: the Global Real Estate Sustainability Benchmark (GRESB) recognizes building owners internationally with high sustainability performance
Homeowners and landlords can also play a role in driving down emissions. Energy costs are a large part of household bills, so many energy-efficient technologies are available which cost more at the time of installation, but less over their lifespan. By taking rapid, decisive action to decarbonise their homes, owners can save both money and the planet.
PolicyHalving emissions by 2030 within the buildings sector will require a collection of related, targeted policy initiatives. Reforms directing development towards more efficient use of space must be implemented without supporting cramped housing accommodation. Technology can support more efficient use of offices, stores and educational buildings, but economic incentives can speed this up.
Building standards which mandate close to zero net emissions for new buildings and low emissions for retrofitting existing ones, both from a lifecycle perspective, must be implemented. The high initial costs of energy-efficient solutions can be offset by their lower lifetime costs, but this will require investment support. On a local level, education and awareness initiatives are important to reach out to homeowners. Finally, policy can help direct technology development towards emissions-cutting technologies in the building sector.
Exponential TechnologyTechnologies such as big data, artificial intelligence, and the internet of things – if applied successfully and at scale – have an opportunity to deliver large improvements in space utilisation and reduce building energy use. This goes hand-in-hand with new business models which increase the utilization factor of shared space.
In New York, projects mapping carbon footprints of buildings have driven an increase in retrofitting, while the digitalisation of facilities management systems have resulted in substantial energy savings.
Other technology opportunities include the balancing of energy demand with local energy production and storage, which will become useful as more new buildings include the installation of small-scale renewable energy systems, and the tracking of a building’s lifecycle from construction, to usage, to repurposing. Both of these possibilities will drive further efficiencies in terms of cost, energy use, materials, time and – of course – emissions.
Finally, technology permits better materials management, the sharing of materials during construction, and the re-use of materials from retrofitted buildings, all of which dramatically cut the carbon costs of construction.
ACCELERATORS
49
BU
ILD
ING
S
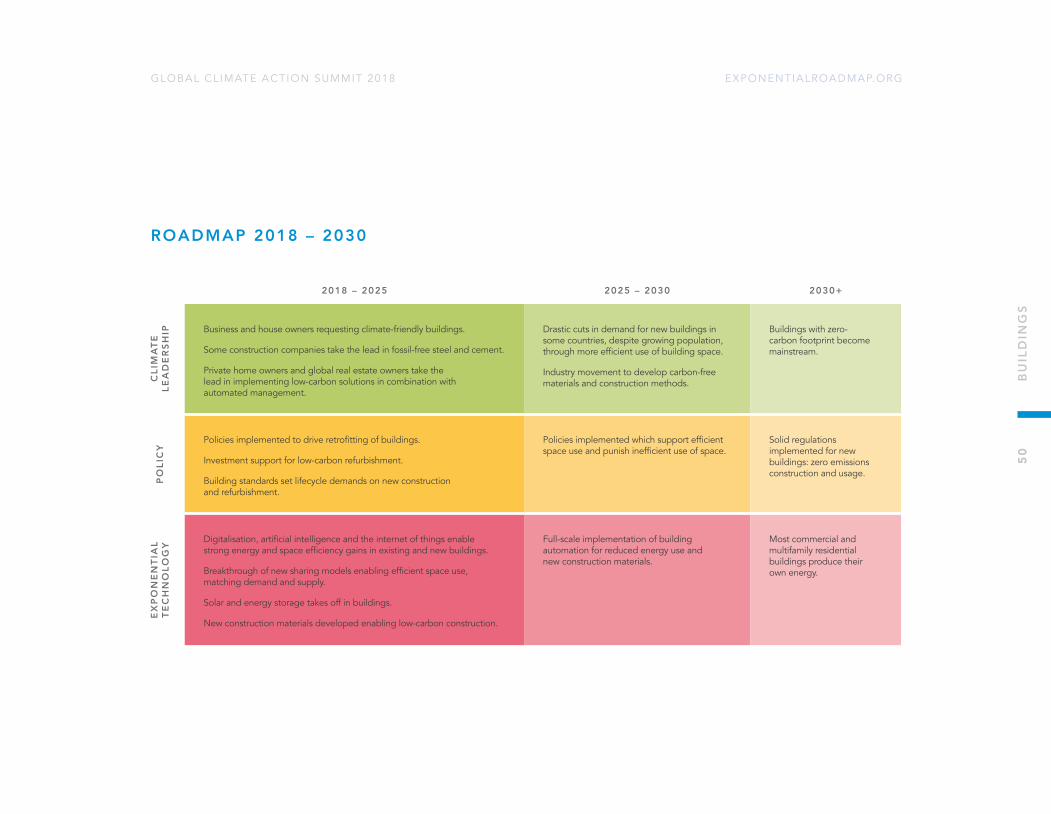
EXPONENTIALROADMAP.ORGGLOBAL CL IMATE ACTION SUMMIT 2018
ROADMAP 2018 – 2030
2018 – 2025 2025 – 2030 2030+
CLI
MA
TE
LEA
DE
RSH
IP Business and house owners requesting climate-friendly buildings.
Some construction companies take the lead in fossil-free steel and cement.
Private home owners and global real estate owners take the lead in implementing low-carbon solutions in combination with automated management.
Drastic cuts in demand for new buildings in some countries, despite growing population, through more efficient use of building space.
Industry movement to develop carbon-free materials and construction methods.
Buildings with zero-carbon footprint become mainstream.
PO
LIC
Y
Policies implemented to drive retrofitting of buildings.
Investment support for low-carbon refurbishment.
Building standards set lifecycle demands on new construction and refurbishment.
Policies implemented which support efficient space use and punish inefficient use of space.
Solid regulations implemented for new buildings: zero emissions construction and usage.
EX
PO
NE
NTI
AL
TE
CH
NO
LOG
Y Digitalisation, artificial intelligence and the internet of things enable strong energy and space efficiency gains in existing and new buildings.
Breakthrough of new sharing models enabling efficient space use, matching demand and supply.
Solar and energy storage takes off in buildings.
New construction materials developed enabling low-carbon construction.
Full-scale implementation of building automation for reduced energy use and new construction materials.
Most commercial and multifamily residential buildings produce their own energy.
50
BU
ILD
ING
S
EXPONENTIALROADMAP.ORGGLOBAL CL IMATE ACTION SUMMIT 2018
For countries, cities and companies, strong policies and programs to halve carbon emissions on both existing and new buildings are necessary. These solutions must scale globally to have a real impact.
In the construction and facilities management industries, individuals and companies must become true climate leaders, driving the halving of emissions and setting an example for others to follow.
New business models for sharing of space and making buildings smart.
Businesses must be open to new economic models that take advantage of the sharing of space.
Finally, solutions in this sector must be scalable around the world – rather than dispersed and fragmented.
THE WAY FORWARD
51
BU
ILD
ING
S

Yes, these solutions are available and economically viable.
CAN THIS BE ACHIEVED BY 2030?
Aviation remains problematic in the short-to-medium term, mass transit systems are expensive, capital costs are high and it may be difficult to change behaviour.
WHAT ARE THE BARRIERS TO ACHIEVING IT?
Carbon pricing can lower demand on high-emissions transportation, while technology and business models can make sustainable solutions cheaper and more attractive.
HOW CAN THOSE BARRIERS BE REDUCED OR ELIMINATED?
TRANSPORT
With ambitious measures, it should be possible for this sector to halve emissions
DO SOLUTIONS EXIST TO HALVE ANNUAL EMISSIONS IN THIS SECTOR GLOBALLY?

EXPONENTIALROADMAP.ORGGLOBAL CL IMATE ACTION SUMMIT 2018
CURRENT S ITUATION
Transport-related emissions total 11 Gt CO2e per year, which represents 21% of the global total. Most (73%) of these emissions come from short journeys, mainly in and around cities, in cars, motorbikes, buses and trucks. Economically viable technologies exist that can entirely replace these with clean mass transit systems and electric vehicles.1
The rest (27%) of the total is accounted for by long-haul transport, which includes shipping, aviation and heavy vehicles. While solutions exist to reduce fossil-fuel use in these sectors by 2030, even halving shipping and heavy vehicle emissions through technology and behavioural change, doing so, and going further, will require significant policy initiatives. Eliminating them completely is technically difficult.
TRAJECTORY
ENERGY BUILDINGS TRANSPORT FOOD AGRICULTURE & FORESTRYINDUSTRY
Mass transit
Bikes
Electric vehicles
Mobility and accessibilityReduced air transport
Efficient shippingRemote work and meetingsLow-emission trucks
2020Current emissions
2030First halving
Ann
ual e
mis
sion
s (%
)
75
50
25
51% reduction of the annual emission achieved for transport sector by 2030, which includes reduction of 1.03 Gt (25%) electricity and heat related emissions.
53
TRA
NSP
OR
T
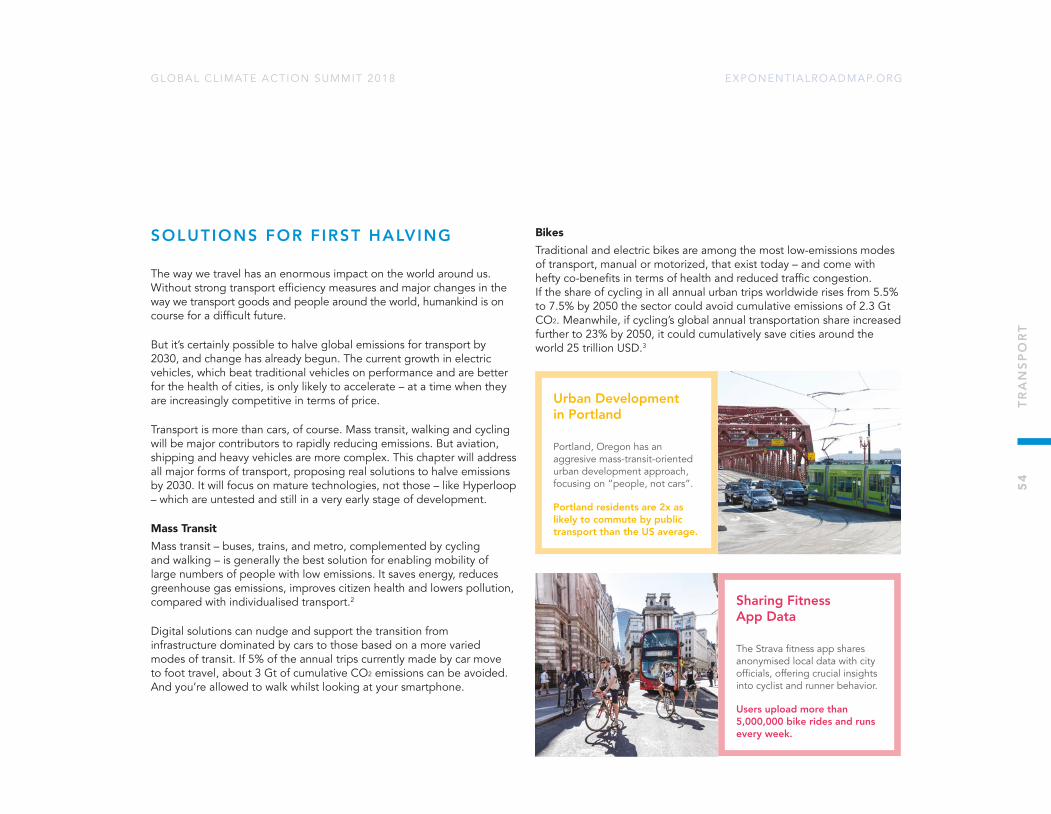
EXPONENTIALROADMAP.ORGGLOBAL CL IMATE ACTION SUMMIT 2018
SOLUTIONS FOR FIRST HALVING
The way we travel has an enormous impact on the world around us. Without strong transport efficiency measures and major changes in the way we transport goods and people around the world, humankind is on course for a difficult future.
But it’s certainly possible to halve global emissions for transport by 2030, and change has already begun. The current growth in electric vehicles, which beat traditional vehicles on performance and are better for the health of cities, is only likely to accelerate – at a time when they are increasingly competitive in terms of price.
Transport is more than cars, of course. Mass transit, walking and cycling will be major contributors to rapidly reducing emissions. But aviation, shipping and heavy vehicles are more complex. This chapter will address all major forms of transport, proposing real solutions to halve emissions by 2030. It will focus on mature technologies, not those – like Hyperloop – which are untested and still in a very early stage of development.
Mass TransitMass transit – buses, trains, and metro, complemented by cycling and walking – is generally the best solution for enabling mobility of large numbers of people with low emissions. It saves energy, reduces greenhouse gas emissions, improves citizen health and lowers pollution, compared with individualised transport.2
Digital solutions can nudge and support the transition from infrastructure dominated by cars to those based on a more varied modes of transit. If 5% of the annual trips currently made by car move to foot travel, about 3 Gt of cumulative CO2 emissions can be avoided. And you’re allowed to walk whilst looking at your smartphone.
BikesTraditional and electric bikes are among the most low-emissions modes of transport, manual or motorized, that exist today – and come with hefty co-benefits in terms of health and reduced traffic congestion. If the share of cycling in all annual urban trips worldwide rises from 5.5% to 7.5% by 2050 the sector could avoid cumulative emissions of 2.3 Gt CO2. Meanwhile, if cycling’s global annual transportation share increased further to 23% by 2050, it could cumulatively save cities around the world 25 trillion USD.3
Urban Development in Portland
Portland, Oregon has an aggresive mass-transit-oriented urban development approach, focusing on “people, not cars”.
Portland residents are 2x as likely to commute by public transport than the US average.
Sharing Fitness App Data
The Strava fi t ness app shares anonymised local data with city offi cials, offering crucial insights into cyclist and runner behavior.
Users up load more than 5,000,000 bike rides and runs every week.
54
TRA
NSP
OR
T
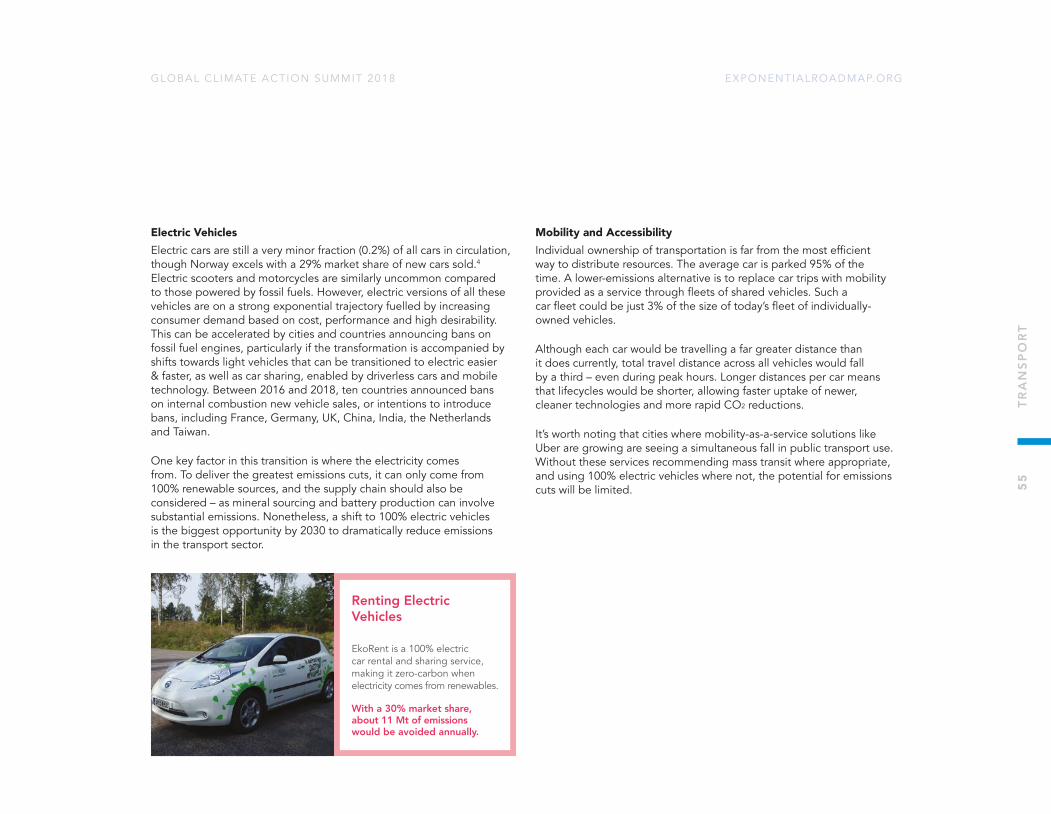
EXPONENTIALROADMAP.ORGGLOBAL CL IMATE ACTION SUMMIT 2018
Electric VehiclesElectric cars are still a very minor fraction (0.2%) of all cars in circulation, though Norway excels with a 29% market share of new cars sold.4 Electric scooters and motorcycles are similarly uncommon compared to those powered by fossil fuels. However, electric versions of all these vehicles are on a strong exponential trajectory fuelled by increasing consumer demand based on cost, performance and high desirability. This can be accelerated by cities and countries announcing bans on fossil fuel engines, particularly if the transformation is accompanied by shifts towards light vehicles that can be transitioned to electric easier & faster, as well as car sharing, enabled by driverless cars and mobile technology. Between 2016 and 2018, ten countries announced bans on internal combustion new vehicle sales, or intentions to introduce bans, including France, Germany, UK, China, India, the Netherlands and Taiwan.
One key factor in this transition is where the electricity comes from. To deliver the greatest emissions cuts, it can only come from 100% renewable sources, and the supply chain should also be considered – as mineral sourcing and battery production can involve substantial emissions. Nonetheless, a shift to 100% electric vehicles is the biggest opportunity by 2030 to dramatically reduce emissions in the transport sector.
Mobility and AccessibilityIndividual ownership of transportation is far from the most efficient way to distribute resources. The average car is parked 95% of the time. A lower-emissions alternative is to replace car trips with mobility provided as a service through fleets of shared vehicles. Such a car fleet could be just 3% of the size of today’s fleet of individually-owned vehicles.
Although each car would be travelling a far greater distance than it does currently, total travel distance across all vehicles would fall by a third – even during peak hours. Longer distances per car means that lifecycles would be shorter, allowing faster uptake of newer, cleaner technologies and more rapid CO2 reductions.
It’s worth noting that cities where mobility-as-a-service solutions like Uber are growing are seeing a simultaneous fall in public transport use. Without these services recommending mass transit where appropriate, and using 100% electric vehicles where not, the potential for emissions cuts will be limited.
Renting Electric Vehicles
EkoRent is a 100% electric car rental and sharing service, making it zero-carbon when electricity comes from renewables.
With a 30% market share, about 11 Mt of emissions would be avoided annually.
55
TRA
NSP
OR
T

EXPONENTIALROADMAP.ORGGLOBAL CL IMATE ACTION SUMMIT 2018
Reducing Demand for Air TravelLighter materials and more efficient propulsion systems mean emissions from modern planes are less intensive than previous generations, but the growth in the sector is dwarfing all improvements – and aircraft emissions high in the atmosphere have a disproportionately large impact on the climate. As such, emissions cuts in aviation are more difficult than in other parts of the transport sector.
Part of the solution is to reduce demand. Rail, shipping and road transport typically emit at least six times less greenhouse gas emissions than any aviation option for each tonne transported.5 Adopting the least-carbon intensive of these transport modes in a given region or circumstance will dent emissions – this is an opportunity for digitally-enhanced optimisation. High-speed rail and long-haul road are already competitive with aviation where routes exist, and these can be fully electrified. Where routes do not exist, however, construction will come with significant emissions.
Efficient ShippingIf the shipping industry was a country its greenhouse gas emissions would be the sixth largest emitter, but emissions from shipping were not included in the Paris Agreement. Previous analyses have shown that reducing shipping emissions is not simple,6 but in 2018, nations agreed to halve emissions from shipping by 2050.
This is a good first start, but more needs to happen and faster. Zero-emissions shipping is feasible, but may not be commercially competitive until at least 2030 without policy intervention. In the meantime, the industry must switch to lower carbon fuels, reduce speeds, optimise routes with digital technology, retrofit efficiency upgrades, and employ greater energy storage capabilities. Halving emissions from shipping is technically feasible and economically viable currently and this could be achieved by 2030 with the right policy incentives.
Delivering Flowers by Sea
Maersk StarFlower is a system solution that makes it possible to transport cut fl owers by sea rather than by air.
Delivering fl owers by boat rather than plane cuts relevant CO2 emissions by 98%.
56
TRA
NSP
OR
T

EXPONENTIALROADMAP.ORGGLOBAL CL IMATE ACTION SUMMIT 2018
Remote Work and MeetingsThe nature of working life is changing rapidly. Employees are demanding more flexibility to juggle family and work and reduce long commutes. Now, co-working hubs are springing up to allow staff to work close to home, which often make use of underutilised spaces. Such practices can reduce individual commuting emissions by around 50% annually. High-quality telepresence also has the potential to replace many business trips, saving cost, time and carbon emissions.
Low-Emission TrucksCommercial road transport can be fossil-free by 2050,7 but to halve emissions by 2030 it will be necessary to transition the industry to low-carbon modes of operation. Improved routing and better load management can cut annual emissions by 20%, while new fuel and powertrain technologies can provide additional reductions.
Biofuels are seen as a promising first step, but ultimately this part of the transport sector must also electrify. Long-haul electric trucks running on electric roads or equipped with large batteries could reach cost parity with diesel engines in about 10 years.
Reducing Truck Emissions
Scania’s Transport Lab is reducing truck emissions through driver behaviour, smart maintenance, aerodynamics and fi ll-rate optimisation.
CO2 emissions per tonne-km halved between 2008 and 2012.
Less Business Travel
Telia has implemented measures to reduce business travel in favour of more video conferencing and online meetings.
Air travel at Telia has fallen by almost 79%.
57
TRA
NSP
OR
T
EXPONENTIALROADMAP.ORGGLOBAL CL IMATE ACTION SUMMIT 2018
Climate Leadership Rapid shifts towards electric and hybrid vehicles in manufacturer portfolios will push this kind of transportation towards market share much faster than industry predictions if demand picks up. More companies are announcing phasing out internal combustion engines and ramping up hybrid and electric models. Corporates that rely on transport services must set ambitious targets for their emissions and hit them by increasing their use of electric and hybrid cars.
The transportation sector is a real opportunity for individuals to step up as climate leaders, reducing the amount they travel and choosing low-carbon modes of transportation over those associated with high emissions. Already, young people are displaying less interest in car ownership than previous generations, but this is balanced out by rapidly increasing demand for air travel.
Reducing air travel might seem like a backwards step in a globalising world, but there is room for a substantial cutback while still retaining some travel. Unnecessary journeys can be minimised without anyone missing them, and many goods can be transported by sea or rail.
PolicyMany cities and countries have announced policies to ban internal combustion engines in new vehicles, but more must do so. This one step will drive major changes in the transport industry, and must be ambitious. Major manufacturers are ready, and it is technically and economically feasible to set a start date of 2025 or 2030.
Investment in mass transit systems is essential to encourage a transition away from individual vehicles. Policies to encourage “mobility as a service” rather than individual ownership will also be crucial to accelerate this shift.
Aviation is one of the most difficult sectors to address, but long-term progress must start with more ambitious targets and significant investment in the next decade. Reduced demand should be a key policy goal, through more effective national and international carbon pricing, for example, and company policies to avoid air transport of goods and reduce staff flying, combined with efforts to increase telepresence and remote working. Behavioural change efforts to target the most frequent flyers should be encouraged.
Exponential TechnologyTechnology and transport have a lot in common. Both are seen as fundamental to meeting the needs of people in their personal and economic lives.
In the coming years, however, we must move away from a vision of mobility based on individual motorized transport, towards access through transport, prioritizing people and their quality of life, with strong attention to safety and social equity. Technology can allow us to make significant progress on the Sustainable Development Goals and the Paris Climate Agreement, improving the lives of billions of people around the world.
Real transformational change in the transport sector will require annual investments of around $2 trillion. That sounds like a lot, but business as usual has a much higher cost and investments will lead to fuel savings and lower operational costs, decreased congestion and reduced air pollution. These, and other, benefits of sustainable transport can deliver savings of up to $70 trillion by 2050.8
ACCELERATORS
58
TRA
NSP
OR
T
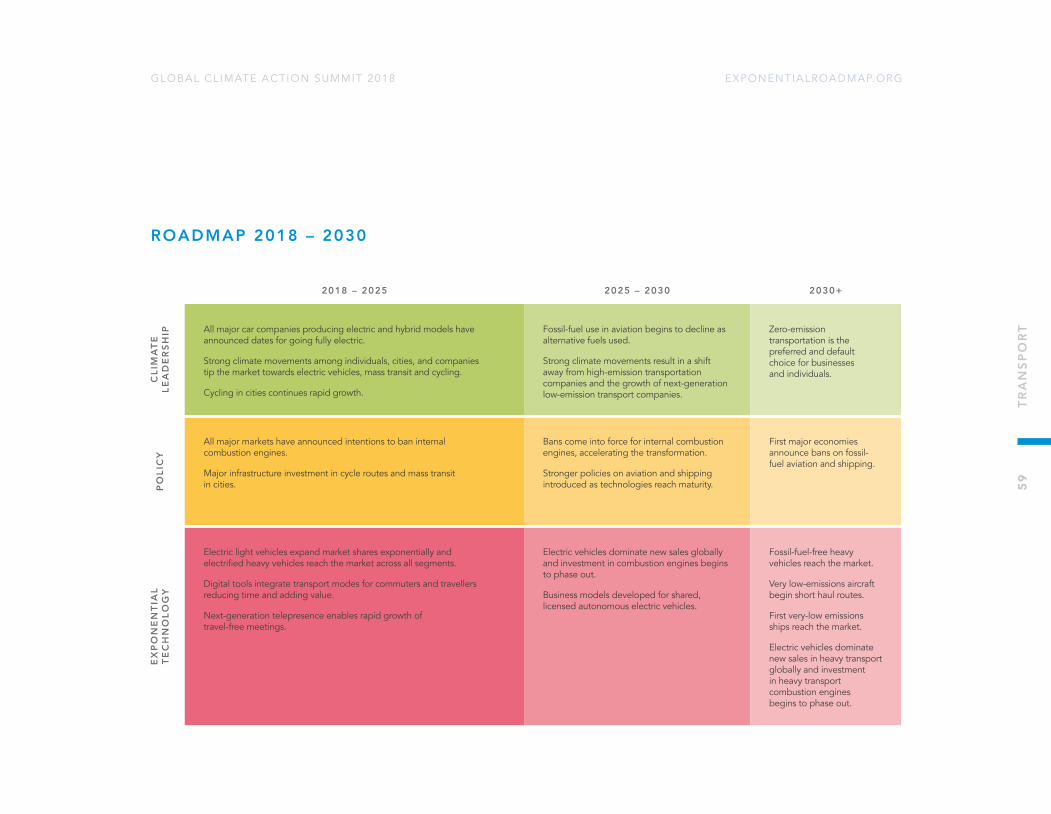
EXPONENTIALROADMAP.ORGGLOBAL CL IMATE ACTION SUMMIT 2018
ROADMAP 2018 – 2030
2018 – 2025 2025 – 2030 2030+
CLI
MA
TE
LEA
DE
RSH
IP All major car companies producing electric and hybrid models have announced dates for going fully electric.
Strong climate movements among individuals, cities, and companies tip the market towards electric vehicles, mass transit and cycling.
Cycling in cities continues rapid growth.
Fossil-fuel use in aviation begins to decline as alternative fuels used.
Strong climate movements result in a shift away from high-emission transportation companies and the growth of next-generation low-emission transport companies.
Zero-emission transportation is the preferred and default choice for businesses and individuals.
PO
LIC
Y
All major markets have announced intentions to ban internal combustion engines.
Major infrastructure investment in cycle routes and mass transit in cities.
Bans come into force for internal combustion engines, accelerating the transformation.
Stronger policies on aviation and shipping introduced as technologies reach maturity.
First major economies announce bans on fossil-fuel aviation and shipping.
EX
PO
NE
NTI
AL
TE
CH
NO
LOG
Y
Electric light vehicles expand market shares exponentially and electrified heavy vehicles reach the market across all segments.
Digital tools integrate transport modes for commuters and travellers reducing time and adding value.
Next-generation telepresence enables rapid growth of travel-free meetings.
Electric vehicles dominate new sales globally and investment in combustion engines begins to phase out.
Business models developed for shared, licensed autonomous electric vehicles.
Fossil-fuel-free heavy vehicles reach the market.
Very low-emissions aircraft begin short haul routes.
First very-low emissions ships reach the market.
Electric vehicles dominate new sales in heavy transport globally and investment in heavy transport combustion engines begins to phase out.
59
TRA
NSP
OR
T

EXPONENTIALROADMAP.ORGGLOBAL CL IMATE ACTION SUMMIT 2018
The highest emissions sources must be addressed first. Road-based transport is currently 70% of the problem. Introduce bans on sales of new cars with internal combustion engines.
Cities, companies, organisations and individuals should phase out the usage of internal combustion engines as soon as possible.
Corporations and investors should set science-based targets and roadmaps for full decarbonisation of transport emissions in their portfolios.
Incentivise a sharing economy and shift from vehicle ownership to usage.
Minimise air travel and goods transport.
Introduce a meaningful price on carbon and stricter emission standards for aviation and shipping emissions.
Implement policy for clear disclosure of carbon emissions in all business- and consumer-facing transport services.
Invest in R&D and acceleration of early stage high impact solutions for avoiding emissions from aviation, shipping and long-haul travel.
THE WAY FORWARD
60
TRA
NSP
OR
T
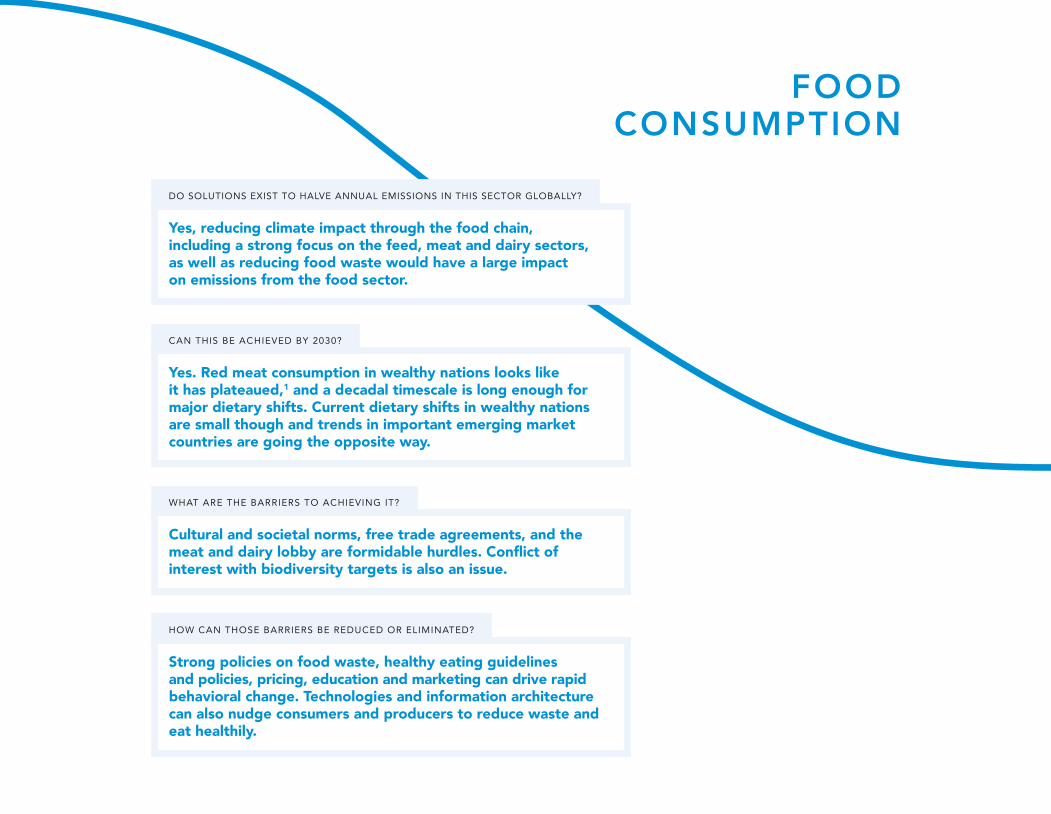
Yes, reducing climate impact through the food chain, including a strong focus on the feed, meat and dairy sectors, as well as reducing food waste would have a large impact on emissions from the food sector.
DO SOLUTIONS EXIST TO HALVE ANNUAL EMISSIONS IN THIS SECTOR GLOBALLY?
Yes. Red meat consumption in wealthy nations looks like it has plateaued,1 and a decadal timescale is long enough for major dietary shifts. Current dietary shifts in wealthy nations are small though and trends in important emerging market countries are going the opposite way.
CAN THIS BE ACHIEVED BY 2030?
Cultural and societal norms, free trade agreements, and the meat and dairy lobby are formidable hurdles. Conflict of interest with biodiversity targets is also an issue.
WHAT ARE THE BARRIERS TO ACHIEVING IT?
Strong policies on food waste, healthy eating guidelines and policies, pricing, education and marketing can drive rapid behavioral change. Technologies and information architecture can also nudge consumers and producers to reduce waste and eat healthily.
HOW CAN THOSE BARRIERS BE REDUCED OR ELIMINATED?
FOOD CONSUMPTION

EXPONENTIALROADMAP.ORGGLOBAL CL IMATE ACTION SUMMIT 2018
CURRENT S ITUATION
It is no surprise that feeding 7.6 billion people accounts for over about 22.5% of annual global emissions of greenhouse gases. Meat, aquaculture, eggs, and dairy occupy about 83% of the world’s farmland and contribute around 57% of food’s annual greenhouse gas emissions, yet provide just 18% of our calories.1
Meanwhile, rising incomes and urbanisation are driving a global dietary transition in which traditional diets are being replaced by diets higher in meat, refined sugars and saturated fats, which carry a far greater emissions burden. If this trend is not broken, diet will be a major contributor to an estimated 80% increase in greenhouse gas emissions per year and biodiversity loss from food and land clearing by 2050.2
TRAJECTORY
ENERGY BUILDINGS TRANSPORT FOOD AGRICULTURE & FORESTRYINDUSTRY
Reduced food waste
Plant-based diet
Composting
2020Current emissions
2030First halving
Ann
ual e
mis
sion
s (%
)
75
50
25
44% reduction of annual emissions achieved for food-consumption by 2030, which includes reduction of 0.16 Gt (6%) electricity and heat related emissions.
62
FOO
D C
ON
SUM
PTI
ON
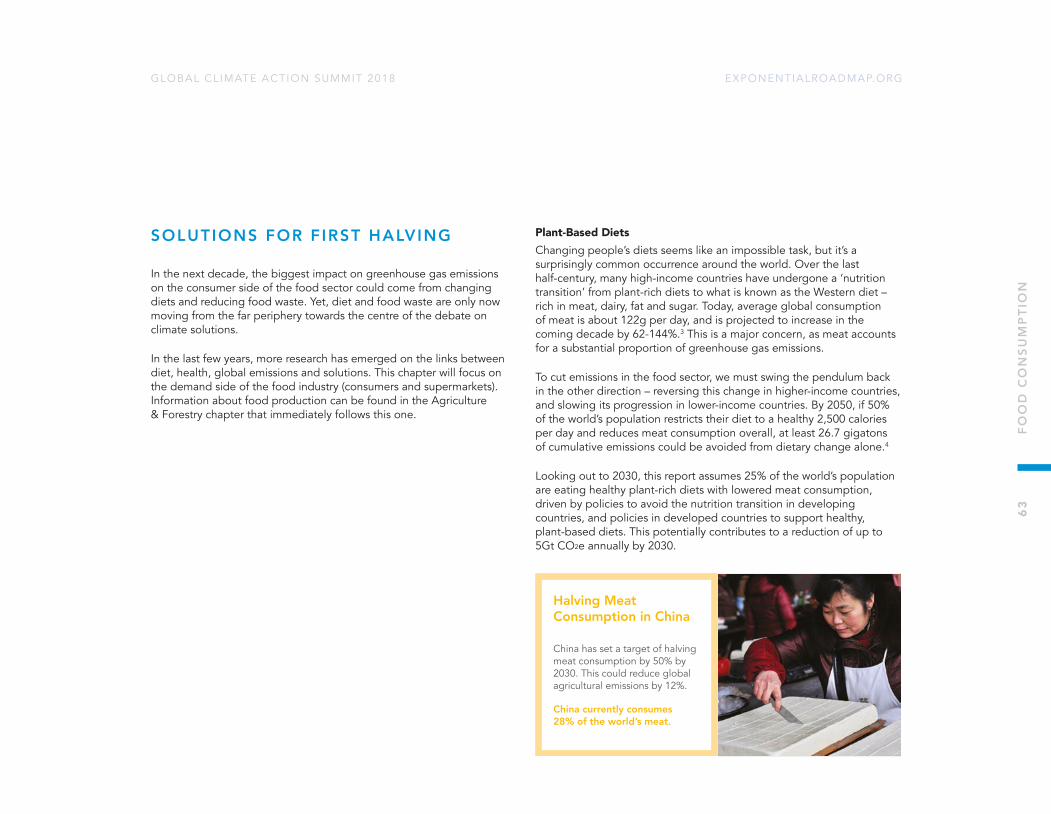
EXPONENTIALROADMAP.ORGGLOBAL CL IMATE ACTION SUMMIT 2018
SOLUTIONS FOR FIRST HALVING
In the next decade, the biggest impact on greenhouse gas emissions on the consumer side of the food sector could come from changing diets and reducing food waste. Yet, diet and food waste are only now moving from the far periphery towards the centre of the debate on climate solutions.
In the last few years, more research has emerged on the links between diet, health, global emissions and solutions. This chapter will focus on the demand side of the food industry (consumers and supermarkets). Information about food production can be found in the Agriculture & Forestry chapter that immediately follows this one.
Plant-Based DietsChanging people’s diets seems like an impossible task, but it’s a surprisingly common occurrence around the world. Over the last half-century, many high-income countries have undergone a ‘nutrition transition’ from plant-rich diets to what is known as the Western diet – rich in meat, dairy, fat and sugar. Today, average global consumption of meat is about 122g per day, and is projected to increase in the coming decade by 62-144%.3 This is a major concern, as meat accounts for a substantial proportion of greenhouse gas emissions.
To cut emissions in the food sector, we must swing the pendulum back in the other direction – reversing this change in higher-income countries, and slowing its progression in lower-income countries. By 2050, if 50% of the world’s population restricts their diet to a healthy 2,500 calories per day and reduces meat consumption overall, at least 26.7 gigatons of cumulative emissions could be avoided from dietary change alone.4
Looking out to 2030, this report assumes 25% of the world’s population are eating healthy plant-rich diets with lowered meat consumption, driven by policies to avoid the nutrition transition in developing countries, and policies in developed countries to support healthy, plant-based diets. This potentially contributes to a reduction of up to 5Gt CO2e annually by 2030.
Halving Meat Consumption in China
China has set a target of halving meat consumption by 50% by 2030. This could reduce global agricultural emissions by 12%.
China currently consumes 28% of the world’s meat.
63
FOO
D C
ON
SUM
PTI
ON
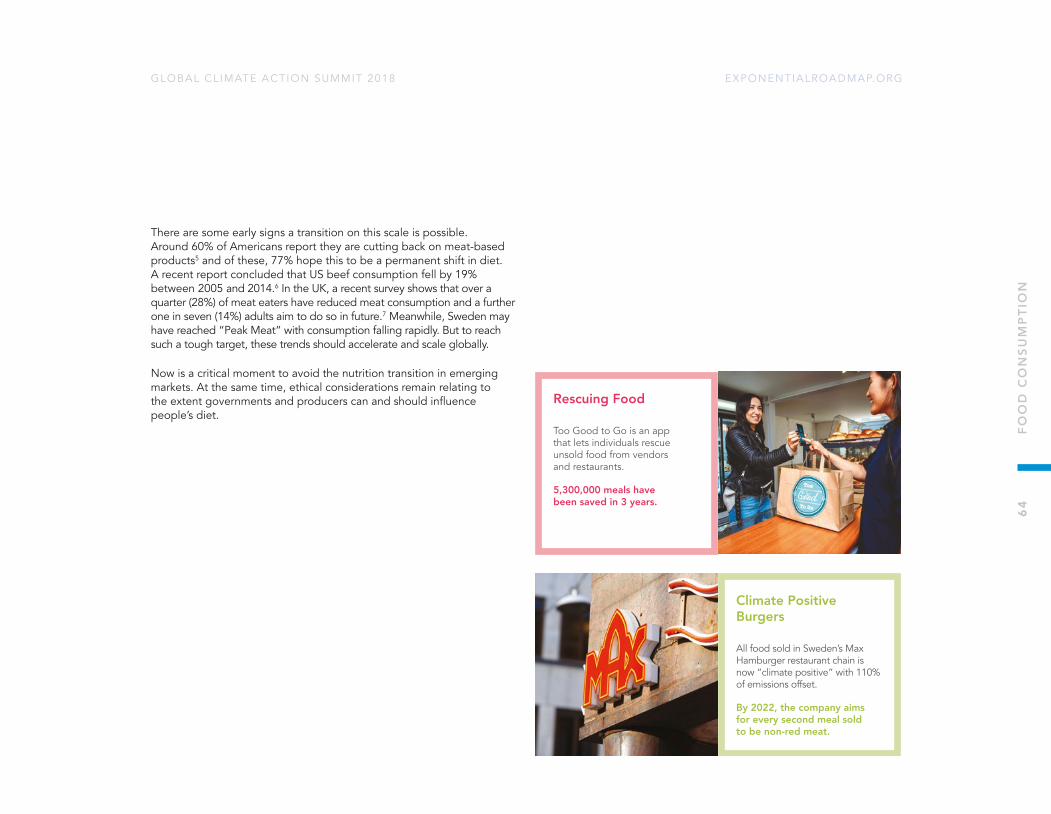
EXPONENTIALROADMAP.ORGGLOBAL CL IMATE ACTION SUMMIT 2018
There are some early signs a transition on this scale is possible. Around 60% of Americans report they are cutting back on meat-based products5 and of these, 77% hope this to be a permanent shift in diet. A recent report concluded that US beef consumption fell by 19% between 2005 and 2014.6 In the UK, a recent survey shows that over a quarter (28%) of meat eaters have reduced meat consumption and a further one in seven (14%) adults aim to do so in future.7 Meanwhile, Sweden may have reached “Peak Meat” with consumption falling rapidly. But to reach such a tough target, these trends should accelerate and scale globally.
Now is a critical moment to avoid the nutrition transition in emerging markets. At the same time, ethical considerations remain relating to the extent governments and producers can and should influence people’s diet.
Rescuing Food
Too Good to Go is an app that lets individuals rescue unsold food from vendors and restaurants.
5,300,000 meals have been saved in 3 years.
Climate Positive Burgers
All food sold in Sweden’s Max Hamburger restaurant chain is now “climate positive” with 110% of emissions offset.
By 2022, the company aims for every second meal sold to be non-red meat.
64
FOO
D C
ON
SUM
PTI
ON

EXPONENTIALROADMAP.ORGGLOBAL CL IMATE ACTION SUMMIT 2018
Reduced Food WasteAbout one third of the 1.3 billion tonnes of food produced each year is wasted.8 This waste is unevenly distributed – with higher-income countries wasting almost as much food annually as the entire net food production of sub-Saharan Africa. Relatively little food, on the other hand, is wasted in low-income economies. If food waste was a country it would be the third largest emitter of greenhouse gases behind China and the US, or about 8% of total annual anthropogenic greenhouse gas emissions.9
Reducing food waste is, therefore, a powerful strategy for cutting emissions associated with food consumption. On a business level, this means discouraging restaurants and supermarkets from throwing out food, or encouraging them to heavily discount it. In this logistical chain, technology can help cut food waste and provide flexible pricing schemes. Smartphone apps that allow climate- or just price-aware consumers to pay less for food that will be thrown out soon can also play a role. But food waste is complex. In wealthier countries consumers drive the most waste, in developing countries more waste occurs during production.
Expiration Dates
Whywaste simplifi es expiration date management at food retailers, eliminating food waste while cutting costs and reducing customer complaints.
Waste can be reduced on average by up to 20%.
Supermarkets
Swedish supermarket ICA has committed to help reduce household food-related CO2 emissions.
ICA says it can deliver 114 tonnes of CO2 reductions per household by 2030.
Outlawing Food Waste in the EU
In 2016, France outlawed food waste from supermarkets. The policy is contagious: Italy and Germany have since implemented similar curbs.
Food waste is linked to 8% of global greenhouse gas emissions.
65
FOO
D C
ON
SUM
PTI
ON
EXPONENTIALROADMAP.ORGGLOBAL CL IMATE ACTION SUMMIT 2018
Climate Leadership Major businesses are already beginning to act to reduce the environmental impact of food consumption. Kellogs, Pepsico, Bayer, DuPont, Danone, Mars, Nestle, Unilever and more have already pledged to accelerate necessary changes in global food systems. In 2016, a coalition of 30 leaders from business, governments and NGOs announced a new initiative to halve the amount of food wasted globally by 2030.4
Among consumers, the popularity of vegetarian, vegan and flexitarian diets is growing alongside the convenience of an increasing availability of products that facilitate it. With increasing awareness of the role that food plays in climate change, and careful application of nudge psychology from supermarkets and food companies, a long-term shift is possible.
PolicyThere are few examples of policy interventions to reduce consumption of high-emissions foods,10 however there are examples of interventions to reduce sugar consumption – mostly in the form of taxes – which could prove instructive. In addition to taxation, policymakers can encourage healthier and climate-friendly diets with clearer labelling on goods and certification schemes, as well as public health campaigns. Requirements for supply-chain transparency, policies to outlaw food waste and research into food system transformation can also play a useful role.
A more hands-off approach could involve catalysing rapid innovation in new technology. This can be done by encouraging new financing models within food systems, the creation of food tech hubs, and the development of new business. This approach will also mean supporting industries, companies and individuals who lose out in the transition to a more climate-friendly food system.
Exponential TechnologySeveral food technologies are being hyped at the time of writing, like lab-grown meat, but these are at an early stage of development. A system-wide disruption of the grocery store and supermarket industry is not as widely discussed, yet offers huge potential in the nearer term to reduce waste and drive a rapid dietary transition to healthier diets with lower carbon emissions.
In the US, Amazon is stepping in to grocery and in China Alibaba has already established itself as a player to watch. The disruption of grocery could be accompanied by a dietary revolution among the global middle classes in the 2020s.
Since 2013, there has been strong growth in food and agriculture tech and this is one of the four largest cleantech venture areas.To halve emissions by 2030, strategies are required to create the space and incentives for new technology to target everything from consumer behaviour to supply-chain transparency, while keeping a close eye on any unintended consequences that may emerge from this wellspring of innovation.
ACCELERATORS
66
FOO
D C
ON
SUM
PTI
ON

EXPONENTIALROADMAP.ORGGLOBAL CL IMATE ACTION SUMMIT 2018
ROADMAP 2018 – 2030
2018 – 2025 2025 – 2030 2030+
CLI
MA
TE
LEA
DE
RSH
IP Global transition towards healthy diets underway in all nations.
Food companies set emissions targets and improve trust and transparency aligned with societal goals.
Supermarkets, restaurant chains and food companies promote healthy plant-based diets and develop policies to scale these products.
Broad global acceptance of plant-based diets.
China halves meat-based emissions.
Broad acceptance of much-reduced food waste.
Food system operating within planetary boundaries.
Dramatic reduction in number of people overweight and obese.
PO
LIC
Y
Carbon pricing and supportive emission standards in the food system emerge rapidly.
National dietary guidelines promote healthy eating for people and planet.
Food waste policies enacted.
Removal of subsidies promoting unsustainable food system.
Greater innovation to reduce emissions and improve diets.
Stronger policies in developed nations push for food-sector emissions to at least halve by 2030.
Nutrition improves in developing countries in line with the UN’s Sustainable Development Goals (SDGs).
Developing countries reach SDG targets of ending hunger and improving health, while halving emissions.
EX
PO
NE
NTI
AL
TE
CH
NO
LOG
Y Technology drives a system-wide revolution in grocery stores and supermarkets, supporting a dietary transition and fall in food waste.
Full digital transparency of the supply chain for food, from the producer to the consumer.
Data analytics supports individual’s goals to eat healthier, reshaping dietary norms.
New technologies (internet of things, blockchain) accelerate the nutrition revolution and drive down food waste.
Biotech developments, including alternative proteins, now mainstream.
Digitalisation of food supply chain allows companies to easily target remaining greenhouse gas emissions and develop strategies to deal with them.
67
FOO
D C
ON
SUM
PTI
ON
EXPONENTIALROADMAP.ORGGLOBAL CL IMATE ACTION SUMMIT 2018
Food consumption is often overlooked when it comes to climate solutions. This needs to change.
On the policy side, new health guidelines and stronger targets on reduced meat consumption and food waste will enable accelerated action. These should be backed with large-scale awareness raising and marketing strategies.
Food producers and distributors, and technology companies moving into this sector, should communicate and collaborate to produce bolder strategies aligned to societal goals.
More investment is needed for innovation and technology to incentivise healthy diets and reduce food waste.
More behavioural research is needed relating to the shift towards plant-based diets.
Food delivery companies incentivise healthy eating, reduced waste and low- emissions transport.
THE WAY FORWARD
68
FOO
D C
ON
SUM
PTI
ON
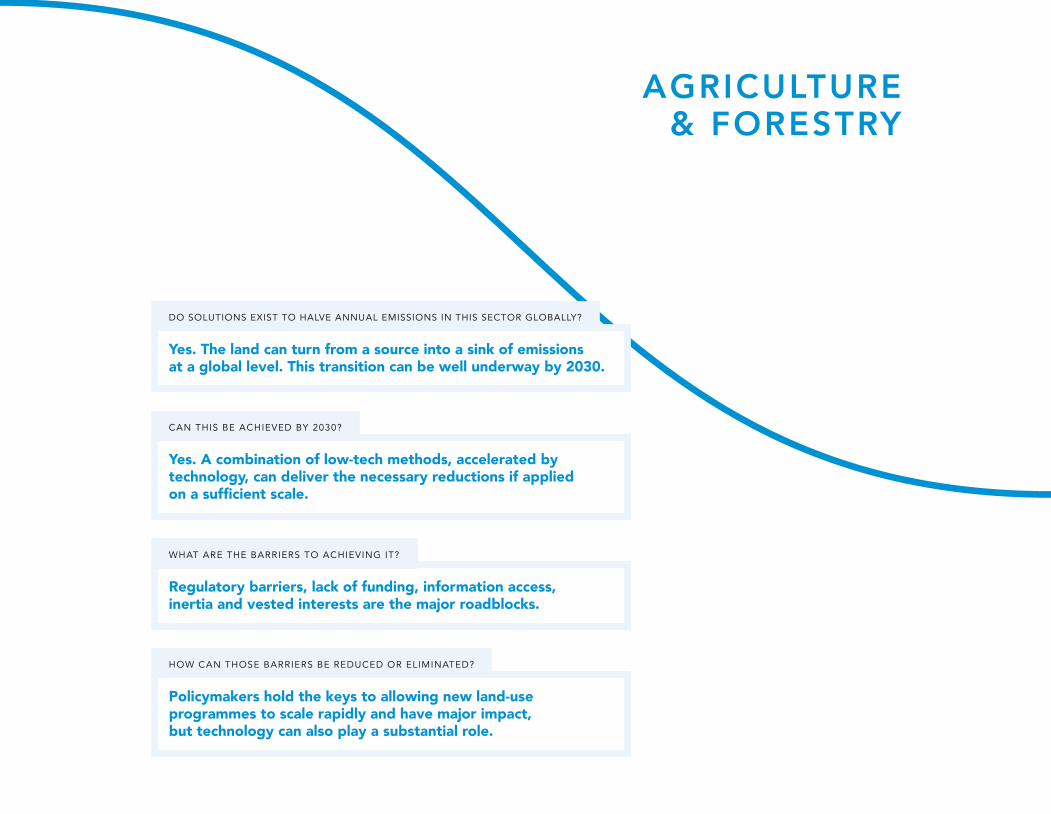
AGRICULTURE & FORESTRY
Yes. The land can turn from a source into a sink of emissions at a global level. This transition can be well underway by 2030.
DO SOLUTIONS EXIST TO HALVE ANNUAL EMISSIONS IN THIS SECTOR GLOBALLY?
Yes. A combination of low-tech methods, accelerated by technology, can deliver the necessary reductions if applied on a sufficient scale.
CAN THIS BE ACHIEVED BY 2030?
Regulatory barriers, lack of funding, information access, inertia and vested interests are the major roadblocks.
WHAT ARE THE BARRIERS TO ACHIEVING IT?
Policymakers hold the keys to allowing new land-use programmes to scale rapidly and have major impact, but technology can also play a substantial role.
HOW CAN THOSE BARRIERS BE REDUCED OR ELIMINATED?
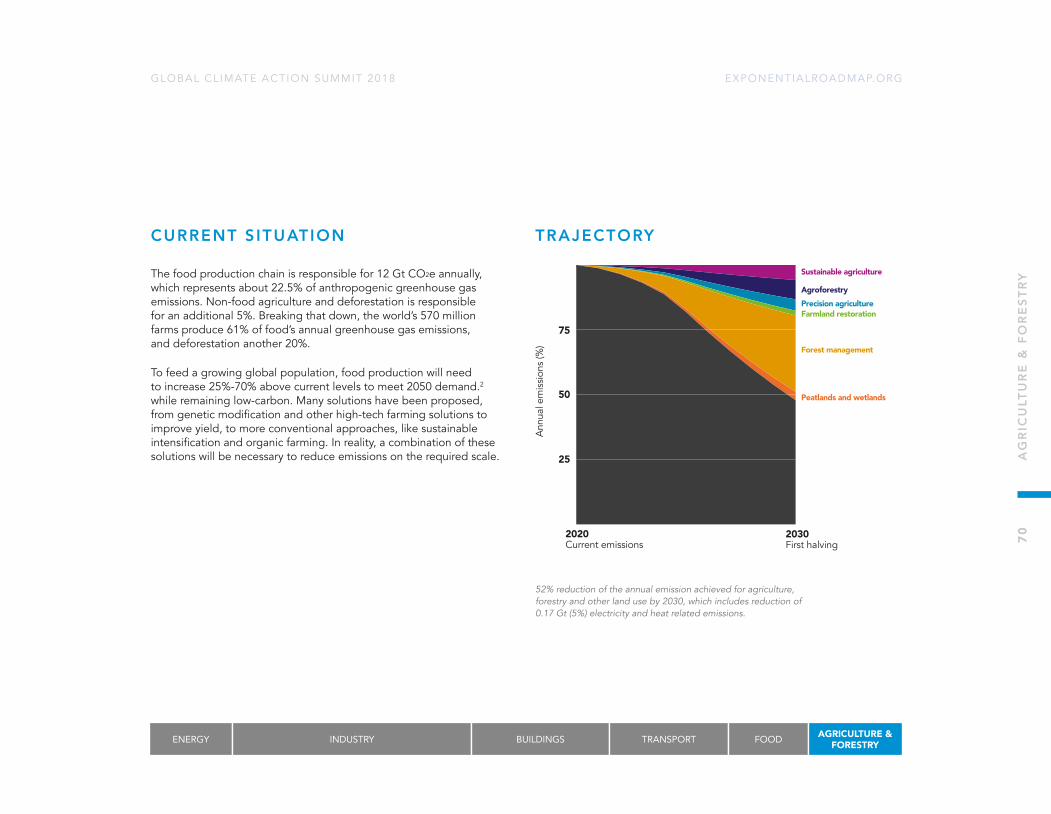
EXPONENTIALROADMAP.ORGGLOBAL CL IMATE ACTION SUMMIT 2018
CURRENT S ITUATION
The food production chain is responsible for 12 Gt CO2e annually, which represents about 22.5% of anthropogenic greenhouse gas emissions. Non-food agriculture and deforestation is responsible for an additional 5%. Breaking that down, the world’s 570 million farms produce 61% of food’s annual greenhouse gas emissions, and deforestation another 20%.
To feed a growing global population, food production will need to increase 25%-70% above current levels to meet 2050 demand.2 while remaining low-carbon. Many solutions have been proposed, from genetic modification and other high-tech farming solutions to improve yield, to more conventional approaches, like sustainable intensification and organic farming. In reality, a combination of these solutions will be necessary to reduce emissions on the required scale.
TRAJECTORY
ENERGY INDUSTRY BUILDINGS TRANSPORT FOOD AGRICULTURE & FORESTRY
Sustainable agriculture
AgroforestryPrecision agricultureFarmland restoration
Forest management
Peatlands and wetlands
2020Current emissions
2030First halving
Ann
ual e
mis
sion
s (%
)
75
50
25
52% reduction of the annual emission achieved for agriculture, forestry and other land use by 2030, which includes reduction of 0.17 Gt (5%) electricity and heat related emissions.
70
AG
RIC
ULT
UR
E &
FO
RE
STR
Y

EXPONENTIALROADMAP.ORGGLOBAL CL IMATE ACTION SUMMIT 2018
SOLUTIONS FOR FIRST HALVING
From farming to deforestation, to wetland and peatland use, human activity on the land generates greenhouse gas emissions at a huge scale. To meet the commitments made in the Paris Agreement, the land must turn from a source of emissions to a sink at scale. This will be one of the greatest challenges of the 21st century as the global population rises from 7.6 billion people to over 10 billion.
Some of the emissions from agriculture come from the direct release of greenhouse gases like methane and nitrous oxide, but deforestation and other land-use changes, where carbon sinks are removed in favour of more space to grow food, are another major driver of emissions.
This chapter will focus on the most effective strategies to increase food production while halving emissions by 2030. That means taking advantage of technology to catalyse the spread of what are mostly low-tech approaches. Despite their relative simplicity, these strategies, combined with high-tech precision agriculture, can deliver the necessary emissions cuts if applied at a large enough scale, as well as other benefits in terms of slowing biodiversity loss and species extinction.
Forest Protection and Reforestation Two of the most important actions that can scale rapidly are massive reforestation and halting deforestation. The world’s forests are a major carbon sink, but they’re under threat. Deforestation to create new areas for farming and livestock is resulting in the loss of 7.5 million hectares of forest annually.2 Massive reforestation and afforestation campaigns combined with protecting and restoring existing forests, will play a major role in cutting emissions in half by 2030. It will also create major new carbon storage capacity.
In the tropics, 300 million hectares of degraded land has the potential to be restored to continuous, intact forest. Cumulatively, this could sequester about 60 Gt CO2 by 2050.3 Globally, 570 million hectares of land could be restored and used to store carbon through forestry
or combined forestry and sustainable agriculture.3 New forests can also contribute. As of 2014, 287 million hectares of marginal land have been planted with trees, and if an additional 82 million hectares are added then potentially 18 Gt CO2 could be sequestered cumulatively by 2050.3
About three billion people cook on open fires. Fuel for these fires, often wood burning, accounts for over 2% of annual global emissions. In addition, indoor air pollution from open fires causes four million deaths a year. A global campaign to roll out cleaner cookstoves, powered by liquefied petroleum gas, has begun and is growing at a rate of about 1% per year. If this can be accelerated to 7-8% per year, then there is significant potential for emissions cuts – as much as 8 billion tonnes of cumulative CO2 emissions by 2030 according to some estimates.
Technology can play a highly important role in the transition from deforestation to reforestation. Much deforestation happens far from the eyes of officials, and by the time it is spotted it is often too late. But constellations of satellites now provide almost real-time imagery that can be used to identify and tackle problem points. Technology can also be used to assist tree planting at significant scales – drones can support the planting of 100,000 seeds per day.
Reforestation in China
China’s four-decade efforts to halt deforestation and scale up reforestation has stored carbon at scale.
By 2050, China’s forest strategies could store 14 billion tonnes of carbon.
71
AG
RIC
ULT
UR
E &
FO
RE
STR
Y
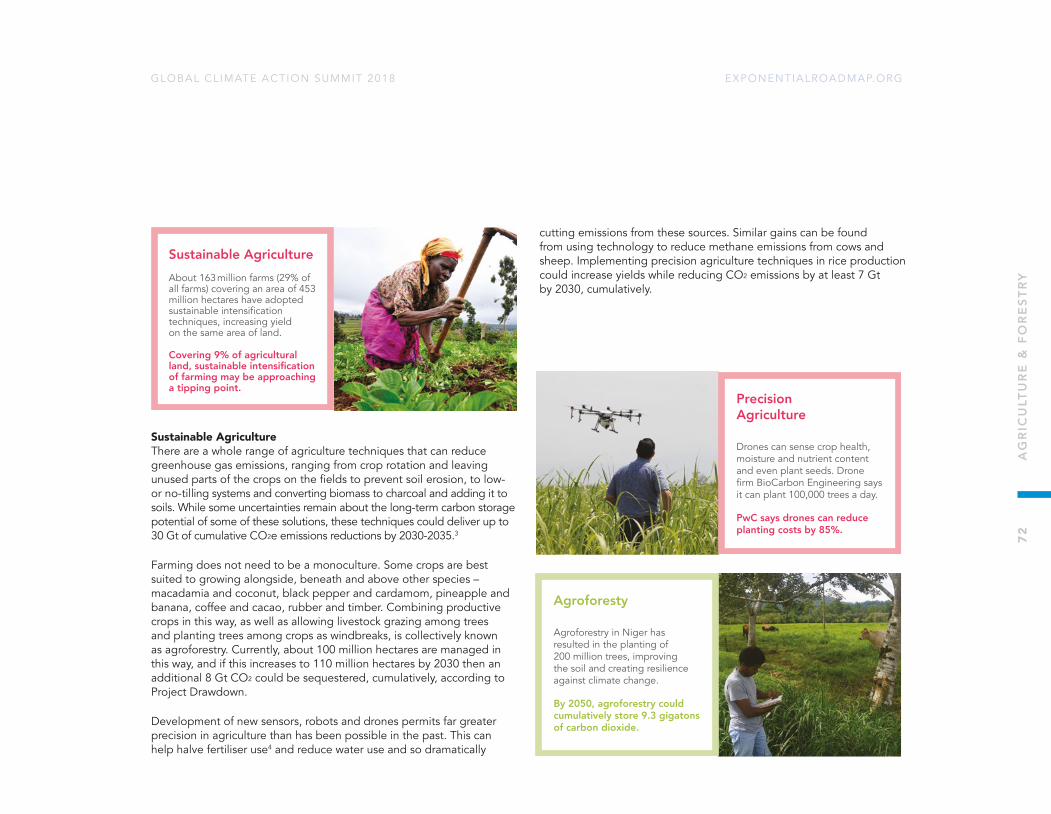
EXPONENTIALROADMAP.ORGGLOBAL CL IMATE ACTION SUMMIT 2018
Sustainable Agriculture There are a whole range of agriculture techniques that can reduce greenhouse gas emissions, ranging from crop rotation and leaving unused parts of the crops on the fields to prevent soil erosion, to low- or no-tilling systems and converting biomass to charcoal and adding it to soils. While some uncertainties remain about the long-term carbon storage potential of some of these solutions, these techniques could deliver up to 30 Gt of cumulative CO2e emissions reductions by 2030-2035.3
Farming does not need to be a monoculture. Some crops are best suited to growing alongside, beneath and above other species – macadamia and coconut, black pepper and cardamom, pineapple and banana, coffee and cacao, rubber and timber. Combining productive crops in this way, as well as allowing livestock grazing among trees and planting trees among crops as windbreaks, is collectively known as agroforestry. Currently, about 100 million hectares are managed in this way, and if this increases to 110 million hectares by 2030 then an additional 8 Gt CO2 could be sequestered, cumulatively, according to Project Drawdown.
Development of new sensors, robots and drones permits far greater precision in agriculture than has been possible in the past. This can help halve fertiliser use4 and reduce water use and so dramatically
cutting emissions from these sources. Similar gains can be found from using technology to reduce methane emissions from cows and sheep. Implementing precision agriculture techniques in rice production could increase yields while reducing CO2 emissions by at least 7 Gt by 2030, cumulatively.
Sustainable Agriculture About 163 million farms (29% of all farms) covering an area of 453 million hectares have adopted sustainable intensifi cation techniques, increasing yield on the same area of land.
Covering 9% of agricultural land, sustainable intensifi cation of farming may be approaching a tipping point.
Agroforesty
Agroforestry in Niger has resulted in the planting of 200 million trees, improving the soil and creating resilience against climate change.
By 2050, agroforestry could cumulatively store 9.3 gigatons of carbon dioxide.
Precision Agriculture
Drones can sense crop health, moisture and nutrient content and even plant seeds. Drone fi rm BioCarbon Engineering says it can plant 100,000 trees a day.
PwC says drones can reduce planting costs by 85%.
72
AG
RIC
ULT
UR
E &
FO
RE
STR
Y

EXPONENTIALROADMAP.ORGGLOBAL CL IMATE ACTION SUMMIT 2018
Farmland Restoration Desertification and soil erosion have forced the abandonment of about 400 million hectares of farmland worldwide. Restoration efforts, for example planting trees as windbreaks, growing grasses to stabilise dunes and planting nitrogen fixers like clover, can turn this around.
Restoring about half of that 400 million hectares to productive agriculture by 2030 could not only deliver an emissions reduction of 14 Gt of CO2, cumulatively, but also provide 10 billion tonnes of additional food and a financial return of $1.3 trillion.3
Peatland Restoration Globally, peatlands cover up to 440 million hectares, or about 3% of global land area,5,6 and happen to be one of the most important carbon sinks on the planet – storing an estimated 500-600 Gt CO2.7,8 Draining peatlands for agriculture releases carbon dioxide and creates fire risks. Peatland fires can smoulder for months. Restoring and protecting peatlands will be an increasingly important solution to managing the global carbon budget.
About 1% of the world’s peatlands are currently protected. Protecting intact peatland could avoid up to 22 Gt of CO2 emissions, cumulatively. To start with, this means increasing the area of protected peatlands from 3 million hectares to over 120 million by 2030 according to Project Drawdown.
Protecting Peatland
The Katingan Mentaya Project has prevented emissions equivalent to 25 Mt of CO2 by protecting peatland habitats in Indonesia.
Protecting 67% of all intact peatland could avoid up to 22 Gt of CO2 emissions, cumulatively.
Grain to Green
In China, on the Loess Plateau, vegetation cover has increased from 31.6% to 59.6% largely due to conversion of agricultural land.
The plateau’s soils could store 6 Mt of carbon per year.
73
AG
RIC
ULT
UR
E &
FO
RE
STR
Y

EXPONENTIALROADMAP.ORGGLOBAL CL IMATE ACTION SUMMIT 2018
Climate Leadership For agriculture and forestry businesses, both big and small, there are many opportunities to display climate leadership. The New York Declaration on Forests, launched in 2014, aims to halve deforestation by 2020 and to end it by 2030. The declaration’s 10 targets have the potential to reduce annual emissions by 4.5 to 8.8 Gt of CO2.9 The declaration has been endorsed by more than 50 governments, more than 50 of the world’s biggest companies, and more than 50 civil society and indigenous peoples’ organizations.
Large investors are also challenging agribusinesses to change their game. In 2015, Norway’s pension fund, the world’s largest sovereign wealth fund, divested from 11 companies – including six palm oil companies – due to their connections to deforestation. Finally, the Global Agricultural Alliance brings together producers, traders, fertiliser and agrochemical manufacturers, seed suppliers, and agri-tech suppliers to help companies to share best practices and collaborate on common approaches to sustainable agriculture.
PolicyThe economic incentives driving unsustainable agricultural practices and deforestation are huge. Private investment has contributed $414 billion to farming, forestry and fisheries operations in countries suffering deforestation crises in recent years.
Since 2010, out of $167 billion given by developed countries and major donors for mitigation-related development finance – just $3.6 billion has gone to forestry. Meanwhile, the same countries received $87 billion in development finance for agriculture, the sector most responsible for tropical forest loss.10
These policy contradictions should be avoided, combining sustainable agriculture with forest management to increase yield and drive growth. This is a win-win situation for everyone. Consistency is a vital component of policy interventions in this sector, however. A stable, consistent approach on a timescale of decades is necessary for farmers to make the long-term investments necessary to deliver a halving of emissions.11
Exponential TechnologyThe arrival of the internet in all corners of the globe provides a unique opportunity to arm farmers and those in the agriculture sector with the tools, information and education to transform the way they do business.
Many of the solutions necessary to deliver a halving of emissions rely on behavioural change – more efficient farming, adopting new techniques and reverting to older techniques. Technology firms need to focus heavily on reducing friction in these areas, making it easy for farmers to access information and act on that information.
Exponential action will require system-wide changes, supported by policy, and major shifts in consumer demand. First and foremost, a major movement to rapidly roll out reforestation efforts on a grand scale is now essential. Large-scale efforts in China over the last forty years show this is possible – learning from those experiences should allow rapid scaling of real change in the coming years.
ACCELERATORS
74
AG
RIC
ULT
UR
E &
FO
RE
STR
Y

EXPONENTIALROADMAP.ORGGLOBAL CL IMATE ACTION SUMMIT 2018
ROADMAP 2018 – 2030
2018 – 2025 2025 – 2030 2030+
CLI
MA
TE
LEA
DE
RSH
IP
Agro-businesses, farms, and civil society develop a worldwide strategy for sustainable food systems to drive healthier, plant-based diets.
Deforestation halted globally.
Unprecedented global reforestation efforts underway to support mitigation efforts.
All major agribusinesses on track to halve emissions.
Beef production scaled back and land transformed to sustainable intensification of agriculture.
Agriculture sector globally on track to store more carbon than it emits.
Agroforestry is adopted widely.
PO
LIC
Y
Effective payment incentives scale up rapidly to promote reforestation, peatland management and sustainable agriculture.
Stronger policies and financial instruments expand to cover all greenhouse gases.
Technology transfer: ambitious policies and high levels of investment lead to high adoption among farmers everywhere of sustainable agriculture opportunities.
Countries have published maps of areas with potential for reforestation, farmland restoration and sustainable agriculture.
Price on carbon increases annually accelerating business models for carbon storage on land and reforestation efforts.
Trials of sustainable sequestration schemes of the order of 100 to 500 Mt CO2/year are underway.
All agricultural policies support sustainable agriculture and forestry and perverse subsidies eliminated.
Reforestation economically and socially viable and scaling rapidly.
EX
PO
NE
NTI
AL
TE
CH
NO
LOG
Y Internet coverage reaches all farming areas accelerating adoption of digital solutions and precision agriculture – supported by major tech companies.
Farming solutions tailored to individual farms reach global potential.
Seed-planting via drones accelerates massive afforestation efforts.
Monitoring from space provides real-time reforestation, land restoration and sustainable agriculture information.
Precision agriculture becomes a dominant technique reducing fertiliser and water use and increasing yields.
Technology allows complete visibility of land health and is linked to incentives for sustainable agriculture.
75
AG
RIC
ULT
UR
E &
FO
RE
STR
Y

EXPONENTIALROADMAP.ORGGLOBAL CL IMATE ACTION SUMMIT 2018
Despite public concern and dozens of policies, deforestation continues and agriculture’s carbon footprint keeps spreading. This will be the hardest sector to halve emissions rapidly. The good news is that just a small suite of solutions are needed to achieve the goal. Some of the solutions are resolutely low tech – plant trees, crop rotation – but these can be accelerated by technology. Others such as precision agriculture will be enhanced by big data, the internet of things and, simply, internet access.
Technology is on the cusp of providing real-time complete visibility of land and oceans, analyzing problems and opportunities at a farm scale allowing policy incentives to be implemented within days
or weeks. The internet will reach all but the most remote places on Earth within a decade allowing farmers access to knowledge and data about their own farm and how its yields can rise and emissions fall.
The world also needs an unprecedented public-private partnership of the ICT giants with agribusinesses, farmers and satellite data providers to build the toolkit for sustainable agriculture and reforestation at farm-to-global scale. The defaults for such a toolkit should including maximising carbon storage and yield.
THE WAY FORWARD
76
AG
RIC
ULT
UR
E &
FO
RE
STR
Y
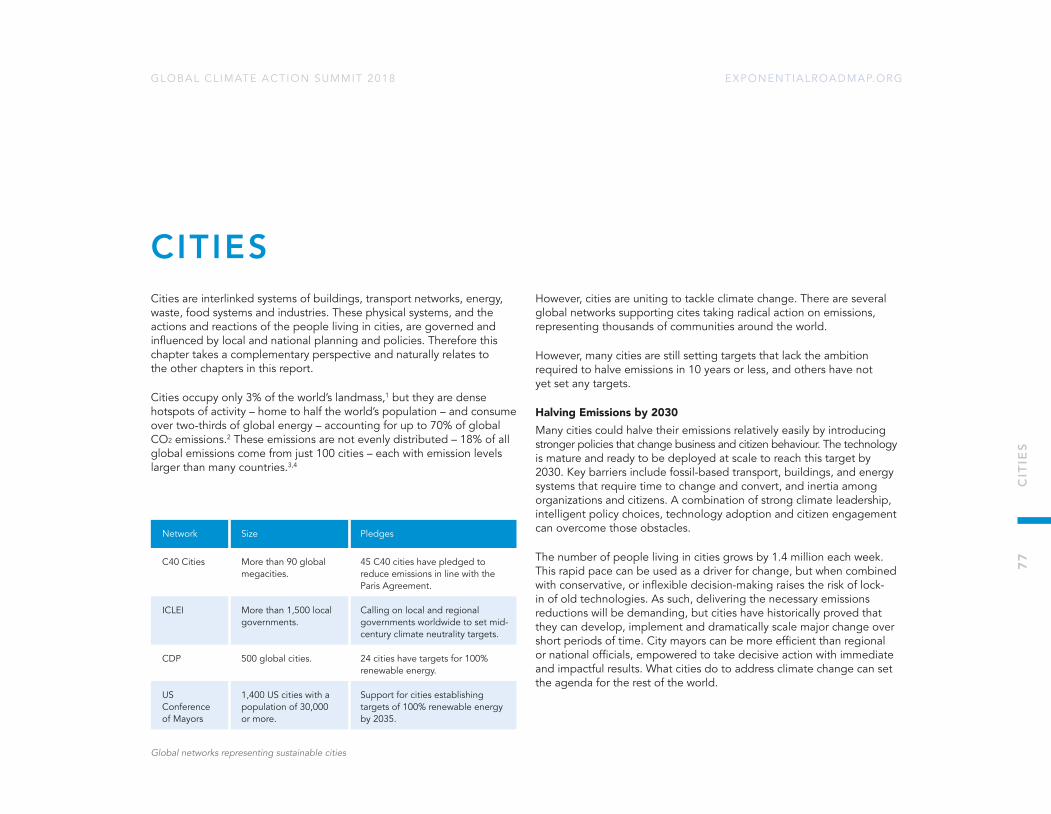
EXPONENTIALROADMAP.ORGGLOBAL CL IMATE ACTION SUMMIT 2018
77
CIT
IES
C ITIESCities are interlinked systems of buildings, transport networks, energy, waste, food systems and industries. These physical systems, and the actions and reactions of the people living in cities, are governed and influenced by local and national planning and policies. Therefore this chapter takes a complementary perspective and naturally relates to the other chapters in this report.
Cities occupy only 3% of the world’s landmass,1 but they are dense hotspots of activity – home to half the world’s population – and consume over two-thirds of global energy – accounting for up to 70% of global CO2 emissions.2 These emissions are not evenly distributed – 18% of all global emissions come from just 100 cities – each with emission levels larger than many countries.3,4
However, cities are uniting to tackle climate change. There are several global networks supporting cites taking radical action on emissions, representing thousands of communities around the world.
However, many cities are still setting targets that lack the ambition required to halve emissions in 10 years or less, and others have not yet set any targets.
Halving Emissions by 2030Many cities could halve their emissions relatively easily by introducing stronger policies that change business and citizen behaviour. The technology is mature and ready to be deployed at scale to reach this target by 2030. Key barriers include fossil-based transport, buildings, and energy systems that require time to change and convert, and inertia among organizations and citizens. A combination of strong climate leadership, intelligent policy choices, technology adoption and citizen engagement can overcome those obstacles.
The number of people living in cities grows by 1.4 million each week. This rapid pace can be used as a driver for change, but when combined with conservative, or inflexible decision-making raises the risk of lock-in of old technologies. As such, delivering the necessary emissions reductions will be demanding, but cities have historically proved that they can develop, implement and dramatically scale major change over short periods of time. City mayors can be more efficient than regional or national officials, empowered to take decisive action with immediate and impactful results. What cities do to address climate change can set the agenda for the rest of the world.
Network Size Pledges
C40 Cities More than 90 global megacities.
45 C40 cities have pledged to reduce emissions in line with the Paris Agreement.
ICLEI More than 1,500 local governments.
Calling on local and regional governments worldwide to set mid-century climate neutrality targets.
CDP 500 global cities. 24 cities have targets for 100% renewable energy.
US Conference of Mayors
1,400 US cities with a population of 30,000 or more.
Support for cities establishing targets of 100% renewable energy by 2035.
Global networks representing sustainable cities

EXPONENTIALROADMAP.ORGGLOBAL CL IMATE ACTION SUMMIT 2018
Key StrategiesThe most effective ways for cities to halve emissions are renewable electricity, low-carbon buildings, transport and waste management solutions, as well as the adoption of sustainable lifestyles by citizens.
Many cities could achieve an electrical grid mix of 50–70% renewables (specifically, solar and wind, balanced with other zero-emission generation sources such as hydro) by 2030. This level would capture 25–45% of the total emission reduction needed in that time frame.5 More detail on accelerating the rollout of renewable energy can be found in the Energy Systems chapter (page 19).
Energy- and space-efficient buildings, along with low-carbon construction, can close 20–55% of the gap between current emissions trends and 2030 targets, depending on the local climate and population growth of the city. This strategy is crucial, as emissions from construction alone could exhaust the global carbon budget for well below 2 degrees if strict demands for low carbon construction and infrastructure are not in place.4 Near-zero carbon construction is currently at an early stage of development, but feasible on the timescale of a decade. In addition, city governments must ensure that the public procurement process selects the most sustainable options.6 The infrastructure built before 2030 will determine whether humanity achieves the Paris Agreement or not. More detail on reducing the carbon cost of both existing buildings and new construction can be found in the Buildings chapter (page 44).
Low-carbon mobility, such as public transport, cycling, electrical vehicles, car-sharing and pooling, and mobility-as-a-service systems, can contribute emission reductions equal to 20–45% of the 2030 targets, depending on urban income levels and population density.4 More detail on halving emissions in the travel sector can be found in the Transport chapter (page 52).
Depending on the starting point of existing waste management services, as well as composition of waste, focused acceleration can achieve up to 10% of the emissions reductions needed by 2030.4 Improved waste management, as a strategy for reducing emissions, is covered in the Industry chapter (page 28).
It’s worth noting that to date cities have typically only considered emissions within their boundaries when developing climate action plans, not the emissions of imported goods and services. This is not a fair or accurate approach to estimating the real impact that cities have, and should change if they’re to really get to grips with emissions originating in the supply chains that support them.
Ambitious cities that adopt Paris-aligned emissions targets and actions plans should ensure that those targets account for imported emissions
Copenhagen
Copenhagen has set a sharp goal for carbon neutrality, with programs for cycling, public transport, recycling and green space access.
Approximately 62% Copenhagen’s population cycles to work or school.
Cape Town
Cape Town’s WhereIsMyTransport app makes public transport appealing and accessible, especially for those who depended on private vehicles.
The app tracks 1,000+ formal and informal bus and taxi routes.
78
CIT
IES
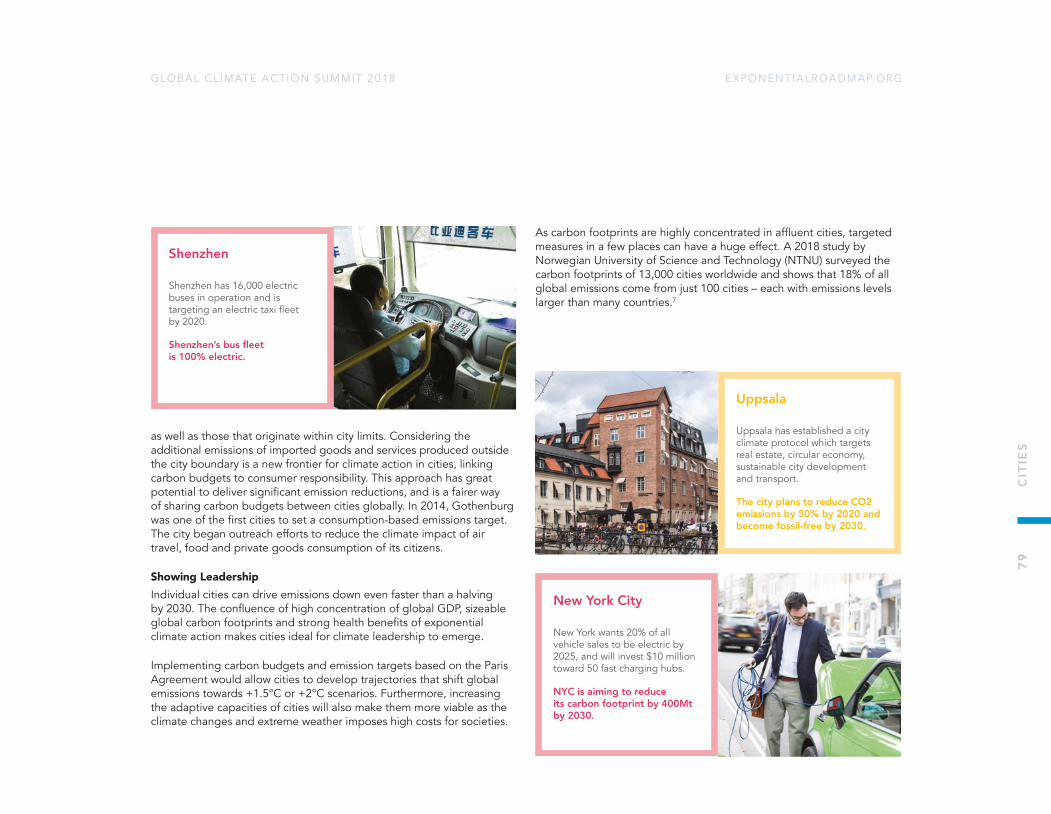
EXPONENTIALROADMAP.ORGGLOBAL CL IMATE ACTION SUMMIT 2018
as well as those that originate within city limits. Considering the additional emissions of imported goods and services produced outside the city boundary is a new frontier for climate action in cities, linking carbon budgets to consumer responsibility. This approach has great potential to deliver significant emission reductions, and is a fairer way of sharing carbon budgets between cities globally. In 2014, Gothenburg was one of the first cities to set a consumption-based emissions target. The city began outreach efforts to reduce the climate impact of air travel, food and private goods consumption of its citizens.
Showing LeadershipIndividual cities can drive emissions down even faster than a halving by 2030. The confluence of high concentration of global GDP, sizeable global carbon footprints and strong health benefits of exponential climate action makes cities ideal for climate leadership to emerge.
Implementing carbon budgets and emission targets based on the Paris Agreement would allow cities to develop trajectories that shift global emissions towards +1.5°C or +2°C scenarios. Furthermore, increasing the adaptive capacities of cities will also make them more viable as the climate changes and extreme weather imposes high costs for societies.
As carbon footprints are highly concentrated in affluent cities, targeted measures in a few places can have a huge effect. A 2018 study by Norwegian University of Science and Technology (NTNU) surveyed the carbon footprints of 13,000 cities worldwide and shows that 18% of all global emissions come from just 100 cities – each with emissions levels larger than many countries.7
Shenzhen
Shenzhen has 16,000 electric buses in operation and is targeting an electric taxi fl eet by 2020.
Shenzhen’s bus fl eet is 100% electric.
Uppsala
Uppsala has established a city climate protocol which targets real estate, circular economy, sustainable city development and transport.
The city plans to reduce CO2 emissions by 50% by 2020 and become fossil-free by 2030.
New York City
New York wants 20% of all vehicle sales to be electric by 2025, and will invest $10 million toward 50 fast charging hubs.
NYC is aiming to reduce its carbon footprint by 400Mt by 2030.
79
CIT
IES
EXPONENTIALROADMAP.ORGGLOBAL CL IMATE ACTION SUMMIT 2018
Intelligent PoliciesCity governments are key players in the transition toward a low-carbon and sustainable future. City leaders have the power to both influence and surpass national targets and exceed in delivering ambitious climate plans that not only contribute to reduced emissions but also improved quality of life for their citizens.
Many are already showing leadership in the development and dissemination of low-carbon solutions through progressive policies and actions. But to fully unleash their potential, cities need to do more. They can exercise massive leverage by e.g. offering smarter alternatives for energy, transportation, and building standards – all of which affect huge numbers of people. Eliminating and decoupling fossil-fuel subsidies could accelerate renewable energy deployment and free up national governments to invest in sustainability and social measures.8
City mayors are directly accountable to their constituents for their decisions, and are often more agile than state and national elected officials. They have the power to take decisive action – often with immediate and impactful results. Through a broader approach to governance, in partnerships with other cities, government, private businesses, investors and civil society, the potential for effective action increases.
Smart CitiesThe scale, structure, and organisational and social dynamics of cities offer great potential to scale up transformative digital solutions. However, this requires greater mobilization of resources, and shifting investments to low-carbon technologies and strategies.
So-called “Smart City” technologies can enable next-generation mobility and electric vehicle breakthroughs, improvements in energy and space efficiency for buildings, and electricity generation and storage. Meanwhile, real-time systems using 5G networks, internet of things and artificial intelligence technologies can optimise transport and allow citizens to transform their cities.
Furthermore, electrifying cities and preventing fossil-fuel infrastructure lock-in by creating green bonds for solar photovoltaics could contribute to scaling up the number of cities that commit to a halving of emissions by 2030.
CALL TO ACTION
• By 2020, target 100 cities to commit to transformation in line with 1.5°C global warming.
• Citizens must be involved with the low-carbon transformation of cities, delivering a fast reduction of emissions, as well as health and economic benefits.
• Cities should urgently push for the transformation of finance systems so they can access the bonds and debt financing, land value capture, and international and national financing vehicles to enable a low-carbon transition.
• Cities should ensure that investments rapidly shift into low-carbon, climate-resilient infrastructure and technology and away from fossil-fuel-based models that risk lock-in, employing strict sustainability reporting, standards and tools. With low-emissions solutions now often at parity with other solutions, cities should set tough procurement policies.
• Cities should set consumption emissions targets and enable sustainable lifestyles and choices for their citizens.
80
CIT
IES

EXPONENTIALROADMAP.ORGGLOBAL CL IMATE ACTION SUMMIT 2018
81
CLI
MA
TE L
EA
DE
RSH
IP
CLIMATE LEADERSHIPIf the Paris Agreement showed a clear vision of where we need to be, the Carbon Law of approximately halving emissions every decade shows how we’ll get there.
Rather than putting a goal over the horizon, it places the immediate focus squarely on the next decade – where solutions to halve emissions already exist.
But existing commitments are not sufficient to deliver that first halving of emissions – the number of countries, cities, businesses and people pledging cuts must accelerate to reach a critical mass. This chapter will explain how climate leaders who are willing to step up, try new things, share their results, and inspire others can deliver that acceleration.
These climate leaders will show that a rapid halving is not only achievable but can be done while boosting prosperity and improving society and health. They’ll share their experiences in an open, consistent way with the global community, re-writing the narrative away from climate action being seen a burden and towards it being an opportunity, creating a “race to the top”.
Individuals halving emissionsAs people’s economic wealth increases, their carbon footprints tend to increase. People consume more, travel more, and eat more meat. A high-status lifestyle is a high-carbon lifestyle, though after a certain level of income happiness seems to level off.1
Some of the environmental impact of this process can be cut through the dematerialisation of goods and services. For example, people tend to stream movies and music over the web today rather than getting a DVD or CD shipped through the mail. But this alone is not enough to
cut emissions to where they need to be. Indeed, the digital revolution has coincided with a growth in emissions – not a decline.
Individuals with a high-carbon lifestyle who make a conscious choice to start reducing their carbon footprint can almost halve their emissions in a single year, while retaining a similar or even higher quality of life in terms of health and happiness, a recent study shows.2 Relatively simple lifestyle changes like shifting to low-emissions transportation, a plant-based diet, and renewable energy for the home, as well as reducing wasteful consumption, are possible for most individuals. Individuals can make climate change a factor in decisions.
Theoretically, if the top 10% of the world’s individual emitters made similar changes over 10 years, the annual carbon reductions would be on the scale of 10 Gt of CO2 by 2030.3 As the global middle class grows and achieves increased wealth, it’s vital that the most influential and richest set examples of high-quality but low-emissions lifestyles, to inspire others.
Individuals could:
• Make climate change a factor in decisions around diet, travel, shopping, financial savings and home energy to halve emissions and share experiences.
• Engage with politicians, companies and cities, demanding solutions which make it possible to live climate-friendly lifestyles, and support those who deliver those solutions.
• Join global and local climate movements to influence policymakers.

EXPONENTIALROADMAP.ORGGLOBAL CL IMATE ACTION SUMMIT 2018
Businesses halving emissionsA growing number of companies are proving that reducing emissions does not need to harm the bottom line. Major firms like Stanley Black & Decker, Unilever, Dell Technologies, IKEA, Apple, Google, BT, Ericsson, Danfoss and Intel are systematically and quickly shrinking their carbon footprint, setting strong targets for future cuts, and expands target setting and achievement to their suppliers.
Companies who build climate leadership into their core strategies seem to be outperforming those that fail to show leadership.4,5 A recent study of 300 companies in Sweden found an overwhelming consensus that climate action strengthens a brand, improves customer loyalty, and boosts recruitment – on top of the direct benefits that reducing emissions brings.6
Several initiatives are tracking the pace of corporate decarbonisation pledges. The We Mean Business Coalition, for example, monitors 1,251 commitments from 768 companies with a combined market cap of $16.9 trillion.7 In the Science Based Target initiative, more than 460 corporations have committed to climate targets. Momentum is strong but the number of companies setting targets and taking action must grow significantly. To date, few companies have made commitments to halve emissions in 15 years or less (see figure). New research shows this must change.
Also, the number of companies setting targets and taking action must grow significantly.
It will be increasingly important that key industries develop roadmaps for halving emissions and full decarbonisation. Fossil-Free Sweden, a governmental initiative, is coordinating the development of a series of roadmaps, divided by industry sector, which set out the necessary steps to phase out the use of fossil fuels by 2045. So far, roadmaps have been published for the cement, construction, aviation, minerals, retail, forestry, transport, sea transport, and steel sectors.8
Finally, leaders in the technology sector have created a declaration
which will be unveiled at the Global Climate Action Summit in September 2018. This will include strong commitments from the ICT industry, with the goal of stepping up planet-wide action on cutting emissions.
Companies should:
• Set targets to halve emissions in a decade or faster.
• Closely monitor emissions, and take action to make sure they comply with targets.
# Companies by Halving Time Targets
55
50
45
40
35
30
25
20
15
10
5
0Halving
within 10yrs
12
Halving within 5yrs
7
12
Halving within 15yrs
13
52
Halving within 20yrs
Halving more than 20yrs
Following Carbon Law | Not Following Carbon Law
The diagram describes the pace of carbon emission reduction for 120 companies in the Science Based Targets Initiative (SBTi), translated into halving time. 120 of the 461 companies in the SBTi database have set targets for scope 1 and 2 emissions with both a stated goal year and baseline emission year, these are the companies included in the diagram above. 7 have committed to halve within 5 years, 12 have committed to halve in 10 years but the majority (77) in more than 10 years.
82
CLI
MA
TE L
EA
DE
RSH
IP

EXPONENTIALROADMAP.ORGGLOBAL CL IMATE ACTION SUMMIT 2018
83
CLI
MA
TE L
EA
DE
RSH
IP
• Require suppliers and partners to set targets to halve emissions in a decade or faster.
• Share results of climate action to help spread effective methods across all industry sectors.
• Enable and participate in common industry sector initiatives to halve emissions and reach full decarbonisation.
• Accelerate high impact zero carbon solutions in the market portfolio and ensure they scale
• Intervene with national and regional policymakers to enable a shift towards full decarbonisation of their operations and join alliances for climate action
Cities halving emissionsUrban areas are home to about 54% of the global population, but account for more than 70% of global emissions.9,10 Cities and city leaders have a real opportunity to leverage the popularity of climate action among their citizens to deliver major emissions cuts – above and beyond what is being pledged at a national level.
Over the past two decades, cities have been steadily making public commitments to reduce emissions. Consortiums such as C40, the Carbon Neutral Cities Alliance, WWF One Planet City Challenge and the Covenant of Mayors are working to build movements and track cities’ carbon reduction commitments. Twenty-five cities, home to 150 million people, have declared they will be emissions-neutral by 2050, with strong cuts in the next decade. 6,800 cities have committed to reducing the levels of CO2 emissions in their territories by at least 20% by 2020 or by at least 40% by 2030. This approaches the level of commitment required by the Carbon Law.11
More, of course, needs to be done in terms of sharpening existing targets and growing the number of cities who make new ones. In particular more needs to be done in terms of implementation.
But there’s a real opportunity here to deliver health, air quality, traffic, efficiency, and financial benefits on top of the direct benefits
of emissions reductions. Climate action is highly popular with city-dwellers, so city officials willing to display real leadership in this area have much to gain and little to lose.
Cities should:
• Set science based targets to halve emissions by 2030 or faster, including emissions from imported goods and services.
• Closely monitor emissions, and take action to make sure they comply with targets.
• Partner with other cities on climate action campaigns.
# Cities by Halving Time Targets
80
70
60
50
40
30
20
10
0Halving
within 10yrs
6
Halving within 5yrs
711
Halving within 15yrs
15
Halving more than 20yrs
Following Carbon Law | Not Following Carbon Law
78
Halving within 20yrs
The rate of carbon-emission reductions for 117 cities based on their stated commitments, translated into time to halve emissions in years. This sample comes from data collected by CDP, C40, Track0 and CNCA and includes only cities that have published a percentage reduction target with a stated goal year plus a baseline year, which represents 55% of the data analysed.
EXPONENTIALROADMAP.ORGGLOBAL CL IMATE ACTION SUMMIT 2018
• Share solutions and the results of climate action to help spread effective methods across the world.
• Accelerate high impact zero carbon solutions and ensure they scale to other cities.
• Intervene with national policymakers to enable a shift towards full decarbonisation of their territories and join alliances for climate action.
Countries halving emissionsThe emissions targets set by countries are not sufficient to keep the world well below 2°C of warming, let alone the goal of limiting the increase since preindustrial times to 1.5°C. At current emissions pledge levels, the world will experience 3°C warming or higher.12
But several countries have displayed greater leadership than others. Bhutan achieved carbon neutrality in 2009, and carbon neutral commitments have been made by Tuvalu (2020), Costa Rica (2021), Iceland (2040), Finland and Sweden (2045), Norway and New Zealand (2050). These countries serve as good examples for what can be achieved politically. Even when national policy fails, various levels of regional government are still able to make meaningful carbon reduction commitments. For example, even while the United States federal government makes plans to withdraw from the Paris Agreement, the state of California has passed a regional law requiring emissions to be 40% below 1990 levels by the year 2030.13
To meet the goal of limiting warming to well below 2°C, it’s essential that countries continue to raise their pledges, with more commitments to halving emissions by 2030 and net zero emissions by 2050 at the latest. Countries which have already done so and can show strong results should work on convincing others. In particular, high-income countries should target an even faster trajectory, in order to display leadership and create headroom for developing nations who may struggle to achieve the same levels of cuts and have not historically emitted as large quantities of greenhouse gases. Lower-income countries can get an advantage by taking advantage of low-carbon technology now, avoiding lock-in of older, high-carbon technology.
Countries should:
• Set targets to halve emissions by 2030 or faster, including emissions from imported goods and services.
• Set targets of net zero emissions by 2050 at the latest.
• Closely monitor emissions, and take action to make sure they comply with targets.
• Partner with other countries on climate action campaigns.
• Share results of climate action to help spread effective methods across the world.
• Accelerate high impact zero carbon solutions and ensure they scale to other countries
• Build alliances for climate action where corporates, cities, investors, academia, civil society and individuals come together to drive climate action and influence policy towards higher ambition.
84
CLI
MA
TE L
EA
DE
RSH
IP

EXPONENTIALROADMAP.ORGGLOBAL CL IMATE ACTION SUMMIT 2018
85
CLI
MA
TE L
EA
DE
RSH
IP
Creating a self-fulfilling prophecyChange does not happen linearly. It starts slowly, but accelerates dramatically when a critical mass is achieved. The Powers of 10 framework14 shows how that critical mass can spread exponentially across the ten orders of magnitude between a single individual and the 10 billion people who’ll be sharing the planet by 2050.
In this framework, an individual can influence a family, who can influence an extended family, who can influence a community, which can influence a neighborhood, which can influence a village or town, which can influence a district, which can influence a city, which can influence a region, which can influence a country, which can influence a continent, which can influence the whole world.
You can draw similar pathways in other areas – a single worker can influence a multinational corporation in the same manner, and a local politician can influence the United Nations. Most, if not all, climate actions have the potential to cascade up these chains of influence and back down again. But they need a spark – and that’s where climate leaders come in. Without leadership, there is no change.
Over 900 organisations, with assets worth in
excess of $6 trillion, have committed to divesting
from fossil fuels
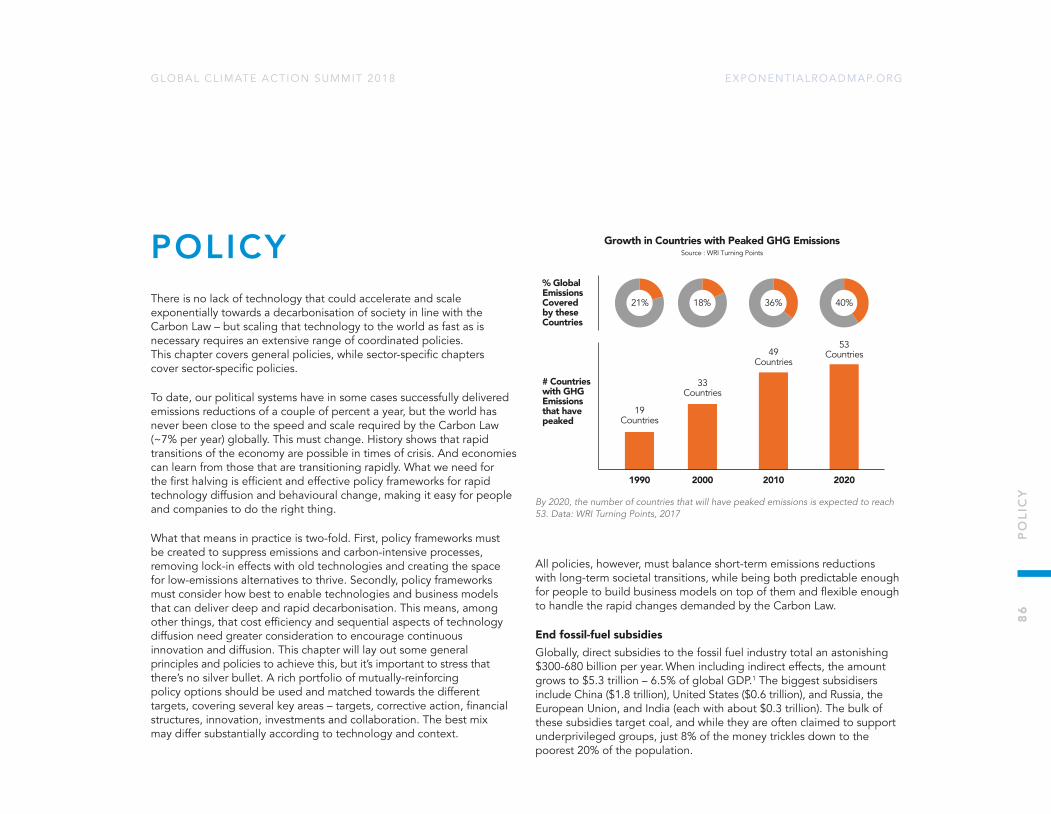
EXPONENTIALROADMAP.ORGGLOBAL CL IMATE ACTION SUMMIT 2018
POLICYThere is no lack of technology that could accelerate and scale exponentially towards a decarbonisation of society in line with the Carbon Law – but scaling that technology to the world as fast as is necessary requires an extensive range of coordinated policies. This chapter covers general policies, while sector-specific chapters cover sector-specific policies.
To date, our political systems have in some cases successfully delivered emissions reductions of a couple of percent a year, but the world has never been close to the speed and scale required by the Carbon Law (~7% per year) globally. This must change. History shows that rapid transitions of the economy are possible in times of crisis. And economies can learn from those that are transitioning rapidly. What we need for the first halving is efficient and effective policy frameworks for rapid technology diffusion and behavioural change, making it easy for people and companies to do the right thing.
What that means in practice is two-fold. First, policy frameworks must be created to suppress emissions and carbon-intensive processes, removing lock-in effects with old technologies and creating the space for low-emissions alternatives to thrive. Secondly, policy frameworks must consider how best to enable technologies and business models that can deliver deep and rapid decarbonisation. This means, among other things, that cost efficiency and sequential aspects of technology diffusion need greater consideration to encourage continuous innovation and diffusion. This chapter will lay out some general principles and policies to achieve this, but it’s important to stress that there’s no silver bullet. A rich portfolio of mutually-reinforcing policy options should be used and matched towards the different targets, covering several key areas – targets, corrective action, financial structures, innovation, investments and collaboration. The best mix may differ substantially according to technology and context.
All policies, however, must balance short-term emissions reductions with long-term societal transitions, while being both predictable enough for people to build business models on top of them and flexible enough to handle the rapid changes demanded by the Carbon Law.
End fossil-fuel subsidiesGlobally, direct subsidies to the fossil fuel industry total an astonishing $300-680 billion per year. When including indirect effects, the amount grows to $5.3 trillion – 6.5% of global GDP.1 The biggest subsidisers include China ($1.8 trillion), United States ($0.6 trillion), and Russia, the European Union, and India (each with about $0.3 trillion). The bulk of these subsidies target coal, and while they are often claimed to support underprivileged groups, just 8% of the money trickles down to the poorest 20% of the population.
Growth in Countries with Peaked GHG EmissionsSource : WRI Turning Points
% GlobalEmissionsCovered by these Countries
# Countries with GHG Emissions that have peaked
2000
33Countries
18%
1990
19Countries
49Countries
2010
53Countries
2020
40%36%21%
By 2020, the number of countries that will have peaked emissions is expected to reach 53. Data: WRI Turning Points, 2017
86
PO
LIC
Y
EXPONENTIALROADMAP.ORGGLOBAL CL IMATE ACTION SUMMIT 2018
87
PO
LIC
Y
Without fossil-fuel subsidies, it’s estimated that global carbon emissions in 2013 would have been 21% lower, and there would have been 55% fewer air pollution deaths connected to fossil fuels. Meanwhile, it would have boosted government balance sheets by 4% of GDP and social welfare by 2.2%.2 A global movement to phase out fossil-fuel subsidies may be one of the most effective ways of reducing emissions and encouraging the development and diffusion of renewable energy as well as energy efficiency technologies.
A Price on CarbonThe price we pay for goods and services rarely reflects the damage these products cause to the environment. Putting a price on carbon – making producers and consumers pay more for products with high emissions – would rebalance the playing field towards sustainable alternatives, under the “polluter pays principle” which underpins global environmental law.
Forty-five countries and 25 subnational regions already have a carbon price through different mechanisms, accounting for more than 20% of global emissions (see figure in Financing the Transition chapter). A further 88 nations, accounting for a further 56% of emissions, are planning or considering one. In addition, over 1,300 companies are using or planning internal carbon pricing schemes. In 2018, carbon markets and carbon taxes are estimated to grow to an annual value of $82 billion, compared with $52bn in 2017.3
There are two key variables that must be considered when implementing a price on carbon. The first is what that price should be – it must be at a magnitude that delivers decarbonisation, meaning not so low that it has no effect, but not so high that it’s rejected by industry and the public. It should consider the cost of the damage caused to the environment, and provide an incentive for sustainable alternatives. Balancing these factors, one suggestion is that global carbon pricing must start at $50 per tonne, and exceed $400 per tonne by the middle of the century, while others see any level below $125 per tonne as too low. With a balanced trajectory, the impact on consumer finances would in most cases be relatively low, but sufficient to drive behavioural change.4
The second variable is how the money raised from carbon pricing should be spent. A revenue-neutral carbon tax is one option, which would cut the prices of low-emissions goods at the same rate as it raises the prices of high-emissions goods. Another option is to use the revenues to fund investment in renewable energy and carbon sinks. The former is likely to be more acceptable to business and the public, while the latter may cut emissions substantially faster. A combination of the two is possible, of course. To avoid hitting low-income people disproportionately, social programmes should also be funded from these revenues.
Carbon pricing, at a level acceptable to the public, is not enough to drive a full transformation of the energy system, it would merely play a supporting role. Additional policies are necessary, such as tougher emissions standards, and incentivising the entire innovation chain. Past carbon pricing policies show that it can take different pricing levels to bring about change – industry adapts quickly, but very high carbon prices are required to reduce car travel, levels which might not be plausible in the short term.
The transition of innovation and other systems demands a full set of coherent policies to drive invention, development and scaling of many kinds of low-emission technologies. For instance, the fantastic development we see in solar and wind was driven by early experimenting and market creation through feed-in tariffs.
Setting TargetsIt’s important to draw a distinction between goals and targets which shape expectations, and the policy instruments which drive actual emissions reductions. While it’s true that goals without realistic policies will take us nowhere, it’s also vital to realise that policies rarely emerge without clear, realistic goals to inspire them.
Setting science-based emissions reduction targets, therefore, is an important part of the policy landscape. While carbon neutrality commitments have been made by Bhutan (2009), Tuvalu (2020), Costa Rica (2021), Norway (2030), Iceland (2040), Finland and Sweden (2045), the bulk of the world’s countries are yet to display a level of
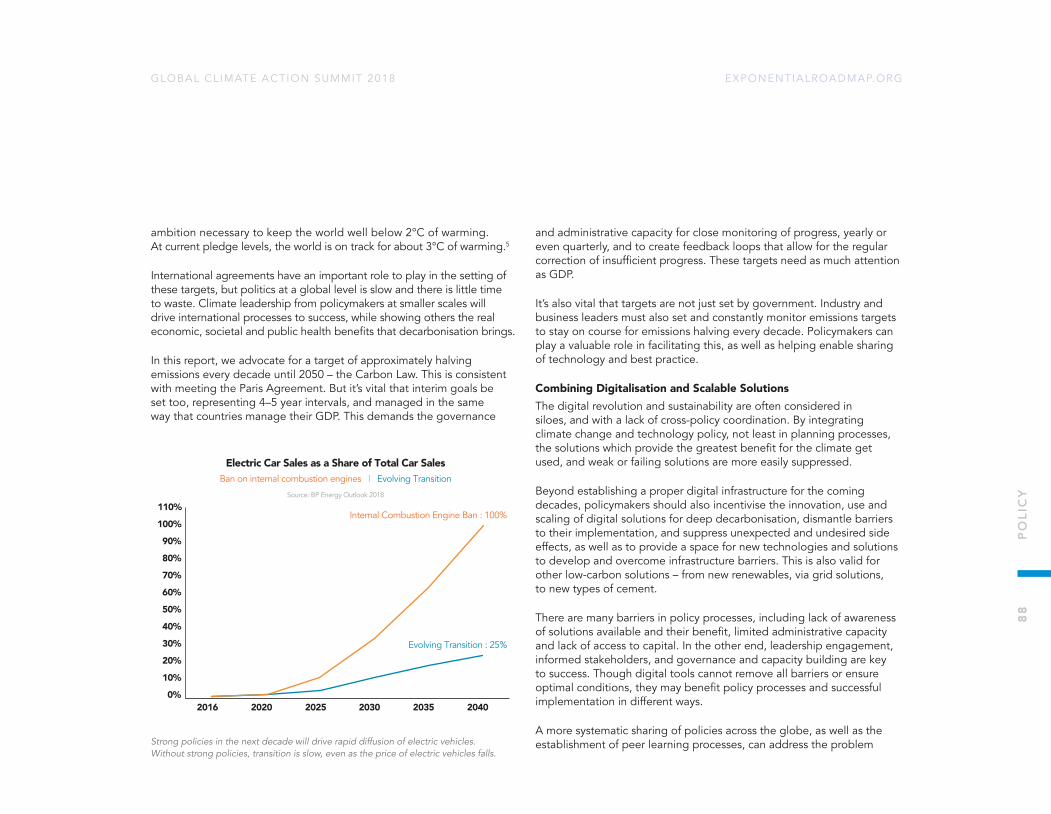
EXPONENTIALROADMAP.ORGGLOBAL CL IMATE ACTION SUMMIT 2018
ambition necessary to keep the world well below 2°C of warming. At current pledge levels, the world is on track for about 3°C of warming.5
International agreements have an important role to play in the setting of these targets, but politics at a global level is slow and there is little time to waste. Climate leadership from policymakers at smaller scales will drive international processes to success, while showing others the real economic, societal and public health benefits that decarbonisation brings.
In this report, we advocate for a target of approximately halving emissions every decade until 2050 – the Carbon Law. This is consistent with meeting the Paris Agreement. But it’s vital that interim goals be set too, representing 4–5 year intervals, and managed in the same way that countries manage their GDP. This demands the governance
and administrative capacity for close monitoring of progress, yearly or even quarterly, and to create feedback loops that allow for the regular correction of insufficient progress. These targets need as much attention as GDP.
It’s also vital that targets are not just set by government. Industry and business leaders must also set and constantly monitor emissions targets to stay on course for emissions halving every decade. Policymakers can play a valuable role in facilitating this, as well as helping enable sharing of technology and best practice.
Combining Digitalisation and Scalable SolutionsThe digital revolution and sustainability are often considered in siloes, and with a lack of cross-policy coordination. By integrating climate change and technology policy, not least in planning processes, the solutions which provide the greatest benefit for the climate get used, and weak or failing solutions are more easily suppressed.
Beyond establishing a proper digital infrastructure for the coming decades, policymakers should also incentivise the innovation, use and scaling of digital solutions for deep decarbonisation, dismantle barriers to their implementation, and suppress unexpected and undesired side effects, as well as to provide a space for new technologies and solutions to develop and overcome infrastructure barriers. This is also valid for other low-carbon solutions – from new renewables, via grid solutions, to new types of cement.
There are many barriers in policy processes, including lack of awareness of solutions available and their benefit, limited administrative capacity and lack of access to capital. In the other end, leadership engagement, informed stakeholders, and governance and capacity building are key to success. Though digital tools cannot remove all barriers or ensure optimal conditions, they may benefit policy processes and successful implementation in different ways.
A more systematic sharing of policies across the globe, as well as the establishment of peer learning processes, can address the problem
2016 2020 2025 2030 2035 20400%
10%
20%
30%
40%
50%
60%
70%
80%
90%
100%
110%Internal Combustion Engine Ban : 100%
Evolving Transition : 25%
Electric Car Sales as a Share of Total Car SalesBan on internal combustion engines | Evolving Transition
Source: BP Energy Outlook 2018
Strong policies in the next decade will drive rapid diffusion of electric vehicles. Without strong policies, transition is slow, even as the price of electric vehicles falls.
88
PO
LIC
Y
EXPONENTIALROADMAP.ORGGLOBAL CL IMATE ACTION SUMMIT 2018
of countries failing to notice and take advantage of the progress of others. Several decarbonisation policy databases already exist, but more intelligent platforms could help allow for such a system to be enhanced with additional functionality over time. For example, automatic scanning could be used on top of formal collection processes, or machine intelligence could be used to systematically analyse and surface the most useful content. Such a system could dynamically identify best practice in different areas, backed up by examples and evidence from other countries around the world. While expanding existing databases into intelligence portals and knowledge hubs in this way could prove helpful, their contents would need to be actively maintained and surfaced in front of policymakers.
The digital industry, especially in recent years, has become known for delivering products and solutions that are scalable. To accelerate the policymaking process, it’s interesting to think about policies as scalable products in themselves. Seen in the light of the need for rapid decarbonisation, many of the processes used in ICT might be studied to model a faster development of global decarbonisation policy. This could mean experimentation, pilot schemes, rapid iterative development models, open-source sharing and even policy hackathons to brainstorm ideas and demonstrate real-world feasibility.
Digital solutions, particularly advanced data analysis and visualisation techniques, may also be used to anchor policy proposals and show progress to stakeholders. Engaging with citizens and businesses is critical for the acceptance and success of policy, and even the strongest incentive will not help if people don’t know about it. Already digital solutions are vital tools in measuring and monitoring climate impact and effect of policies, and could be further enhanced through new technologies such as smart sensors, the internet of things, drones, machine intelligence, blockchain and open data.
Building expertise on a global level, ensuring equal access to qualitative and quantitative data, building flexibility into policies, creating an environment where experimentation can take place, reaching across traditional barriers and focusing on overall system benefits are the key priorities in this area for policymakers in the coming years.
CALL TO ACTION
• It’s time to shift from visions into concrete roadmaps and strategies at all levels. This means implementing coherent policy packages which support technologies and business models for deep decarbonisation, while suppressing emissions and carbon intensive processes.
• All fossil fuel subsidies should be phased out by 2020, alongside stronger standards on emissions, efficiency and performance, carbon pricing, and a wide range of policies to support this transition.
• Digitalisation and climate strategies must become one and the same thing, with extensive mutual reinforcement.
• Digital tools to develop and share efficient decarbonisation policies must be created and widely adopted.
• Incentivise circular economy, digital economy and sharing economy models.
• Expand beyond energy systems and target behavioural change, for example moves to healthy diets, cycling and public transport.
89
PO
LIC
Y

EXPONENTIALROADMAP.ORGGLOBAL CL IMATE ACTION SUMMIT 2018
EXPONENTIAL TECHNOLOGY AND SOLUTIONSThe digital technology sector may be the most powerful in the world today. With Apple surpassing one trillion dollars in market cap, it’s certainly emerging as one of the most valuable. But with great power comes great responsibility, and the technology industry can influence whether global temperatures will increase 1.5°C or 3°C. Can it rise to the challenge?
While the digital sector is on track to reduce its own emissions, representing just 1.4% of the global total, it is also in a unique position to influence other sectors.1 From consuming news and buying flights, to designing roads and bridges and buying shares, digital technology guides the behaviour of three billion people daily and drives the modern economy. Moreover, the digital revolution is expected to transform and disrupt the transport, buildings, industry, energy, farming, retail, transport, food and finance sectors in the coming decade. Digitalisation is a key to halving emissions by 2030, directly enabling around a third of the emissions cuts necessary (15% of global carbon emissions)2 and influencing the rest.
This chapter will discuss the role that exponential technologies can play in shaping the future of our planet. Exponential technologies are those whose output per size or dollar is consistently accelerating. The original example is the silicon chip – since the mid-1960s, the power of computer chips has doubled every 18-24 months while the price has halved. This phenomenon, which is named Moore’s Law after Intel founder Gordon Moore, has changed the world – delivering computers, the internet, smartphones, and artificial intelligence.
We’ve come a long way since Gordon Moore’s discovery. Today, a chip containing 30 billion transistors can rest on your thumb. But this is just the beginning. Other exponential technologies include networks, artificial intelligence, robotics, data science, digital biotechnology, nanotechnology and digital fabrication. It also includes solar and wind power, and battery technology. Humans tend to overestimate the growth of these technologies in the short term but underestimate them in the long term.
These technologies do not grow on their own, however. Exponential technology must be supported by exponential business models and policy, crafted to account for slow growth at the start which rapidly scales over time. It requires courage, and patience, to watch a product grow slowly for several years. But the rewards can be astronomical, and that’s not just a metaphor: several private space programmes have been founded off the back of the profits generated by exponential technology.
The other factor that’s necessary to understand around exponential technology is its ability to accelerate the development of other technologies. Search engines, online retail, social media platforms and
Size of the global middle class in 2018 3.2 billion
Proportion of households worldwide with internet access in 2017 53.6%
Mobile broadband subscriptions in 2017 4.3 billion (growing 20% annually)
Number of connected people by 2030 5.9 billion1
Number of connected devices by 2030 125 billion2
Impact of technology around the world
90
EX
PO
NE
NTI
AL
TEC
HN
OLO
GY
AN
D S
OLU
TIO
NS

EXPONENTIALROADMAP.ORGGLOBAL CL IMATE ACTION SUMMIT 2018
91
EX
PO
NE
NTI
AL
TEC
HN
OLO
GY
AN
D S
OLU
TIO
NS
smartphones all enable new, unexpected innovation. It would have been impossible to predict that Google’s investments in mapping would lead to Uber, for example, or that the iPhone would birth Twitter, but neither technology would be possible without its progenitor. One thing we do know is that smaller, granular technologies like mobile phones, cars or solar power, can diffuse globally much faster than big infrastructure like nuclear plants and that Internet-based services can scale incredibly fast.
Two notes of caution however. Firstly, the world is not short on innovation – our species is particularly adept at inventing new things. What is often difficult is directing that innovation towards good, using it to solve problems that matter and avoiding unintended consequences. Google and the iPhone, Uber and Twitter – they may be changing the world, but are they making it a better place? By focusing the technology industry’s attention on climate change – the most pressing issue of our time – its new platforms can make a real, positive difference.
Secondly, even when technology is available it is rarely distributed fairly across the planet. Scaling a technology globally requires more than innovation – it requires careful, proactive policy choices and shifts in cultural norms. It requires sensitivity and caution. It’s about making the future, sure, but also making sure no one is left behind.
That means continually identifying and accelerating technology and services that enable large scale emissions cuts while driving prosperity and value, in both rich and poor countries. It means thinking about a global user base from the start, and considering the real-world impact of a technology before, during and after its creation. It means being prepared to make changes at every step of the way to ensure inclusivity, and to fix not just technical bugs but social ones too. Social media companies are currently learning this lesson the hard way.
To halve emissions by 2030 requires the implementation and scaling of a set of technologies which are at different levels of development. Mobile internet, cloud computing, big data, apps, smart devices and first-generation industrial automation are mature technologies and can serve as a foundation for big efficiency gains in all industries by providing connectivity and computing.
The next technologies down the ramp are artificial intelligence, 5G networks, digital fabrication, smart sensors, the large-scale deployment of the internet of things and drones. These will enable a further level of emissions cuts before 2030. Finally come the
Solar PV & Wind Power Capacity Additions per YearHistoric Trajectory | Carbon Law Trajectory
2000
2002
2004
2006
2008
2010
2012
2014
2016
2018
2020
2022
2024
2026
2028
2030
Sola
r PV
(Gw
/yr)
Win
d Po
wer
(Gw
/yr)
0
200
400
600
800
1000
1200
0
50
100
150
It is estimated that if solar and wind power continue their exponential growth at a rate that is about half the average growth for the last 10 years, a halving of energy supply carbon emissions will be achieved by 2030.

EXPONENTIALROADMAP.ORGGLOBAL CL IMATE ACTION SUMMIT 2018
technologies which are in a relatively early phase at the time of writing – blockchain, immersive user experiences like virtual- and augmented-reality, 3D printing, gene editing, advanced robotics, and digital assistants. At this stage it’s impossible to quantify their potential impact on emissions, but it can be assumed to be substantial.
There are also real opportunities to shift baselines through the careful application of defaults. Algorithms that determine what appears on an online retail website’s homepage, for example, could be taught to prioritise products with a small carbon footprint – in addition to those with a high profit margin. Software used to design buildings could use wood as the default building material, as opposed to concrete. Even actively displaying the carbon footprint of a product at the point of sale can make a substantial difference. Ultimately, the trillions of consumer and business decisions made each year will determine whether we end up in a 1.5°C world or a 3°C world – and technology can influence those decisions while still allowing clear freedom of choice.
So, the technology sector has a vital role to play in halving emissions by 2030, and a clear roadmap to do so. Beyond halving its own emissions, it can first demonstrate climate leadership to other sectors – as the first sector decreasing emissions while growing exponentially – and accelerate the renewable energy transition as the largest buyer of renewable electricity. A second step will be enabling emissions cuts in other industries, delivering a third of the necessary progress across all sectors through technology which is designed from scratch to scale exponentially. Finally a third step is to nudge consumer and business purchasing decisions towards climate-friendly options.
With a combination of these three strategies, the technology industry can truly deliver on its often-stated objective to change the world for the better.
CALL TO ACTION
• Integrate climate considerations into their business models and communicate climate and sustainability values to all.
• Drive the renewable energy revolution globally by requiring renewable energy in all operations and from its suppliers.
• Step up investment in the fourth industrial revolution and the circular economy in energy, buildings, industry, transportation and cities, enabling rapid decarbonisation aligned with radical efficiencies and value growth.
• Step up investment in next-generation innovative solutions with high impact for addressing climate change
• Step up investment in digital solutions and algorithms which enable and encourage consumers and business to make climate-friendly investment and purchase decisions through the Internet.
92
EX
PO
NE
NTI
AL
TEC
HN
OLO
GY
AN
D S
OLU
TIO
NS
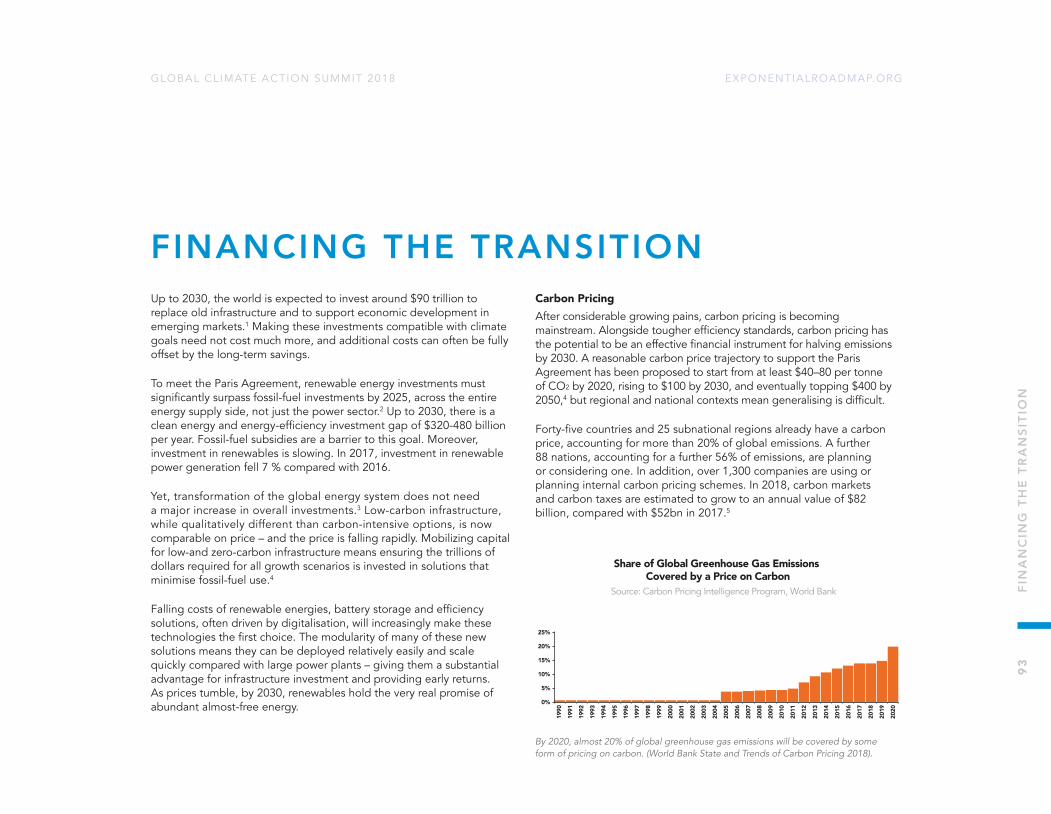
EXPONENTIALROADMAP.ORGGLOBAL CL IMATE ACTION SUMMIT 2018
93
FIN
AN
CIN
G T
HE
TR
AN
SITI
ON
F INANCING THE TRANSITIONUp to 2030, the world is expected to invest around $90 trillion to replace old infrastructure and to support economic development in emerging markets.1 Making these investments compatible with climate goals need not cost much more, and additional costs can often be fully offset by the long-term savings.
To meet the Paris Agreement, renewable energy investments must significantly surpass fossil-fuel investments by 2025, across the entire energy supply side, not just the power sector.2 Up to 2030, there is a clean energy and energy-efficiency investment gap of $320-480 billion per year. Fossil-fuel subsidies are a barrier to this goal. Moreover, investment in renewables is slowing. In 2017, investment in renewable power generation fell 7 % compared with 2016.
Yet, transformation of the global energy system does not need a major increase in overall investments.3 Low-carbon infrastructure, while qualitatively different than carbon-intensive options, is now comparable on price – and the price is falling rapidly. Mobilizing capital for low-and zero-carbon infrastructure means ensuring the trillions of dollars required for all growth scenarios is invested in solutions that minimise fossil-fuel use.4
Falling costs of renewable energies, battery storage and efficiency solutions, often driven by digitalisation, will increasingly make these technologies the first choice. The modularity of many of these new solutions means they can be deployed relatively easily and scale quickly compared with large power plants – giving them a substantial advantage for infrastructure investment and providing early returns. As prices tumble, by 2030, renewables hold the very real promise of abundant almost-free energy.
Carbon PricingAfter considerable growing pains, carbon pricing is becoming mainstream. Alongside tougher efficiency standards, carbon pricing has the potential to be an effective financial instrument for halving emissions by 2030. A reasonable carbon price trajectory to support the Paris Agreement has been proposed to start from at least $40–80 per tonne of CO2 by 2020, rising to $100 by 2030, and eventually topping $400 by 2050,4 but regional and national contexts mean generalising is difficult.
Forty-five countries and 25 subnational regions already have a carbon price, accounting for more than 20% of global emissions. A further 88 nations, accounting for a further 56% of emissions, are planning or considering one. In addition, over 1,300 companies are using or planning internal carbon pricing schemes. In 2018, carbon markets and carbon taxes are estimated to grow to an annual value of $82 billion, compared with $52bn in 2017.5
1990
1991
1992
1993
1994
1995
1996
1997
1998
1999
2000
2001
2002
2003
2004
2005
2006
2007
2008
2009
2010
2011
2012
2013
2014
2015
2016
2017
2018
2019
2020
90%
85%
80%
75%
70%
65%
60%
55%
50%
45%
40%
35%
30%
25%
20%
15%
10%
5%
0%
Source: Carbon Pricing Intelligence Program, World Bank
Share of Global Greenhouse Gas Emissions Covered by a Price on Carbon
By 2020, almost 20% of global greenhouse gas emissions will be covered by some form of pricing on carbon. (World Bank State and Trends of Carbon Pricing 2018).
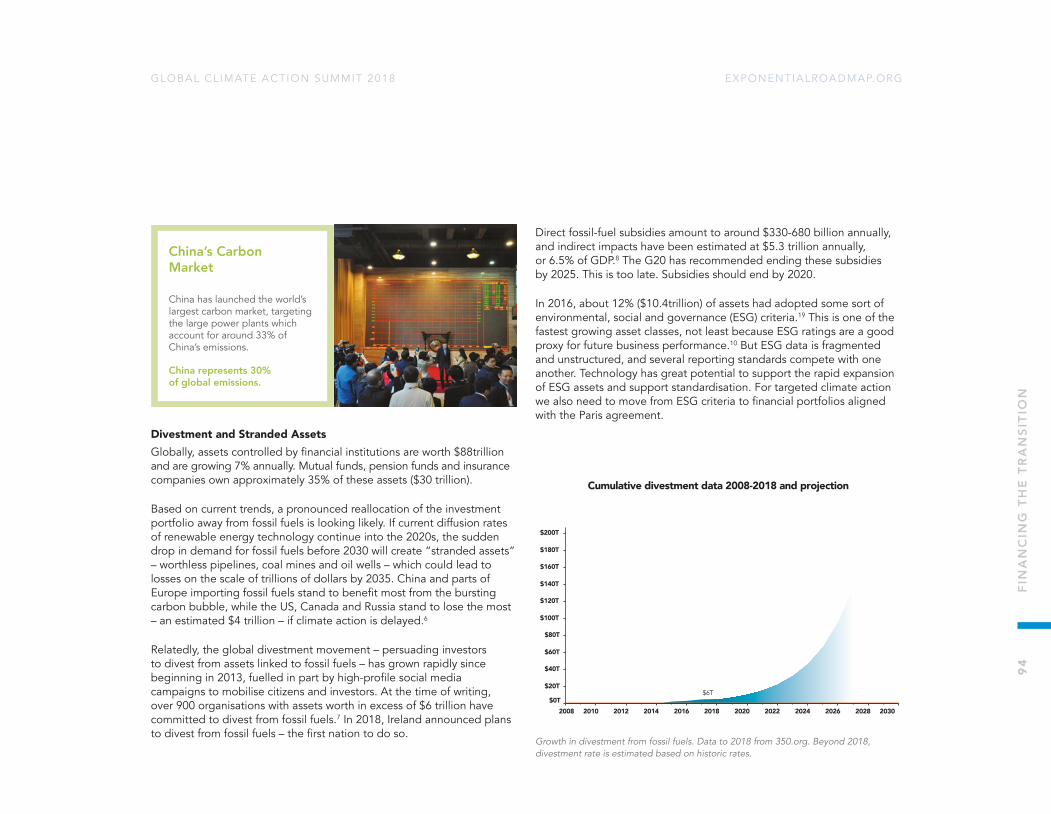
EXPONENTIALROADMAP.ORGGLOBAL CL IMATE ACTION SUMMIT 2018
Divestment and Stranded AssetsGlobally, assets controlled by financial institutions are worth $88trillion and are growing 7% annually. Mutual funds, pension funds and insurance companies own approximately 35% of these assets ($30 trillion).
Based on current trends, a pronounced reallocation of the investment portfolio away from fossil fuels is looking likely. If current diffusion rates of renewable energy technology continue into the 2020s, the sudden drop in demand for fossil fuels before 2030 will create “stranded assets” – worthless pipelines, coal mines and oil wells – which could lead to losses on the scale of trillions of dollars by 2035. China and parts of Europe importing fossil fuels stand to benefit most from the bursting carbon bubble, while the US, Canada and Russia stand to lose the most – an estimated $4 trillion – if climate action is delayed.6
Relatedly, the global divestment movement – persuading investors to divest from assets linked to fossil fuels – has grown rapidly since beginning in 2013, fuelled in part by high-profile social media campaigns to mobilise citizens and investors. At the time of writing, over 900 organisations with assets worth in excess of $6 trillion have committed to divest from fossil fuels.7 In 2018, Ireland announced plans to divest from fossil fuels – the first nation to do so.
Direct fossil-fuel subsidies amount to around $330-680 billion annually, and indirect impacts have been estimated at $5.3 trillion annually, or 6.5% of GDP.8 The G20 has recommended ending these subsidies by 2025. This is too late. Subsidies should end by 2020.
In 2016, about 12% ($10.4trillion) of assets had adopted some sort of environmental, social and governance (ESG) criteria.19 This is one of the fastest growing asset classes, not least because ESG ratings are a good proxy for future business performance.10 But ESG data is fragmented and unstructured, and several reporting standards compete with one another. Technology has great potential to support the rapid expansion of ESG assets and support standardisation. For targeted climate action we also need to move from ESG criteria to financial portfolios aligned with the Paris agreement.
$6T
2008 2010 2012 2014 2016 2018 2020 2022 2024 2026 2028 2030$0T
$20T
$40T
$60T
$80T
$100T
$120T
$140T
$160T
$180T
$200T
Cumulative divestment data 2008-2018 and projection
Growth in divestment from fossil fuels. Data to 2018 from 350.org. Beyond 2018, divestment rate is estimated based on historic rates.
China’s Carbon Market
China has launched the world’s largest carbon market, targeting the large power plants which account for around 33% of China’s emissions.
China represents 30% of global emissions.
94
FIN
AN
CIN
G T
HE
TR
AN
SITI
ON
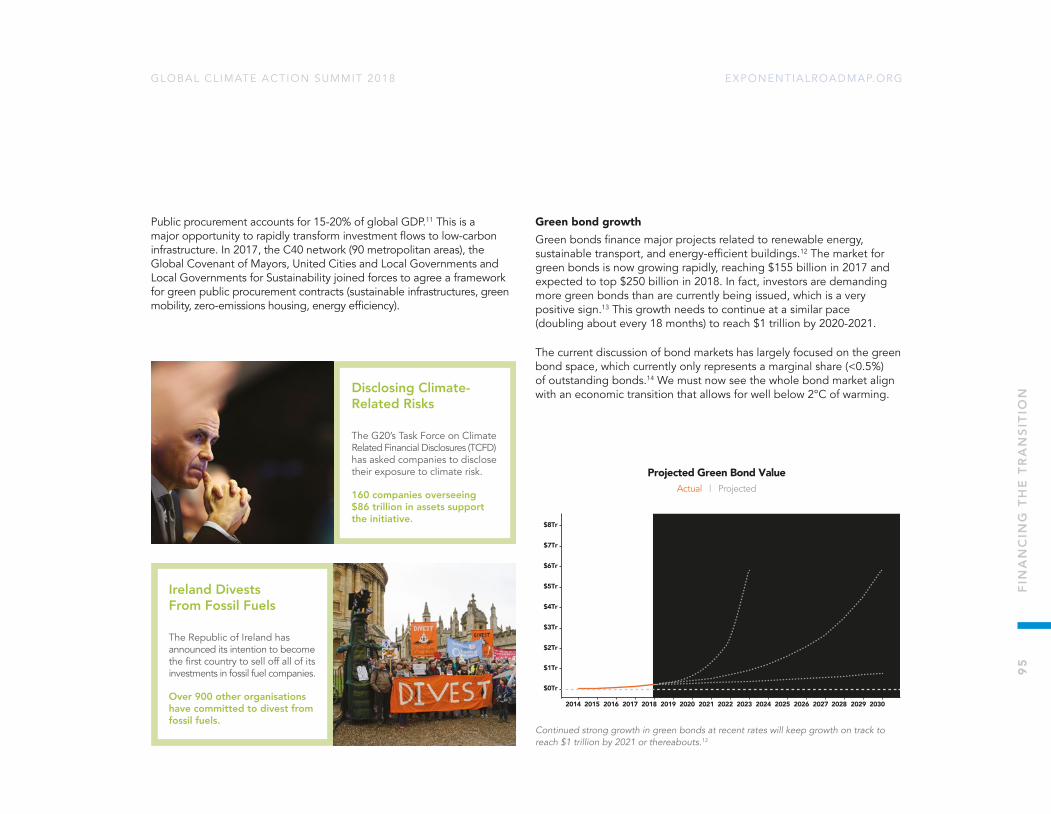
EXPONENTIALROADMAP.ORGGLOBAL CL IMATE ACTION SUMMIT 2018
95
FIN
AN
CIN
G T
HE
TR
AN
SITI
ON
Public procurement accounts for 15-20% of global GDP.11 This is a major opportunity to rapidly transform investment flows to low-carbon infrastructure. In 2017, the C40 network (90 metropolitan areas), the Global Covenant of Mayors, United Cities and Local Governments and Local Governments for Sustainability joined forces to agree a framework for green public procurement contracts (sustainable infrastructures, green mobility, zero-emissions housing, energy efficiency).
Green bond growthGreen bonds finance major projects related to renewable energy, sustainable transport, and energy-efficient buildings.12 The market for green bonds is now growing rapidly, reaching $155 billion in 2017 and expected to top $250 billion in 2018. In fact, investors are demanding more green bonds than are currently being issued, which is a very positive sign.13 This growth needs to continue at a similar pace (doubling about every 18 months) to reach $1 trillion by 2020-2021.
The current discussion of bond markets has largely focused on the green bond space, which currently only represents a marginal share (<0.5%) of outstanding bonds.14 We must now see the whole bond market align with an economic transition that allows for well below 2°C of warming.
2014 2015 2016 2017 2018 2019 2020 2021 2022 2023 2024 2025 2026 2027 2028 2029 2030
$0Tr
$1Tr
$2Tr
$3Tr
$4Tr
$5Tr
$6Tr
$7Tr
$8Tr
Medium Growth – 30% per annum
Low Growth – 10% per annum
High growth rate - 78% per annum
(in line with current growth rate)
Projected Green Bond ValueActual | Projected
Continued strong growth in green bonds at recent rates will keep growth on track to reach $1 trillion by 2021 or thereabouts.13
Disclosing Climate-Related Risks
The G20’s Task Force on Climate Related Financial Disclosures (TCFD) has asked companies to disclose their exposure to climate risk.
160 companies overseeing $86 trillion in assets support the initiative.
Ireland Divests From Fossil Fuels
The Republic of Ireland has announced its intention to become the fi rst country to sell off all of its investments in fossil fuel companies.
Over 900 other organisations have committed to divest from fossil fuels.

EXPONENTIALROADMAP.ORGGLOBAL CL IMATE ACTION SUMMIT 2018
Innovation and DisruptionCustomers now expect and demand reduced friction in the banking sector – one-click solutions for spending, saving, investing and borrowing. Major technology companies with huge customer bases already provide financial services such as online payment systems and are now exploring routes to entering the finance sector and taking on the traditional players. The customer data held by tech giants and traditional banks can be utilised to support societal goals to reduce greenhouse gas emissions. China’s Ant Financial, for example,
has captured more than half of China’s mobile payments market. This market is huge: over $13 trillion flowed through mobile phones in 2017. And now Ant Financial is using this platform to develop innovative ways to engage customers on issues like climate.
Crowdfunding is emerging as an alternative finance model in some sectors. Investment in small and medium-sized businesses is often particularly difficult in emerging markets. For example, solar powered mini-grids in Africa are tough to identify and invest in. Lack of knowledge and information coupled with accountability, corruption and transparency in some regions makes investment risky. This means that access to low-cost capital is very limited for those who need it the most. Alternative financing solutions such as crowdfunding have emerged as an important bridge to span this gap where investors gain equity in the company or interest on loans. Digital platforms mediate and provide solutions to manage risk. This is now a big business, estimated to reach $687 billion in loans by around 202215 and competing directly with traditional venture capital and traditional lending.
Several crowdfunding initiatives have a particular focus on low-emissions investments – in the UK, Abundance Investment crowdsources funds for sustainable energy and building projects. Since its founding in 2012, investors have raised £73.9m in 31 projects with £11.5m paid in returns.
Accelerating the TransitionThe finance sector can accelerate the transformation of the global economy to halve emissions by 2030. Accurate, timely information on all companies’ climate risk will help investors make informed decisions. The G20-initiated Financial Stability Board (FSB) recently established the Task Force on Climate-related Financial Disclosure (TCFD) chaired by Michael Bloomberg. Its recommendations, published in 2017, are an important step for integrating climate risk into investment decisions.
Initiatives like the Principles for Responsible Investment and the Principles for Sustainable Insurance are changing worldviews within the sector. These were both developed by the United Nations Environment Programme Finance Initiative (UNEPFI) with partners, and have attracted the major
Planting Trees With Ant Forest
Ant Forest is a Chinese app that rewards low-emissions behaviour with the growth of virtual trees, and the planting of real-world ones.
More than 300 million people are signed up.
Trine Crowdfunding Solar Power
Trine connects small-scale investors with solar power entrepreneurs in East Africa. To date, €7.6 million has been invested in solar energy.
10,340 people now have renewable electricity through the scheme.
96
FIN
AN
CIN
G T
HE
TR
AN
SITI
ON

EXPONENTIALROADMAP.ORGGLOBAL CL IMATE ACTION SUMMIT 2018
97
FIN
AN
CIN
G T
HE
TR
AN
SITI
ON
players in investment and insurance. Now UNEPFI is developing Sustainable Banking Principles.
Technology is democratizing the finance sector allowing more people access than ever before, with considerable disruptive potential. People at all levels of the financial sector, from small investors to corporate giants, can become climate leaders. The digital sector has good form when it comes to scaling rapidly, based on its ability to raise capital easily, fast innovation cycles and a vision for sector-wide disruption. These principles often come before profitability. Since 2010, for example, Tesla has raised $19 billion in capital allowing it to shake an entire industry out of complacency: it has already surpassed GM in value. Yet, at the time of writing it is not yet profitable. Investors are attracted not by a vision to build a new car company but rather a vision to disrupt the entire motor vehicle industry within a decade or so. There are strong signs this is happening. Similar disruptive visions are needed in food, agriculture, forestry, buildings and finance.
What Happens NowHuge growth in green bonds, divestment and carbon pricing indicate transformation is underway and broadly accepted. Scaling of renewables in recent years has been significant, but as the price of renewables falls further, scaling should be expected to accelerate. Market forces between 2020 and 2030 could lead to unstoppable momentum.
The financial old guard are threatened by smarter, faster, more nimble technology companies with huge reach and a greater understanding of their customers. As these companies transition into finance, this provides an opportunity to develop zero-carbon incentives for businesses and consumers, for example, financial companies encouraging circular business models. The finance sector could look very different ten years from now.
At the same time, investment growth in renewables appears to be stalling. Institutional investors need stronger incentives to end investment in fossil fuels now economically competitive alternatives are available.
CALL TO ACTION
• Accelerate implementation of recommendations from Task Force on Climate-related Financial Disclosure.
• Set more ambitious targets for divestment.
• Step up pressure to end fossil-fuel subsidies by 2020.
• Incentivise investments in renewable energy and accelerate investment beyond energy systems to explore all options from dietary change to circular economy businesses.
• Establish more green fintech hubs to drive innovation and encourage bold visions.
• Encourage all financial institutions to incentivise customer action on climate.
• Provide tools for finance sector to accelerate adoption of circular, digital and sharing economy models.
• Financial sector to align its portfolios with the Paris Agreement.
EXPONENTIALROADMAP.ORGGLOBAL CL IMATE ACTION SUMMIT 2018
OPEN DATA FOR CLIMATE ACTIONThe climate challenge is unlike other challenges facing the world, in that most nations, cities and companies share a common goal: Transitioning to an economy and society largely free from fossil fuels in order to safeguard humanity.
This report sets out a pathway to achieve that goal within the bounds of existing societal frameworks. That path relies on a complex combination of mutually-reinforcing actions by society, markets and governments – from policies, to technology, to behavioural change.
Drawing up a detailed plan for 15 years ahead is not easy. We cannot expect to correctly predict the effects of incentives, the costs of new technologies, or the momentum of social change. The challenge is complex, with many unknowns and many actors involved.
So instead, this report takes a different approach. It outlines the direction and speed required and the first steps in more detail, so we can immediately begin. But the later stages are left deliberately imprecise, so the combination of needed actions and solutions can evolve along the way. By asking questions like: “Where are we standing now?”, “What has worked and what has not?”, “Where is action needed?” and “What is going well?”, we can accelerate the experience and knowledge sharing that will drive an effective transition to a low-emissions world.
The question becomes not “how do we set up a detailed master roadmap?” but “how do we provide governments, businesses and citizens with shared roadmaps that show the way, which can be defined and redefined as we go?”.
Accessible DataAll of the data needed to create these common roadmaps is already accessible. For example, most government policies and roadmaps are public and so are emission statistics, energy consumption and most other data describing a nation’s or a city’s economy and governance. New technologies, success cases, and research are readily available and published.
However “available” does not mean “accessible” – it has not yet been collected and visualised together. Today the data is spread out, not comparable, not indexed or categorised in a common framework. If we want to use data to facilitate change, that data has to be accessible, understandable and clearly visualised.
Successful emissions cuts will depend on assembling and organising data of all kinds, so that relationships are clear, cause and effect are manifested, and diverging opinions and assumptions explained. By methodically presenting open data in this way, we can see exactly where we stand, focus on the right actions, hold stakeholders accountable and spread best practice. In doing so, roadmaps become vital tools that can be used to drive action and guide strategies.
We need open data which is well organised, scalable, maintainable, and can be accessed programmatically (i.e. through an open API). We need to provide a data structure that lets users follow policies and solutions, see their effect on leading indicators, and quantify their impact on emissions savings. A structure that makes it possible to update, compare and share these findings across nations, sectors and businesses. 9
8 O
PE
N D
ATA
FO
R C
LIM
ATE
AC
TIO
N
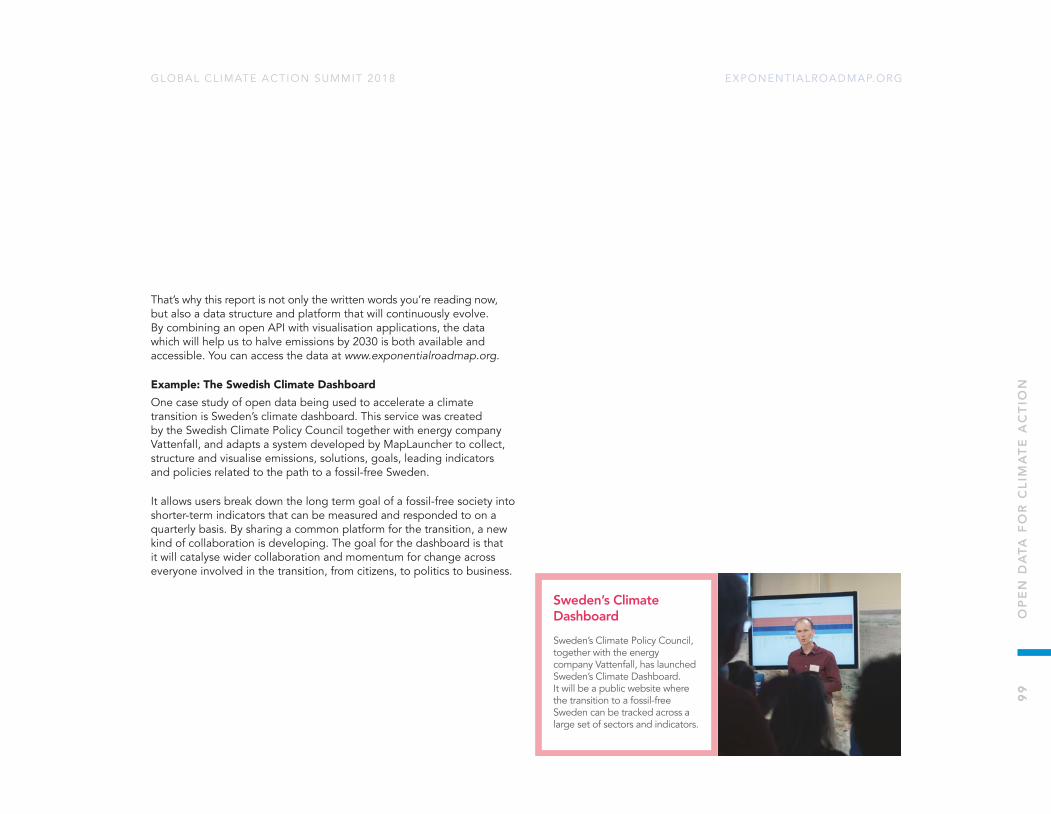
EXPONENTIALROADMAP.ORGGLOBAL CL IMATE ACTION SUMMIT 2018
99
OP
EN
DA
TA F
OR
CLI
MA
TE A
CTI
ON
That’s why this report is not only the written words you’re reading now, but also a data structure and platform that will continuously evolve. By combining an open API with visualisation applications, the data which will help us to halve emissions by 2030 is both available and accessible. You can access the data at www.exponentialroadmap.org.
Example: The Swedish Climate DashboardOne case study of open data being used to accelerate a climate transition is Sweden’s climate dashboard. This service was created by the Swedish Climate Policy Council together with energy company Vattenfall, and adapts a system developed by MapLauncher to collect, structure and visualise emissions, solutions, goals, leading indicators and policies related to the path to a fossil-free Sweden.
It allows users break down the long term goal of a fossil-free society into shorter-term indicators that can be measured and responded to on a quarterly basis. By sharing a common platform for the transition, a new kind of collaboration is developing. The goal for the dashboard is that it will catalyse wider collaboration and momentum for change across everyone involved in the transition, from citizens, to politics to business.
Sweden’s Climate Dashboard Sweden’s Climate Policy Council, together with the energy company Vattenfall, has launched Sweden’s Climate Dashboard. It will be a public website where the transition to a fossil-free Sweden can be tracked across a large set of sectors and indicators.

EXPONENTIALROADMAP.ORGGLOBAL CL IMATE ACTION SUMMIT 2018
Executive Summary
1. W. Steffen, et al., Trajectories of the Earth System in the Anthropocene. Proceedings of the National Academy of Sciences (2018): 201810141.
2. M. Mengel, et al., “Committed sea-level rise under the Paris Agreement and the legacy of delayed mitigation action.” Nature communications 9.1, 601. (2018).
3. I. Granoff, et al.,Nested barriers to low-carbon infrastructure investment. Nature Climate Change, 6(12), 1065. (2016).
4. UNEP. The Emissions Gap Report 2017. United Nations Environment Programme (UNEP), Nairobi (2017).
5. A. Grubler, et al., A low energy demand scenario for meeting the 1.5 °C target and sustainable development goals without negative emission Nature Energy 3, 515–527 (2018)
6. D. McCollum, Energy investment needs for fulfilling the Paris Agreement and achieving the Sustainable Development Goals. Nature 3, 589–599 (2018)
7. The Circular Economy: A powerful force for climate mitigation. Sitra (2018)
8. J.F. Mercure, Macroeconomic impact of stranded fossil fuel assets Nature Climate Change volume 8, pages 588–593 (2018)
About this report
1. J. Rockström, et al., A roadmap for rapid decarbonization. Science 355.6331, 1269-1271. (2017).
2. P. Hawken, editor. Drawdown: The most comprehensive plan ever proposed to reverse global warming. Penguin; 2017.
Halving Greenhouse Gas Emissions
1. A. Ganopolski, et al., Critical insolation– CO2 relation for diagnosing past and future glacial inception.Nature 529.7585 (2016).
2. W. Steffen, et al., The trajectory of the Anthropocene: the great acceleration. The Anthropocene Review 2.1, 81-98. (2015).
3. P. Kavanagh, et al., Hindcasting global population densities reveals forces enabling the origin of agriculture. Nature Human Behaviour (2018).
4. A. Ganopolski, et al., Critical insolation–CO2 relation for diagnosing past and future glacial inception. Nature 529.7585, 200 (2016).
5. W. Steffen, et al., Planetary boundaries: Guiding human development on a changing planet. Science 347 6223, 1259855 (2015).
6. E. Kriegler, et al.,Pathways limiting warming to 1.5°C: a tale of turning around in no time? Phil. Trans. R. Soc. A376.2119, 20160457 (2018).
7. Mercator Research Institute on Global Commons and Climate Change, That’s how fast the carbon clock is ticking, (available at: https://www.mcc-berlin.net/en/research/co2-budget.html) (2018).
8. IPCC, Climate Change 2014: Synthesis Report. Contribution of Working Groups I, II and III to the Fifth Assessment Report of the Intergovernmental Panel on Climate Change [Core Writing Team, R.K. Pachauri and L.A. Meyer (eds.)]. IPCC, Geneva, Switzerland, (2014).
9. C. Le Quéré, et al., Global carbon budget 2017. Earth System Science Data Discussions 1-79 (2017).
10. C. Figueres, et al. Three years to safeguard our climate. Nature News 546.7660, 593 (2017).
11. M. Mengel, et al., Committed sea-level rise under the Paris Agreement and the legacy of delayed mitigation action. Nature communications 9.1, 601 (2018).
12. A. Grubler, et al., A low energy demand scenario for meeting the 1.5°C target and sustainable development goals without negative emission technologies.Nature Energy 3.6, 515 (2018).
13. J. Rogelj, et al., Scenarios towards limiting global mean temperature increase below 1.5°C. Nature Climate Change 8.4, 325 (2018).
14. M. Jacobson, et al., 100% clean and renewable wind, water, and sunlight all-sector energy roadmaps for 139 countries of the world. Joule 1.1, 108-121 (2017).
15. Financial Times. The Big Green Bang: how renewable energy became unstoppable. (available at: https://www.ft.com/content/44ed7e90-3960-11e7-ac89-b01cc67cfeec) (2018).
16. S. Davis, et al., Net-zero emissions energy systems. Science 360.6396, eaas9793 (2018).
17. C. Heuberger, et al., Impact of myopic decision-making and disruptive events in power systems planning. Nature Energy 1 (2018).
18. J. Rockström, et al., A roadmap for rapid decarbonization. Science 355.6331, 1269-1271. (2017).
19. Paul Voosen. The realist. 1320-1324., (2018).
Energy Systems
1. International Energy Agency, CO2 emissions from fuel combustion, Highlights 2017 (IEA Publication, 2017).
2. British Petroleum, BP Statistical Review of World Energy 2018. BP Publication, June 2018.
REFERENCES
100
RE
FER
EN
CE
S
EXPONENTIALROADMAP.ORGGLOBAL CL IMATE ACTION SUMMIT 2018
101
RE
FER
EN
CE
S
3. The World Bank, Tracking SDG7: The Energy Progress Report, 2018. (The World Bank Publication, 2018).
4. J. Lelieveld et al., The contribution of outdoor air pollution sources to premature mortality on a global scale. Nature 525, 367–371 (September 2015).
5. P. Landrigan et al., The Lancet Commission on Pollution and Health. The Lancet Commissions 391, 462-512 (February 2018).
6. Y. Deng et al., Quantifying a realistic, worldwide wind and solar electricity supply. Global Environmental Change 31, 239-252 (March 2015).
7. International Renewable Energy Agency, Capacity and Generation, Statistics Time Series. (available at: http://resourceirena.irena.org/gateway/dashboard/ ) (2018).
8. International Renewable Energy Agency, Capacity and Generation, Country Rankings. (available at: http://resourceirena.irena.org/gateway/dashboard/?topic=4&subTopic=18 ) (2018).
9. International Renewable Energy Agency, Capacity and Generation, Statistics Time Series. (available at:http://resourceirena.irena.org/gateway/dashboard/?topic=4&subTopic=16 ) (2018).
10. International Renewable Energy Agency, Cost. LCOE 2010-2016. (available at: http://resourceirena.irena.org/gateway/dashboard/?topic=3&subTopic=1057 ) (2018).
11. A. Mileva et al., Power system balancing for deep decarbonization of the electricity sector. Applied Energy 162, 1001-1009 (January 2016).
12. N. Phillips et al., Mapping urban pipeline leaks: Methane leaks across Boston. Environmental Pollution 173, 1-4 (February 2013).
13. O. Tynkkynen, Green to Scale: Low Carbon Success Stories to Inspire the World. Sitra Publication 105 (2015).
14. Bloomberg NEF. Global Storage Market to Double Six Times by 2030. (available at:https://about.bnef.com/blog/global-storage-market-double-six-times-2030/ ) (2018).
15. P. Hawkin, Drawdown: The Most Comprehensive Plan Ever Proposed to Reverse Global Warming. (Penguin Books, New York, 2017).
16. G. Bridge, E. Turhan, Energy infrastructure and the fate of the nation: Introduction to special issue. Energy Research & Social Science 41, 1-11 (July 2018).
17.A. Cherp et al., Integrating techno-economic, socio-technical and political perspectives on national energy transitions: A meta-theoretical framework. Energy Research & Social Science 37, 175-190 (March 2018).
18. D. Martin, Moving beyond the heuristic of creative destruction: Targeting exnovation with policy mixes for energy transitions. Energy Research & Social Science 33, 138-146 (November 2017)
19. BloombergNEF, New Energy Outlook 2018. Bloomberg Publications, 2018.
20. M. Jacobson et al., The United States can keep the grid stable at low cost with 100% clean, renewable energy in all sectors despite inaccurate claims. PNAS 114 (2017).
21. C. Clack et al., Evaluation of a proposal for reliable low-cost grid power with 100% wind, water, and solar. PNAS 26, 6722-6727 (2017).
22. L. Reichenberg et al., The marginal system LCOE of variable renewables – Evaluating high penetration levels of wind and solar in Europe. Energy 152 914-924 (2018).
23. J. Schot et al., Deep transitions: Emergence, acceleration, stabilization and directionality. Research Policy 47.6, 1045-1059. (2018).
24. S. Sareen, et al., Bridging socio-technical and justice aspects of sustainable energy transitions. Applied Energy 228, 624-632.(2018).
Industry
1. Material Economics, The Circular Economy a Powerful Force for Climate Mitigation Transformative innovation for prosperous and low-carbon industry. (2018).
2. H. Kharas, The emerging middle class in developing countries: An Update. (2017).
3. United Nations, Department of Economic and Social Affairs, The World’s Cities in 2016. Data booklet. (2016).
4. Material Economics, The Circular Economy a Powerful Force for Climate Mitigation Transformative innovation for prosperous and low-carbon industry. (2018).
5. International Energy Agency, CO2 emissions from fuel combustion, Highlights 2017 (IEA Publication, 2017).
6. M. Fischedick, et al., Industry. In: Climate Change 2014: Mitigation of Climate Change. Contribution of Working Group III to the Fifth Assessment Report of the Intergovernmental Panel on Climate Change. (Cambridge University Press, Cambridge, United Kingdom, New York, NY, USA 2014).
7. P. Hawkin, Drawdown: The Most Comprehensive Plan Ever Proposed to Reverse Global Warming. (Penguin Books, New York, 2017).
8. M. Hurwitz, et al., Early action on HFCs mitigates future atmospheric change. Environmental Research Letters. 11(11):114019 ( 2016).
9. United Nations Treaty Collection, Chapter XXVII, Environment, 2. f Amendment to the Montreal Protocol on Substances that Deplete the Ozone Layer, (2016).
10. International Energy Agency, CO2 emissions from fuel combustion, Highlights 2017 (IEA Publication, 2017).
Digital Industry
1. J. Malmodin, D. Lundén, The Energy and Carbon Footprint of the Global ICT and E&M Sectors 2010–2015. Sustainability 10, 3027 (available at http://www.mdpi.com/2071-1050/10/9/3027) (2018)
An expanded version has been accepted for publication by Journal of Sustainability.
2. US EPA. 2018. Green Power Partnership. Available at (accessed in June 2018): https://www.epa.gov/greenpower/green-power-partnership-top-30-tech-telecom

EXPONENTIALROADMAP.ORGGLOBAL CL IMATE ACTION SUMMIT 2018
3. IEA. 2017. Digitalization & Energy http://www.iea.org/publications/freepublications/publication/DigitalizationandEnergy3.pdf
Buildings
1. UNEP, The Emissions Gap Report 2017. United Nations Environment Programme (Nairobi, 2017).
2. M. Höjer, K. Mjörnell, Measures and Steps for More Efficient Use of Buildings. Sustainability 10, (6. June 2018).
3. N. Brown, Managing high environmental performance?: Applying lifecycle approaches and environmental certification tools in the building and real estate sectors. Doctoral Thesis, KTH, School of Architecture and the Built Environment (2017).
4. J. Robinson et al., Benefits of Carbon Neutrality in a Rapidly Changing Business Environment. Sitra Publication (2015).
Transport
1. S. Davis et al., Net-zero emissions energy systems. Science 360 (2018).
2. T. Abdallah, Sustainable Mass Transit, A. Author (Elsevier, 2017), pp. 1-14.
3. UC Davis Institute of Transportation Studies, The Benefits of Shifting to Cycling. UC Davis Publication, November 2015.
4. International Energy Agency, Tracking Clean Energy Perspectives. IEA Publication, June, 2017.
5. https://www.transportmeasures.org/en/wiki/evaluation-transport-suppliers/air-cargo-transport-baselines-2017/
6. K. Anderson, A. Bows, Executing a Scharnow turn: reconciling shipping emissions with international commitments on climate change. Carbon Management 3, 615-628 (2012).
7. Telia Company, Our journey towards a more sustainable future: TeliaSonera Sweden Sustainability report. (available at http://www.telia.se/dam/jcr:58987912-3a00-4bed-9f7d-e1cf88b129c4/Telia_hallbarhetsrapport_2013_ENG.pdf) (2013).
8. Scania AB, The Pathways Study: Achieving fossil-free commercial transport by 2050. Scania Publication, May, 2018.
9. International Energy Agency, A Tale of Renewed Cities:A policy guide on how to transform cities by improving energy efficiency in urban transport systems . IEA Publication, 2013.
Food Consumption
1. J. Poore, T. Nemecek, Reducing food’s environmental impacts through producers and consumers. Science 360 987-992. (2018) DOI: 10.1126/science.aaq0216
2. D. Tilman, M. Clark, Global diets link environmental sustainability and human health. Nature 515, p.518. (2014)
3. H.C. Godfray, et al., Meat consumption, health, and the environment. Science. 20;361(6399):eaam5324. (2018)
4. P. Hawken, editor. Drawdown: The most comprehensive plan ever proposed to reverse global warming. Penguin; 2017.
5. Emma Liem, What’s driving consumer desire for plant-based foods. Fooddive, (2018) At: https://www.fooddive.com/news/whats-driving-consumer-desire-for-plant-based-foods/446183/
6. Natural Resources Defense Council, Issue Paper 16-11-B, Less Beef, Less Carbon: Americans Shrink Their Diet - Related Carbon Footprint by 10 Percent Between 2005 and 2014, (2017) At: https://www.nrdc.org/sites/default/files/less-beef-less-carbon-ip.pdf
7. Mintel Group Ltd. Meat-Free Foods - UK - May 2017 market report. (2017) At: https://store.mintel.com/meat-free-foods-uk-may-2017
8. Food and Agriculture Organization of the United
Nations. Key facts on food loss and waste you should know! At: http://www.fao.org/save-food/resources/keyfindings/en/
9. Food and Agriculture Organization of the United Nations. Food wastage footprint and climate change. At: http://www.fao.org/fileadmin/templates/nr/sustainability_pathways/docs/FWF_and_climate_change.pdf http://www.fao.org/fileadmin/templates/nr/sustainability_pathways/docs/FWF_and_climate_change.pdf
10. World Economic Forum. Innovation with a Purpose: The role of technology innovation in accelerating food systems transformation. (2018)
Agriculture and Forestry
1. M.C. Hunter et al., Agriculture in 2050: Recalibrating targets for sustainable intensification. Bioscience 67, 386-91 (2017).
2. World Wide Fund for Nature. Overview: Deforestation. (2018). (available at: https://www.worldwildlife.org/threats/deforestation )
3. P. Hawkin, Drawdown: The Most Comprehensive Plan Ever Proposed to Reverse Global Warming. (Penguin Books, New York, 2017).
4. N. Millar, et al., Nitrous oxide (N2O) flux responds exponentially to nitrogen fertiliser in irrigated wheat in the Yaqui Valley, Mexico. Agriculture, Ecosystems and Environment. (2018).
5. H. Joosten, The Global Peatland CO2 Picture. Greifswald University. Wetlands International. (2016).
6. Y. Wu, C. Joe, et al., A map of global peatland distribution created using machine learning for use in terrestrial ecosystem and earth system models. (2017).
7. J. Xu, et al. PEATMAP: Refining estimates of global peatland distribution based on a meta-analysis. Catena 160, 134-140 (2018).
8. A Barthelmes et al., Peatlands and Climate in a Ramsar context A Nordic-Baltic Perspective. Nordic Council of Ministers. (Denmark, 2015).
102
RE
FER
EN
CE
S

EXPONENTIALROADMAP.ORGGLOBAL CL IMATE ACTION SUMMIT 2018
103
RE
FER
EN
CE
S
9. New York Declaration on Forests Global Platform. About the NYDF Global Platform. (2018) (available at: https://nydfglobalplatform.org/about-2/ )
10. Climate Focus. Progress on the New York Declaration on Forests: Finance for Forests - Goals 8 and 9 Assessment Report. Prepared by Climate Focus in cooperation with the New York Declaration on Forest Assessment Partners with support from the Climate and Land Use Alliance. (2017).
11. Community Research and Development Information Service. SMARTLAW Report Summary. Periodic Reporting for period 2 - SMARTLAW (Towards a regulatory framework for climate smart agriculture). (2017). (available at: https://cordis.europa.eu/result/rcn/198232_en.html)
Cities
1. Center for International Earth Science Information Network, Columbia University. Urban-Rural Population and Land Area Estimates Version 2. Palisades, NY: NASA Socioeconomic Data and Applications Center (SEDAC). 2013.
2. Global Report on Human Settlements 2011, UN Habitat, 2011
3. D. Moran et al., Carbon footprints of 13 000 cities. Environmental Research Letters 13, 6 (2018).
4. McKinsey Center for Business and Environment, C40 Cities, Focused Acceleration: A strategic approach to climate action in cities to 2030. McKinsey Center Publication. November, 2017.
5. Arup-C40. Deadline 2020: How cities will get the job done. (available at: https://www.c40.org/researches/deadline-2020) (2016).
6. O. Tynkkynen, Green to Scale: Low Carbon Success Stories to Inspire the World. Sitra Publication 105 (2015).
7. Global Gridded Model of Carbon Footprints (available at:http://citycarbonfootprints.info/ ) (2018).
8. G. Floater, D. Dowling, D. Chan, M. Ulterino, J. Braunstein, T. McMinn, Financing the Urban Transition:
Policymakers’ Summary. Coalition for Urban Transitions. London and Washington, DC. Available at: http://newclimateeconomy.net/content/cities-working-papers.
Climate Leadership
1. R. Wilkinson , Pickett K., The Spirit Level: Why Greater Equality Makes Societies (Bloomsbury Publishing, 2011).
2. BeChange - Effekten En Slutrapport Från “BeChangeekoldioxidbanta Med Klimattrapi” (available at: https://energikontornorr.se/wp-content/uploads/2017/11/Bechange-effekten-slutrapport-BeChange.pdf ) (2017).
3. Oxfam, Oxfam Media Briefing: EXTREME CARBON INEQUALITY, Why the Paris climate deal must put the poorest, lowest emitting and most vulnerable people first, (available at:https://www.oxfam.org/sites/www.oxfam.org/files/file_attachments/mb-extreme-carbon-inequality-021215-en.pdf ) (2015).
4. Carbon Disclosure Project, CDP S&P 500 Climate Change Report 2014, (available at:https://www.starwoodhotels.com/Media/PDF/Corporate/CDP-SP500-climate-report-2014.pdf ), (2014).
5. Business Ethics, Study Finds Sustainable Companies ‘Significantly Outperform’ Financially, (Available at: http://business-ethics.com/2011/11/14/1503-study-finds-sustainable-companies-significantly-outperform-financially/) (2011)
6. Haga initiative, Business for active climate responsibility, Climate Action Profitable, A study on 300 companies profitability and their climate efforts. (2017).
7. We Mean Business Coalition. (available at: https://www.wemeanbusinesscoalition.org/), (2018).
8. Fossil-Free Sweden, Roadmaps for fossil free competitiveness, (Available at: http://fossilfritt-sverige.se/in-english/roadmaps-for-fossil-free-competitiveness/) (2018)
9. IPCC, Climate Change 2014: Synthesis Report. Contribution of Working Groups I, II and III to the Fifth Assessment Report of the Intergovernmental Panel on
Climate Change (IPCC, Geneva, Switzerland, 2014).
10. United Nations, Department of Economic and Social Affairs, Population Division. World Urbanization Prospects: The 2014 Revision, ST/ESA/SER.A/366, (2015).
11. A. Kona, et al., Covenant of mayors signatories leading the way towards 1.5 degree global warming pathway. Sustainable Cities and Society 41:568-75. (2018).
12. UNFCC, Country Pledges Still Long Way from Meeting Paris Goals - Latest UNEP Emission Gap Report Urges Faster Action, (Available at: https://unfccc.int/news/country-pledges-still-long-way-from-meeting-paris-goals-latest-unep-emission-gap-report-urges-faster) (2017)
13. California Air Resource Board, Climate Pollutants Fall Below 1990 Levels for First Time, (available at:https://ww2.arb.ca.gov/news/climate-pollutants-fall-below-1990-levels-first-time) (2018).
14. A. K. Bhowmik, et al., Powers of 10: a cross-scale optimization framework for rapid sustainability transformation. (2018).
Policy
1. D. Coady, et al., How large are global fossil fuel subsidies?. World development 91, 11-27. (2017).
2. M. Franks et al., Mobilizing domestic resources for the Agenda 2030 via carbon pricing. Nature Sustainability. (2018).
3. World Bank; Ecofys. State and Trends of Carbon Pricing 2018. Washington, DC: World Bank, (2018).
4. J. Rockström, et al., A roadmap for rapid decarbonization. Science 355.6331, 1269-1271. (2017).
5. UNEP, The Emissions Gap Report 2017, United Nations Environment Programme (UNEP), Nairobi, (2017).
Exponential Technology
1. J. Malmodin, D. Lundén ,The energy and carbon footprint of the ICT and E&M sector in Sweden 1990-2015 and beyond. Paper published and presented at:

EXPONENTIALROADMAP.ORGGLOBAL CL IMATE ACTION SUMMIT 2018
ICT for Sustainability (ICT4S), Amsterdam, Netherlands 30-31. (2016).
2. IHS Markit, The Internet of Things: a movement, not a market. (available at: https://cdn.ihs.com/www/pdf/IoT_ebook.pdf ) (2017).
3. Global e-Sustainability Initiative, Smarter2030, ICT Solutions for 21st Century Challenges, (2015).
Financing the Transition
1. The New Climate Economy, The Sustainable Infrastructure Imperative (The New Climate Economy Publication, 2018).
2. D.L. McCollum et al., Energy investment needs for fulfilling the Paris Agreement and achieving the Sustainable Development Goals. Nature Energy (2018).
3. I. Granoff, et al., Nested barriers to low-carbon infrastructure investment. Nature Climate Change. 6(12):1065, (2016).
4. World Bank, High-Level Commission on Carbon Prices. Report of the High-Level Commission on Carbon Prices.,Washington, DC: World Bank, (2017).
5. World Bank; Ecofys. State and Trends of Carbon Pricing 2018. Washington, DC: World Bank, (2018).
6. J.F. Mercure, et al., Macroeconomic impact of stranded fossil fuel assets. Nature Climate Change, (2018).
7. Divestment Database (available at: https://docs.google.com/spreadsheets/d/1AWTXvHOoB4A9rqOF4Ld8czsQMdGHHjqarO9ahWCZ4UI/edit#gid=611799167) (2018).
8. D. Coady, et al., How large are global fossil fuel subsidies?. World development, 91:11-27., (2017).
9. Global Sustainable Investment Alliance, Global Sustainable Investment Review 2016, (2016).
10. Nordea Equity Research, Strategy & Quant, Cracking the ESG code, (2017).
11. European Commission, Growth: Internal Market, Industry, Entrepreneurship, and SMEs, Public
Procurement. (available at: https://ec.europa.eu/growth/single-market/public-procurement_en ) (2018).
12. C. Clapp, Investing in a green future. Nature Climate Change, 8(2):96, (2018).
13. Climate Bonds Initiative, Green Bond Highlights 2017, (2017).
14. https://2degrees-investing.org/discussion-paper-the-elephant-in-the-room/
15. Statista, Crowdlending (Business) Worldwide, (available at: https://www.statista.com/outlook/334/100/crowdlending--business-/worldwide) (2018).
104
RE
FER
EN
CE
S
EXPONENTIALROADMAP.ORGGLOBAL CL IMATE ACTION SUMMIT 2018
105
IMA
GE
CR
ED
ITS
Page 23 Ashley Cooper pics / Alamy Stock Photo
Page 24 Vattenfall Rachel Torres / Alamy Stock Photo
Page 25 afloresm / CC BY 2.0 Peter Jordan / Alamy Stock Photo
Page 26 imageBROKER / Alamy Stock Photo
Page 33 Apple Airbnb
Page 34 Solidarity Center / CC BY 2.0
Page 35 Paul Felix Photography / Alamy Stock Photo Inferface FLOR / CC BY-NC-ND 2.0
Page 41 Apple
Page 42 Aerovista Luchtfotografie / Shutterstock.com Ericsson
Page 43 Gorodenkoff / Shutterstock.com
Page 49 GOODLUZ / Alamy Stock Photo
Page 50 Empire State Realty Trust U.S. Army Environmental Command / CC BY 2.0 Avalon/Construction Photography / Alamy Stock Photo
Page 51 Sumitomo Forestry & Nikken Sekkei Flowscape
Page 57 Sam Beebe / CC BY 2.0 Kristina Blokhin / Alamy Stock Photo
Page 58 Nemo Bis / CC BY-SA 3.0
Page 59 ton koene / Alamy Stock Photo
Page 60 Westend61 GmbH / Alamy Stock Photo Gustav Lindh 2015 / CC BY-NC-ND 3.0
Page 67 juan he / Alamy Stock Photo
Page 68 Too Good To Go Roland Magnusson / Alamy Stock Photo
Page 69 U.S. Department of Agriculture / CC BY 2.0 Jane Ali / Alamy Stock Photo Jessica Gow/TT
Page 75 Minden Pictures / Alamy Stock Photo
Page 76 NEIL PALMER PHOTOGRAPHY / CC BY 2.0 U.S. Department of Agriculture / CC BY 2.0
Page 77 CC0 黄河山曲 / CC BY-SA 3.0 U.S. Army Corps of Engineers Sacramento District / CC BY-SA 3.0
Page 82 Tony Webster / CC BY 2.0 WhereIsMyTransport
Page 83 Linuxthink / CC BY-SA 3.0 I99pema / CC BY-SA 3.0 Cultura Creative (RF) / Alamy Stock Photo
Page 98 Xinhua / Alamy Stock Photo
Page 99 The Financial Stability Board / CC BY-ND 2.0 Kamyar Adl / CC BY 2.0
Page 100 TRINE Cyberstock / Alamy Stock Photo
Page 103 Arvid Sundqvist
IMAGE CREDITS
EXPONENTIALROADMAP.ORGGLOBAL CL IMATE ACTION SUMMIT 2018
Report published 13 September 2018.
Complete citation Johan Falk, Owen Gaffney, Avit K. Bhowmik, Carina Borgström-Hansson, Christopher Pountney, Dag Lundén, Erik Pihl, Jens Malmodin, Jennifer Lenhart, Krisztina Jónás, Mattias Höjer, Pernilla Bergmark, Siddharth Sareen, Sofia Widforss, Stefan Henningsson, Sophie Plitt, Tomer Shalit, Exponential Climate Action Roadmap. Future Earth. Sweden. (September 2018).
Short citation Johan Falk, Owen Gaffney, et al. Exponential Climate Action Roadmap. Future Earth. Sweden. (September 2018).
Lead authors Johan Falk, Future Earth, Stockholm Resilience Centre, Internet of Planet
Owen Gaffney, Future Earth and Stockholm Resilience Centre
Chapter authorsData modeling Avit K. Bhowmik, Postdoctoral researcher and Liaison, Future Earth
Cities Carina Borgström-Hansson, Senior Advisor Footprint and Cities, World Wide Fund for Nature
Christopher Pountney, Associate, Arup
Jennifer Lenhart, Program Manager One Planet Cities, World Wide Fund for Nature
Sofia Widforss, Program Coordinator for Sustainable Cities, World Wide Fund for Nature
Digital Industry Dag Lundén, Environmental manager, Telia Company.
Jens Malmodin, Senior specialist, Environmental Impact and LCA, Ericsson
Energy Systems Erik Pihl, Research Liaison, Future Earth
Siddharth Sareen, Postdoctoral fellow, University of Bergen
Data mining and analysis Krisztina Jónás, Sustainability Analyst, Future Earth, SRC
Sophie Plitt, Sustainability Analyst, Future Earth, SRC
Buildings Mattias Höjer, Professor in Environmental Strategies, KTH Royal Institute of Technology
Policy Pernilla Bergmark, Master researcher, Sustainability, Ericsson
Transport Stefan Henningsson, Senior Advisor Climate & Energy & Innovation, World Wide Fund for Nature
Open Data Tomer Shalit, CEO, MapLancher
Data mining, analysis and visualisationKevin Lynch, Trinity College
EditorDuncan Geere, Storythings
DesignAlex Parrott, NoOneRightAnswer.co.uk
Picture researchEden Brackenbury, Storythings
Reviewers and other contributors Amy Luers, Executive Director, Future Earth
Anders Nordheim, Programme Coordinator for Biodiversity, Ecosystem Services and Water, UN Environment Programme Finance Initiative
Anna Kramers, Program Director Mistra SAMS, KTH Royal Institute of Technology
Brent Loken, Director of Science Translation, EAT
Cecilia Repinski, CEO, Stockholm Green Digital Finance
Chad Frischmann, Vice President & Research Director, Project Drawdown
CONTRIBUTORS
106
CO
NTR
IBU
TOR
S

EXPONENTIALROADMAP.ORGGLOBAL CL IMATE ACTION SUMMIT 2018
107
CO
NTR
IBU
TOR
S
Charlie Wilson, Co-ordinator of the Energy & Emissions research theme, University of East Anglia / Tyndall Centre for Climate Change Research
Gabrielle Giner, Head of Environmental Sustainability, British Telecom
Hanna Mattila, Specialist Circular Economy, Sitra
Janne Peljo, Project Director, Climate Solutions, Sitra
Johan Rockström, Director, Stockholm Resilience Centre
Kajsa Kramming, PhD Cultural Geography, Uppsala University
Karina Shyrokykh, Statistician Researcher, Ericsson
Kristina Modée, Team Leader Sustainable Lifestyles, Collaborating Centre for Sustainable Consumption and Production
Lina Reichenberg, Postdoctoral researcher, Chalmers University of Technology
Markus Bylund, Director of Strategy and IT digitalisation, City of Uppsala
Markus Terho, Project Director, Resource-wise Citizen, Sitra
Mats Pellbäck Scharp, Head of Sustainability, Ericsson
Mikael Karlsson, Senior Researcher, KTH Royal Institute of Technology
Oras Tynkkynen, Senior Advisor, Carbon-neutral Circular Economy, Sitra
Peraphan Jittrapirom, Planning and Environment, Radboud University Nijmegen School of Management
Peter Arnfalk PhD, Associate Professor IIIEE, Lund University
Ramez Naam, Chair Energy & Environmental Systems, Singularity University
Robert Jackson, Senior fellow/Professor, Stanford Woods Institute/Precourt Institute for Energy
Staffan Laestadius, Industrial Dynamics, KTH Royal institute of Technology
Todd Edwards, Advisor and Coordinator, Mission 2020
Wendy Broadgate, Global Hub Director, Sweden, Future Earth
Yassamin Ansari, Deputy Director of Policy, Global Climate Action Summit, Mission 2020
Reviewers predominantly contributed to reviewing specific chapters providing valuable input. Responsibility for the aggregate report is with the authors.
Lead partner organisations Future Earth
Stockholm Resilience Centre
The Finnish future fund Sitra
Mission2020
Ericsson
World Wildlife Foundation
Internet of Planet
Research partner organisation Project Drawdown
Supporting partner organisationsFossil-Free Sweden
MapLauncher
KTH Royal Institute of Technology
Storythings
Swedish Energy Agency
Telia Company
Other contributing organizations British Telecom
Mistra SAMS
Nokia
Salesforce
Scania

EXPONENTIALROADMAP.ORGGLOBAL CL IMATE ACTION SUMMIT 2018
EXPONENTIALROADMAP.ORG


![Climate [in] Action!](https://img.dokumen.tips/doc/110x75/61c79edfffc1823567586334/climate-in-action.jpg)


![Exponential Future: Chapter 3: The Action [ Technology, Business, Geeta]](https://img.dokumen.tips/doc/110x75/58eeb6841a28ab38788b458d/exponential-future-chapter-3-the-action-technology-business-geeta.jpg)


![Exponential Future: Chapter 5: STOP Renunciation of Action [Geeta & Exponential Future]](https://img.dokumen.tips/doc/110x75/5875ada61a28ab8b618b53c9/exponential-future-chapter-5-stop-renunciation-of-action-geeta-exponential.jpg)