Embed Size (px)
Citation preview
EXPLOSIVE TESTING OF CLASS 1.3 ROCKET BOOSTERPROPELLANT
Claude Merrill, Albert Nichols, and Edward Lee
ABSTRACT
Recent experimentation has provided a more thorough understanding of the explosiveresponse of class 1.3 composite propellant to severe impact. This study looked at an 88%total solids HTPB/Al/AP propellant similar to what could be used in space launch boosters. The program tested propellant charges as large as 22 inches in diameter. It includeshydrodynamic modeling for developing a basic understanding of the mechanisms and todevelop reliable methods for predicting explosive response of modern high solids loadedpropellants. Test results will be presented showing the low velocity, low pressure reactivewave propagation and the energetic far field effects typical of these propellants whensubjected to severe impact. Test results and modeling analysis will be presented illustratinginteractions, not previously recognized, between burning rates and mechanical processeswhich produce a unique explosive response that is likely characteristic of low hazard boosterpropellants.
BACKGROUND
This program is jointly supported by the Titan IV System Program Office (SPO, Los AngelesAFB), the Eastern Range Safety Office (Patrick AFB) that oversees space flight operations atthe Eastern Range, and the Research Triangle Institute (Cocoa Beach, FL). Personnelparticipating in this cooperative effort come from the Phillips Laboratory PropulsionDirectorate, Edwards AFB, CA and the Lawrence Livermore National Laboratory,Livermore, CA.
The concerns of the Eastern Range Safety Office focus on the physical safety of up to 20,000personnel on site during a space launch, the launch facilities, and people located in nearbycommunities. Unfortunately, failed space payload launches have finite probability that alaunch vehicle could fall back to earth at unfavorable positions over an extended range. Pastaccidents particularly the 1986 Titan failure at Vandenburg AFB in which large atmosphericoverpressure shocks were produced by solid propellant rocket motor ground impact, clearlyidentify the need to quantitatively assess probable explosive output of space launch systems infailed launches. Such an assessment would focus upon the 6.89 kPa (1 psi) ranges andmaterial fragmenting traits as a function of impact velocity. A less frequent but importantissue would occur if response to a solid propellant fueled booster physically disrupted asatellite's radioisotope thermoelectric generator (RTG). Satellites destined for outer planetsmight use RTGs for onboard electric power requirements. RTGs are powered by plutonium238 whose dispersal would have serious environmental consequences.

Report Documentation Page Form ApprovedOMB No. 0704-0188
Public reporting burden for the collection of information is estimated to average 1 hour per response, including the time for reviewing instructions, searching existing data sources, gathering andmaintaining the data needed, and completing and reviewing the collection of information. Send comments regarding this burden estimate or any other aspect of this collection of information,including suggestions for reducing this burden, to Washington Headquarters Services, Directorate for Information Operations and Reports, 1215 Jefferson Davis Highway, Suite 1204, ArlingtonVA 22202-4302. Respondents should be aware that notwithstanding any other provision of law, no person shall be subject to a penalty for failing to comply with a collection of information if itdoes not display a currently valid OMB control number.
1. REPORT DATE AUG 1994 2. REPORT TYPE
3. DATES COVERED 00-00-1994 to 00-00-1994
4. TITLE AND SUBTITLE Explosive Testing of Class 1.3 Rocket Booster Propellant
5a. CONTRACT NUMBER
5b. GRANT NUMBER
5c. PROGRAM ELEMENT NUMBER
6. AUTHOR(S) 5d. PROJECT NUMBER
5e. TASK NUMBER
5f. WORK UNIT NUMBER
7. PERFORMING ORGANIZATION NAME(S) AND ADDRESS(ES) Phillips Lab/RKCP,4 Draco Drive,Edwards AFB,CA,93524-7160
8. PERFORMING ORGANIZATIONREPORT NUMBER
9. SPONSORING/MONITORING AGENCY NAME(S) AND ADDRESS(ES) 10. SPONSOR/MONITOR’S ACRONYM(S)
11. SPONSOR/MONITOR’S REPORT NUMBER(S)
12. DISTRIBUTION/AVAILABILITY STATEMENT Approved for public release; distribution unlimited
13. SUPPLEMENTARY NOTES See also ADM000767. Proceedings of the Twenty-Sixth DoD Explosives Safety Seminar Held in Miami, FLon 16-18 August 1994.
14. ABSTRACT see report
15. SUBJECT TERMS
16. SECURITY CLASSIFICATION OF: 17. LIMITATION OF ABSTRACT Same as
Report (SAR)
18. NUMBEROF PAGES
38
19a. NAME OFRESPONSIBLE PERSON
a. REPORT unclassified
b. ABSTRACT unclassified
c. THIS PAGE unclassified
Standard Form 298 (Rev. 8-98) Prescribed by ANSI Std Z39-18

Since solid propellants used in large space boosters have an explosive nature, studyingexplosive characteristics of the ever more popular HTPB type of propellant seems anappropriate approach. This does not cover propellant filled motor cases or other gear, ratherit focuses on the propellant hazards alone. Emerging space boosters and upper stages useHTPB propellants. In the future all solid propellant space boosters may use HTPBpropellants. Little is known about critical diameters and explosive potentials for HTPBpropellants containing 86 to 90% of combined aluminum and ammonium perchlorate solids.
HTPB/Al/AP propellants have been used in many tactical rocket weapons. Due to the smallsize of most tactical rocket systems as compared to space boosters little concern has beenexpressed for their explosive characteristics. With propellant critical diameters larger thanthe typical tactical missile there may not be any serious explosive concerns for smaller rocketmotors.
With normal chemical explosives one might expect that transfer of full energetic yield toatmospheric shock during a chemical explosion would require that critical diameter beexceeded. As will be provided later in this paper, fully energetic atmospheric overpressureshocks can be produced by subcritical events.
Over about the last fifteen years various incidents and experimental studies have indicatedthat large booster propellants may be more explosive than we had thought. One examplewas the French report in 1988 (1) indicating that 88% solids hydroxy terminatedpolybutadiene - aluminum - ammonium perchlorate (88% HTPB/Al/AP) propellant hadcritical diameters in the range of 200 to 250 mm (8 to 10 in.) and that critical diameter for asimilar 90% solids (10 HTPB/20 A1/70 AP) propellant could be as small as 83 mm (3.27 in.). In a 1992 report Merrill (2) reported that a 10,270 kg (22,600 lb.), 90% solids, HTPB/21A1/69 AP, Super HIPPO grain donored by a conical 305 mm (12 in.) diameter, 610 mm (24in.) long, 24.5 kg (54 lb.), C4 high explosive donor had partially reacted in violent fashionproducing a very substantial crater. This result indicated that the 90% solids HTPBpropellant had a critical diameter less than 305 mm (12 in.). Partial energetic yield in theSuper HIPPO experiment was attributed to lack of violent initiation laterally from a directedshock. That is, supersonic shock events in a large critical diameter material have highly inhibited corner turning ability. The 1986 launch failure of a Titan III missile at Vandenberg AFB highlighted the need to improve our understanding of booster propellant explosivebehavior. In that incident several large pieces of zero stage motors fell back to earth fromabout a 245 m (800 ft.) altitude. A number of large craters were produced in the sandy soil and atmospheric overpressure building damage indicated substantial blast effects. Metalfragments were retrieved from as far as 0.9 km (3000 ft.) from the blast site. Titan IIIpropellant contains 84% total solids and may be our explosively safest booster propellant. The big cross sectional area of impacted solid propellant seemed to have a large influence onthe degree and quantity of violence obtained.
Technology now enables us to study solid propellant explosive behavior economically. Polyvinyl difluoride piezoelectric gauges and advanced recording instrumentation now moreaccurately measure and record times of arrival coupled with shock magnitude measurements
and shock magnitude time histories. The LLNL has developed a reactive response computercode, called the CALE code, with systematics to predict explosive behavior in areas whereactual experimentation has not been conducted. We have confidence that modification of theLLNL code will provide a better understanding using fewer experiments than a strictlyexperimental approach.
During the 1960s impact experiments were carried out by rocket sled impact. Hardware, range mainten-ance, and refurbishment costs involved high capital outlays and use ofsubstantial manpower. Experimental methods for substantially sized propellant impacts haveevolved from ramming a rocket motor or propellant sample on a rocket sled into a barrier, toputting impact barrier material on a rocket sled so that a static, highly instrumented testsample could more easily provide detailed data than in the moving sample impact process, toexplosively driven steel plate impactors into instrumented propellant samples resting onrelatively inexpensive, replaceable wooden stands. Advanced techniques in combinationwith computer code simulation could make very large propellant sample testing unnecessary.
The objectives for this study are to better understand the impact reactive characteristics ofslow burning rate HTPB/Al/AP solid propellant, modify the LLNL CALE computer code tomimic these characteristics, and deliver the modified code to the Patrick AFB safety group sothat it can be applied in improving their safety plans for solid propellant booster space flightoperations at Eastern Range launch locations including the Kennedy Space Center. Vandenberg AFB should be able to take advantage of the Eastern Range safety plan if theydesire. This plan should include threshold impact velocities for violent response, beadaptable to various impact surfaces, and take into account the relative sizes of propellantgrains that could be involved.
DISCUSSION
The primary propellant selected for experimentation during this program is indicated by theformulation given below:
Ingredients Wt % Notes
HTPB polymer, additives 10.00
DOS plasticizer 2.00 Dioctyl sebacate
Aluminum, 30 micron 19.00 Atomized
AP, 200 micron & ground 69.00 Kerr McGee, with TCP, rotary rounded
Batches of this propellant had a burn rate of 8.0 mm/second (0.32 ips) at 6.89 MPa (1000 psi)and a maximum tensile strength in the range of 500 to 750 kilopascals (kPa) (73 to 109 psi). A second booster propellant containing iron oxide that has been given only one test has the

formulation given below:
Ingredients Wt% Notes
HTPB polymer, additive 9.80
DOA plasticizer 2.00 Dioctyl adipate
Aluminum, 19 micron 19.00 Atomized
Ammonium Perchlorate, 250 micron & ground 69.00 WECCO, no TCP
Iron Oxide, red, Fe O 0.202 3
Burn rate of the second propellant was near 10.7 mm/sec. (0.42 ips) at 6.89 MPa (1000 psi), and its maximum tensile strength was near 689 kPa (100 psi).
Selection of booster propellant sample sizes during planning stages of the project was heavilyinfluenced by critical diameters reported by the French in 1988 (1). Since they had reportedthat 88% solids HTPB/Al/AP propellant critical diameters were in the range of 200 to 250mm, the diameters of sample cylinders were chosen to be 406 mm (16 in.) and 508 mm (20 in.) for plate impact testing. The intent was to have impact samples in excess of criticaldiameter or at least close to critical diameter so that substantial energetic response to impacts could be observed. With support of the LLNL computer code it was projected thateven data from samples smaller than critical diameter could provide useful inputs forcomputer code modification. For explosive donor experiments or critical diameter testscylindrical diameters of 203 mm (8 in.), 254 mm (10 in.), 305 mm (12 in.), 406 mm (16 in.),and 559 mm (22 in.) were selected. The majority of the explosive donor samples were of thetwo larger diameters since they would be more reactive due to their larger sizes. Different sizes were intended to add data about propellant energetic response dependence based onsample size.
More than 9100 kg (20,000 lbs.) of booster type propellant was cast into cylindrical samples at the Jet Propulsion Laboratory Station located on Edwards AFB. Their 570 liter (150gallon) mixer allowed about 910 kg (2000 lbs.) of propellant to be processed per batch. Casting molds for the booster propellant cylindrical samples were cardboard paper tubescalled "sono tubes" terminated at the bottom by heavy aluminum foil and tape. During castingthe sono tube receptacles rested on fabricated wood stands so that they could be forkliftedfrom the casting area to the cure ovens. Sono tubes are relatively inexpensive cardboardpaper tubes commercially available in a large number of standard internal diameters rangingfrom 152 mm (6 in.) to 1524 mm (60 in.). Sono tubes can also be made up according to

nonstandard diameters by special order with some delay in delivery and additional cost. These sono tubes are used by the construction industry for casting concrete cylinders forultimate load bearing strength testing. Since sono tubes are intended for making up concretesamples, they readily endure the hydraulic load of uncured propellant, even at depths of 2meters. Prior to casting the sono tube propellant molds were lined with 0.025 mm (0.001 in.)Velostat conductive plastic sheet and sprayed with a mold release that dried leaving fineTeflon powder film on the sprayed surfaces. In this manner the cardboard tubes could beremoved after propellant cure yielding free standing cylindrical samples. For those pieces ofpropellant that exceeded about 100 kg (220 lbs.) a band of unlined cardboard without moldrelease about 10 to 16 cm (4 to 6 in.) in width was exposed to the propellant as it was cast atthe top of the specimen. This cardboard band bonded strongly to the solid propellant, andwas used as a means of grasping the heavy propellant pieces with a special fixture for eachdiameter by forklift or hoist for sample movement and placement for test. Samples made ofvarious lengths were stacked for test so that polyvinylidene difluoride (PVF2) piezoelectricand foil gauge time of arrival sensors could be placed at suitable positions between propellantpieces during test.
Our explosive experiments instrumentation devices utilized the following instrumentationdevices:
PVF2 piezoelectric gauges - to measure shock time of arrival and pressure time-history
Detonation velocity probes - these were the crushing concentric resistor type placed onthe exterior of samples
Foil gauges - used for time of shock arrival measurement
Crystal pins - employed in arrays along sample length measuring shock arrival times
Four Le Croy four channel high speed recorders, connected to PVF2 gauges, foil gauges, detonation velocity probes, and crystal pin arrays
PC 486 data acquisition and control system
Atmospheric overpressure sensors located at ground level at 46, 76, and 107 m (150, 250, and 350 ft.)
along about northeast and southeast legs
A 24 track tape recording system for overpressure sensor recording
Three - 30 frame per second video cameras
One - 1000 frame per second color film camera
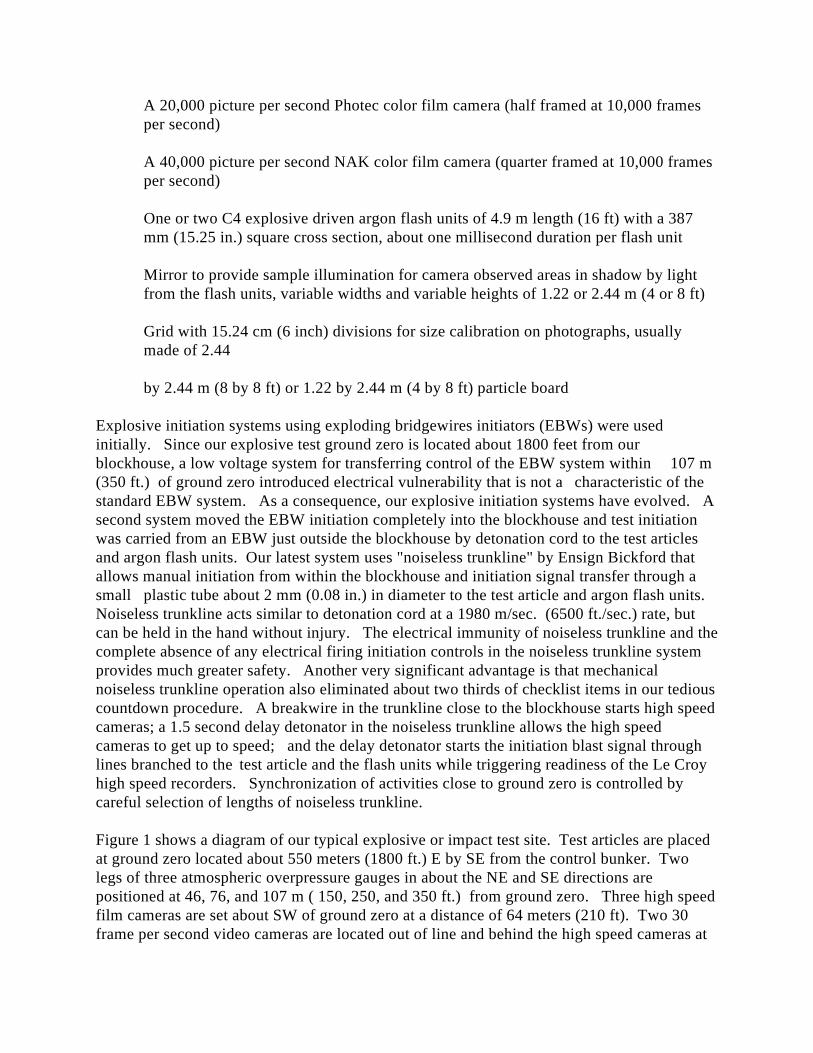
A 20,000 picture per second Photec color film camera (half framed at 10,000 frames per second)
A 40,000 picture per second NAK color film camera (quarter framed at 10,000 frames per second)
One or two C4 explosive driven argon flash units of 4.9 m length (16 ft) with a 387 mm (15.25 in.) square cross section, about one millisecond duration per flash unit
Mirror to provide sample illumination for camera observed areas in shadow by light from the flash units, variable widths and variable heights of 1.22 or 2.44 m (4 or 8 ft)
Grid with 15.24 cm (6 inch) divisions for size calibration on photographs, usuallymade of 2.44
by 2.44 m (8 by 8 ft) or 1.22 by 2.44 m (4 by 8 ft) particle board
Explosive initiation systems using exploding bridgewires initiators (EBWs) were usedinitially. Since our explosive test ground zero is located about 1800 feet from our blockhouse, a low voltage system for transferring control of the EBW system within 107 m(350 ft.) of ground zero introduced electrical vulnerability that is not a characteristic of thestandard EBW system. As a consequence, our explosive initiation systems have evolved. Asecond system moved the EBW initiation completely into the blockhouse and test initiationwas carried from an EBW just outside the blockhouse by detonation cord to the test articlesand argon flash units. Our latest system uses "noiseless trunkline" by Ensign Bickford thatallows manual initiation from within the blockhouse and initiation signal transfer through asmall plastic tube about 2 mm (0.08 in.) in diameter to the test article and argon flash units. Noiseless trunkline acts similar to detonation cord at a 1980 m/sec. (6500 ft./sec.) rate, butcan be held in the hand without injury. The electrical immunity of noiseless trunkline and thecomplete absence of any electrical firing initiation controls in the noiseless trunkline systemprovides much greater safety. Another very significant advantage is that mechanicalnoiseless trunkline operation also eliminated about two thirds of checklist items in our tediouscountdown procedure. A breakwire in the trunkline close to the blockhouse starts high speedcameras; a 1.5 second delay detonator in the noiseless trunkline allows the high speedcameras to get up to speed; and the delay detonator starts the initiation blast signal throughlines branched to the test article and the flash units while triggering readiness of the Le Croyhigh speed recorders. Synchronization of activities close to ground zero is controlled bycareful selection of lengths of noiseless trunkline.
Figure 1 shows a diagram of our typical explosive or impact test site. Test articles are placedat ground zero located about 550 meters (1800 ft.) E by SE from the control bunker. Twolegs of three atmospheric overpressure gauges in about the NE and SE directions arepositioned at 46, 76, and 107 m ( 150, 250, and 350 ft.) from ground zero. Three high speedfilm cameras are set about SW of ground zero at a distance of 64 meters (210 ft). Two 30frame per second video cameras are located out of line and behind the high speed cameras at

a range of about 150 m (500 ft). An electric terminal box below ground level housing the LeCroy recorders was about N by NW from ground zero at a distance of 107 m (350 ft). One ortwo C4 explosively driven argon flash units were placed in the westerly direction from groundzero at distances between 18 to 34 m (60 to 110 ft.). Approximately 15 m (50 ft.) from theflash units argon cylinders are placed in buried steel boxes and provide argon gas flowthrough plastic tubing to feed the flash units. Argon flow at about 70 liters per minute issupplied to the flash units for at least 1 hour prior to explosive trials to fill the units withargon. Directly opposite the cameras and about 3 m (10 ft.) behind the test article is set,typically, a 2.4 by 2.4 m (8 by 8 ft.) particle board painted with grid markings spaced 152 mm(6 in.) apart. At a range of about 3 m (10 ft.) to the east of the test article is placed a 2.4 by2.4 m (8 by 8 ft.) mirror angled so that light from the flash units can be reflected onto the partof the test article that would be observed by the cameras but be in the shadow of direct lightfrom the flash units.
First explosive testing of our primary booster propellant was a critical diameter test of a 203mm (8 in.) outer diameter cylinder by 813 mm (32 in.) in length. Propellant weight was 47.7kg (105 lbs.). C4 high explosive was used as donor with a diameter of 197 mm (7.75 in..)and a depth of 102 mm (4 in.). C4 weight was 4.99 kg (11 lbs.). Initiation of the C4 wasaccomplished by seven equally spaced nonelectric caps stimulated by detonation cord strandsof equal length coming out of a 0.91 kg (2 lb.) ball of C4 explosive. The sample propellantcylinder was resting vertically on a 102 mm (4 in.) block of paraffin that was in turn set on a19 mm (0.75 in.) piece of plywood about 0.91 m (3 ft) square. A pair of EBWs set at the topof a wood board driven into the soil initiated a 1.27 m length of detonation cord thatterminated in the C4 ball attached to the seven detonation cords of the multipoint explosiveinitiation system. See Figure 2 for an explanation of the test components at ground zero.
Instrumentation for the 203 mm diameter experiment consisted of two detonation velocityprobes, four PVF2 gauges placed at an edge and center of the propellant at top and bottom ofthe sample cylinder, atmospheric shock overpressure gauges, six crystal pins equally spaceddown the side of the propellant cylinder, a Photec 40,000 pictures per second camera, anargon flash unit of 305 mm square cross section by 2.44 m long, and a single color videocamera. See Figure 3 to see where detonation probe, PVF2 sensors, and crystal pins wereplaced on the 203 mm diameter test sample.

Figure 1. Site Plan for Explosive Tests (not to scale)

Figure 2. 8 in. Critical Diameter Test Configuration

Figure 3. 8 in. Test Sensor Positions
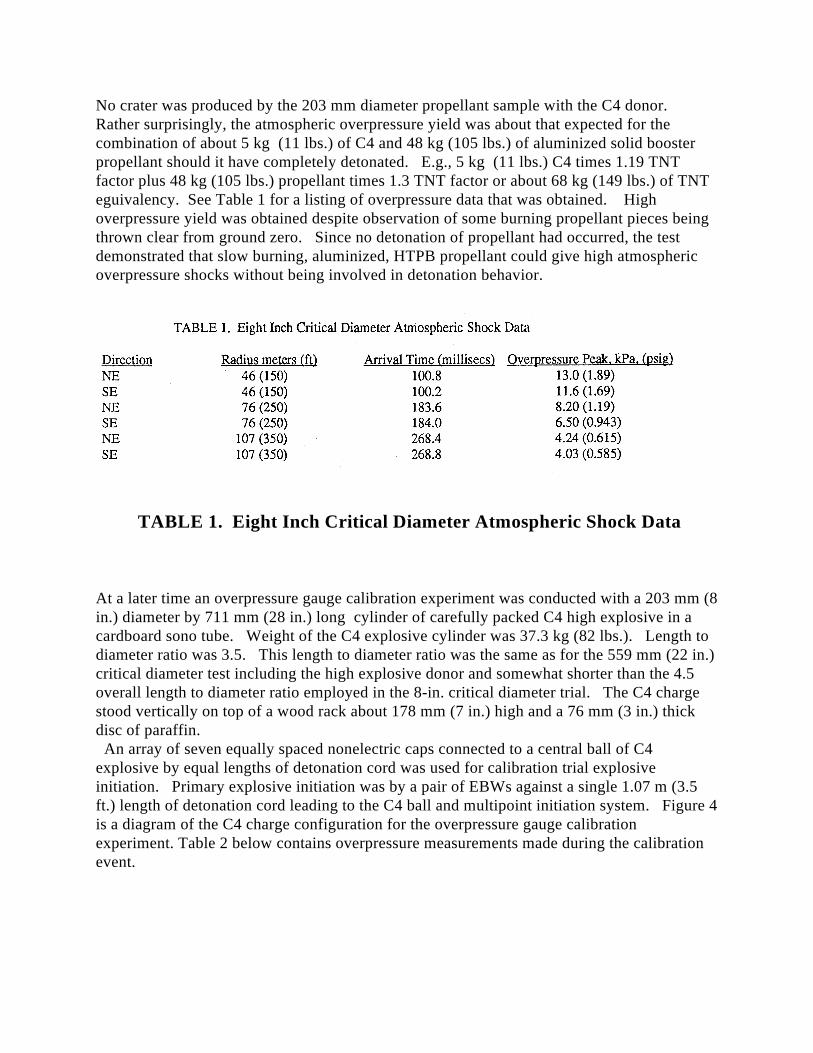
No crater was produced by the 203 mm diameter propellant sample with the C4 donor. Rather surprisingly, the atmospheric overpressure yield was about that expected for thecombination of about 5 kg (11 lbs.) of C4 and 48 kg (105 lbs.) of aluminized solid boosterpropellant should it have completely detonated. E.g., 5 kg (11 lbs.) C4 times 1.19 TNTfactor plus 48 kg (105 lbs.) propellant times 1.3 TNT factor or about 68 kg (149 lbs.) of TNTeguivalency. See Table 1 for a listing of overpressure data that was obtained. Highoverpressure yield was obtained despite observation of some burning propellant pieces beingthrown clear from ground zero. Since no detonation of propellant had occurred, the testdemonstrated that slow burning, aluminized, HTPB propellant could give high atmosphericoverpressure shocks without being involved in detonation behavior.
TABLE 1. Eight Inch Critical Diameter Atmospheric Shock Data
At a later time an overpressure gauge calibration experiment was conducted with a 203 mm (8in.) diameter by 711 mm (28 in.) long cylinder of carefully packed C4 high explosive in acardboard sono tube. Weight of the C4 explosive cylinder was 37.3 kg (82 lbs.). Length todiameter ratio was 3.5. This length to diameter ratio was the same as for the 559 mm (22 in.)critical diameter test including the high explosive donor and somewhat shorter than the 4.5overall length to diameter ratio employed in the 8-in. critical diameter trial. The C4 chargestood vertically on top of a wood rack about 178 mm (7 in.) high and a 76 mm (3 in.) thickdisc of paraffin. An array of seven equally spaced nonelectric caps connected to a central ball of C4explosive by equal lengths of detonation cord was used for calibration trial explosiveinitiation. Primary explosive initiation was by a pair of EBWs against a single 1.07 m (3.5ft.) length of detonation cord leading to the C4 ball and multipoint initiation system. Figure 4is a diagram of the C4 charge configuration for the overpressure gauge calibrationexperiment. Table 2 below contains overpressure measurements made during the calibrationevent.

Figure 4. Overpressure Calibration Trial Configuration

Table 2. 8-in. C4 Overpressure Calibration Trial
Overpressures are in fair aqreement with the expected TNT equivalency of 37.3 kg (82 lbs.)times 1.19 TNT factor or 44.4 kg (97.6 lbs.) of TNT equivalency.
From the 8-in. critical diameter test only the PVF2 gauge at the bottom of the propellantsample provided data. This was a time of arrival of 271.8 microseconds after EBW initiationand a shock of 3.9 kilobars. If the time for the initiation system to traverse 157.5 mm (62 in.)of detonation cord and 101.6 mm (4 in.) of C4 donor explosive is subtracted out, an averageshock velocity through the 813 m (32 in.) of propellant was a little less than 3 mm permicrosecond. This crude number agreed approximately with the limited crystal pin datareceived as given below in Table 3:
Table 3. 8-in. Critical Diameter Test Crystal Pin Times of Arrival
Thus, shock velocity through the propellant was slow compared to any expected detonationvelocity and seemed to be fading.
In Figure 5 is shown the experimental arrangement for the 559 mm (22 in.) critical diametertest. Total length of our primary propellant sample was 1760 mm (69.3 in.). At the bottomof the propellant sample stack were five short propellant cylinders having a height of 172mm (6.78 in.) each. Above the short cylinder stack was a single propellant piece of 857 mm(33.8 in.) length. This heavy piece had a 152 mm (6 in.) wide band of sono tube bonded to its

upper perimeter that was used as a means of grasping the propellant piece for lifting intransportation and placement for test. Total propellant weight was 778 kg (1712 lbs.). ThinVelostat sheet (0.03 in.) was wrapped around the sample and grounded for improvedelectrostatic safety. Similar to previous cylinder tests, the propellant sample rested upon a 178mm (7 in.) high wood rack and a 76 mm (3 in.) thick sheet of paraffin. To keep the heavysample assembly from sinking into the soil at ground zero a sheet of plywood 19 mm (0.75in.) thick and 1.22 m (4 ft.) square was placed upon the ground under the sample assembly. On top of the vertical standing sample was placed a 127 mm (5 in.) thick disc of C4 donorexplosive 546 mm (21.5 in.) in diameter. C4 weight was 47.7 kg (105 lbs.). A 19 mm(0.75 in.) thick sheet of particle board 533 mm (21 in.) in diameter served as a template for a 19 point initiation system with nineteen holes drilled through it. During test preparation thetemplate sheet was laid upon the C4 donor charge and 19 nonelectric caps attached to equallengths of detonation cord were inserted into the holes. The nineteen 508 mm (20 in.) lengthdetonation cords were taped together and inserted into a 38 mm (1.5 in.) diameter ball of C4explosive taped to a lightweight wood support. A single strand of 1.07 m (3.5 ft.) longdetonation cord led to the C4 ball from a pair of EBW initiators.

Figure 5. 22-in. Critical Diameter Test Configuration
Positions of sensors for the 22-in. critical diameter test sample are indicated in Figure 6. Two vertical rows of eleven crystal pins 180 degrees apart were employed. Crystal pin rowsstarted 236 mm (9.3 in.) from the top of the propellant cylinder and were spaced 152 mm (6in.) apart. Twelve PVF2 gauges were installed with three at each of four levels. The PVF2gauges were at top, 940 mm (37 in.) down, 1473 mm (58 in.) down, and bottom of thepropellant cylinder. At each PVF2 level gauges were set along a line at center, half radius,and edge of the propellant sample. Upward from the sample bottom and 180 degrees apartwere placed two crushing resistor, detonation velocity probes. One probe was 610 mm (24in.) long and the other was 1220 mm (48 in.) long.

Figure 6. 22 in. Test Sensor Positions
When the 22-in. critical diameter test was conducted, high atmospheric overpressures wereobserved, some flaming propellant fragments were observed, and the 19 mm (0.75 in.) thickplywood board upon which the propellant and supports rested was not punctured. Unfortunately, only three overpressure measurements were obtained since a burningpropellant fragment severed wires within a terminal box about 50 ft. from ground zero. Acceptable 34,000 quarter frames per second photographs were obtained showingshock/flame front progression down the length of the propellant sample. Crystal pin data, forthe most part, was very consistent, detonation velocity probe data was fairly indecipherable,and PVF2 gauge data was analyzed with some difficulty. Although lack of detonation wasindicated by absence of a crater and surviving piece of plywood support, relatively highenergy yield was transferred into atmospheric shock. See Table 4 below for atmospheric

overpressures:
Table 4. 22-in. Critical Diameter Test Overpressures
Overpressures above suggest a TNT equivalency of about 950 kg (2100 lbs.). Estimation ofTNT yields based on overpressures would be about 778 kg of propellant times 1.3 plus 48 kgof C4 times 1.19 for an estimated total of 1070 kg (2350 lbs.) TNT equivalent. Overpressures obtained were roughly 90% of estimated maximum energetic yield.
Shock velocities derived from crystal pin time of arrivals are given below in Table 5. Pinswere numbered from 1 to 11 in one vertical line and from 12 to 22 in a second line 180degrees away on the sample. As can be seen a fading shock ranging from about 4 mm permicrosecond down to just above 2 mm per microsecond near the bottom end of the propellantcylinder was observed.
Table 5. 22 -in. Test Shock Velocities From Crystal Pins
Table 6 below displays values for PVF2 gauges placed in the 22-in. critical diameter test.

Table 6. 22-in. Diameter Test PVF2 Data
PVF2 gauges gave pressures that are somewhat suspect in value until we can determine howmuch signal contribution came from strain of the gauges during the explosive event. Aninteresting factor was the appearance of a second, more sustained, and stronger pulsefollowing the first pressure pulse by about 30 to 65 microseconds. See Figure 7 for a recordshowing a second pressure following the first by about 65 microseconds. Computermodeling of the propellant reactive processes can show similar behavior as discussed later. At this time it is uncertain whether this second pulse is enhanced by an electrical signalproduced by mechanical strain of the PVF2 gauge. Future testing awaits resolution byutilizing strain gauge and PVF2 pairs in a similar environment.
A series of quarter frame photos at 34,000 pictures per second exhibited a relatively steadyprogression of reaction flame front down the length of the 22 in. sample. Measurementstaken off the photos gave varying results frame to frame due to difficulty resolving arelatively fuzzy leading edge to the flame front. Since the propellant cylinder was wrappedwith a layer of thin Velostat plastic sheet, its contribution to camera viewing distortion of theflame front is not known. Overall, an average velocity over the total sample was about 2.4mm per microsecond. This velocity basically agrees with data from the crystal pin and PVF2gauge times of arrival.

Figure 7. PVF2 Record at Half Radius 903 mm from Top of 22-in. Propellant
Cylinder
A 406 mm (16 in.) critical diameter experiment was conducted with our second propellantthat contains iron oxide and had a higher burn rate (10.7 mm/sec, 0.42 ips at 6.9 MPa) thanfor our primary propellant. Several changes were made in the test configuration. The biggest change was to utilize an ammonium perchlorate (AP) explosive donor rather than aC4 donor. In previous work looking at explosive properties of AP detonation shockvelocities were about 3 to 4 mm/microsec. and estimated shock intensity was about thatobserved in solid propellant reactions, 35 to 45 kilobars. It seemed possible that explosivetransition from the AP to the propellant would occur without the strong overdriving providedby C4 explosive. In addition, long shock times were desired since our experimentation wasintended to give some insights into processes that would occur in propellant during failedlaunch fall back events that would have long shock periods upon collision with the earth. Toobtain a longer initial shock period the AP donor was made 1067 mm (42 in.) deep at 406 mm(16 in.) diameter. Another change was the addition of 203 mm (8 in.) and 102 mm (4 in.)wide bands of soft aluminum around the AP and propellant sample cylinders, respectively. Aluminum bands were an attempt to gain photographic information on lateral accelerations ofthe AP and propellant due to an explosive event. Lateral acceleration is a parameter that canbe used by the LLNL reactive response code. Explosive initiation of the AP wasaccomplished by two EBWs on the end of a 1.22 m (48 in.) length of detonation cord leadingto a hemispherical C4 explosive charge buried at the surface of a 305 mm (12 in.) diameter by 152 mm (6 in.) depth of AP resting atop a thin sheet of wood centered upon the main APcharge that had a diameter the same as the propellant sample and a length of 1067 mm (42in.). The propellant sample was made up of a top segment 305 mm (12 in.) long, a midsegment 102 mm (4 in.) long, and a bottom segment 406 mm (16 in.) long. Total sampleand initiating charge structure were set upon a 76 mm thick by 0.91 m square wood sheetsupported from the ground by a pair of 76 mm square by 0.91 m long wood pieces. Figure 8
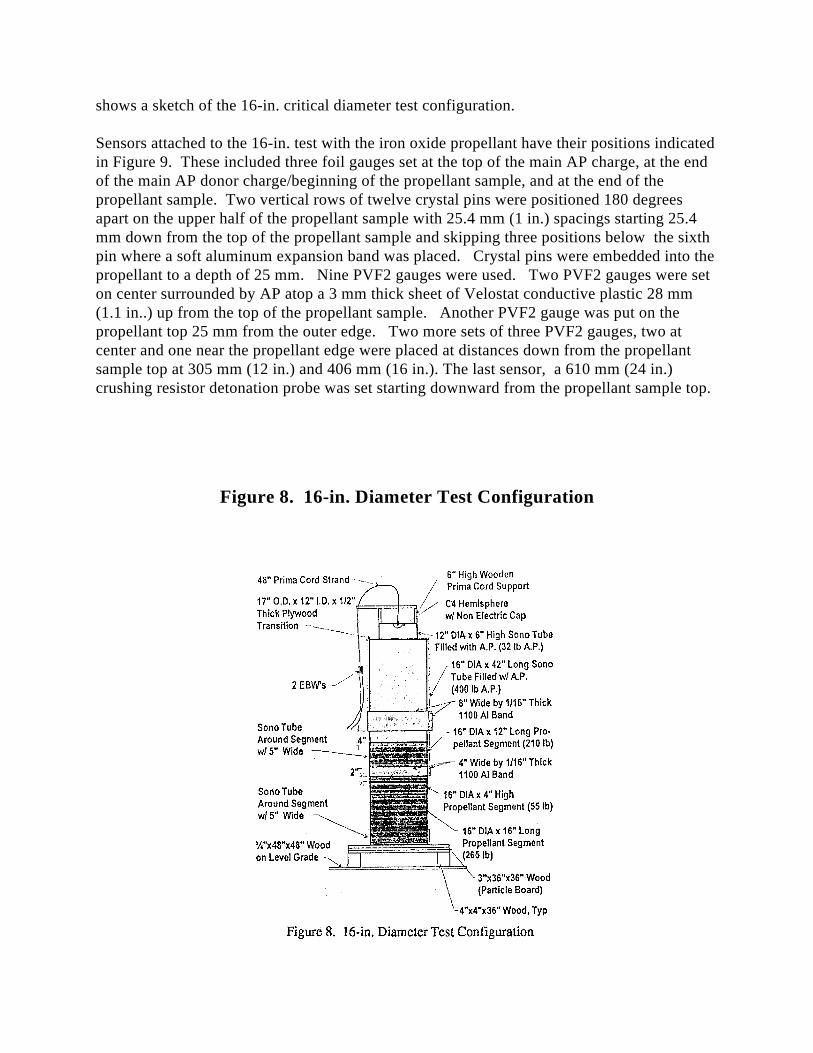
shows a sketch of the 16-in. critical diameter test configuration.
Sensors attached to the 16-in. test with the iron oxide propellant have their positions indicatedin Figure 9. These included three foil gauges set at the top of the main AP charge, at the endof the main AP donor charge/beginning of the propellant sample, and at the end of thepropellant sample. Two vertical rows of twelve crystal pins were positioned 180 degreesapart on the upper half of the propellant sample with 25.4 mm (1 in.) spacings starting 25.4mm down from the top of the propellant sample and skipping three positions below the sixthpin where a soft aluminum expansion band was placed. Crystal pins were embedded into thepropellant to a depth of 25 mm. Nine PVF2 gauges were used. Two PVF2 gauges were seton center surrounded by AP atop a 3 mm thick sheet of Velostat conductive plastic 28 mm(1.1 in..) up from the top of the propellant sample. Another PVF2 gauge was put on thepropellant top 25 mm from the outer edge. Two more sets of three PVF2 gauges, two atcenter and one near the propellant edge were placed at distances down from the propellantsample top at 305 mm (12 in.) and 406 mm (16 in.). The last sensor, a 610 mm (24 in.)crushing resistor detonation probe was set starting downward from the propellant sample top.
Figure 8. 16-in. Diameter Test Configuration
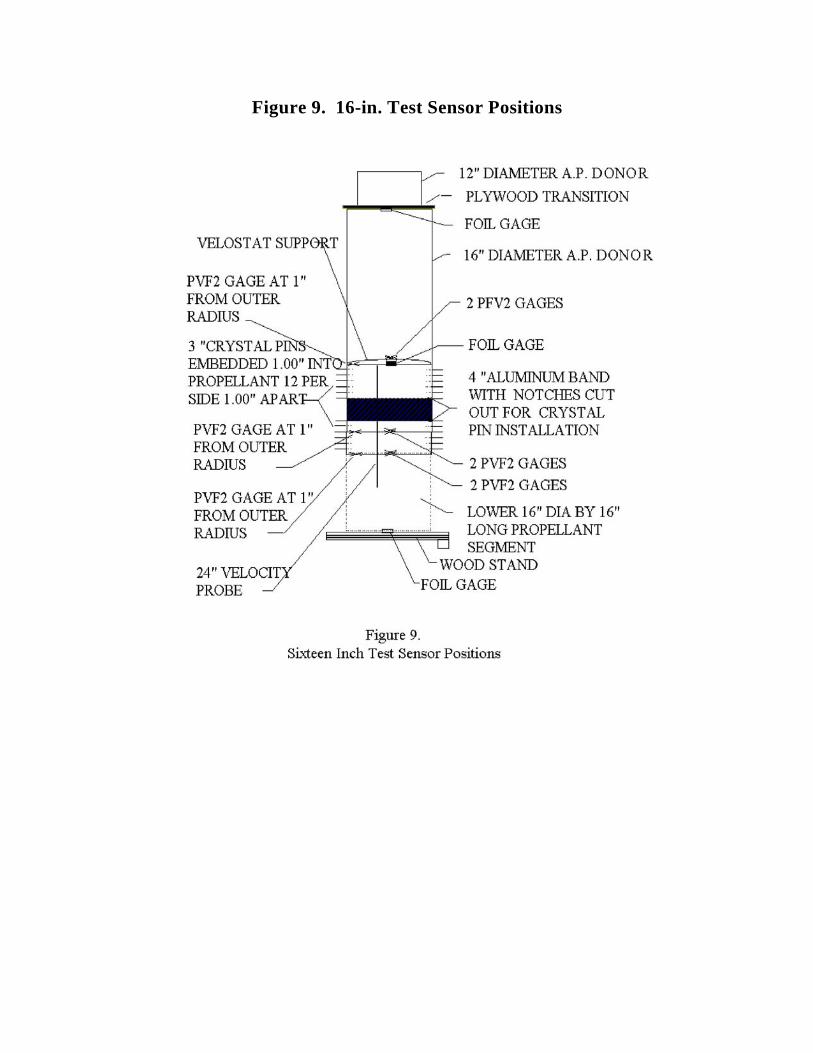
Figure 9. 16-in. Test Sensor Positions

Cameras and atmospheric overpressure sensors did not record the event when the 16-in. testwas initiated. As a result, aluminum band lateral expansions and TNT yields were not ob-tained. No evidence of unburned propellant pieces or of new aluminum oxide spotsindicating propellant fragment burning was observed. However, high speed sensors, crystalpins, PVF2 gauges, and detonation probe gave signals. Detonation probe output was quitenoisy. This detonation probe noise may have occurred because shock pressures at thepropellant surface were low. Pressures reported by PVF2 gauges at the edge of the propellantsample were about 1.8 kbar at the beginning increasing to about 15 kbar at 406 mm down thesample. Although all PVF2 gauges gave times of arrival, an unprotected sensor just above thesample in the AP and a sensor at the top edge of the propellant did not give readable pressuresignals. See Table 7 for crystal pin and foil gauge data and Table 8 for PVF2 data. Fromthese data a substantial difference in times of arrival amounting to several microsecondsbetween the response of crystal pins and PVF2 gauges can be detected. Within each type ofsensor calculated velocities seem to agree.

Table 7. 16-in. Diameter Crystal Pin and Foil Gauge Data for Iron Oxide -HTPB Propellant
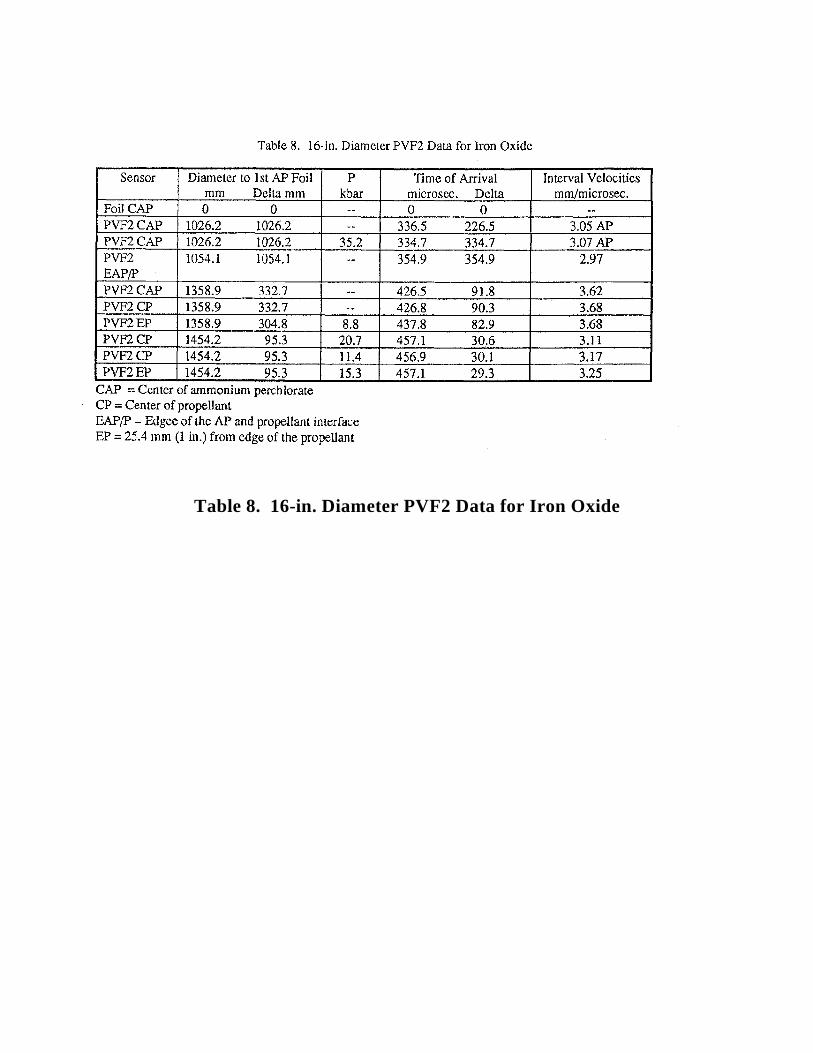
Table 8. 16-in. Diameter PVF2 Data for Iron Oxide

In contrast with the 22-in. test using the primary test propellant a small crater was formed bythe 16-in. diameter experiment using our second test propellant. The crater was about 0.23 m (9 in.) deep by about 0.76 m (30 in.) diameter. A relatively small shock velocity differenceat the bottom of the propellant cylinders, e.g., about 2.3 mm/microsec. for the 22-in. test and3.1 mm/microsec. for the 16-in. test, seems to correlate with considerable difference incratering ability in an explosive event. Since crystal pins and PVF2 gauges indicatedslowing of explosive shock through the 16-in. diameter propellant sample, a detonation wasnot observed; but a slightly larger diameter might provide a steady shock event. A roughestimate based on the 22-in. and 16-in. critical diameter test data would conclude that criticaldiameters of the two propellants might differ by a factor of two. Relatively small changes inthe formulations and in propellant burn rates are responsible for the substantial criticaldiameter differences. Elucidation of factors contributing to the sizable critical diameterdifferences for the two propellants awaits support for a more extended experimental program.
At the beginning of the program it was recognized that an economical approach to boosterpropellant impact studies was desired as compared to rocket sled impacts. This would entail low cost acceleration and facility refurbishment techniques and a static, highlyinstrumented propellant sample for acquiring a rich array of data. The Gurney approach forproducing high speed steel plates by setting off a sheet of high explosive sandwiched betweensteel plates seemed attractive. Upon review the second free flying steel plate seemedunnecessary, and one plate for impacting the samples driven by a substantially larger quantityof driver explosive seemed appropriate. This was favorable since one destructive heavyfragment was removed from the impact experiments. By configuring the system so that theimpact plate was driven vertically downward lateral flight of the steel impact plate or animpact plate fragment would be minimized. See Figure 10 for a sketch indicating drivercharge, wood buffer material for minimizing plate distortion, steel plate, propellant sample,etc.
Two above ground plate impact experiments have been carried out. The second of the plateimpact trials will be described here to provide an example of how they are conducted andresults that were obtained. Components supporting the driver charge, steel impact plate, andour primary propellant sample are made of wood, wood dowels, and adhesives to avoid longrange, high speed fragments dangerous to our close-in (64 m, 210 ft.) high speed cameras. Legs were constructed of 102 by 102 mm (4 by 4 in.) wood beams. A 178 mm (7 in.) thicktable rested atop four legs that was used as a platform for a 1.22 mm (48 in.) diameter drivercharge of AP 203 mm (8 in.) deep encircled by a 305 mm (12 in.) high cardboard tube,adhesive held a 76 mm (3 in.) thick by 0.61 m (24 in.) diameter, 175 kg (385 lbs.), steelimpact plate on the table bottom, and attached were three wood dowel tensile memberssupporting an underslung wood platform for placement of a 508 mm (20 in.) diameter by 508mm (20 in.) long propellant sample weighing 185 kg (408 lbs.) located 102 mm (4 in.) below the steel plate. The bottom of the propellant sample was located 48 m (19 in.) above groundlevel. A soft aluminum, 102 mm (4 in.) wide band was placed around the propellant samplewith the top edge positioned 248 mm (9.75 in.) below the top of the sample cylinder. Thisband was intended to provide photographic information about sample lateral accelerationduring the impact event useable by the CALE computer code if the image was not obscured

by a debris cloud produced by the event. Explosive initiation was conducted through anoiseless trunkline system to 19 simultaneous, individual detonators resting against a 6.4 mm(0.25 in.) thick sheet of DuPont DETA sheet resting on the upper surface of AP drivingcharge of 203 mm (8 in.) thickness.

Figure 10. Plate Two Test Configuration

Figure 11 indicates positions of sensors put on the propellant sample in the Plate 2 test. Apair of PVF2 gauges were set at each of three locations, top, 305 mm down from the top at aseparation in the propellant sample, and bottom of the propellant cylinder 406 mm down fromthe top. Two PVF2 gauges were set at the propellant separation 25 mm (1 in.) from theoutside surface of the propellant. One additional PVF2 gauge was set under the propellantsample bottom 25 mm (1 in.) from the sample cylinder outer surface. One vertical row of 10crystal pins was placed on the sample cylinder starting at 38 mm (1.5 in.) from the top with aspacing of 38 mm (1.5 in.). The vertical crystal pin array was interrupted between 229 mm(9 in.) and 356 mm (14 in.) to allow placements of a 102 mm wide soft aluminum bandaround the sample cylinder that was hoped to be seen expanding during the plate impactevent. Four crystal pins were set just outside the radius of the propellant sample with the firstcrystal pin 10 mm below the impact plate and with successive 10 mm vertical spacingsbetween the crystal pins. The four plate velocity meauring crystal pins were placed aboutequidistant between two pairs of three sets of crystal pins with 120 degree spacings intendedto detect plate tilt at impact. Spacings for the three sets of tilt measuring crystal pins were at2.7 and 14.2 mm (0.15 and 0.557 in.), 5.3 and 16.3 mm (0.208 and 0.653 in.) and 4.2 and16.7 mm (0.165 and 0.659 in.) vertically above the propellant sample cylider top,respectively. A pair of crushing resistor type detonation velocity probes of 508 mm (20 in.)length were placed vertically on opposite sides of the propellant sampls.
Figure 11. Plate 2 Test Sensor Positons

The 1000 and 20,000 frames per second cameras performed well in the Plate 2 experiment. Most atmospheric overpressure and crystal pin sensors provided data, but only four out of 10OVF2 gauges gave meaningful results.Observation by video camera during the eventindicated fragments of low angle flying, burning propellant fragments emerging from a dustcloud about 200 millisecs. after initiation. Infrequent pieces of unburned propellant werefound on the ground ranging in size from a few grams to about 500 grams. Most unburnedfragments were located in a circular pattern roughly 90 to 150 m (300 to 500 ft.) distancefrom ground zero. Larger fragments were much fewer than the smaller fragments. A numberof aluminum oxide residue spots, perhaps, fewer than recovered unburned pieces ofpropellant were found on the ground in a random pattern indicating where pieces of solidpropellant had fallen and burned. The steel impact plate was flat, near the center, and facedown in a shallow ground crater about 15 cm (5 in.) deep and about 1.5 m (5 ft.) in diameter. This suggested that the steel plate may not have been overturned during the event. The steelplate was made thinner by the impact process since the upper side diameter was 654 mm(26.75 in.) and the lower side diameter was 622 mm (24.5 in.) versus the uniform originalplate diameter of 610 mm (24 in.). The crater bottom was relatively flat with rounded cornersrising to the surface, perhaps, indicating a blowing action of propellant out from under thesteel plate. If this is true, the major part of the propellant energetic response to being struckby a high speed, heavy steel plate may have occurred only after the propellant with the plateon top had hit the ground. The arc of the propellant fragments observed by video supportedthis conclusion.
Atmospheric overpressures produced, as provided in Table 9 below by the Plate 2 test,indicated an atmospheric shock roughly equivalent to about 160 kg (580 lbs.) of TNT. Subtracting 93 kg (205 lbs.) of TNT equivalent for the combined total 290 kg (640 lbs.) of APand 12 kg of DETA sheet driver charge, about 170 kg (375 lbs.) of TNT equivalent wasproduced by the propellant sample. TNT equivalents of 0.3 and 1.0 were used for the AP andDETA sheet, respectively. Using these figures, roughly 70% of the propellant samplecontributed to atmospheric shock (used 1.3 TNT equivalent for propellant).

Table 9. Atmospheric Overpressures for Plate 2 Test with Low Rate Propellant
Below is displayed crystal pin time of arrival data for the plate 2 test in Table 10 and PVF2gauge data is exhibited in Table 11. Examination of these data come to the conclusion that the steel plate hit the propellant sample at about 230 m (750 ft.) per second near the edge ofthe propellant and faster at the center of the propellant sample. Using arrival times for crystalpin 8 (CP8) and PVF1, the plate center protruded at least 16 mm (0.6 in.) at impact betweenthe steel plate and the propellant. Center extension may have been more since PVF2 gaaugestypically lag crystal pin reaction times by a few microseconds. It is somewhat surprising thatthe steel plate as recovered after the Plate 2 test was rather uniformly flat. This indicates thatplate bending by the acceleration process was almost exactly reversed by impact with thepropellant sample. A confusing result in the crystal pin time of arrival data was the time ofarrival for the plate at the propellant surface as indicated by crystal pins located between theinitial steel plate position and the top of the propellant sample after the time of arrival forcrystal pins inserted into the propellant cylinder. After some consultation with advisors forour program, the conclusion was that in the absense or lack of Le Croy recordersynchronization errors air shock provided by our greatly extended driver charge (1.22 mcharge diameter versos 0.61 m plate diameter and 0.51 m propellant cylinder diameter) wasstrong enough to trigger crystal pins inserted into the propellant, but not strong enough totrigger PVF2 gauges. This suggests that the configuration of subsequent plate impactexperiments will require massive shield structure around the propellant sample to preventfalse readings from crystal pins embedded in the propellant. PVF2 gauge readings exhibitedpressures within the impacted propellant cylinder as being between 0.8 and 9.7 kbars. Pressures were less than 40 kbars in the 22-in. critical diameter test. These low pressures inrelatively strongly reacting propellant hold out hope that RTGs (radioisotope thermoelectricgenerators) may avoid disruption that could cause plutonium 238 dispersal in a failed launchaccident using slow rate booster propellants.

Table 10. Plate 2 Impact Test Crystal Pin Data for Primary HTPBPropellant

Table 11. Plate 2 PVF2 Data
BOOSTER PROPELLANT MODELING
A new reactive-flow model in the CALE computer code (3) has been developed to help usunderstand the behavior of Titan IV propellant composed of AP, HTPB and aluminum. Sucha system is characterized by two time scales which make it very difficult to use the standardTarver Ignition-Growth-Completion (IGC) mechanism (4) to model the explosives. The firsttime scale is the rate of the AP-binder reaction. The second is the metal burning rate, which isslower than the AP burning rate.
In this model, we have attempted to keep the essential elements of the IGC model, whilechanging the meaning of some of its compontnes to more closely correlate with themechanisms found in HTPB propellants.
Because of the disparity between the two reaction time scales, it is likely that the detonatingexplosive will spend a large time in a state where the AP-HTPB has all reacted, while thealuminum is mostly unreacted. Physically, the explosive goes from a material which is coldand stiff (unreacted) to a material which is warm and gassy (oxidizer and fuel reacted,aluminum not) to a material which is hot and less gassy (everything reacted). It is virtuallyimpossible to construct the equation of state for the intermediate based on the equation ofstate of the reactants and products. Therefore, we found it necessary to introduce a thirdequation of state into the reactive flow framework. This equation of state will have theproperties associated with the physical properties of reacted AP-binder products andunreacted aluminum.
Given three states that the system can travel between, it is now necessary to construct areaction model that incorporates the reactive concepts described here.

AP + Al ---> AP products + Al ---> AP + Al products (1)
We begin with the following assumptions:
* Three equations of state: A. Unreacted EoS (equation s of state) B. Fully reacted AP-binder, unreacted aluminum C. Fully reacted AP, binder and aluminum
* The aluminum only reacts with the AP-binder products.* The AP-binder reaction is independent of the A1, except for dilution effects.* Model the AP-binder reaction a modified Ignition and Growth terms of the IGC model.* Model the Al reaction with a modified completion expression.
The reaction scheme can be written as followsA ---> B
B + C ---> Dwhere A is the AP-binder reactant, B is AP-binder product, C is the aluminum, and D is thefinal product. The AP-binder conservation relation is
[A] + [B] + [D] = [E]and the aluminum conservation relation is
[C] + [D] = [M].
We are using molar equivalents in these equations. equivalent of AP-binder is the amount thatproduces enough product gasses to react with one mole of aluminum. We now write the firstreaction rate expression:
The strain rate enhancement term in the decomposition/burn term was added after theexperimental measurements indicated that there was a large second pressure pulse followingthe initial shock wave. The phenomenological justification for this factor is that the shearstress from the initial shock wave cracks the propellant, thereby increasing the surface areaavailable for burning. However, while the system is in compression this new burn area onlybecomes available when the propellant is no longer under compression. It was decided tokeep the number of coefficients in this portion of the model to a minimum because of the lack
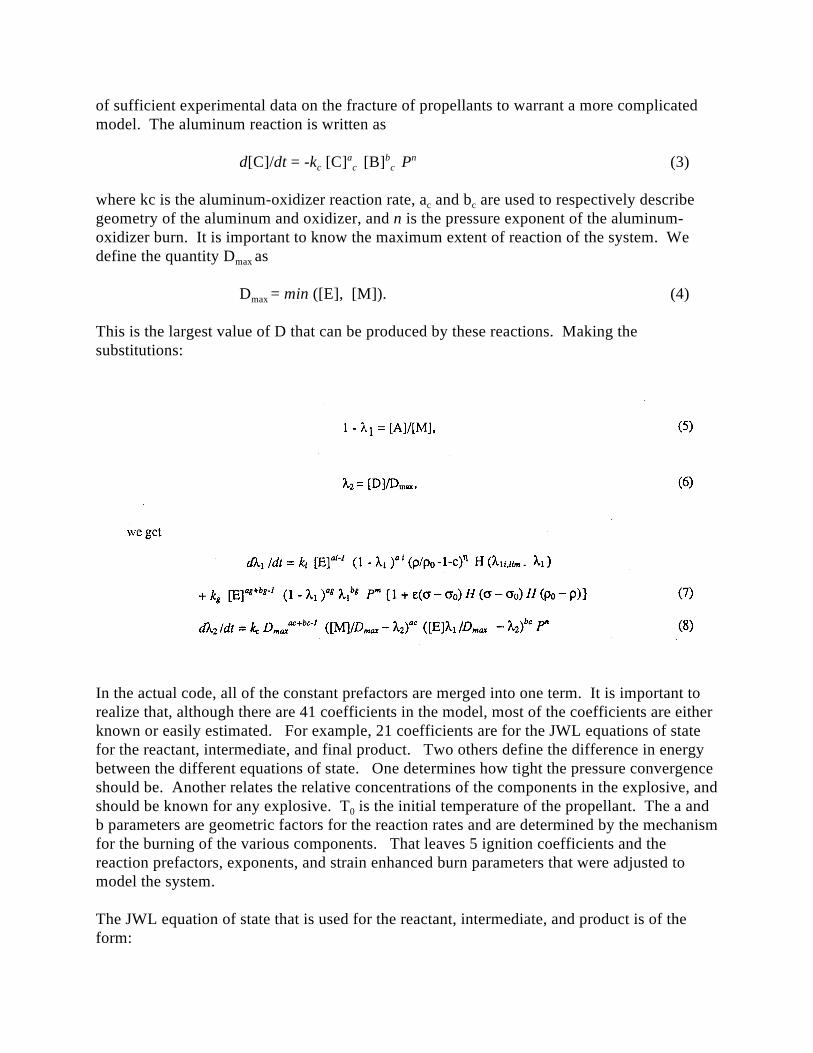
of sufficient experimental data on the fracture of propellants to warrant a more complicatedmodel. The aluminum reaction is written as
d[C]/dt = -k [C] [B] P (3)c c c a b n
where kc is the aluminum-oxidizer reaction rate, a and b are used to respectively describec c
geometry of the aluminum and oxidizer, and n is the pressure exponent of the aluminum-oxidizer burn. It is important to know the maximum extent of reaction of the system. Wedefine the quantity D asmax
D = min ([E], [M]). (4)max
This is the largest value of D that can be produced by these reactions. Making thesubstitutions:
In the actual code, all of the constant prefactors are merged into one term. It is important torealize that, although there are 41 coefficients in the model, most of the coefficients are eitherknown or easily estimated. For example, 21 coefficients are for the JWL equations of statefor the reactant, intermediate, and final product. Two others define the difference in energybetween the different equations of state. One determines how tight the pressure convergenceshould be. Another relates the relative concentrations of the components in the explosive, andshould be known for any explosive. T is the initial temperature of the propellant. The a and0
b parameters are geometric factors for the reaction rates and are determined by the mechanismfor the burning of the various components. That leaves 5 ignition coefficients and thereaction prefactors, exponents, and strain enhanced burn parameters that were adjusted tomodel the system.
The JWL equation of state that is used for the reactant, intermediate, and product is of theform:

The values used in this calculation are given in the following table:
Table 12. JWL Equation of State Parameters
These parameters were obtained from a variety of source information. The reactant equationof state of developed by Ed Lee based on the Us - Up relation for the initial material. Theintermediate equation of state was dderived from a CHEQ (5) calculation where the unreactedAl was replaced by inert carbon at the same weight percent. The release isentrope was then fitto a JWL EOS form by minimizing the error in the logarithm of the energy, after ensuring thatthe CJ conditions were satisfied. The final product EOS was fit in a similar manner, exceptthat the underlying calculations were derived from a TIGER-BKW (6) calculation. The termsQ and Q are the amount of energy that is released going from the reactant to ther to i i to p
intermediate, and from the intermediate to the final product. A simple strength model hasbeen used for the propellant. It has two terms - a compressive modulus of 0.018 Mb(megabar) and a yield strength of 0.0001 Mb. The yield strength is higher than what wouldnormally be associated with these materials. However, material strengths are known toincrease at high strain rates, such as in a shock.
Unlike the equation of state parameters which are stable and are not expected to change, thereaction rate parameters have been adjusted to match experiments. It is therefore understoodthat these rate parameters are at best provisional. The rate parameters that were used forthese calculations:

Table 13. Reactive Flow Parameters
The parameters used here have been designed for use in the modified version of CALE withcentimeter zoning in the propellant. We used centimeter zoning because the typical zoningfor explosives (mm) would have required two orders of magnitude more zones and wouldhave also decreased the time step by an order of magnitude just due to the Courrant limit. Given both the size of the typical parts, and the length of time over which the analysis mustbe performed, it was decided that standard size zoning would be impractical. Thus, it isassumed that these parameters are only an approximation of their infinitesimal zoning limits.
SUMMARY
At this point in the program we are still learning the eruptive characteristics of ourHTPB/AP/Al booster propellant. We have had a struggle in adapting and inventingexperimental methods for elucidating the explosive traits of materials that have generally nothad extended systematic investigations. We are still searching for ways to better useinstrumental sensors and to get them to survive long enough to provide data that will enhance our understanding. After getting encouragement that critical diameters for 88% solidsHTPB propellants might be in the range of 200 to 250 mm, we have found that the firstbooster propellant formulation we have looked at has a critical diameter larger than 559 mmand, perhaps, twice as large as 559 mm. Although our propellant sizes are large in normaltesting of explosive materials, they are definitely subscale compared to solid propellantbooster motors that can contain up to 500 metric tons of propellant. Larger size samplesmight be employed in the future since investigation of characteristics above critical diameterare desired. Long fabrication lead times and high costs for making samples preclude use ofsamples larger than we have on hand at this time. We are still looking forward todetermining impact velocity thresholds for producing strong atmospheric shocks. We haveobtained strong air shock yields, but rarely complete propellant consumption. We plan togain some understanding of the change of threshold input shock intensity versus propellantgrain size.
The use of a modified LLNL computer code has been rewarding. Not only did we discern adouble shock explosive process in HTPB propellants, we have been able to develop a form of

the CALE code that can mimic this characteristic. This computer code involves separatereaction kinetics for the AP-binder reaction and the AP and binder products-aluminumcombustion reaction. The hydrodynamic part of the CALE code can deal with differentequations of state involved with a variety of colliding surfaces that might occur in a failedspace booster launch operation. This is a great aid in reducing the number of neededexperiments. With the computer code we hope to meet our present goals without resorting togreatly different propellant sample size tests.
Solid rocket booster propellant in explosive events seems to provide high atmosphericoverpressure yields without being involved in true detonations. If detonations are steadystate supersonic events in the energetic material and deflagrations are explosive eventscharacterized by subsonic shock in the energetic materials, perhaps, a new definition for anexplosive process may need to be defined. This process involves a supersonic, slowing, longpropagating shock through an energetic material. Such a process might be called a dyingdetonation, and would not have the brisance and cratering capability exhibited by normaldetonating substances. None of our experiments with the slow rate HTPB propellant have asyet yielded complete energetic yield to atmospheric shock as some measure of burningpropellant fragments have been observed visually, by physical recovery of unburnedpropellant pieces, and by burn spots of aluminum oxide residue on the ground. This cannotbe said for the higher burn rate propellant that contained iron oxide. The difference in shockspeeds for the two propellants is only on the order of 0.8 mm per microsecond. Thisdifference seems to make a great difference in capability to form ground craters and toproduce evidence of burning and unburned propellant fragments. Although the compositionsof the two propellants are similar, the differences causing the change in explosivecharacter are unknown. Further effort will proceed in trying to understand the strange natureof these HTPB rocket booster propellants.

REFERENCES
(1) Brunet, J. and Salvetat, B., "Detonation Critical Diameter of Advanced Solid RocketPropellants," presented at the Joint International Symposium on Compatibility of Plastics andOther Materials with Explosives, Propellants, Pyrotechnics and Processing of Explosives, Propellant and Ingredients, New Orleans, Louisiana, 18-20 April 1988.
(2) Merrill, C.I., "Large Class 1.3 Rocket Motor Detonation Behavior," in Proceedings ofthe 1992 Department of Defense Explosive Safety Board Meeting, Sep 1992.
(3) R. Tipton, "CALE User's Manual", Lawrence Livermore National Laboratory, Livermore,CA.
(4) C.M. Tarver, J.O. Hallquist, L.M. Erickson,"Modeling short pulse duration shockinitiation of solid explosives", 8th Detonation Symposium, pp. 951-961, 1985.
(5) A.L. Nichols and F.H. Ree, "CHEQ 2.0 User's Manual" UCRL-MA 106754, LawrenceLivermore National Laboratory, Livermore, CA, December 1990.
(6) M. Cowperthwaite and W.H. Zwisler, "Tiger Computer Program Documentation", SRIPublication No. Zi06, 1973.
ACKNOWLEGEMENTS
We thank the Titan IV System Program Office, the Research Triangle Institute of CocoaBeach, the Eastern Range Safety Office at Patrick AFB, and our project consultants forfinancial support and encouragement without which this experimental and code developingprogram would not have been possible.
We owe many thanks to Wyle laboratories personnel for timely completion of the manynonstandard tasks that have been given to them for this project. Special mention to RonLambert, test engineer, for innovative and practical test designs; Ted Mullins, Wylesupervisor for innovative construction, purchasing, and finding the noiseless trunkline; Larry Wilburn and John Morrow, mechanics, who have provided innovative test articlesupport construction; Ray Gonzales and Ray Miskofsky, instrumentation engineers; and themany others supporting the effort who have not been mentioned.