Embed Size (px)
Citation preview

Article
Educational and PsychologicalMeasurement
1–23� The Author(s) 2019
Article reuse guidelines:sagepub.com/journals-permissionsDOI: 10.1177/0013164419827345
journals.sagepub.com/home/epm
Exploring the ImpersonalJudgments and PersonalPreferences of Raters inRater-Mediated AssessmentsWith Unfolding Models
Jue Wang1 and George Engelhard Jr.2
Abstract
The purpose of this study is to explore the use of unfolding models for evaluatingthe quality of ratings obtained in rater-mediated assessments. Two different judgmen-tal processes can be used to conceptualize ratings: impersonal judgments and per-sonal preferences. Impersonal judgments are typically expected in rater-mediatedassessments, and these ratings reflect a cumulative response process. However,raters may also be influenced by their personal preferences in providing ratings, andthese ratings may reflect a noncumulative or unfolding response process. The goal ofrater training in rater-mediated assessments is to stress impersonal judgments repre-sented by scoring rubrics and to minimize the personal preferences that may repre-sent construct-irrelevant variance in the assessment system. In this study, we explorethe use of unfolding models as a framework for evaluating the quality of ratings inrater-mediated assessments. Data from a large-scale assessment of writing in theUnited States are used to illustrate our approach. The results suggest that unfoldingmodels offer a useful way to evaluate rater-mediated assessments in order to initiallyexplore the judgmental processes underlying the ratings. The data also indicate thatthere are significant relationships between some essay features (e.g., word count, syn-tactic simplicity, word concreteness, and verb cohesion) and essay orderings based on thepersonal preferences of raters. The implications of unfolding models for theory andpractice in rater-mediated assessments are discussed.
1University of Miami, Coral Gables, FL, USA2University of Georgia, Athens, GA, USA
Corresponding Author:
Jue Wang, School of Education and Human Development, University of Miami, 1507 Levante Avenue, Max
Orovitz Building 310B, Coral Gables, FL 33146, USA.
Email: [email protected]

Keywords
unfolding models, rater judgments, essay features, rater-mediated assessments
Rater-mediated performance assessments are widely used in many countries to mea-
sure student achievement. Lane (2016) noted that ‘‘performance assessments that
measure critical thinking skills are considered to be a valuable policy tool for improv-
ing instruction and student learning in the 21st century’’ (p. 369). Performance assess-
ments can be meaningfully viewed as rater-mediated assessments because the ratings
modeled in our psychometric analyses are obtained from human judges (Engelhard,
2002). One of the critical concerns for rater-mediated assessments is how to evaluate
the quality of judgments obtained from raters.
Previous research on evaluating the quality of ratings in rater-mediated assess-
ments is primarily guided by a paradigm for rater cognition that stresses impersonal
judgments and cumulative response processes (Engelhard & Wind, 2018). There are
a variety of measurement models that can be used to evaluate the ratings, including
hierarchical rater model (Patz, Junker, Johnson, & Mariano, 2002), many-facet Rasch
model (Linacre, 1989), rater bundle model (Wilson & Hoskens, 2001), and general-
ized rater model (Wang, Su, & Qiu, 2014). Generalizability theory (Brennan, 1992) is
also popular in exploring the attribution of variation due to a rater facet (Marcoulides
& Drezner, 2000). In addition, latent class modeling, including signal detection the-
ory (DeCarlo, 2005), and nonparametric methods, such as Mokken scale analysis
(Wind & Engelhard, 2015), have been developed for rater-mediated assessments.
Earlier studies have used unfolding models to evaluate accuracy ratings in their anal-
yses (Wang, Engelhard, & Wolfe, 2016). Accuracy ratings can be defined as the dif-
ference between observed or operational and criterion ratings given by a panel of
expert raters.
In this study, observed polytomous ratings are examined to explore rater response
processes. A limitation in earlier studies was the lack of consideration of the underly-
ing response processes and the detection of whether raters might use impersonal
judgments as intended or personal preferences that may reflect potential biases. The
current study is designed to evaluate if the personal preferences of raters play a role
in making scoring decisions and to explore the underlying scale based on an unfold-
ing model.
Distinctions Between Impersonal Judgment and PersonalPreferences
Engelhard, Wang, and Wind (2018) proposed a conceptual model for evaluating
rater-mediated assessments. They stressed the complementary functions between a
cognitive perspective that defines a model of human judgmental process and a psy-
chometric perspective that defines an appropriate measurement model. Within the
context of rater evaluation, whether a rater is making an impersonal judgment or
2 Educational and Psychological Measurement 00(0)
personal preference is potentially identifiable by the measurement model selected for
conducting the psychometric analysis. The current study focuses on the second model
regarding the measurement of rater preferences as a potential source of construct-
irrelevant variance and systematic bias in ratings using an unfolding model.
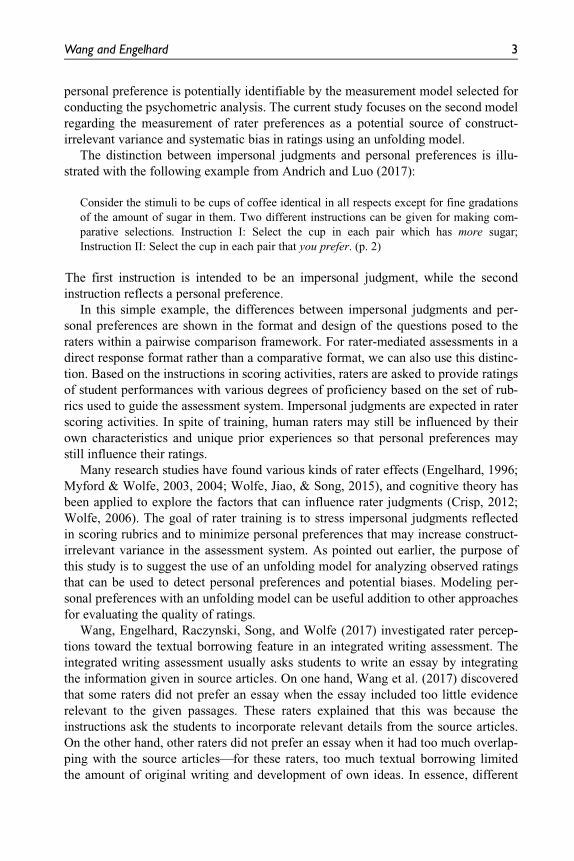
The distinction between impersonal judgments and personal preferences is illu-
strated with the following example from Andrich and Luo (2017):
Consider the stimuli to be cups of coffee identical in all respects except for fine gradations
of the amount of sugar in them. Two different instructions can be given for making com-
parative selections. Instruction I: Select the cup in each pair which has more sugar;
Instruction II: Select the cup in each pair that you prefer. (p. 2)
The first instruction is intended to be an impersonal judgment, while the second
instruction reflects a personal preference.
In this simple example, the differences between impersonal judgments and per-
sonal preferences are shown in the format and design of the questions posed to the
raters within a pairwise comparison framework. For rater-mediated assessments in a
direct response format rather than a comparative format, we can also use this distinc-
tion. Based on the instructions in scoring activities, raters are asked to provide ratings
of student performances with various degrees of proficiency based on the set of rub-
rics used to guide the assessment system. Impersonal judgments are expected in rater
scoring activities. In spite of training, human raters may still be influenced by their
own characteristics and unique prior experiences so that personal preferences may
still influence their ratings.
Many research studies have found various kinds of rater effects (Engelhard, 1996;
Myford & Wolfe, 2003, 2004; Wolfe, Jiao, & Song, 2015), and cognitive theory has
been applied to explore the factors that can influence rater judgments (Crisp, 2012;
Wolfe, 2006). The goal of rater training is to stress impersonal judgments reflected
in scoring rubrics and to minimize personal preferences that may increase construct-
irrelevant variance in the assessment system. As pointed out earlier, the purpose of
this study is to suggest the use of an unfolding model for analyzing observed ratings
that can be used to detect personal preferences and potential biases. Modeling per-
sonal preferences with an unfolding model can be useful addition to other approaches
for evaluating the quality of ratings.
Wang, Engelhard, Raczynski, Song, and Wolfe (2017) investigated rater percep-
tions toward the textual borrowing feature in an integrated writing assessment. The
integrated writing assessment usually asks students to write an essay by integrating
the information given in source articles. On one hand, Wang et al. (2017) discovered
that some raters did not prefer an essay when the essay included too little evidence
relevant to the given passages. These raters explained that this was because the
instructions ask the students to incorporate relevant details from the source articles.
On the other hand, other raters did not prefer an essay when it had too much overlap-
ping with the source articles—for these raters, too much textual borrowing limited
the amount of original writing and development of own ideas. In essence, different
Wang and Engelhard 3
raters have assigned a lower score for two completely opposite reasons. To concep-
tualize these ratings, an unfolding response process provides a framework for identi-
fying raters who assign low ratings for different reasons. Unfolding models allow
researchers to explore individual differences in rater preferences and to provide tar-
geted feedback to improve rater training practices.
Distinctions Between Cumulative andUnfolding Response Processes
Cumulative and unfolding models are two alternative scaling techniques for modeling
the response processes of raters. We briefly compare these two models using illustrative
data sets within the context of writing assessments. Tables 1 and 2 highlight the distinc-
tions between cumulative and unfolding response processes. The rating scale model
(Andrich, 1978) is used as a representative model for cumulative response process. The
data structure underlying a cumulative scale is shown in Table 1 (Panel A). This struc-
ture reflects a perfect Guttman pattern that is not estimable due to the extreme scores.
We include a dummy coded essay (i.e., Essay 7) and a dummy coded rater (Rater F)
that reverse the Guttman pattern for the analysis (Linacre, 2018). Rater F has a score of
1 for Essay 7 and 0 for the actual six essays. Similarly, Essay 7 receives a score of 1
from the pseudo Rater F and 0 from the actual six raters. Andrich’s (1978) rating scale
model provides scaled measures for student essays based on writing proficiency and for
raters based on scoring severity. Panel B displays the expected score function for Rater
C with observed average ratings of the essays. Panel C shows the category response
function for Rater C, and each curve displays the probabilities of receiving a certain rat-
ing given the location of student essays. Panel D shows the variable map with ordered
essays and raters based on the Rasch model.
Table 2 (Panel A) shows the unfolding data structure and scaled measures for raters
and student essays based on a hyperbolic cosine model (HCM; Andrich, 1996; Luo,
2001). Panel B displays the expected score function for Rater C with observed average
ratings of the essays. The student essays that are located further from Rater C’s location
tend to receive lower scores from this rater; therefore, a rater’s location is viewed as the
ideal point for this rater’s preferences toward student essays. Panel C shows the category
response function for Rater C with each curve representing a score point. The dotted line
indicates the location of Rater C. The curve for score of 1 has two peaks (below and
above rater’s ideal point). Panel D shows the unfolding scale using variable map for the
ratings in Table 2. Raters who are located closer to the essays on the unfolding scale
provide higher scores that reflect rater preferences toward these essays.
The Joint (J) Scale and Individual Rater (IR) Scales
Coombs (1964) introduced unfolding models based on a deterministic framework
where person responses are either yes (1) when the distance between a statement and
a person’s location is within the statement threshold or no (0) if the distance is
4 Educational and Psychological Measurement 00(0)

outside the threshold. Coombs (1964) used a Joint (J) scale to represent the common
underlying continuum that orders persons and statements in a consistent fashion. By
folding a J scale at a person’s location, an Individual (I) scale can be obtained that
shows a person’s personal preferences toward all the statements. Numerically, the
absolute distance between a person’s location and the location of each statement
Table 1. Illustration of Cumulative Data Structure for Rating Scale (Six Essays and FiveRaters).
Panel A: Cumulative ratings
Essays
Raters
ProportionEssay
estimate (u)A B C D E
1 1 2 2 2 2 .90 2.772 1 1 2 2 2 .80 1.783 1 1 1 2 2 .70 0.844 0 1 1 2 2 .60 20.075 0 0 1 1 2 .40 21.826 0 0 0 1 1 .20 23.95Proportion .25 .42 .58 .83 .92Rater estimate (l) 2.36 0.75 20.69 23.01 23.95
Panel B: Expected curve for Rater C Panel C: Category response function for Rater C
Panel D: Variable map based on Rasch scale
Note. Proportion refers to the proportion of observed sum scores in maximum sum scores.
Wang and Engelhard 5

determines the ordering of the statements on an I scale. Within the context of rater-
mediated assessments, the J scale reflects the joint calibration of raters and essays,
and it can be represented by a traditional visual representation—the variable map
(Table 2, Panel D). Each rater has an Individual Rater (IR) scale that represents the
Table 2. Illustration of Unfolding Data Structure for Rating Scale (Six Essays and FiveRaters).
Panel A: Unfolding ratings (X)
Essays (u)
Raters (l)
ProportionEssay
estimate (u)A B C D E
1 2 1 1 1 0 .50 2.922 2 2 2 1 1 .80 1.103 1 2 2 2 1 .80 20.024 1 1 2 2 1 .70 20.565 0 1 2 2 1 .60 21.156 0 0 1 1 2 .40 23.53Proportion .50 .58 .83 .67 .50Unfolding estimate (l) 2.73 1.26 20.21 20.68 23.10
Panel B: Expected curve for Rater CPanel C: Category response
function for Rater C
Panel D: Variable map based on unfolding scale
J scale for preferences
Note. Proportion refers to the proportion of observed sum scores in maximum sum scores.
6 Educational and Psychological Measurement 00(0)

preference orderings toward the essays. An IR scale can be obtained by folding the
J scale at a rater’s location. Theoretically, the construction of a J scale is based on
unfolding IR scales of all the raters. When good model–data fit is met, the J scale
can be used to predict the preference orderings of each individual rater based on their
locations on the J scale.
The unfolding model is constructed by folding the extreme categories of cumula-
tive response process so that the model can better correspond to the data (Andrich &
Luo, 1993). Within the context of rater-mediated assessments, we use HCM for poly-
tomous responses (HCM-P) to examine whether the ordering of essays by raters
leads to the creation of a meaningful J scale. In other words, we want to know if the
unfolded IR scales can construct a single J scale that indicates a common preference
ordering of the essays. This provides the opportunity to empirically detect the under-
lying response process used by raters. In the second part of this study, we explore the
features of essays along the continuum defined by the J scale that may influence
rater preference.
The J scale based on the hypothetical data in Table 2 is plotted in Figure 1. The IR
scale for C illustrates how the locations on the J scale reflect this rater’s preferences
toward the essays. The IR scale is constructed by folding the J scale at Rater C’s ideal
point. The ordering of the essays on the IR scale is based on the absolute distance
between locations of essays and Rater C reflecting preference proximity of the essays
to the raters. A smaller absolute distance indicates a higher preference of Rater C for
an essay. Therefore, Essay 3 is preferred over the other essays by Rater C and Essay
6 is the least preferred. Figure 2 shows the IR scales for all raters. Each rater’s prefer-
ence orderings can be read from bottom to top on an IR scale with essay index.
In this study, we suggest that the cognitive processes underlying rater scoring
activity can be viewed as preferences with rating categories implying an ordering
Figure 1. The joint (J) scale with individual rater (IR) scale for Rater C.
Wang and Engelhard 7

from the least preferred to the most preferred. Even though raters are expected to use
a cumulative rating process, some raters might still assign lower ratings to the essays
that they prefer less and higher ratings to the ones they prefer more due to a variety
of biases. Individual rater preferences may lead to higher or lower ratings for essays
than deserved based on the intended scoring rubrics. The unfolding scale defines a
continuum with the potential for detecting differential ordering of the essays due to
personal preferences.
Purpose of Study
The purpose of this study is to describe the use of an unfolding model for evaluating the
psychometric quality of rater-mediated assessment system. Specifically, we examine (a)
if raters are using personal preferences to inform their ratings and (b) if raters are being
influenced by their personal preferences for certain aspects of student performance.
To address these two research questions, we use a HCM-P to analyze observed rat-
ings in a writing assessment. Next, we use the essay feature indices obtained with the
Coh-Metrix text analyzer (McNamara, Louwerse, Cai, & Graesser, 2005) to explore
the substantive interpretation of the underlying continuum represented by the com-
mon J scale.
Method
Data Description
We conducted a secondary analysis of data presented in Wang, Engelhard, Raczynski,
Song, and Wolfe (2017). These data are based on ratings obtained in a large-scale
writing assessment for Grade 7 students. Among the items in the instrument, the essay
Figure 2. The joint (J) scale with all individual rater (IR) scales.
8 Educational and Psychological Measurement 00(0)

item being examined in this study is designed to evaluate students’ narrative skills in
writing based on two reading passages. Twenty trained operational raters scored 100
student essays on two domains. The first domain evaluated the idea development,
organization, and coherence (IDOC) features of the essays with five rating categories
(0-4). A second domain evaluated the language usage and convention (LUC) features
of the essays with three rating categories (0-2). Separate data analyses were conducted
for each domain (IDOC and LUC) to provide more detailed information.
Description of a HCM-P
The HCM-P (Andrich, 1996; Luo, 2001) is used in this study, and it was formed by
folding Andrich’s (1978) rating scale model. The specification of HCM-P for
observed ratings was proposed by Luo (2001):
P Xij = k� �
=cosh ui � lj
� �� �m�k Qkl = 1 cosh rjl
� �Pm
k = 0 cosh ui � lj
� �� �m�k Qkl = 1 cosh rjl
� � , ð1Þ
when k = 0,Qkl = 1
cosh rjl
� �[1; where k = 0, ., m with m rating categories; Xij = rat-
ing score for student essay i from rater j; ui = writing proficiency reflected by student
essay i and i = 1, . . ., I; lj = preference of rater j, and j = 1, . . ., J; rjl = rater thresh-
old parameter that was constrained to be equally distanced, so that rjl � rj l + 1ð Þ = zj,
and zj we call the rater unit parameter reflecting the latitude of preference for rater j.
Model Analysis and Fit Statistics
The RateFOLD software (Luo & Andrich, 2003) is used for the data analyses. Joint
maximum likelihood estimation with an iterative Newton–Raphson algorithm is
implemented in the RateFOLD computer program. An overall test of fit is available
based on a Pearson x2 statistic:
x2 =XI
i = 1
XG
g = 1
Pi2g
fij �Pi2g
Pij
!2
Pi2g
Pij 1� Pij
� � , ð2Þ
where g = 1, :::, G with G intervals. Student essays were classified into intervals.Pi2g
fij
refers to the observed proportion of interval g, andPi2g
Pij represents the expected
value based on the parameter estimates for interval g. We used five class intervals
(i.e., G = 5). A nonsignificant test indicates good overall model–data fit.
Wang and Engelhard 9

The rater unit parameter can be set to be equal across raters. Whether raters share
a common unit parameter was examined using a likelihood ratio test. We denoted
the likelihood obtained with variant units as Lr̂j, and the likelihood with a common
unit as Lr̂. The null hypothesis is that the unit parameter is the same for every rater
(r1 = � � � = r20 = r). A chi-square statistic can be used and shown below.
x2 = � 2 log Lr̂=Lr̂j
� �: ð3Þ
Coh-Metrix Essay Feature Indices
We calculated essay feature indices for 100 essays using the Coh-Metrix text analy-
zer (McNamara et al., 2005). Graesser, McNamara, and Kulikowich (2011) per-
formed a principal component analysis on 54 Coh-Metrix indices for 37,520 texts in
the Touchstone Applied Science Associates corpus. They extracted eight components
that accounted for 67.30% of the variation in the text. These eight components are
narrativity, syntactic simplicity, word concreteness, referential cohesion, deep cohe-
sion, verb cohesion, connectivity, and temporality. In this study, we used the z scores
provided in Coh-Metrix 3.0 for the eight components. In addition, a descriptive mea-
sure, word count, was also obtained. This variable is on a raw score metric reflecting
the number of words in a text. The descriptions of these nine features from the Coh-
Metrix official website are included in the appendix (McNamara et al., 2005).
Dowell, Graesser, and Cai (2016) emphasized the importance of data cleaning
before using Coh-Metrix software for text analysis, and they provided two standards
for doing it properly. First, there should be a good reason to remove anything from the
original text. Second, the researcher should be consistent in conducting data cleaning
for all texts. In this study, all 100 essays were originally handwritten by students. Two
researchers conducted the transcription of the essays by following three rules that
were specified ahead of time: (a) no title, (b) do not correct any spelling mistake or
typo, and (c) no extra line break after each paragraph. In addition, a randomly selected
set of 59 essays were transcribed by both researchers and compared for consistency in
following the rules. Based on initial screening using the Coh-Metrix analyzer, the sen-
tences and paragraphs were correctly separated and counted for all essays.
Results
The results section has three parts. First, we discuss Domain 1 related to IDOC. Next,
we examine Domain 2 related to LUC. Finally, we describe relationship between the
J scales for each domain and a set of Coh-Metrix Essay Feature Indices.
Unfolding Measures for Domain 1: Idea Development, Organization, andCoherence
The overall test of fit for the ratings on IDOC domain indicated that the observed
ordering of the essays conforms to the expected orderings based on the HCM-P,
10 Educational and Psychological Measurement 00(0)

x2 76ð Þ = 58:86, p = :96. In other words, the individual preference scales of raters can
be unfolded to represent a common J scale. The likelihood ratio test showed that the
model with variant rater unit estimates fit significantly better than the model with a
common unit for raters, x2 18ð Þ = 44:58, p\:05. This suggests that raters have varying
latitudes of preferences, and it implies a potential inconsistent use of rating scales in
the IDOC domain. Therefore, different unit parameters were estimated for each rater.
The range of the essay distribution was wider than the range of rater location esti-
mates (Table 3). Table 4 lists the rater locations, unit parameter estimates, and fit sta-
tistics for individual raters. The variable map for the unfolding scale for IDOC
domain is shown in Panel A of Figure 3. The summary statistics and the variable
map indicate that raters shared similar preference orderings on their IR scales. In
addition, the rater unit parameters had a mean of 1.50 with a standard deviation of
.07. Even though varying unit parameters were found based on the likelihood ratio
test, the differences were not very large.
Figure 4 (Panel A) presents the category response function and the expected curve
with average ratings of five essay groups for Rater 1. In the category response curve,
rater location determines the center of the curves on the scale and the unit parameter
tunes the width. Each curve is single-peaked so that the probability of preferring an
essay declines monotonically from a rater’s location on the J scale. The expected
function curves and chi-square tests can be used as rater fit measures. For instance,
Rater 1 had a chi-square value of 0.76, which was not significant, and this indicates
that Rater 1 had good fit to the model. In summary, the chi-square values of all 20
raters ranged from 0.76 to 6.06 and none of them had a significant p value. Therefore,
all the raters had good model fit indices.
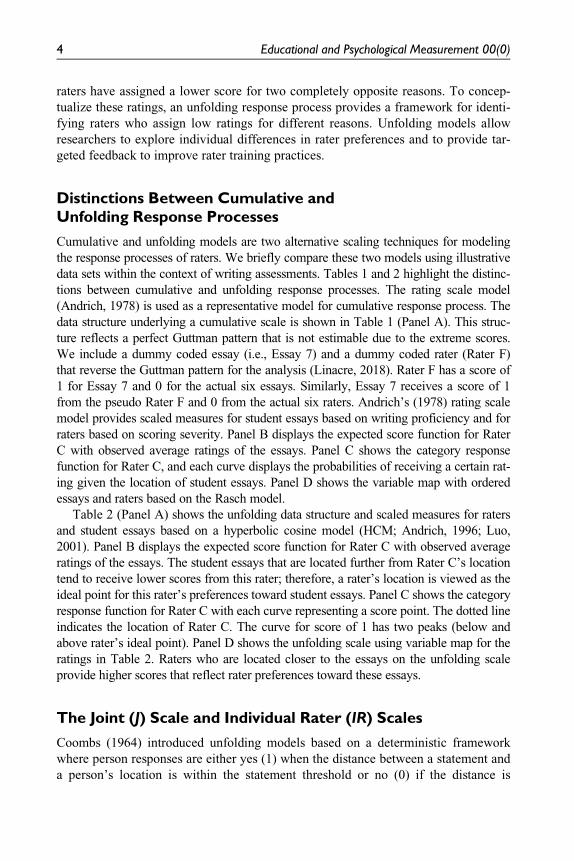
Figure 5 shows the relationship between observed proportions of essay scores and
HCM-P essay location estimates on IDOC domain. The observed proportions were
obtained by dividing the sum of raw ratings by the maximum score (i.e., 20 3 4 =
80). A polynomial curve was fit, and it explained 96.94% of the variantion. This
Table 3. Summary of Parameter Estimates for Rater and Essay Facets Based on HyperbolicCosine Model for Polytomous Responses (HCM-P).
IDOC domain LUC domain
Raterlocation (lj)
Raterunit (rj)
Essaylocation (ui)
Raterlocation (lj)
Raterunit (rj)
Essaylocation (ui)
N 20 20 100 20 20 100Mean .00 1.50 21.78 .00 1.87 1.43SD .26 0.07 3.18 .25 NA 2.66Minimum 2.52 1.36 25.64 2.30 1.87 25.39Maximum .53 1.57 5.94 .61 1.87 5.04
Note. The rater unit parameter is constant for the LUC domain with a value of 1.87. IDOC = idea
development, organization, and coherence; LUC = language usage and convention.
Wang and Engelhard 11

serves as an important indicator of good fit of HCM-P to the data. As indicated by
this polynomial relationship, essays with higher scores had HCM-P location mea-
sures closer to zero, and those with lower scores were on either of the two sides of
the continuum.
Unfolding Measures for Domain 2: Language Usage and Convention
Based on the analyses of ratings for the LUC domain, we found good overall model–
data fit, x2 76ð Þ= 81:90, p = :30. The test for a common unit parameter for raters was
not significant, x2 18ð Þ = 13:25, p = :78, indicating raters shared similar latitude of pre-
ferences toward the essays.
Next, a summary of rater and essay parameter estimates are shown in Table 3. A
common unit parameter was estimated for all raters with a value of 1.87. The distri-
bution of raters was much more centralized than the distribution of student essays,
Table 4. Rater Parameter Estimates Based on Hyperbolic Cosine Model for PolytomousResponses (HCM-P) Within Each Domain.
Rater
IDOC Domain LUC Domaina
Location SE Unit SE
Fit statistic
Location SE
Fit statistic
x2 p x2 p
1 2.22 .07 1.57 .03 0.76 .94 2.01 .08 2.12 .712 2.02 .07 1.41 .03 0.96 .91 .07 .08 6.07 .173 .53 .07 1.46 .02 5.73 .20 2.13 .08 4.75 .304 2.27 .07 1.57 .03 3.90 .40 2.27 .08 1.37 .845 2.24 .07 1.50 .03 1.93 .74 .09 .08 0.82 .936 2.19 .07 1.56 .03 0.87 .93 .61 .09 5.20 .257 2.28 .07 1.52 .03 1.20 .87 2.07 .08 0.81 .948 .09 .07 1.51 .03 1.43 .83 .43 .09 4.39 .349 .33 .07 1.47 .03 2.08 .71 2.26 .08 9.40 .0310 .27 .07 1.57 .03 6.06 .17 2.02 .08 2.72 .5911 .26 .07 1.57 .03 4.05 .38 .15 .08 1.92 .7412 2.09 .07 1.42 .03 1.99 .73 2.30 .08 7.26 .1013 2.07 .07 1.36 .02 3.19 .51 2.12 .08 2.78 .5914 .23 .07 1.48 .03 3.30 .50 .46 .09 7.79 .0815 2.22 .07 1.57 .03 3.12 .53 .03 .08 7.00 .1116 .24 .07 1.53 .03 4.12 .37 2.19 .08 4.59 .3117 2.52 .07 1.57 .03 4.84 .29 2.18 .08 2.96 .5518 .06 .07 1.40 .02 3.32 .49 2.10 .08 2.16 .7019 .20 .07 1.51 .03 4.23 .36 2.09 .08 3.71 .4320 2.09 .07 1.47 .03 1.78 .77 2.11 .08 4.07 .38
Note. IDOC = idea development, organization, and coherence; LUC = language usage and convention;
SE = standard error.aThe rater unit parameter is constant for the LUC domain with a value of 1.87.
12 Educational and Psychological Measurement 00(0)

which can also be seen in Figure 3 (Panel B). Therefore, raters shared relatively con-
sistent preferences toward the student essays on the LUC domain. The category
response curve and expected score function for Rater 9 are shown in Panel B of
Figure 3. The variable maps based on hyperbolic cosine model for polytomous responses(HCM-P) for each domain.Note. IDOC = idea development, organization, and coherence; LUC = language usage and convention.
Wang and Engelhard 13

Figure 4. The rater fit statistics reflected by chi-square values ranged from 0.81 to
9.40 (Table 4). Rater 9 is diagnosed as a misfitting rater on the LUC domain. The
other raters had acceptable fit to the model in the LUC domain.
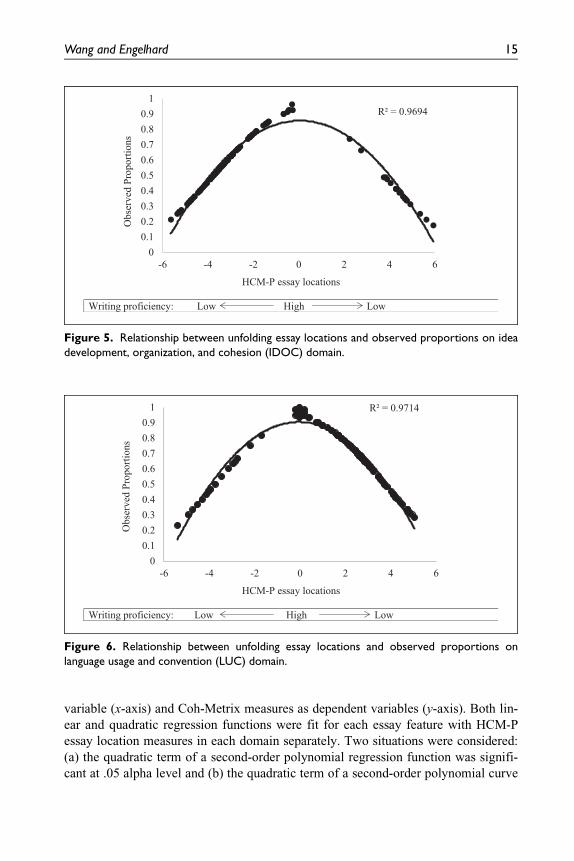
Figure 6 shows the relationship between observed proportions and HCM-P essay
location estimates for LUC domain. A polynomial curve explained 97.14% of the
variation in this relationship. Student essays with higher scores were located in the
middle of the scale, and those with lower scores were on the two tails. This finding
applied to both domains that HCM-P divided the essays with lower scores into two
observable subsets. Next, we used essay feature indices to explore a substantive
explanation for the underlying unfolding continuum (i.e., J scale).
Exploring Unfolding Scales Using Coh-Metrix Essay Feature Indices
To explore a substantive interpretation of the unfolding J scale, we examined the rela-
tionship between the Coh-Metrix essay feature indices and essay location measures
based on HCM-P. We treated the unfolding measures for the essays as an independent
Figure 4. Category response curves and expected score curves for two raters.Note. IDOC = idea development, organization, and coherence; LUC = language usage and convention.
14 Educational and Psychological Measurement 00(0)
variable (x-axis) and Coh-Metrix measures as dependent variables (y-axis). Both lin-
ear and quadratic regression functions were fit for each essay feature with HCM-P
essay location measures in each domain separately. Two situations were considered:
(a) the quadratic term of a second-order polynomial regression function was signifi-
cant at .05 alpha level and (b) the quadratic term of a second-order polynomial curve
Figure 5. Relationship between unfolding essay locations and observed proportions on ideadevelopment, organization, and cohesion (IDOC) domain.
Figure 6. Relationship between unfolding essay locations and observed proportions onlanguage usage and convention (LUC) domain.
Wang and Engelhard 15

was not significant, and meanwhile the slope parameter of a linear regression function
was significant at .05 alpha level. The other situations were omitted for brevity where
neither the slope of a linear function nor the quadratic term of a polynomial curve
were statistically significant.
Figure 7 shows the results for three essay features—word count, syntactic simpli-
city, and word concreteness. Each of these had a significant quadratic term in a
second-order polynomial regression function of HCM-P essay measures in IDOC
domain. The fitted values are displayed on the y-axis, and the HCM-P essay location
measures are shown on the x-axis. The estimates for the quadratic term and the varia-
tion explained by the curve (R2) are reported. Regarding word count, longer essays
were generally preferred by the raters and shorter essays were less preferred. In terms
of syntactic simplicity, essays comprising sentences in simpler and more familiar
syntactic structures were preferred over the essays using unfamiliar syntactic struc-
tures. As to word concreteness, essays containing more abstract words received
higher scores, and those using more concrete words received lower scores.
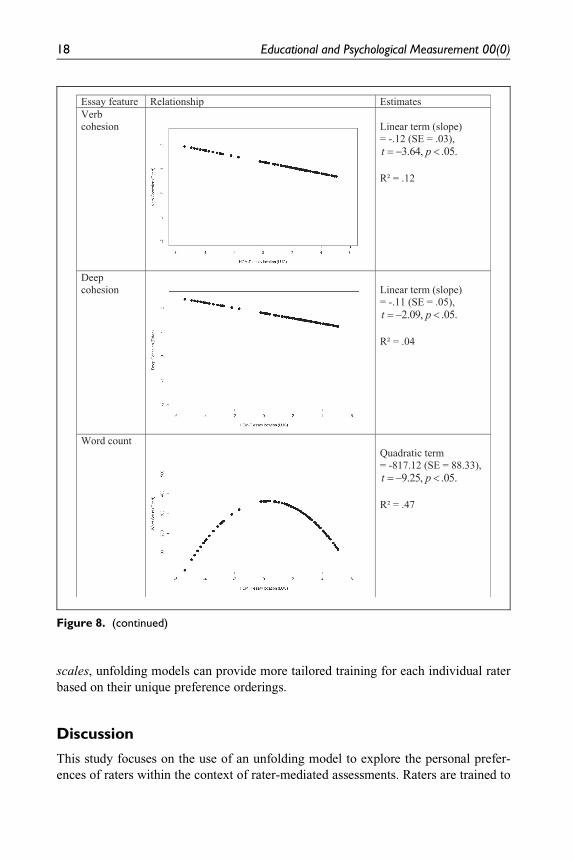
Figure 8 displays the relationship between Coh-Metrix indices and HCM-P essay
location measures of LUC domain. Similar results were found on the same three
essay features—word count, syntactic simplicity, and word concreteness.
Furthermore, we observed linear relationship for deep cohesion and verb cohesion
indices with HCM-P essay measures on LUC domain. Deep cohesion had a signifi-
cant negative slope estimate implying that the essays containing more or fewer
causal and intentional connectives were less preferred than the essays with a
medium-level usages of these connectives. A significant negative slope parameter
estimate was also reported for verb cohesion, indicating that raters preferred essays
with medium usage of overlapped verbs in the text over essays having too many or
too few uses of repeated verbs.
A unique feature of unfolding models is the generation of IR scales for each rater
and the opportunity to explore factors influencing individual preference orderings of
the student essays. By calculating the absolute distances from a rater’s location to
100 essays’ locations, we obtained two IR scales for each rater on two domains sepa-
rately. To investigate an individual rater’s preferences, we can examine the relation-
ship between essay locations (i.e., absolute distances) on an IR scale and Coh-Metrix
essay measures. For instance, based on the IR scale of Rater 1 on IDOC domain, the
correlation between HCM-P essay locations on IR scale and Coh-Metrix measures
was 2.82 for word count, 2.34 for syntactic simplicity, and .40 for word concrete-
ness. This indicated that Rater 1 preferred the essays with longer length, more famil-
iar syntactic structures, and more abstract words.
It is worth noting that the raters who participated in this study received intensive
training before they started scoring the essays. As expected, the raters had close loca-
tions on the J scale relative to student essays, and this provides evidence that they
share similar IR scales with preference orderings of essays. However, different rater
unit parameter estimates were suggested for ratings in the IDOC domain, and this
reflected different latitudes of preference toward certain aspects of the essays. For
16 Educational and Psychological Measurement 00(0)

instance, a rater with larger unit parameter would prefer a wider range of word
counts. For the LUC domain, a common rater unit parameter was estimated, and
rater locations were slightly more centralized compared with those of IDOC domain.
Therefore, raters had more consistent preferences on the LUC domain. With IR
Figure 7. Relationship between Coh-Metrix essay feature indices and unfolding essaymeasures on idea development, organization, and cohesion (IDOC) domain.Note. SE = standard error.
Wang and Engelhard 17
scales, unfolding models can provide more tailored training for each individual rater
based on their unique preference orderings.
Discussion
This study focuses on the use of an unfolding model to explore the personal prefer-
ences of raters within the context of rater-mediated assessments. Raters are trained to
Figure 8. (continued)
18 Educational and Psychological Measurement 00(0)

provide impersonal judgments with ratings that shall match the rubrics used to guide
the assessment system. Even though raters are trained, personal preferences may still
appear as sources of construct-irrelevant variance and potential biases.
The HCM-P was used to examine polytomous ratings within the context of a
large-scale writing assessment in order to determine whether or not the observed
essay ratings can be modeled to uncover a latent continuum of rater preferences. In
addition to exploring whether or not raters share a common preference continuum,
J scale, the characteristics of the essays along this continuum were explored using
essay feature indices obtained with the Coh-Metrix text analyzer (McNamara et al.,
2005). The preference continuum can also be folded to reveal individual rater prefer-
ence ordering for essays through the formation of IR scale.
In the IDOC domain, the overall test of fit for the ratings indicated that the
observed ordering of the essays conforms to the expected orderings based on the
HCM-P. In other words, the individual preference scales of raters can be unfolded to
Figure 8. Relationship between Coh-Metrix essay feature indices and unfolding essaymeasures on language usage and convention (LUC) domain.Note. SE = standard error.
Wang and Engelhard 19

represent a consistent J scale reflecting common criterion. The summary statistics
and the variable map indicated that raters share similar preference orderings on their
IR scales. Similar results were found for the LUC domain. There was good overall
model–data fit with only one diagnosed as a misfitting rater (Rater 9) on the LUC
domain. All the other raters had acceptable fit to the model in both domains.
A preference continuum (J scale) was created to represent the personal prefer-
ences of raters. If the raters used objective judgments based on the scoring rubrics,
then the raters theoretically should share comparable ideal points on the preference
scale. In addition, all the individual rater preference scales would be the same. To
explore the substantive explanations of the J scale, we used Coh-Metrix essay feature
indices based on text analysis of the essays. We found a second-order polynomial
relationship for essay locations with three features—word count, syntactic simplicity,
and word concreteness—on both IDOC domain and LUC domain. A linear relation-
ship with HCM-P essay measures of LUC domain was observed for two essay fea-
tures—deep cohesion and verb cohesion. This linear relationship would not be
detected by assuming a cumulative response process and ordering essays using a
cumulative model. In this case, an unfolding model provided additional information
not detected in models assuming cumulative response processes in the exploration of
rating quality.
In summary, this study explored the use of an unfolding model to discover the
underlying response processes used by raters. Specifically, we used an unfolding
model (a) to determine whether raters used personal preferences in making scoring
decisions and (b) to explore possible factors that may influence raters and their per-
sonal preferences for certain aspects of student essays. The results of this study sup-
port the exploration of unfolding models for observed rater judgments that can be
used to detect personal preferences and biases. Modeling personal preferences with
an unfolding model provides a useful addition to other approaches for evaluating the
quality of rater judgments in rater-mediated assessments.
We have several suggestions for future research using unfolding models to evalu-
ate rater preferences. First, researchers should carefully consider the conceptualiza-
tion of the continuum for unfolding models. Additional work is needed on the
substantive interpretation of the latitude of preference parameter that can be included
in the HCM. Issues of substantive interpretations of parameters in unfolding models
in general need further development, and they also offer challenges when modeling
rater responses. We argue that the evaluation of personal preferences with unfolding
models is a promising way to look at another class of rater errors that are not evalu-
ated by current measurement models for rater judgments. Future research can apply
this research idea within other contexts, such as performance assessments of teaching
as well as assessment of student proficiency in science and mathematics.
Another important issue to be addressed in future research is the development of
model–data fit indices for unfolding models. We strongly encourage research studies
focusing on the development of fit indices for unfolding models especially for
HCMs. Research to examine the invariance properties of the J and IR scales should
20 Educational and Psychological Measurement 00(0)

be conducted related to characteristics of raters, such as prior experience in teaching,
expertise in a particular content area, speed in scoring, and English fluency. The
quality of handwriting may also be a factor in assessments with a combination of
handwritten and typed responses.
Appendix Description for Coh-Metrix Essay Features.
Essay feature Description
Word count This is the total number of words in the text.Narrativity Narrative text tells a story, with characters, events, places, and
things that are familiar to the reader. Narrative is closelyaffiliated with everyday, oral conversation. Nonnarrative textson less familiar topics lie at the opposite end of the continuum.
Syntacticsimplicity
This component reflects the degree to which the sentences inthe text contain fewer words and use simpler, familiar syntacticstructures, which are less challenging to process. At theopposite end of the continuum are texts that contain sentenceswith more words and use complex, unfamiliar syntacticstructures.
Word concreteness Texts that contain content words that are concrete, meaningful,and evoke mental images are easier to process and understand.Abstract words on the other end are more difficult to process.
Referential cohesion A text with high referential cohesion contains words and ideasthat overlap across sentences and the entire text, formingexplicit threads that connect the text for the reader.
Deep cohesion This dimension reflects the degree to which the text containscausal and intentional connectives when there are causal andlogical relationships within the text. These connectives help thereader to form a more coherent and deeper understanding ofthe causal events, processes, and actions in the text. If the textis high in deep cohesion, then those relationships and globalcohesion are more explicit.
Verb cohesion This component reflects the degree to which there areoverlapping verbs in the text. When there are repeated verbs,the text likely includes a more coherent event structure thatwill facilitate and enhance situation model understanding.
Connectivity This component reflects the degree to which the text containsexplicit adversative, additive, and comparative connectives toexpress relations in the text.
Temporality Texts that contain more cues about temporality and that havemore consistent temporality (i.e., tense, aspect) are easier toprocess and understand.
Source. McNamara, D. S., Graesser, A. C., McCarthy, P. M., & Cai, Z. (2014). Automated evaluation of
text and discourse with Coh-Metrix. New York, NY: Cambridge University Press. (pp. 85-86).
Wang and Engelhard 21

Authors’ Note
An earlier version of this article was presented at the International Objective Measurement
Workshop in New York City (April 2018).
Acknowledgment
We would like to thank Professor David Andrich for helpful discussions of our ideas.
Declaration of Conflicting Interests
The author(s) declared no potential conflicts of interest with respect to the research, authorship,
and/or publication of this article.
Funding
The author(s) received no financial support for the research, authorship, and/or publication of
this article.
ORCID iD
Jue Wang https://orcid.org/0000-0002-3519-2693
References
Andrich, D. (1978). A rating formulation for ordered response categories. Psychometrika, 43,
561-573.
Andrich, D. (1996). A hyperbolic cosine latent trait model for unfolding polytomous responses:
Reconciling Thurstone and Likert methodologies. British Journal of Mathematical and
Statistical Psychology, 49, 347-365.
Andrich, D., & Luo, G. (1993). A hyperbolic cosine latent trait model for unfolding
dichotomous single-stimulus responses. Applied Psychological Measurement, 17, 253-276.
Andrich, D., & Luo, G. (2017). A law of comparative preference: Distinctions between models
of personal preference and impersonal judgment in pair comparison designs. Applied
Psychological Measurement. Advance online publication. doi: 0146621617738014
Brennan, R. L. (1992). Elements of generalizability theory (Rev. ed.). Iowa City, IA: ACT.
Coombs, C. H. (1964). A theory of data. New York, NY: Wiley.
Crisp, V. (2012). An investigation of rater cognition in the assessment of projects. Educational
Measurement: Issues and Practice, 31(3), 10-20.
DeCarlo, L. T. (2005). A model of rater behavior in essay grading based on signal detection
theory. Journal of Educational Measurement, 42, 53-76.
Dowell, N. M. M., Graesser, A. C., & Cai, Z. (2016). Language and discourse analysis with
Coh-Metrix: Applications from educational material to learning environments at scale.
Journal of Learning Analytics, 3(3), 72-95. doi:10.18608/jla.2016.33.5
Engelhard, G. (1996). Evaluating rater accuracy in performance assessments. Journal of
Educational Measurement, 33, 56-70.
Engelhard, G. (2002). Monitoring raters in performance assessments. In G. Tindal & T.
Haladyna (Eds.), Large-scale assessment programs for ALL students: Development,
implementation, and analysis (pp. 261-287). Mahwah, NJ: Erlbaum.
22 Educational and Psychological Measurement 00(0)

Engelhard, G., Wang, J., & Wind, S. A. (2018). A tale of two models: Psychometric and
cognitive perspectives on rater-mediated assessments using accuracy ratings. Psychological
Test and Assessment Modeling, 60, 33-52.
Engelhard, G., & Wind, S. A. (2018). Invariant measurement with raters and rating scales:
Rasch models for rater-mediated assessments. New York, NY: Routledge.
Graesser, A. C., McNamara, D. S., & Kulikowich, J. M. (2011). Coh-Metrix: Providing
multilevel analyses of text characteristics. Educational Researcher, 40, 223-234.
Lane, S. (2016). Performance assessment and accountability: Then and now. In C. Wells &
M. Faulkner-Bond (Eds.), Educational measurement: From foundations to future (pp. 356-
372). New York, NY: Guilford Press.
Linacre, J. M. (1989). Many-facet Rasch measurement. Chicago, IL: MESA Press.
Linacre, J. M. (2018). Winsteps�Rasch measurement computer program user’s guide.
Beaverton, OR: Winsteps.com.
Luo, G. (2001). A class of probabilistic unfolding models for polytomous responses. Journal of
Mathematical Psychology, 45, 224-248.
Luo, G., & Andrich, D. (2003). RateFOLD computer program. Perth, Western Australia,
Australia: Murdoch University, School of Education, Social Measurement Laboratory.
Marcoulides, G. A., & Drezner, Z. (2000). A procedure for detecting pattern clustering in
measurement designs. In M. Wilson & G. Engelhard Jr. (Eds.), Objective measurement:
Theory into practice (Vol. 5, pp. 287-302). Norwood, NJ: Ablex.
McNamara, D. S., Louwerse, M. M., Cai, Z., & Graesser, A. (2005). Coh-Metrix Version 1.4.
Retrieved from http://cohmetrix.com
Myford, C. M., & Wolfe, E. W. (2003). Detecting and measuring rater effects using many-
facet Rasch measurement: Part I. Journal of Applied Measurement, 4, 386-422.
Myford, C. M., & Wolfe, E. W. (2004). Detecting and measuring rater effects using many-
facet Rasch measurement: Part II. Journal of Applied Measurement, 5, 189-227.
Patz, R. J., Junker, B. W., Johnson, M. S., & Mariano, L. T. (2002). The hierarchical rater
model for rated test items and its application to large-scale educational assessment data.
Journal of Educational and Behavioral Statistics, 27, 341-384.
Wang, J., Engelhard, G., Jr., Raczynski, K., Song, T., & Wolfe, E. W. (2017). Evaluating rater
accuracy and perception for integrated writing assessments using a mixed-methods
approach. Assessing Writing, 33, 36-47.
Wang, J., Engelhard, G., Jr., & Wolfe, E. W. (2016). Evaluating rater accuracy in rater-
mediated assessments using an unfolding model. Educational and Psychological
Measurement, 76, 1005-1025.
Wang, W. C., Su, C. M., & Qiu, X. L. (2014). Item response models for local dependence
among multiple ratings. Journal of Educational Measurement, 51, 260-280.
Wilson, M., & Hoskens, M. (2001). The rater bundle model. Journal of Educational and
Behavioral Statistics, 26, 283-306.
Wind, S. A., & Engelhard, G., Jr. (2015). Exploring rating quality in rater-mediated
assessments using Mokken scaling. Educational and Psychological Measurement, 76,
685-706.
Wolfe, E. W. (2006). Uncovering rater’s cognitive processing and focus using think-aloud
protocols. Journal of Writing Assessment, 2, 37-56.
Wolfe, E. W., Jiao, H., & Song, T. (2015). A family of rater accuracy models. Journal of
Applied Measurement, 16, 153-160.
Wang and Engelhard 23