Embed Size (px)
Citation preview

1
Exploring the Evolving Role of Producers in U.S. Recycling: Emerging Solutions for Packaging
Tristanne Davis
In partial completion of Master of Environmental Management (MEM) Yale University School of Forestry and Environmental Studies
May 2016

2
Contents
Introduction .................................................................................................................................... 3
Part I. Defining the Problem in the U.S. Recycling System ............................................................. 4
Material Flow Analysis ................................................................................................................ 5
Key U.S. Barriers .......................................................................................................................... 9
1. Households have limited access to recycling collection services. .............................. 10
2. Recycled content is contaminated and low quality. .................................................. 11
3. Recovery technologies are not sufficient to handle the evolving ton. ...................... 12
4. Recycling policies are inconsistent and don’t enable after-markets. ........................ 13
5. Recycling provider incentives are misaligned with recovery. .................................... 14
6. Packaging design interferes with recovery. ............................................................... 15
Summary ................................................................................................................................... 16
Part 2: Exploring Solutions ............................................................................................................ 18
Policy based solutions ............................................................................................................... 18
Case Study: Nestle Waters North America- Industry led EPR .............................................. 24
Analysis of Policy-Based Approaches .................................................................................... 27
Market Driven Solutions ........................................................................................................... 28
Case Study 1: The Closed Loop Fund .................................................................................... 31
Case Study 2: The Recycling Partnership .............................................................................. 34
Case Study 3: The Sustainable Packaging Coalition .............................................................. 36
Analysis of Market Based Initiatives ..................................................................................... 37
Conclusions and Recommendations ............................................................................................. 39
References .................................................................................................................................... 42
Appendix ....................................................................................................................................... 47
Appendix A. Interview Questions ............................................................................................. 47
Appendix B. EPR Models ........................................................................................................... 49
Appendix C. MFA Calculations .................................................................................................. 51

3
Introduction Recycling in the United States has reached a critical tipping point into market failure that begs for systemic analysis and innovative solutions. Demand for recycled packaging content has been increasing in response to changing consumer preferences and fluctuating virgin material prices. However, the supply for these materials is limited in the United States, which has recovery rates far behind most other developed countries. Recovery of post-consumer packaging for reuse in U.S. secondary markets has been stunted by a number of systemic flaws that have been building over time. Recent economic disruptions in global commodity markets have made these underlying flaws very apparent and together, these forces are undermining the institutional structure of the recycling industry in the U.S., stifling prospects for a more circular, resilient economy. These trends reflect a major market defect that has mobilized both government and producer action to address flaws in the system. Many states and localities are engaging in active discussions on packaging regulations, however regulation at the federal level is unlikely. Under these conditions, the role of the private sector is especially important in the U.S. to scale up solutions and the U.S. has become a testbed for many interesting industry-led initiatives. Nestle Waters NA initiated the first ever industry-led effort for Extended Producer responsibility (EPR) for packaging, which marked a significant departure from the historically reactive role of corporations to environmental regulations and to this day remains an example of novel leadership by a company in reimaging a broken system. New programs like the Closed Loop Fund and Recycling Partnership among others have emerged and are piloting market based solutions around the country that go beyond historic producer-led efforts. Producers are starting to act as leaders in crafting new systems, which is a central focus of this study. The effectiveness of these initiatives are limited however by fragmentation of efforts, conflicting incentives, and policies that work against them. Moreover, there is still widespread lack of systems thinking and understanding to help define what is wrong with the recycling system and implement solutions to change it. This study aims to promote the use of systems thinking in crafting effective policies and market initiatives that support more robust secondary markets for packaging and enable a more circular economy. Part 1 of this study defines the nature of the problem with U.S. recycling by exploring the material flow of packaging in the U.S. and identifying key leakage points for recycled material in the context of the current policy, economic and technology landscape. Part 2 of the study evaluates the solutions currently being explored by government and industry and weighs these solutions’ plausibility for addressing the key barriers identified in Part 1. Conclusions are the result of an extensive review of current literature on this topic as well as interviews conducted with experts in government, NGOs, corporations and the recycling industry.

4
Part I. Defining the Problem in the U.S. Recycling System This paper argues that the current economic climate represents a shock to an already inherently flawed system that has pushed U.S. recycling past a critical tipping point and launched it into a state of crisis. Global macroeconomic shocks have revealed many of the system flaws that have were already in the background. This study conducted a Material Flow Analysis (MFA) of packaging materials in the United States on order to identify key leakage points for recyclable materials. The study then defines six key barriers in the U.S. system that explain these leakage points and how they have been changing over time, drawing from data from the MFA as well as research of literature and interviews. Recycling is the principle environmental defense mechanism used in what is otherwise a ‘throwaway’ society defined by mass production and consumption of single use items. Packaging in particular has a very short useful life phase, as its sole purpose is to safely transport other products to consumer, after which point it is typically disposed of straight away. Packaging is comprised primarily of recyclable materials like paper, plastic, aluminum and glass and comprises the largest portion of products generated in municipal solid waste, at 30 percent (75.8 million tons). Recycling of these materials allows single use packaging to gain additional life cycles, reducing the need to extract more virgin materials, reducing litter and burdens on landfills, and creating jobs. Companies increasingly seek this recycled content for their products and packaging, driven by growing environmental concern of their customers and threats of regulation. The principle objective of recycling is therefore to function as a pathway to secondary markets. However, in the United States, much of the secondary value of post-consumer packaging is lost to landfills and in many cases, demand exceeds available supply. Recycling in the United States is costly and often economically burdensome, inflating the price of recycled material relative to virgin. The system is not governed or operated as a functioning market where materials access is the end goal. Instead it is seen more as a service that governments are tasked with providing to citizens, on par with garbage removal. As a result, the U.S. recycling system is characterized by serious flaws, inefficiencies and misaligned economic incentives. U.S. recycling rates significantly lag behind those of other developed countries and have been stagnant at around 34% for several years, and actually dropped starting in 2012 (EPA, 2015). The underlying system flaws paired with recent global economic shocks have catalyzed in market failure. The past year has seen crisis emerge in U.S. recycling. The topic has gained notable media coverage1 as well as outcry by major players who have sounded the alarm on looming risk in the industry. David Steiner, the CEO of Waste Management, the biggest recycler in the country, has threatened that if no solutions are found, the end of recycling, a $200 billion industry, could be nigh. Revenues from recycling operations are down 16 percent from the same time last year. Waste Management has reduced the number of recycling facilities it operates resulting in the loss of 900 jobs. United Plastic Recycling filed for bankruptcy last year. Recyclers around the country are increasingly passing on their growing costs to cities and counties that are ill positioned to deal with them following the recent economic recession. Historically, recycling served as a stream of revenue for local governments that could sell valuable secondary materials. Increasingly however, local governments are receiving nothing at all for their recyclables, or even having to pay companies to accept them (Gelles, 2016). The industry’s revenue has declined over the past five years, tied to a drop in commodity prices, which erodes the price advantage of recycled goods. Commodity prices have fallen as the result of historically low
1Statement made in multiple interviews as well as recent online media sources: Articles have been featured in Fortune, Bloomberg Review, Environmental Leader, and the Washington Post among many others.

5
oil prices as well as a slowing economy in China. In addition, China put in place the “Green Fence Policy” in 2013, which reduces the country’s imports of low quality recycled material. This policy has disturbed U.S. secondary markets, which have evolved to rely on the export of 50-75% of our curbside materials collected to China (Royte, 2013). While some assert that the losses facing the industry are the result of typical market fluctuations, industry analysts note that this is likely not a short lived trend (Bell, 2015). As the economy in China, the biggest end user of recycled materials, continues to slow down and the price of crude oil is projected to plummet further, industry revenue is expected to continue to fall as well (IBIS World, 2016). It is worth noting that even in more favorable economic conditions a few years ago, recycling was still largely unprofitable and historically this has also been the case. In 1993, the New York Times noted that it has become clear that “the market value of materials left at the curbside is not likely to cover the collection and processing costs for a long time,” which is certainly still the case today (Bartow, 2012).
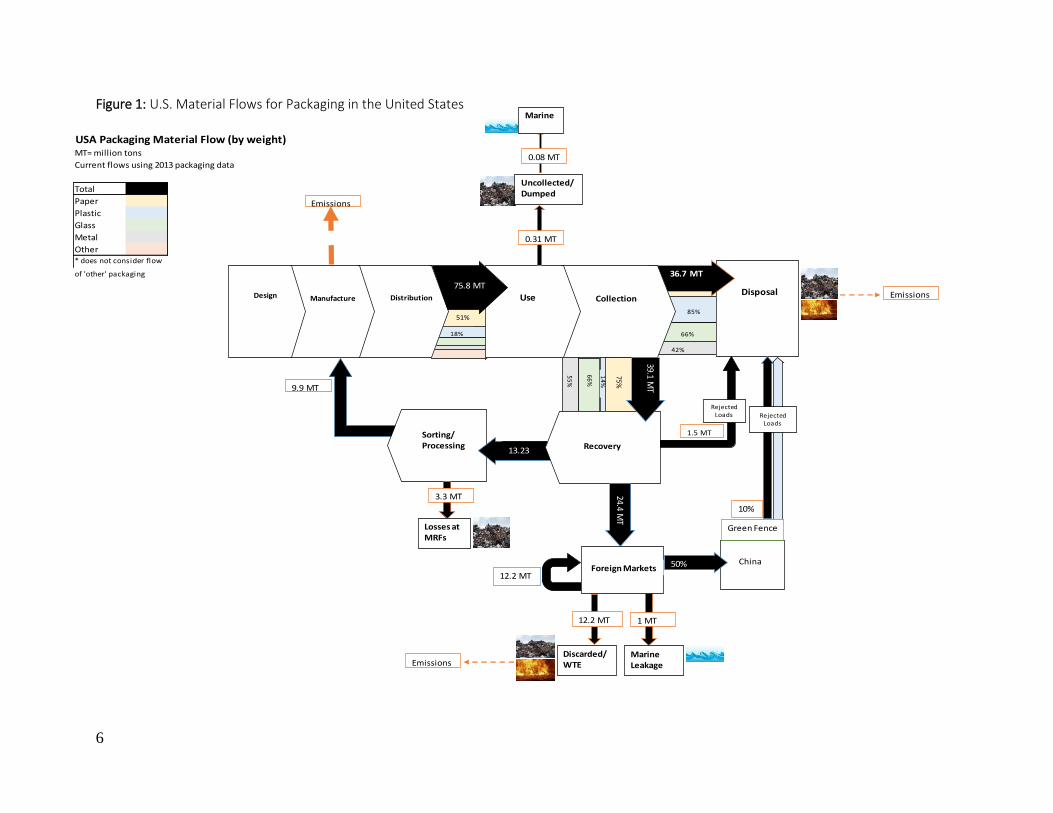
Material Flow Analysis Packaging2 is unique compared to other waste streams in that it is used in nearly every industry and across multiple material types, where recycling rates are extremely variable between and within material types. Figure 1 depicts the MFA conducted for this study, which shows both the net flow of packaging materials and also disaggregated flows corresponding to different material types, looking at paper, plastics, glass, metal. The “other” category of packaging material corresponds to EPA’s categorization and includes wood packaging and other material, which are not shown separately in this MFA. By looking at individual materials, the MFA aims to show how leakage points vary by material. These material are each analyzed in depth. The MFA depicts overall recycling rates using national averages, and also considers sorting and reprocessing losses at single stream3 recycling facilities, as single stream represents almost two-thirds of collection programs in the U.S (EPA, 2015), with more moving in this direction. In an effort to have a comprehensive overview of flows, the study also brings in data on export of recyclables abroad, rejected loads, losses at MRFs and environmental impacts. See appendix for details on calculation methods used. Material value is a fundamental driver behind the material flows represented, where materials with higher value tend to have more developed secondary markets and higher recovery rates. High recycling rates for some of these materials masks low recycling rates across other materials. With the exception of corrugated boxes and steel packaging, not a single other category of packaging has recycling rates above 55%. While the overall recycling rate for packaging is about 50%, removing these categories, the rate drops to 30%. The major differences in value results in ‘cherry picking’ in U.S. recycling where only valuable components are collected, leaving the costly portion of recyclables collection to others that act as a major economic drain on the system (OECD, 2016). There are also distinct drivers and leakages in different material categories.
2 In this study, packaging analyzed considers containers and packaging as defined by the U.S. EPA, which does not include certain single use container items like plastic cups. The analysis considered packaging collected from residential recycling programs post-consumer use. 3 This means that materials such as glass and paper are separated at the recycling plant rather than at the point of collection.
6
Figure 1: U.S. Material Flows for Packaging in the United States
USA Packaging Material Flow (by weight)MT= million tons
Current flows using 2013 packaging data
Total
Paper
Plastic
Glass
Metal
Other
of 'other' packaging
* does not consider flow
12.2 MT
10%
25%
Sorting/Processing
Disposal
36.7 MT
UseDistribution
Uncollected/Dumped
Design Collection
0.31 MT
75.8 MT
Manufacture
0.08 MT
Marine
Emissions
Losses at MRFs
3.3 MT
13.23
MarineLeakage
1 MT
Discarded/WTE Emissions
Emissions
9.9 MT
85%
66%
42%
14
%
39.1 MT
75%
66
%
Recovery
55
%
24.4 MT
Green Fence
51%
18%
1.5 MT
Rejected Loads
ChinaForeign Markets 50%
.
Rejected Loads
12.2 MT

7
Paper
- Paper packaging represents the largest category of packaging by weight as well as market share. As mentioned previously, corrugated board has high recycling rates of 89%. However other types of paper packaging have an average recycling rate of only 27.7% with aseptic cartons at a mere 6.5% and wrapping papers at less than .05% in the most recently available data. Multi-material forms of paper packaging are on the rise, such as aseptic cartons, which combine paper with plastic, pigments, inks and adhesives, and are difficult to separate at end of life (EoL) and have little economic use in aftermarkets.
- The paper largely doesn’t consider recycling to be a high priority issue since recovery rates are so high for corrugated board. Companies that use other forms of paper packaging have not been pioneers in developing secondary markets for their materials as there is less value in these items and therefore less vested interest in getting them back. For example, Starbucks had committed to making its paper cups recyclable only to find out they were simply not economical to recycle and subsequently dropped their initiative (Szaky, 2016).
Plastic - Plastic packaging is the second largest packaging category both in terms of weight and market
share, at 30% of total sales (WPO, 2008). This is the fastest growing portion of the packaging recycling stream, as plastics are a cheaper material that is lighter to transport than many other materials. The increase in plastic is a defining feature of what has come to be known as the “evolving ton”, where plastic is increasing as a percentage of the total waste stream and traditional materials like paper are decreasing. Although it makes up a large portion of packaging, plastic has the lowest recovery rate of any material type, currently at only 14.6%.4 Recovery rates again vary tremendously by material category. Polyethylene terephthalate (PET) bottles (#1) have the highest recovery rates in this category at around 31%, followed by High Density Polyethylene (HDPE) bottles (#2 plastic) at 29%. These two plastics also have the highest market value, together comprising 86% of market share (Embree, 2016). Other plastics (#3-7) are mixed and baled together. These plastics have much less value and significantly lower recovery rates. The U.S. has not invested much in recycling technology for #3-7 plastics, instead sending most of these to China for recovery (CalRecycle, 2014a). The MFA shows how China’s Green Fence Policy has led to a drop in plastic exports5 and an increase in the amount of plastic material sent to U.S. landfills.
- Those plastics that remain in the U.S. are often not collected or are collected but not successfully recycled. Currently, 70% of communities across the U.S. are not able to collect and recycle #3-#7 plastics. Globally, these plastics often end up in landfills, incinerated in Waste to Energy (WtE)
4 A study by As You Sow pointed out that even less plastic packaging is collected than is estimated by the EPA, as the agency does not track the fast-growing category of multi-laminate plastic packaging (e.g., pouches and sachets), which is replacing more recyclable forms of packaging (MacKerron, 2015). 5 The U.S. exports paper and metals to China in addition to plastics, however plastics exports have been most impacted by the Green Fence Policy due to their lower value and higher contamination. Some more valuable plastics have seen a resurgence in exports in the years following the Green Fence, however lower value plastics have seen a decrease in exports of up to 30% according to data from CalRecycle.
Source: Wikimedia commons
Figure 2: Plastic Resin Identification

8
Facilities, which are less common in the United States, or left as unmanaged waste where leakage can occur to waterways and eventually the ocean.
- Even when these materials are collected, the lightweighted and varied forms that plastic can take leads to confusion at many Material Recovery Facilities (MRFs), resulting in losses of these materials to paper and residual streams while they are being processed. This explains some of the losses that occur after collection in the MFA. Flexible and film plastic presents a particular challenge in this area.
- In addition, recyclers may reject loads if they are undesirable. Manufacturers have been very successful in reducing the weight of packaging by using less material, and while this source reduction has many upstream benefits, it means that containers take up the same amount of space but offer less resale value to recyclers, leading to higher processing costs for recyclers, as they have to push much larger volumes of waste through their facilities to yield each one-ton bale of raw material. Many recyclers don’t accept these materials because they are too thin (Szaky, 2016). Load rejection by U.S. MRFs occurs when there is low value in a load, determined by the load’s content and level of contamination.
- Plastic pollution has been a visible problem since plastic started getting widely used in the 1970s and public outcry over marine debris as well as new research has resulted in a resurgence of the importance of this issue. According to a recent study in Science Magazine, the U.S. is the only OECD country listed in the top twenty countries contributing to marine debris in the world’s oceans (Jambeck, 2015). The Ocean Conservancy recently released a report that itemizes marine debris content and found that the majority of items are some kind of plastic packaging (The Ocean Conservancy, 2015). Some companies, namely botted beverage companies, see this as a high priority environmental issue. Because bottled beverages typically rely on higher value plastics, these companies have additional vested interest in getting material back for reuse as opposed to companies that rely on less valuable plastic packaging.
Metal
- Metal packaging is comprised of both steel and aluminum packaging, both of which are highly valuable materials that are widely recyclable and do not deteriorate in quality after being recycled. Steel has high recovery rates of 72.5%, while aluminum ranges from 55% for cans to 10% for foils and closures. Losses of these materials represent a major loss in value as well as a loss in the embodied energy that is needed to extract new virgin materials from metal mines. Because metal packaging has been used in consumer product packaging for many decades, it is largely accepted by municipal systems and the majority of losses therefore occur at the point of collection, where cans are not successfully collected for recycling or lose value from consumer behavior, such as crushing cans. Some losses also come from the increased use of mixed materials in evolving ton, such as aluminum foils that are used in layers in aseptic and flexible packaging, which are very difficult to separate at EoL.
- Companies and industry associations representing metal packaging have demonstrated vested interest in increasing recycling rates for their products and getting these materials back. Novelis, for example, invested heavily in recycled content efforts and created the evercanTM made with 90% recycled content. However, markets have not been able to supply sufficient recovered material to continue these efforts. Alcoa has made several efforts to convene cross industry dialogs on increasing recovery, but ended up hitting stalemate in all of these conversations because the interests of one material often conflicted with others (Wallace, 2016).

9
Glass - Glass packaging, like metal, is infinitely recyclable and widely accepted in municipal recycling
programs. Its recovery rates range from 14-41%, with beer and soft drink bottles having the highest recovery rates followed by wine and liquor bottles. Other bottles and jars only have a 14.8% recovery rate. The main leakage point for glass is in breakage that occurs post-consumer or at MRFs, which is a significant source of contamination for other recyclable streams and widely cited as a major issue for recyclers, as it pushes up processing costs while degrading quality and re-sale value of bales in single stream systems. There is much evidence to support that separate collection of glass is a favorable economic arrangement.
- Glass packaging does not have the same external consumer pressure for recycled content as more visible, fossil fuel-derived plastic packaging, and although glass packaging does have some aftermarket value, it does not have value driven incentives on par with metal packaging. Producer interest in recycled content is therefore limited. However, producers have significant interest in reducing breakage and contamination that comes from their products as well as a desire to reduce greenhouse gas emissions, since glass is very heavy to transport and serves as a major source of emissions for material users (Wallace and Villeneuve, 2016). For these reasons, the glass industry has traditionally supported container deposit legislation that enables higher recovery rates of glass bottles.
Although all of these materials are used in packaging, each of these materials has different economic value, environmental impacts, and aftermarkets. These distinctions change the set of incentives that different producers are working with and has historically led to conflicts of interest between different material industries and end users, exacerbated in comingled recycling systems where the fates of these materials are intertwined. Plastic and metal packaging industries are driven by an interest in getting material back for reuse, while glass and non-corrugated paperboard users are not. As shown in the MFA, insufficient collection is a leakage point shared across material types. Contamination of the waste stream is also an issue shared across material types, caused primarily by glass, non-recyclable and mixed materials, and other contamination like organic waste. Glass is seen largely as a problem area, whereas plastics are seen as both a problem and an opportunity area, as detailed in the Ellen MacArthur
Foundations recent study, ‘The New Plastics Economy’ (World Economic Forum, Ellen MacArthur Foundation and McKinsey & Company, 2016). However, plastics and mixed material packaging lack sufficient afterlife processing technology and suffer losses at MRFs. In addition to the leakage points defined in the MFA, this study has supplemented the analysis of barriers by looking at literature and interviewing key players working in this field and identified six key systemic barriers, which are outlined in detail in the section below.
Key U.S. Barriers After analyzing material flows for packaging and interviewing experts across material types, this study has identified the following six key systemic barriers to circular material flows for packaging in the U.S. These barriers represent system features unique to the U.S. that have been building in the background over time and been largely ignored until recently, when paired with current global economic conditions have helped to create the so-called ‘perfect storm’ effect, which has pushed the U.S. recycling industry over a critical tipping point. These system features can no longer be ignored and instead must be analyzed as a key driver of the problems that now plague the industry. These six barriers explain the leakage points defined in the

10
MFA and provide additional context that helps to inform how to go about exploring solutions to address these leakage points.
1. Households have limited access to recycling collection services. Access to collection services for recyclables is widely acknowledged by experts as a principle barrier to higher recovery rates for post-consumer materials in the U.S. As a result, this has been an area of focus for many of the producer recycling initiatives to date. Insufficient access to collection services in the U.S. comes from the limited reach and scope of collectors, the placement and availability of collection infrastructure (recycling bins) and municipal political priorities. These variables are also a reflection of geography and culture. The provision of waste and recycling services in the U.S. is a patchwork of incompatible local recycling programs, which leaves a significant number of U.S. residents unaware of what constitutes proper disposal. There are 9,800 different municipal recycling plans operating around the country, and they all follow different rules, a reflection of diversity over the country (E.B., 2015). This has led to large inconsistency on what materials are collected, how they are collected, and confusion about what is recyclable. This type of arrangement also leads to confusion over governance between counties, cities, and haulers, with too many entities involved in decision making and providing services. Collection can be curbside, centralized drop-off locations, or based on private subscriptions to individual households. In rural areas there is generally not much in the way of public collection. Program efficiency varies widely from one community to another. Expansion and improvement of recycling is often constrained by political forces and conflicting budget priorities. In the recent economic climate, haulers have struggled to provide services and cover their costs, passing on costs to municipalities which has resulted in some municipalities reducing or ending recycling programs in response. As mentioned previously, more plastics are stuck in the U.S. recycling market due to China’s Green Fence policy, but 70% of communities across the U.S. are not able to collect and recycle #3-#7 plastics (Podder, 2015). Currently, one quarter of the U.S. population does not have access to curbside collection services. Another quarter of the population lacks proper bins for collecting recyclable material.i With the exception of dense, urban areas, people and the materials they consume in the U.S. are spread out across a large land area compared to many other countries. People in the U.S. are very mobile across long distances, with many food and beverage products consumed in numerous locations throughout the day. This fragmented, on-the-go lifestyle means that recyclable material is widely dispersed, making it more challenging to collect than if people consumed products in more concentrated areas at more regular times, as is more so the case in Europe (Brown, 2016). Even if people have access to collection and are provided bins in their homes, many products are consumed outside the home, which underlies the need for retailers and public places to provide collection bins. Traditionally, the provision of bins is seen as a municipal service, however as noted, there is limited financial capacity or often times jurisdiction to do so in all public areas where this is needed. Retailers and building managers therefore play an essential role in offering this infrastructure.

11
2. Recycled content is contaminated and low quality. Relative to much of the rest of the world, the U.S. produces low quality, dirty recyclables which is related to its use of single stream recycling systems. Contamination leads to losses in value from collected streams, as MRFs can reject bins brought to them by local governments or other haulers if they are too contaminated (Harrison, 2016). China also rejects poor quality imports, which was a major reason behind its implementation of the Green Fence policy in addition to low value from fledgling commodity markets. U.S. plastic exports to China have suffered more than other countries, as contamination of the waste stream from single stream recycling further reduces the value of already low value scrap exports. China has reportedly turned back 10-30%6 in exports from the U.S. for this reason (Royte, 2013). There is a diversity of collection systems in the U.S, however the growing majority, almost two-thirds, are single-stream or comingled recycling programs. Single stream means that materials such as glass and paper are collected in a single large bin and separated at the recycling plant rather than at the point of collection (EPA, 2015). Single stream systems have been demonstrated to recover notably larger volumes of recycled materials (Container Recycling Institute, 2009). However, the increased collection comes at the expense of lower quality, since contamination between pure streams is inherent in a comingled stream. This strategy is lower cost upstream at the point of collection, and as such is widely preferred by municipal governments (Harrison, 2016). The costs of contamination translate downstream to MRFs and recycling plants however, that must increase their operational expenses by more intensively cleaning and sorting comingled materials.7 Glass is a major contaminant in single stream systems since it breaks easily both in disposal and in MRFs and degrades load quality. Food waste and other residue are also a major issue (Cappadona, 2015). Single stream’s big blue bin makes recycling a thoughtless process as it requires no effort to sort and separate on the consumer end, which promotes carelessness leading to contaminates like broken glass and other residuals ending up in the bin. Another source of contamination is the large number of non-recyclable items that must be sorted out. Studies have shown that many Americans are confused about what is recyclable and do “aspirational recycling,” a habit of throwing non-recyclable materials into bins because they might or should be recyclable. This comes from consumer confusion over what is and is not recyclable as the result of large diverse and increasingly complex packaging as well as different materials collected between municipalities and states. Waste Management says that contamination of its recycling stream has doubled in the past decade. Now, an average of one in six items dumped in single stream blue bins is not recyclable, gumming up processing facilities and jacking up costs (Groden, 2015). Consumer behavior is more of a symptom than a cause of contamination in the system. Thoughtlessness downstream and shifting costs upstream is at the foundation of this system and such behaviors are to some degree unavoidable. Many producer and government initiatives to date have focused on consumer education as key in improving proper recycling habits. Consumer education initiatives are the longest lived recycling strategy however even in dual stream systems have simply not proven to be effective. The underlying issues that must be addressed to reduce contamination include the need to separate glass, food waste, and consistency in materials used in design and collected for recycling paired with clear recycling labels.
6 This number has shifted since the green fence was implemented, with certain materials, namely #3-7 plastics being rejected at increasing rates, while others such as paper have recovered. Main data source: CalRecycle. 7 In some places the U.S. has even experimented with ‘dirty MRFs’, where recyclables are all collected in the same stream as municipal solid waste and sorted and cleaned downstream. These systems have been largely unsuccessful and experience exorbitant costs and small profit margins.

12
3. Recovery technologies are not sufficient to handle the evolving ton. Increasing attention has been given to the need for new recycling technologies that support more efficient, intensive automated sorting and processing in U.S. Material Recovery facilities (MRFs). While there are some technologically advanced MRFs in the United States that are more efficient and can handle large quantities of material, they are not state of the art globally. Most were built in the 1990s and designed to accommodate more paper recyclables and have struggled to keep up with the evolving ton. Contamination in single stream systems exacerbate this problem. Single stream MRFs have around a 25% loss rate for materials resulting from losses to incorrect recycling streams and residuals (Collins, 2012). The majority of recycling industry operators in the U.S. are small companies that operate only one or two recycling facilities to service small areas. It is estimated that 77.9% of industry operators have 20 or fewer employees, often sorting materials into different recyclable material streams by hand (IBIS World, 2016). Low tech manual sorting is increasingly difficult and largely inefficient due to the increasingly complex changing waste stream. Between 2000 and 2013, the amount of paper and paperboard Americans have sent to facilities has dropped 22%. Meanwhile, the volume of plastics—which are less lucrative because their diversity and lightness make them harder to sort—has increased by 27%. As noted previously, the U.S. does not have robust recycling technology in place for #3-7 plastics. The U.S. used to export around 50% of its curbside collected materials to China, however studies now estimate the U.S. exports only around 20% of its recyclables following China’s implementation of the Green Fence Policy (Ocean Conservancy, 2015). As a result, the U.S. is now left with substantial materials, mostly plastics, for which there are no markets or domestic recycling systems in place, increasing landfilling rates. Even advanced MRFs struggle to handle the changing waste stream and so the need for technology changes transcends simple upgrades and rather requires the development of totally new processing technologies. At a recent conference, the industry noted the biggest challenges are label separation, film plastics, and the growing use of Polyethylene Terephthalate Glycol-Modified (PETG) and polypropylene (PP) (Paben, 2016). Waste Management recently conducted a MRF level MFA that identified aseptic containers and non-PET/HDPE containers as problematic, with up to 38% loss rates to residual and paper streams. This study noted also that there were substantial differences in loss rates between MRFs, with larger MRFs performing notably better than medium sized MRFs as they have more sets of disc screens and optical sorters (RRS, 2015). As such, there is a major need to increase efficiency through increasing scale in the industry. Technological investments in the industry have been stifled by low oil prices and lack of large-scale innovation in the industry. There is a need to move the industry towards higher tech processing at a larger scale. Part of this is improving technologies in existing MRFs such as better grinders to improve optical sortation, better color sorting, are needed. There has been attention by producer initiatives and studies from the Ellen MacArthur Foundation that cite more focused PRFs (Plastic Recovery Facilities) as a novel and promising way to deal with other plastics. In addition, design and communication also play key roles. The recent MRF MFA noted that the form of the packaging is an important driver of recovery, with rounder materials and less lightweight materials having much lower loss rate (RRS, 2015). Improved bale specifications would help MRFs better understand what plastics recycling companies will accept would also be helpful.

13
4. Recycling policies are inconsistent and don’t enable after-markets. As listed under the discussion on contamination, one major issue that the U.S. system faces is inconsistency in the type of collection and recycling services provided including inconsistency in materials collected. This is a system feature that is inherent in the U.S., as provision of waste and recycling services is disaggregated and occurs largely at the local level8, where municipalities put in place different regulations and collection systems. The system in place is therefore a patchwork of incompatible local recycling programs, which leaves a significant number of U.S. residents unaware of what constitutes proper disposal. There are 9,800 different municipal recycling plans operate around the country, and they all follow different rules, a reflection of diversity over the country (E.B., 2015). This has led to large inconsistency on what materials are collected, how they are collected, and confusion about what is recyclable. Municipalities can be direct service providers or provide these services indirectly through contracts, with haulers. This can be the same or a different company that provides other waste services. Some places have few choices for different haulers and others places have many. Sarah Kite-Reeves, Director of Recycling Services at Rhode Island Resource Recovery Corporation noted that there are 30 different haulers in her one tiny state alone (Kite-Reeves, 2016). This type of arrangement leads to confusion over governance between counties, cities, and haulers, with too many entities involved in decision making and providing services. In addition, service offerings are not uniform from place to place and there are wide regional differences. This lack of consistency and divided governance makes it harder to reinforce some behaviors and scale systems and is not conducive to uniformity, or overall system improvement. This is a challenging barrier to overcome, as disaggregated governance is an inherent feature of the U.S. system. State and local governments are entitled to utilize different policy tools, however to achieve the economies of scale necessary to boost the recycling industry, state and local governments must choose policies that create consistency in materials collected, and support the growth of secondary markets. Some policies can support these markets and others can work against it, which is discussed further in Part 2. For example, local policies most often build in waste and recycling fees into taxes and such, localities have a hard time changing policies that give direct incentives to consumers to make behavior changes.9 Conversely, in certain states, like Oregon, customers get separate bills like a utility and the customer then sees the costs and has options in their serlivices, which is largely acknowledged as a superior approach (Robinson, 2016; Kaplan, 2016; Brown, 2016). Variability in incentive/tax structures is expected, however such policies should aim to treat recycling like a service market rather than a government entitlement. This is often challenging for governments that have other policy objectives like sanitation public service provision or meeting other legislative requirements.
8 In the U.S., the National Resource Conservation and Recovery Act delegates the primary responsibility for recycling to individual states. States then delegate responsibility to local governments for solid waste, recycling and composting management in their communities. States and cities can also create additional local laws on recycling. 9 Rob Kaplan of the Closed Loop Fund identified taxes as a key barrier to working with municipalities
14
5. Recycling provider incentives are misaligned with recovery. In hauling contracts as well as in policy, there is a major need to realign incentives so that they favor of secondary market development. Waste providers themselves can help to redirect these incentives in favor of secondary market development, however in their current form, many contracts do not treat recycling like a market, which prohibits it from acting like one. Large waste haulers that provide recycling services in the U.S. are widely criticized for having skewed economic incentives toward landfills, as in the U.S., they often make money in landfilling materials off of charging tipping fees and lose money in recycling since, as discussed previously it can be uneconomical. In addition, many recycling contracts are weight-based, just like landfill contracts, as opposed to commodity contracts which would vary based on the materials included and better reflect and direct material aftermarkets. Pay-by-the-ton contracts do not have incentives to reduce contamination, do not aim to get material back, and do not necessarily reflect environmental priorities, as carbon based targets would. The ability of haulers to adapt to changing market conditions and to promote recovery is therefore stymied by recycling contracts, which are often restrictive over multiple years and are inelastic to changing prices and the evolving ton. Waste haulers that have clients and services across state lines have the unique capacity to make a difference at scale. Recyclers should act as consultants for their client governments and encourage best practices that allow them to best enable recycling markets. This is a major underutilized source of market creation and there is major need for innovation in this industry and new business models that take risks, step up and disrupt the system.

15
6. Packaging design interferes with recovery. This barrier is one that impacts recoverability of packaging globally and it is tied in with the evolving ton. Use of incompatible resins and mixed materials that degrade end of life quality is simply not economic to recycle and in some cases impossible with existing technology. New types of packaging are launched on a near continuous basis that are disruptive to the existing recycling system. Brands’ product design choices can have substantial influence that limits items that clog both domestic and global recycling systems. This barrier is important in the U.S. context because, as noted by recent reports from the Ellen MacArthur Foundation and the Ocean Conservancy cited previously, many brands and packaging manufactures are based in U.S., and have control over packaging design, as shown in Figure 3. Poor design relates to both choices in materials used and the arrangement of those materials together. Recycling is like mining for valuable secondary materials and so wide use of non-valuable materials that contaminate valuable material streams is a major design barrier (Szaky, 2016). As outlined in the previous section, certain materials have market value and so using these materials in product packaging in a design where they can be recovered essentially adds value to the system. Producers who use these materials also have a built in incentive to recover and reuse these materials. In this case, supply creates more demand. Packaging design choices that utilize very low value materials that are not recyclable, such as polystyrene (PS), put a strain on recycling systems when they end up collected for recycling, as they are designed for landfills, not recycling plants. It is possible of course to imagine a world where a market exists for all materials, however in the nearer term these materials act as disruptors to other materials where there could more easily be thriving secondary markets. For this reason, producers should try to put value into the system in their material choices, wherever possible, rather than putting materials out that disrupt the system. In addition to inherent material value, packaging increasingly uses a mix of various materials which are not easy to separate at EoL. This includes packaging that combines plastic, paper and other materials in layers that are binded together with non-removable adhesives and contaminated with inks and dyes. For example, according to waste360.org, aseptic boxes are 70 percent paper by weight (used for stiffness and strength), 24 percent polyethylene (used in four different layers to seal the package tightly) and 6 percent aluminum foil (used as a barrier against air and light). While these products serve a functional and quality purpose, they are incompatible with recycling economics and existing infrastructure. Within plastic packaging, mixed layers of different polymers are often incompatible and contaminate one another. For example, a small amount of PVC present in a PET recycle stream will degrade the quality of the PET resin (Hopewell et al, 2009). These mixed plastics reduce the overall recyclability and value. Mixed materials should therefore be used in a way where they can be easily separated and do not
Figure 3: Producer Influence on Design
Source: Product Stewardship Institute (PSI). Final Presentation to Connecticut DEEP, December 2015.

16
contaminate one another. New separation technologies are in development and there should be the expectation that technologies evolve to accommodate new forms of packaging. However, it is unrealistic and unreasonable to assert that recycling technology, which requires large capital intensive infrastructure and investment, should be able to adapt every time a novel form of packaging enters the market that was designed without any regard to material recovery. Brands have most responsibility in materials selection and packaging design. These choices are driven by cost reduction and most companies have very limited understanding of EoL of their products. Consumers are part of these unsupportive trends as well because they want cheaper products. There has been incremental improvement in this field, but there is still a major lack of understanding of EoL systems by companies that put products into the market, and most of the conversation to date has focused around consumer education and recovery. Coordinated upstream efforts would undoubtedly impact the entire system.
Summary The six principle barriers in the U.S. that have pushed the recycling industry over the tipping point include:
1. Households have limited access to recycling collection services. 2. Recycled content is contaminated and low quality. 3. Recovery technologies are not sufficient to handle the evolving ton. 4. Recycling policies are inconsistent and don’t enable after-markets. 5. Recycling provider incentives are misaligned with recovery. 6. Packaging design interferes with recovery.
The identified barriers spanned the entire recycling system, from design to recovery. Only half of recyclables are collected for recovery and only 25% of what is collected for recovery is ultimately available at end of pipe to U.S. secondary materials markets. This demonstrate the need for intervention at multiple leakage points in the system. These barriers are overlaid on the MFA figure below to visually demonstrate where they fall across the whole system. This reiterates the need to focus on solutions that address multiple barriers in the recycling supply chain. These barriers have been defined as the result of interviews as well as a detailed literature review. Many of these barriers have come into the light given the global economic situation, which has revealed all kinds of other problems that people had been ignoring (Kaplan, 2016). As demonstrated by the above analysis, these barriers span the entire system from design to collection to recovery to reuse. All major players have responsibility for some, but not all of the identified barriers. Producers and governments blame recycling companies like Waste Management for failing to innovate and take risks to make recycling profitable and for misaligned incentives to landfill, industry and producers blames the American public for their lazy recycling habits and producers for creating packaging that is increasingly difficult to recycle and even at governments for not passing strong legislation that encourages better practices or teaching consumers how to recycle. However, this is not a point source problem. Players involved in the U.S. recycling system are highly dependent yet fragmented and uncoordinated. Crisis in the industry represents a fundamental market failure that requires an integrated, systemic solution where the various moving parts work together. This requires drawing upon new tactics.

17
Figure 2: Systemic Barriers in U.S. Packaging Material Flows
USA Packaging Material Flow (by weight)Current flows using 2013 packaging data
MT= million tons
Chart Key
Emissions
Barrier
Packging material
flow, all materials
(by weight)
Disposal
36.7 MTUse
Sorting/Processing
UseDistribution Collection
75.8 MT
Manufacture
13.2 MT
Export
9.9 MT
39.1 MT
Recovery
24.4 MT
Green Fence
Access
Rejected Loads
Policy
Contamination
Contamination
Contracts
Technology
Design
Global Economy
Barrier
Technology
DesignDesign
Rejected Loads
Policy

18
Part 2: Exploring Solutions Landfilling recyclable materials is a huge waste of energy and resources, however there is no point in recycling if there is not a functioning end market for these materials. Therefore, solutions that aim to reduce waste by increasing recycling must go hand in hand with consideration for secondary market development. In the U.S., there is growing demand for recycled content, but access to this content is stifled by the aforementioned 6 obstacles. There is therefore a critical need for system overhaul. However, within crisis lays opportunity. Although the U.S. has considerable challenges to overcome, this country is a key source of demand for products in the global marketplace and as such has the potential to push the development of markets for recycled content. This has the co-benefits of optimizing material use efficiency, reducing emissions and marine debris, and supporting the more general shift towards a resilient, circular economy. Improving the capacity of the U.S. recycling industry to support the push and pull of supply and demand is a critical step in this direction and would help shield the U.S. against future macroeconomic instability in global commodity markets as well as create domestic economic opportunities through job creation.10 In the absence of national regulations for packaging, the U.S. is a unique testbed of localized policies and market initiatives in response to growing customer demand for sustainable products, concern over material scarcity and meeting carbon emission reduction goals. Some of these initiatives support the development of secondary markets while others work against it. This study argues that end users of secondary materials need to play a key role in crafting solutions if the goal is to enable functioning secondary markets. End users are also referred to as ‘producers,’ the companies that produce products and packaging, which encompasses brands and often industry associations. According to theory, regulation-based approaches to solving environmental problems are more effective than voluntary, company driven initiatives. This is due to the fact that the goal of the policy is an environmental outcome as opposed to profit driven. Environmental policy is implemented when voluntary initiatives are insufficient and therefore they are a necessary response to correct for market failure (Parson and Kravitz 2013). However, many have criticized command and control solutions to everything and voluntary approaches have been advocated because of their potential for flexibility and lower cost (Parson and Kravitz, 2013). Ultimately both policy and market-based innovations serve key functions in recycling system overhaul. The goal is to ensure that the best policies and initiatives are put forth that work towards complimentary objectives and do not work against each other. In this section, this study identifies salient market based and policy initiatives that aim to achieve this objective, with a particular emphasis on the evolving role of the producer.
Policy-Based Solutions Globally, most solutions for problematic packaging waste are driven by regulation, as in most countries, government is involved in waste management as a regulator and as a service provider. Typically, national or sub-national (state or provincial) governments act as regulators, whereas it is local governments that are assigned operational responsibility for waste management. Recycling in the U.S. follows a similar structure,
10 Substantial research has been put out in the past several years on the potential of the ‘circular economy’ to create jobs in the remanufacturing and recycling industries. See works cited: Club of Rome (2015); WRAP and Green Alliance, (2015); WRAP (2015); The Ellen MacArthur Foundation (2015); Nguyen et al. (2014).

19
however national-level regulation of nonhazardous waste is limited. The Resource Conservation and Recovery Act (RCRA) delegates the primary responsibility for recycling to individual states. States must adhere to the standards set out by RCRA and in addition can implement additional laws as they see fit. States delegate responsibility to local governments for solid waste, recycling and composting management in their communities. Cities can also create additional local laws on recycling. As such, policies in addition to management of recycling in the U.S. are disaggregated and occur largely at the state and local level. This makes the U.S. distinct from many other places. According to Susan Robinson of Waste Management, the U.S. has a different way of doing things and very different drivers than the rest of the world, for example: low use of Waste-to-Energy (WtE), large amounts of land and low landfill fees (Robinson, 2016). Rates charged for recycling are often built into community waste management programs. A federal directive for packaging waste, as is in place across Europe,11 is unlikely. Tom Szaky of Terracycle notes that culturally, the E.U. region is more resource concerned, a reflection of its dense area and as the site of two world wars. This concern is reflected in national and supranational legislation, but that won't happen here as there is a very different appetite for policy and a baseline way that industry feels about it. While recycling rates vary by country in Europe, the overall recovery rate for packaging is 67.8%, notably higher than in the U.S.12 Problematic materials like plastics have lower rates than the average, however they are recovered at rates of twice or more than in the U.S. Europe is therefore an example of successful use of policy based initiatives to increase packaging recovery. Most policy based solutions, often called command and control solutions, address a variety of economic, environmental and social concerns which can take the form of either reward or punishment (i.e. the carrot or the stick). Existing programs at the state and local level are comprised principally of recycling goals, landfill bans for recyclables, material bans, pay-as-you-throw (PAYT) or variable pricing, and producer responsibility laws in the form of container deposit legislation. Producer responsibility laws also include Extended Producer Responsibility (EPR) laws, which are in place in every other developed country for packaging except the U.S. but is currently being actively discussed in several states. Looking at the various policy approaches in terms of promoting the circular economy for packaging, it is important to consider not only recycling rates but keeping quality, valuable material in circulation for continued commercial use. In order to achieve this, policy tools must address and correct for the barriers identified in Part 1: 1) Households have limited access to recycling collection services; 2) Recycled content is contaminated and low quality; 3) Recovery technologies are not sufficient to handle the evolving ton; 4) Recycling policies are inconsistent and don’t enable after-markets; 5) Recycling provider incentives are misaligned with recovery; 6) Packaging design interferes with recovery. Some policies address these barriers indirectly and some policies can be combined to address multiple barriers.
Policy
Access to
recycling
collection
Contamination
of recycled
content
Investment
in Recycling
Technology
Policies
support after-
markets
Recycling
contracts
support after-
markets
Packaging
design considers
EoL
Recycling Goals x
Landfill Bans x x x
11 Directive 94/62/EC on Packaging and Packaging Waste established EPR for packaging across the EU and harmonizes national measures and to promote a balanced recycling market across Member States. 12 Statistic for EU 15 countries in 2013 for packaging, from http://appsso.eurostat.ec.europa.eu/nui/show.do
Table 1: Comparison of Policy Initiatives in Addressing Systemic Barriers

20
Policy
Access to
recycling
collection
Contamination
of recycled
content
Investment
in Recycling
Technology
Policies
support after-
markets
Recycling
contracts
support after-
markets
Packaging
design considers
EoL
Material Restrictions/Bans
x x
PAYT x
Container Deposit x x x x x x
EPR x x x x x x
- Recycling Goals include recycling percentage targets as well as mandatory recycling for certain
materials in a given jurisdiction. These are an end as opposed to a means and their effectiveness in addressing the key barriers depends on the joint use of enforcement mechanisms and other programs in place to be effective in achieving a state or city wide goal.13 To have a recycling goal in place however requires at a minimum access to collection services.
- Landfill bans for recyclable materials promote keeping valuable materials in the system by prohibiting their disposal in landfills and in this way they support aftermarkets. Recyclers must comply with these bans, which realigns distorted incentives to landfill. However, bans can be hard to police and their effectiveness is unclear (Carton Council, 2014). Some research on landfill bans for electronic waste (e-waste) in the United State have been largely unsuccessful (American Chemical Society, 2013). These policies do not address access to recycling services or contamination.14
- Material restrictions or bans in states and localities prohibit problematic materials altogether or impose
other restrictions or specifications such as recycled content requirements. As opposed to landfill bans, material use bans and restrictions focus on preventing less valuable materials from clogging the system as opposed to keeping valuable materials in the system. By keeping problematic materials out of the waste stream, this deals with some contamination issues and consumer confusion on certain materials. This in turn can incentivize design that uses unproblematic materials. However, these policies don’t contribute to access.15 There have been mixed reports of effectiveness from these strategies. The city of Austin reports for example that their plastic bag ban reduced the amount of single use plastic bags both in count and by weight, however other bags were used in their place that had higher carbon footprints and increase in costs (Austin Resource Recovery, 2015).
- Pay as You Throw (PAYT) programs or variable-rate pricing programs shift recycling costs towards
consumers by charging households for waste disposal according to their trash volume. Traditionally, residents pay for waste collection through property taxes or a fixed fee, regardless of how much trash they generate. Under PAYT, residents are charged a fee for each bag or the weight of waste they generate. Recycling fees are either not charged or they are charged at a lower fee than waste collection, creating an economic incentive to recycle. EPA estimates that approximately 7,100 communities in the United States use some kind of PAYT, making it available to approximately 25 percent of the country's population, with the number of communities rising over time. Industry organizations largely support
13 States exploring or that have implemented statewide recycling goals include: California, Delaware, Florida, Maine, Maryland, Massachusetts, Minnesota, Pennsylvania, Texas, Virginia and Washington (Carton Council, 2014). 14 Massachusetts, North Carolina, Vermont and Wisconsin. Some cities, such as Seattle, have city-wide bans (Carton Council, 2014). 15 At the federal level, plastic microbeads have been banned in the U.S. California and New York City have banned single use Expanded Polystyrene Loose-Fill Packaging. California, multiple counties in Hawaii, and Washington D.C. prohibit single-use plastic bags in retail stores. New York and Delaware have restrictions on plastic bags. California also has material restrictions in place for Rigid Plastic Packaging Containers (Carton Council, 2014).

21
this policy approach. A study by AMERIPEN concluded that PAYT programs are broadly appealing and can be used in nearly any situation and do not require changes to a community’s collection method (AMERIPEN, 2013). According to the U.S. EPA, communities that use PAYT recycle 30 to 40 percent more than the rest of the country. It has been noted that PAYT is most feasible where governments can measure and monitor individual households' weekly trash and recycling. While PAYT programs address consumer behavior and support access, they do not address issues related to design of products to encourage recovery or contamination of recyclables.16
- Producer responsibility policies are a way to mandate product stewardship, where producers are made
responsible for their products post-consumer use, at End-of-Life (EoL). This is another form of cost shifting like PAYT, but instead toward the producers that put materials on the market and have influence upstream. These policies are essentially funding mechanisms.
Container deposit laws require refundable deposits on beverage containers in order to ensure a high rate of recycling or reuse and help combat litter from beverage containers, which have historically contributed to a large percentage of litter. These policies incentivize the return of valuable materials and addresses contamination. Deposit fees are used towards funding recycling systems including collection and technology upgrades.17 According to the Container Recycling Institute, states with bottle bills have a beverage container recycling rate of around 60%, while non-deposit states only reach about 24%. While bottle bills are comprehensive in barriers addressed, they only apply to a narrow category of products.18 Many states are currently considering reforming their bottle bills to reduce costs and apply to more materials. EPR extends the scope of producer responsibility across packaging products, with variable fees based on materials, which builds in incentives for design that considers EoL. EPR represents the most systemically focused policy option, as these policies aim to fundamentally shift responsibility for packaging recycling to the private sector. EPR programs are well-known to reduce waste associated with consumer products and have documented increases in recycling have occurred in all countries which have implemented it (Stolaroff, 2009). In reality, there are many models for EPR and the effectiveness and support of these policies is highly dependent on the model and structure of the program. Different models are laid out in detail in the Appendix. The U.S. is the only industrialized country without EPR for packaging. However, the past 5 years have seen an increasing number of states start conversations on EPR for packaging and printed paper (PPP).
A study recently published in Resource Recycling tracked state-level recycling legislation and highlighted recycling goals, product stewardship laws and diversion and ban laws for plastics as key areas of activity in the U.S. Plastics accounted for 18 percent of all materials diversion-related bills introduced at the state level in 2015, particularly for plastic bags, expanded polystyrene and plastic microbeads. Under product stewardship, the study noted that EPR for packaging and printed paper (PPP) was a notable topic in their legislative tracking, with a handful of state- level bills were introduced, demonstrating legislators’ increasing openness to EPR possibilities (Leif and Himes, 2015).
16 Some states (Wisconsin, Oregon and Minnesota) have a law requiring that communities use PAYT. 17 This is in an ideal case, one major criticism of bottle bills by producers in the U.S. is that municipalities and states that administer these programs use the fees to fill other budget gaps rather than investing in recycling system upgrades. 18 Ten states have container deposit laws: California, Hawaii, Oregon, Connecticut, Delaware, Maine, Vermont, Massachusetts, Iowa, Michigan and New York.

22
Table 2: Key Areas of Policy Activity, Adapted from Leif and Himes, 2015
Cynthia Dunne of CalRecycle notes that packaging hasn’t been addressed much at all in the U.S. because it is such big product category and the focus has been more on distinct products. However, it is an interesting time for more comprehensive policy discussions. Now that EPR has been in US for a while for other products, there is a perfect storm with the green fence and cross media impacts of packaging waste, like GHG emissions and marine debris. Packaging touches many important topics which is helping to bring it to the forefront of current policy discussions. Current, salient state policy product stewardship initiatives for packaging are further laid out in Table 3 below. These do not represent all conversations had on relevant and novel regulations for packaging, but rather serve to summarize the nature of the evolving discussion over the past year in the U.S.
Table 3: List of Current Product Stewardship Policy Initiatives in the United States19
State
Details
California - CA recently issued a statewide policy goal of not less than 75% of solid waste generated be source reduced, recycled, or composted by the year 2020. CalRecycle estimates that packaging represents about 1/4th of the state’s disposal stream and therefore its reduction and / or recovery play an important role in helping to achieve this goal.
- EPR for packaging waste and bottle bill reform are being explicitly considered as part of this goal and other policies are also being explored.
- CalRecycle issued a “Manufacturers’ Challenge” to explore voluntary approaches, however industry noted that their efforts are unlikely to meet a 50% diversion target in 5 years’ time. CalRecycle has noted preference for a mandatory approach.
- CA had previously implemented multiple material bans/restrictions and container deposit laws (Dunne, 2016; CalRecycle, 2014b)
Connecticut - CT Department of Energy and Environmental Protection (DEEP) is currently in the process of researching different aspects and models of stewardship and EPR for packaging and printed paper. DEEP is collecting data that they could use for proposal to legislature, working closely with the Product Stewardship Institute (PSI). They are exploring a producer financed and managed system with performance targets by material.
- Getting glass out of the waste stream is a priority in CT and they are also considering an extended bottle bill to include wine and liquor bottles, and focusing efforts to increase the recovery value of glass in single stream collection. (Baldwin, 2016; PSI, 2015)
Indiana - IN introduced an EPR bill for PPP that would require producers of waste packaging and printed paper to fund and manage the proper disposal of their products.
- The bill also establishes two state recycling goals: 1) recycling 50% of all household packaging and printed paper by July 1, 2022, and 2) recycling 60% of all household packaging and printed paper by July 1, 2025. (PSI, 2016)
Massachusetts - MA introduced an EPR bill for packaging in 2015 and is researching and proposing EPR action for a variety of items including packaging. If passed, this would be implemented starting January 2017.
- MA already had a landfill ban in place for recyclables. (PSI, 2016)
19 In addition to the initiatives laid out in Table 3, Maine, North Carolina, Delaware and Iowa have also considered EPR for PPP over the last several years. Delaware and other states are also considering bottle bill reform.
Legislative Category Number of bills introduced nationwide
Administration 93
Plastics 68
Product Stewardship 42
Scrap Metal 33
Organics 29
Beverage container deposit 20

23
Minnesota - MN has not yet proposed legislation, however MN Pollution Control Agency has developed a draft EPR bill in the state and is working with Upstream to clarify municipal government roles. This includes a multi-stakeholder authority and fee and reimbursement model.
- Minnesota has a history of exploring EPR and is currently revisiting the possibility. Minnesota was chosen as the case study by Recycling Reinvented, which proposed an industry-led EPR system.
(Hickle, 2016)
Rhode Island - RI introduced an EPR bill for packaging in February 2016, which proposes EPR for printed paper and packaging (PPP) in order to raise PPP recycling rate in Rhode Island from 39 to 75% in two years.
- Incentives: Rhode Island has an incineration ban and is running low on landfill space. - In addition, RI has a relatively centralized waste governance for the U.S. with Rhode Island Resource Recovery Corp.,
a quasi-public body, operating the state's only MRF and a landfill. - Rhode Island has been working with Upstream looking closely at British Columbia’s producer run EPR model (see
Appendix). - RI legislators tried unsuccessfully to get EPR legislation passed last year under the Marine Debris Reduction Act.
(Kite-Reeves, 2016)
Vermont - Bans on the landfill disposal of mandated recyclables went into effect in 2015 as part of the universal recycling and composting law passed initially in 2012.
- This law also authorized municipalities to impose PAYT charges for the collection of municipal solid waste. A big incentive was to explore alternatives to bottle bills.
- EPR bills for PPP had been considered in Vermont in 2014 and the new legislation includes an assessment which still considers exploring EPR.
- Incentives include the future closure of one of the state’s two landfills as well as a desire to reform the state’s bottle bill. (Jamison, 2016)
An analysis of current initiatives shows that EPR and reforming bottle bills are getting increasing traction in the U.S While these bills have not materialized, and many believe they will not, the trend is that more and more states seem to be considering this approach every year. As Cynthia Dunne of CalRecycle notes, it is okay when initial bills do not pass, as it still helps move conversations forward and sends messages to shareholders (Dunne, 2016). Different localities have different incentives for looking at EPR and the conversation varies considerably by state. In theory EPR’s use of variable pricing and involvement of producers encourages the recovery and continued use of material however in practice, the policy’s implementation has met an impasse. Experts largely agree that producers are well situated to help localities collect and market materials in an increasingly global commodities market and will bring greatly needed efficiency and innovation into system (Valiante, 2015). However, states that have considered EPR for packaging are split on appropriate models, with municipalities, states and environmentalists concerned about handing over responsibility to brands. Brands are concerned about the inefficiency and costs that would come with government run models and don’t want to hand over a blank check. The first industry-run EPR model for packaging in North America launched in British Columbia in Canada, and many states and producers alike are watching this initiative closely, although critics still say we would not get the same acceptance for this program here. EPR models are described in more detail in the appendix. In the U.S. business wields tremendous influence over policy and so industry dissent has played a major role in preventing development of EPR programs or policies that shift costs to producers. Some companies with legitimate market and cost-driven interests in enabling secondary markets however, have led support campaigns for policies, against all expectations, issuing in a new era of corporate involvement in waste management.

24
Case Study: Nestle Waters North America- Industry led EPR
Nestle Waters NA (NWNA) initiated the first ever industry-led effort for EPR for paper and printed packaging (PPP) from 2011-2014. Producers are historically reactive to rather than proactive on policy and do not typically initiate policy-based initiatives. Industry tends to oppose policies like EPR in particular, which acknowledge a level of responsibility for EoL products and shift costs to producers. EPR has become a controversial and in some cases derogatory word for many producers, and so Industry led EPR is essentially unheard of. Nestle Waters’ actions marked a significant departure from the historical role of producers and represents truly novel leadership by a brand in exploring solutions for recycling in the United States. This initiative reflects genuine interest by NWNA to craft policies that support getting material back in a way that minimizes costs and supports the mutual environmental and social interests inherent in policy. CEO Kim Jeffery was the visionary leader in these efforts. Jeffrey was the first industry leader to acknowledge that the way we recycle in the U.S. is not conducive to getting material back. Kim Jeffrey noted in his exit interview, “We have more demand for recycled PET than we have supply, which is why the price of recycled material is higher than virgin resin. One of my goals is to figure out a way to get recycled content resin to the price of virgin resin. We need more recycled material coming into the stream in America to make this happen. We need to come together and figure out systemic ways to improve recycling in the United States. We have a broken system of recycling in America. Nobody is winning right now on this thing. We’re not moving the needle.” After looking at various strategies globally to identify good systems, EPR was seen as the most effective policy tool to get material back. Tim Brown, who worked closely under Jeffrey during this initiative, noted that the consumer will pay one way or another, the is question about overall system efficiency and effectiveness, which is where industry-led EPR offered most promise. Bottle bills are a form of EPR, but bottle bills programs run by state governments are seen as costly, with money that comes from the recycling system not necessarily re-invested in the system. Assertions that states use unclaimed deposit to fill budget gaps were a major source of contention. Kim advocate for better systems with correct economic incentives. If brands are owners in the system, they have responsibility to make sure their products get recycled and also have an advantage to use this material in the next stage of packaging. Kim aimed to create a uniquely American model that considered some of the key systemic barriers described in this study.20 Kim’s principle aim was to advance access to secondary materials through increasing recycling rates for NWNA’s products that is enforceable and leverages private sector acumen to reduce the system’s overall costs. The main selling points of the NWNA initiative included: more recycling that was in turn more adaptive to a changing waste stream; Reformed recycling that was more in line with market forces (demand based); Preferential access for producers to material feedstock (e.g. recovered PET); Cost savings – industry as the most efficient player; Decreased overall costs to taxpayers; and regulatory influence from companies that wanted access to recycled feedstock. He proposed an industry-funded system with an incremental increase in recycling over time. He designed framework EPR legislation which used Minnesota as a pilot, since it has available data, supportive policies such as a statewide volume-based pricing statute, good curbside access and infrastructure, almost entirely single stream system, and over capacity at MRFs, conditions conducive to enabling a circular flow of material.21 The key components included:
- Consumer brands (“producers”) would pay 100% of the cost of recycling consumer packaging and printed paper in place of local governments and ratepayers.
- Included both curbside pickup and collection at retailers.
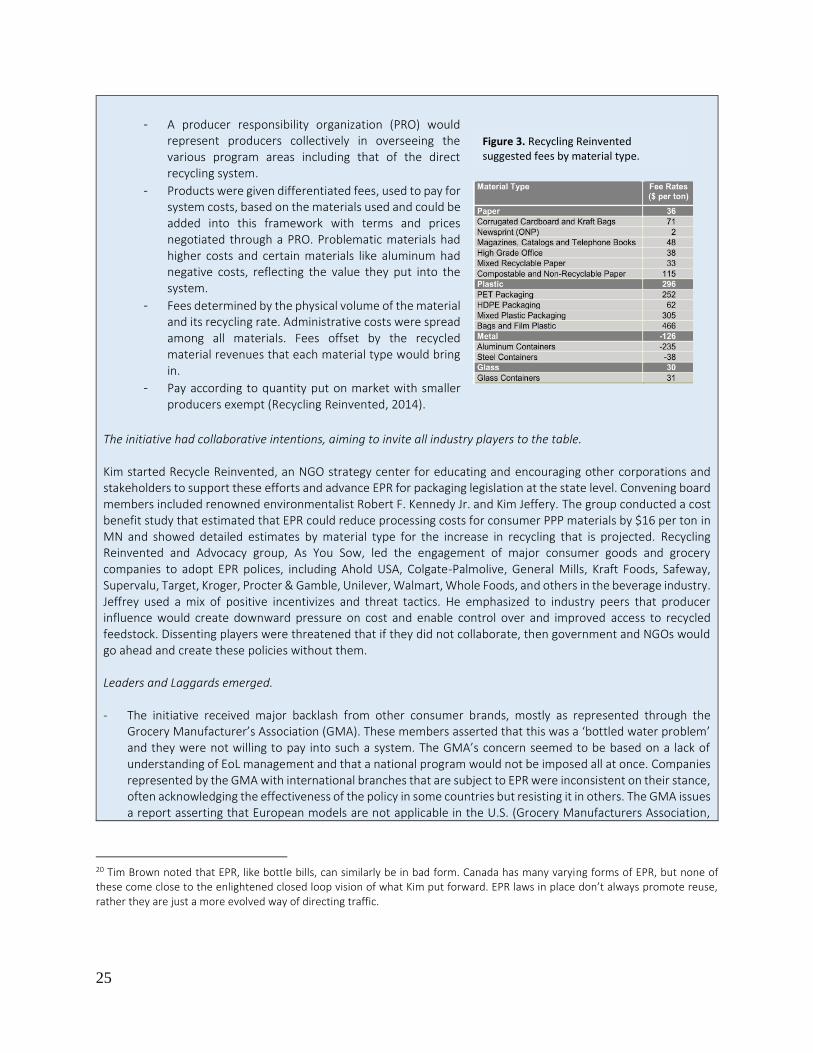
25
- A producer responsibility organization (PRO) would represent producers collectively in overseeing the various program areas including that of the direct recycling system.
- Products were given differentiated fees, used to pay for system costs, based on the materials used and could be added into this framework with terms and prices negotiated through a PRO. Problematic materials had higher costs and certain materials like aluminum had negative costs, reflecting the value they put into the system.
- Fees determined by the physical volume of the material and its recycling rate. Administrative costs were spread among all materials. Fees offset by the recycled material revenues that each material type would bring in.
- Pay according to quantity put on market with smaller producers exempt (Recycling Reinvented, 2014).
The initiative had collaborative intentions, aiming to invite all industry players to the table. Kim started Recycle Reinvented, an NGO strategy center for educating and encouraging other corporations and stakeholders to support these efforts and advance EPR for packaging legislation at the state level. Convening board members included renowned environmentalist Robert F. Kennedy Jr. and Kim Jeffery. The group conducted a cost benefit study that estimated that EPR could reduce processing costs for consumer PPP materials by $16 per ton in MN and showed detailed estimates by material type for the increase in recycling that is projected. Recycling Reinvented and Advocacy group, As You Sow, led the engagement of major consumer goods and grocery companies to adopt EPR polices, including Ahold USA, Colgate-Palmolive, General Mills, Kraft Foods, Safeway, Supervalu, Target, Kroger, Procter & Gamble, Unilever, Walmart, Whole Foods, and others in the beverage industry. Jeffrey used a mix of positive incentivizes and threat tactics. He emphasized to industry peers that producer influence would create downward pressure on cost and enable control over and improved access to recycled feedstock. Dissenting players were threatened that if they did not collaborate, then government and NGOs would go ahead and create these policies without them. Leaders and Laggards emerged. - The initiative received major backlash from other consumer brands, mostly as represented through the
Grocery Manufacturer’s Association (GMA). These members asserted that this was a ‘bottled water problem’ and they were not willing to pay into such a system. The GMA’s concern seemed to be based on a lack of understanding of EoL management and that a national program would not be imposed all at once. Companies represented by the GMA with international branches that are subject to EPR were inconsistent on their stance, often acknowledging the effectiveness of the policy in some countries but resisting it in others. The GMA issues a report asserting that European models are not applicable in the U.S. (Grocery Manufacturers Association,
20 Tim Brown noted that EPR, like bottle bills, can similarly be in bad form. Canada has many varying forms of EPR, but none of these come close to the enlightened closed loop vision of what Kim put forward. EPR laws in place don’t always promote reuse, rather they are just a more evolved way of directing traffic.
Figure 3. Recycling Reinvented suggested fees by material type. Recycling Reinvented Cost Benefit Study

26
2012). Paul Gardner of Recycling Reinvented noted that many of these companies don’t talk to their European colleagues.
- The initiative also received backlash from packaging producers in the paper and glass industry. The paper industry players asserted that recycling rates are high for paper (although as shown in the MFA this is largely isolated to corrugated cardboard with other types of paper recycling very low) and vehemently opposed the proposed system, even calling it a “first amendment violation.” Glass also opposed the initiative, despite growing concern over glass in recycling systems. The industry instead favors bottle deposit systems. Neither of these industries had vested interest in comprehensive system reform that would enable them to get material back in the same way NWNA sought to.
- While learning came very slow with a lot of brands, Nestle Waters did manage to cultivate allies in system reform, which demonstrated those companies and industries that have joint, vested interest in getting materials back in a way that harmonizes policy and market interests. Tim Brown, current CEO of Nestle Waters NA, noted that he was fascinated by the thoughtful participation of many companies. Some leaders included P&G and Unilever as well as several players in the beverage industry, namely Coca Cola, Pepsi and New Belgium Brewing.
- In a survey of beverage container recycling practices released last year by As You Sow, Nestlé Waters, New Belgium Brewing Company, and Coca-Cola said they would support a mandated fee-based EPR system. PepsiCo remained neutral but said it was open to exploring options depending on more detailed specific proposals. Assuming PepsiCo would sign on to one of these, this would represent approval of EPR by a significant percentage of the U.S. beverage market.
- Kim shifted from focus on beverages to broader discussion on packaged goods and grocery companies and many companies have continued to lead on this topic and develop better system knowledge. On Unilever’s website they now state “An increasing number of national, sub-national and local governments are taking action to tackle the environmental impacts of packaging waste. Some of these actions, such as eco-taxes or bans on particular packaging formats, are unlikely to result in higher recycling and recovery rates. However, they will entail significant costs to businesses. Others have the potential to deliver higher recycling and recovery rates in a cost-effective way. These policies may result in formal extended producer responsibility (EPR) schemes, or voluntary agreements with industry partnering with the recycling sector to increase its efficiency and income. We will continue to evaluate individual initiatives and policies on their own merits. Where a formal EPR scheme is proposed, and is appropriate to a country’s context, our support will be conditional on it meeting a set of key criteria. These include being environmentally effective, cost-efficient, taking an integrated, shared approach and avoiding barriers to trade.”
Lessons learned: - The initiative did not bake in a role for municipalities, which was a major issue for states. - Kim picked the fight at the beginning without very sophisticated understanding of the varied perspectives on
the issue within companies and between material types. The initiative revealed major rifts and challenges in industry collaboration.
Wrong Time, Complex Policy Tool but Ignited Discussions on Policy and Producer’s Evolving Role. - Ultimately the initiative did not gain enough support by industry or policymakers to pass in MN legislature,
however it lit important fires that have initiated many of the discussions being had today by states and producers alike. Kim Jeffrey and Recycling Reinvented engaged with many state policymakers, including in Minnesota, Rhode Island and California where current initiatives are being discussed. Cynthia Dunne of CalRecycle noted that the work of Recycling Reinvented really helped to move the overall discussion in U.S. along.

27
- Nestle Waters NA’s initiative was integral in getting producers to take on an active role in policy research even where there was no impending legislation. Recycling and EPR comprise a complex issue set and the companies involved don’t know a lot about recycling let alone complex policy tools aimed towards fundamental system changes. Companies are now increasingly informed and involved in this topic.
- Despite the incentives and threats put forward, the issue was not widely seen as compelling enough to producers at the time since there were no real threat of regulations and there was limited stakeholder pressure. The initiative however got important discussions started in industry which is more receptive to these conversations today in a more compelling economic climate that calls for systemic change.
(Brown, 2016; Hickle, 2016; Gardner, 2016; Washburn, 2015; MacKerron, 2015).
Analysis of Policy-Based Approaches Only producer responsibility policies address all systemic barriers identified, which is logical, as EPR represents a systemic overhaul compared to other polices. However, this approach has been subject to considerable controversy and exposed major rifts between business and government. In implementation, the system’s perceived costs make it largely unappealing to producers, who support other policies such as pay-as-you-throw, where individual consumers pay the cost of their own consumption rather than accepting responsibility by industry. This is consistent with industry’s historical role of placing blame on consumers rather than accepting responsibility, with a few exceptions, most notably Nestle Waters North America and its industry allies. Although recycling in the United States should be approached from such a system perspective to achieve optimization of material recovery, the disaggregated and constrained nature of local decision-making presents considerable obstacles. This is based on the local nature of recycling laws in the U.S., with 50 different states, 10,000 communities and the value difference that come with those. Ultimately, no matter how effective a policy, its restricted implementation on a local or state basis will add inconsistency among items collected and consumer confusion. Tom Szaky of Terracycle noted that state EPR laws would result in atrocious administrative costs because supply chains are not set up to be variable state to state (Szaky, 2016). While conversations on EPR and other systemic policies should be encouraged, many argue that U.S. policy has reached an impasse. Recycling adds costs to the overall system and policies are needed that allow for this to happen. However, there is need for a new paradigm that supports the policies that promote innovation and cultivate secondary markets which serve to reduce overall system costs. Available policy instruments were not set up to respond to market place pulls and local governments don’t think about this. Tim Brown of Nestle Waters NA noted that many of the existing policies were crafted 40 years ago to deal with litter, a stick vs. a carrot. These systems are not expandable and don’t focus on getting quality material out the other side (Brown, 2016). One emerging, noteworthy approach includes the adoption of “Sustainable Materials Management”22 frameworks for packaging, as is currently implemented in Oregon and California and advocated federally by the EPA. This policy framework re-focuses the conversation beyond recycling goals and a narrow focus on waste management to a life cycle approach, which includes design considerations and innovative ideas like waste-shed (like watershed) based recycling management. These frameworks are
22 Sustainable Materials Management (SMM) is a systemic approach to using and reusing materials more productively by looking at a product's entire lifecycle—from materials extraction to end-of-life management. This framework emphasizes exploring new opportunities to reduce environmental impacts, conserve resources, and reduce costs in a way that encourages flexibility and thriving secondary markets.

28
helping to shift the evaluation lens from what goes in bin to what comes out of the bin. Producers at the California Manufacturer’s Challenge supported this framework and Susan Robinson from Waste Management hailed leadership coming from the west coast on this line of thinking (Robinson, 2016). Cynthia Dunne of CalRecycle noted that she hopes that other states can draw insights from these efforts (Dunne, 2016).
Industry-led Solutions Unlike U.S. policy instruments in the, market based instruments transcend local political boundaries and as such, may play a key role in the U.S.’s journey towards improving the recycling system. However, theory suggests that industry-led environmental measures will only work when there is a functioning market that accounts for all environmental costs. Environmental problems are still largely seen as external to central business concerns and therefore, industry-led environmental programs will not account for all costs, perpetuating these market failures and making these initiatives largely ineffective. Environmental policies are enacted in response to negative externalities that occur as the result of market failures, and companies’ willingness to explore voluntarily solutions appears to be contingent on a credible threat of regulation and a robust governance system (OECD, 2016). Because environmental concerns have been historically external, market instruments that pursue environmental goals must either change market conditions in existing markets or create entirely new markets in order to internalize these costs (Parson and Kravitz, 2013). Efforts that work entirely within the existing system without proposing more fundamental market changes will be ineffective and fall under what has become known as “corporate greenwashing.” Effective market solutions therefore require significant innovation by companies that implement them. However, history, in addition to theory, suggests that this is an improbable occurrence. Rather than leading the way, history has shown that companies are far more often the beneficiaries of infrastructural support built by public institutions than they are system architects and there is a widespread lack of accountability and sense of responsibility for items that companies put on to the market. The National Soft Drink Association has historically claimed that “people, not containers, are responsible for litter” (Elmore, 2012). This is still a sentiment expressed today, and many companies focus the majority of their efforts principally in consumer education initiatives rather than working to help reform the failing system. As established in Part 1, consumer behavior is a problem is a problem defined by limited access to bins at home and in public places as well as inconsistency in recycling policies as much as it is laziness. Consumer education initiatives alone therefore fall short of addressing the big picture. In the current scenario in the U.S., many producers are also quick to deflect blame on the waste industry for not innovating enough to keep up with the packaging they put onto the market. Although this view offers elements of truth, it is unreasonable to expect the recycling industry to be able to adapt it capital intensive infrastructure every time new packaging is put onto the market, particularly if there is no value at the end of the pipeline. Design without regard to EoL has played a large role in undermining the recycling system these companies have come to depend on. Despite theory and history, the growth of market instruments represents a major trend in environmental and resource policies of the past few decades, demonstrating the gradual convergence of some environmental and market interests (Parson and Kravitz, 2013). The business case for increased recycling of packaging has been pioneered by companies like Nestle Waters NA, that have identified the overlapping

29
bottom line interests: demand by consumers for more sustainable products and recycled content; hedging against costly legislation; and supply chain risk avoidance through increased access to recycled material feedstock that will ultimately be less susceptible to virgin commodity price fluctuations. These are the same economic incentives that have helped to put major momentum behind the Circular Economy movement, which emphasizes efficiency through closing waste loops in global supply chains and pairs up perfectly with environmental concerns over sustainable use of resources and emissions reductions. The momentum behind this framework is no passing trend, as it represents a novel point where environmental and business interests come together. It also represents a substantial new area for market opportunity, as has been popularized by the tireless work of the Ellen MacArthur Foundation and their colleagues at McKinsey, WRAP, the World Economic Forum and others. In most cases, EoL products managed by industry are limited to products where firms have an incentive to take back products because it is profitable to do so (OECD, 2016). The majority of these items are durable goods with valuable components, for example, industry-led EPR programs have been put in place in the U.S. for consumer electronics, rechargeable batteries, mercury thermostats and auto switches were reviewed in the U.S. (OECD, 2016). Much of the literature on the Circular Economy has also focused on high value, durable goods that enable the remanufacturing23 sector. However, increasing attention is being given to nondurable materials like packaging. Project Mainstream, a cross-industry, CEO-led global initiative sparked by the Ellen MacArthur Foundation just released ‘The New Plastics Economy,’ an extensive report analyzing economic prospects for secondary markets for plastics and is in the midst of another project initiative exploring circular opportunities for paper. As outlined in the MFA in the previous section, U.S. packaging is comprised of a complex mix of valuable and non-valuable materials, which shapes producer incentives to design products and packaging to facilitate EoL management and support recycling efforts. Beverage companies have been leaders on recycling system improvement and reform because they make their products with valuable material (PET) and have sincere interest in getting it back. Tim Brown of Nestle Waters NA noted that there is also heightened concern for recycling for beverages because of the visibility of liter created by their products, which are consumed in a large quantity and largely on the go. The products themselves are relatively inexpensive, but the packaging material is a high percentage of the cost. That given, beverage companies have very strong comp imperative to get access to recycled content at lower cost. Tim noted that this issues still today is “in the highest sector of priorities and is fundamental to the long-term viability and success of the company” (Brown, 2016). Tom Szaky of Terracycle noted that for these reasons, beverage companies an “archetype of circularity” (Szaky, 2016). Meanwhile companies that use packaging material and design that is destined for the dump have little incentive to support circular efforts for packaging. Producers of products with lower EoL value which are costly to collect and process have less overlapping business interest in recycling. These companies are no more or less ‘responsible’ for their EoL products than more vocal, pioneering companies. More of their products may get recycled as the result of industry-led efforts and costs taken on by other companies. This notion of “free riders” has been a major source of contention in this field and a factor behind unsuccessful industry-led initiatives. While policy solutions set up compliance systems that discourages free riders, market driven solutions will inevitably involve disproportionate risks taken on by leaders as the result of unbalanced incentives, resulting in free riders. The playing field is therefore not equal between producers launching market based solutions and free
23 Remanufacturing is a comprehensive and rigorous industrial process by which a previously sold, worn, or non-functional product or component is returned to a “like-new” or “better-than-new” condition and warranted in performance level and quality. Remanufacturing is not the same as “recycling” or “repairing”.

30
riders. Under these circumstances, the issue then becomes whether enough producers will adopt ongoing practices through voluntary commitments to the extent that regulators see as necessary (OECD, 2016). The desire for access to recycled materials and secondary markets is growing, driven by regulatory threats but even more so by consumer pressure and market incentive for valuable materials like PET and aluminum. Recyclers note that they are starting to see some larger retailers that are willing to pay a higher price for recycled content so they can say that to the world (Paben, 2016). There is still a long way to go on this front, as only PepsiCo maintains a consistent level of 10% recycled PET in all product lines sold in the U.S. since 2005 (MacKerron, 2015). In this market context, new, highly collaborative industry-led initiatives are currently flourishing. These initiatives comprise many of the players from the NWNA initiative and historic initiatives led by materials industry organizations. However new players are increasingly coming on board as well, and end users of different materials are starting to collaborate. Industry-led initiatives are therefore evolving and producers are starting to take novel steps focused on the systemic transformation of the recycling market.

31
Case Study 1: The Closed Loop Fund The Closed Loop Fund is a high profile initiative started in 2013 following a Walmart supply-chain summit on the problematic state of recycling in the U.S. which convened 30 experts in recycling, consumer products, and supply-chain. The participants concluded that the root cause of poor recycling rates in the U.S. is a lack of access to capital for cities and recycling firms to invest in the infrastructure and technology needed to increase curbside recycling and materials processing, causing recycling rates to remain unacceptably low. The Closed Loop Fund came into creation to fill this gap, enabling leading brands to work with municipalities to support the development of infrastructure for packaging recycling where it does not exist and help solve the recycling problem across the country. The CFO of the Closed Loop Fund recently stated at the California Manufacturer’s Challenge that they have “learned that the system is pretty much broken from collection to end markets” and that the initiative focuses on system change by making large investments aimed at catalyzing the overall system.24 As demonstrated in the NWNA initiative, the systemic problem is too big for any individual actor to address alone, and the Fund aims to pool resources and address key system barriers that meet the its members objectives. The Closed Loop Fund acts as an investment bank for recycling, however it is more actively involved in the oversight of its investments and takes on greater risks than typical investors. The fund has allocated $100 million as favorable loans with variable interest in an attempt to spearhead investments in recycling that can be replicated around the country. Zero interest loans are available to municipalities and below-market interest loans are available for recycling companies (starting at 5% and dropping to 2-3%). The average loan lasts for 5-10 years. The underlying philosophy is that all loans will be repaid from the success of the investment. The process for approving and monitoring projects is therefore rigorous because it is tied to Return on Investment (ROI). The diligence process can take several months and after the project is completed, the Fund continues to meet with loan recipients and receive regular reports. There are four set criteria for project approval: 1) It has to be financially viable with a clear line of site to repayment, 2) it must result in significant amount of tonnage diverted, 3) it must be reportable and measurable, and 4) it must be scalable and replicable. Managing Director of the Fund, Rob Kaplan notes that the Fund does not have a philosophy advocating particular practices, but finds that “dirty MRFs25,” dual or organic separation programs, or WTE projects are scalable or have sufficient ROI. Membership - The fund is comprised of consumer facing brands that have vested interest in improving recycling and getting
material back. Founding members include Walmart, Coca Cola, PepsiCo, Johnson & Johnson, Colgate-Palmolive, Proctor & Gamble, Keurig Green Mountain, Unilever, and Goldman Sachs, who were later joined by 3M and Dr. Pepper Snapple. Rob noted that each member has different interests and an individual agenda. For example, Coca Cola wants better access to recycled PET and P&G has interest in HDPE. Colgate and Keurig have concerns over recycling rates for difficult-to-recycle packaging that they use for their products.
- Membership in the Fund is not excluded to Brands, however membership comes with a steep price tag that is self-selective, with large consumer-facing brands having more exposure than further up in the supply chain. The Fund invites all interested entities to become members, however Rob noted his skepticism of companies with built-in incentives to landfill recyclables.
Drivers - According to Rob, the principle drivers behind this initiative are first and foremost a desire for improved access
to secondary materials. - Other drivers include growing concern on this topic by consumers and interest in reducing embodied GHG
emissions in products. Although he acknowledged the increasing number of discussions happening around regulations, he doubts that any major laws, such as EPR, will be passed.

32
- There are some accusations that this initiative came at the pressuring of Walmart on other companies that supply its stores. Rob notes however that Walmart offered more of a carrot than a stick and several companies jumped on board the initiative.
- Several of the companies involved were also those that had been thoughtful participants in the NWNA initiative and so have demonstrated preexisting interest in addressing this issue.
- The companies involved expect the return on their investment to be multi-dimensional. First, shoppers will have access to programs to recycle their packaging. Second, they will increase the volume of recyclable packaging, which many companies have committed to publically such as P&G (Sustainable Brands, 2014), and third, they will maximize efficiencies and reduce the environmental footprint of their companies and shoppers. The theory is that as recycling rates increase, members expect access to recycled content to increase for their suppliers and for costs to come down for the entire supply chain.
Investments - The founders believe that other problems associated with the U.S. recycling system flow from infrastructure.
Just because consumers throw a product in a recycling bin doesn't mean that it necessarily gets recycled, and that infrastructure investments will have the most lasting impact and clearest ROI. The fund’s investments focus on problem areas in recycling technology and infrastructure: glass, film plastics, and technology upgrades in MRFs, trucks, and other key infrastructure.
- The first three investments have taken 8 million from the Closed Loop Fund and unlocked an additional 20 million in private and public investment from partnering governments and companies. In next 12-18 months, the Fund will allocate another 30 million in investments and unlock 50-75 million in public and private capital.
- Two of the fund’s first three investments focus on investing in efficient conversion from dual to single stream recycling in rural municipalities in Ohio and Iowa. Rural municipalities have particularly low collection rates and single stream, although it increases contamination, has been shown to increase recycling rates. In Portage County, OH alone, 37,000 tons will be diverted from landfills with a reduction of 110,000 tons of greenhouse gas emissions. GHG emissions Quad Cities is expected to see 86,000 tons diverted from landfills and 250,000 tons of greenhouse gas emissions reduced (Sustainable Brands, 2015).
- The fund’s most recent investment is in new recycling technology in a one-of-a-kind Plastic Recovery Facility (PRF) in Baltimore, Maryland. The project is a joint venture between QRS and Canusa-Hershman (CHR). QRS and CHS will combine technology that can both separate these products and turn them back into raw materials for new products and packaging. The state-of-the-art facility is able to process 4,500 tons of materials every month, which is double the capacity of what’s presently possible in the U.S. The creation of PRFs is one recommendation in the new study, “The New Plastics Economy” by the Ellen MacArthur Foundation as part of Project Mainstream. This investment addresses a lack of sufficient recycling capacity on the east coast. The project will offset 50-100 tons per year.
- After 5 years, the Fund will evaluate the success of its projects looking at impact created at end of year 3 or 4, and if any investors back continuation, they will do it again.
The Fund is Learning and Evolving - The Fund is starting to focus in on other parts of waste stream, for example by focusing in more on problem
areas like film and glass. - The Fund’s leadership acknowledges the definite possibility to evolve into other areas and extend its service,
for example in the area of organics. Members are currently studying the organics landscape in order to figure out where investment opportunities may lay.
24 The California Manufacturer’s Challenge took place on January 5, 2016, where policymakers invited industry to propose voluntary initiatives that would help California meet its 75% statewide recycling goal. 25 Dirty MRFs process recyclables from a stream of raw solid waste and are sometimes used in areas with no curbside programs or in communities that are not interested in recycling.

33
- The Fund is also developing case studies exploring different policy frameworks that support or risk investment projects. Rob notes that there is currently not a lot of deep thinking on this and that states should be involved in this discussion.
- Design is not key focus of the fund but Rob acknowledges that is an important part of working system. As projects continue to advance, this will involve collecting insights that could be helpful on design information such as problematic plastics for PRFs.
Analysis Pros: - The Fund demonstrates growing corporate acknowledgement of a degree of responsibility for EoL
management of their products. Following the California Manufacturer’s Challenge, Cynthia Dunne of CalRecycle said the initiative has been really important in showing industry's acknowledgement of financial responsibility and stated that the initiative has “been really significant in just acknowledging brands’ skin in the game.”
- The Fund’s model is a form of impact investment. The financial approach harnesses an area of brand expertise, financial return on investments, ensuring that the investments made are carefully selected for their economic potential. This means that wasted financial resources are limited. By using such market tools, the Fund treats recycling like a market and its rigor in turn demands like it acts like one.
- The Fund has flexibility in its charter that allows it to evolve and it therefore also serves as a seed fund for innovative business models dealing with core problems in the waste stream. Nina Goodrich of GreenBlue stated that such kick-starter money is very needed and Garth Hickle of Minnesota echoes this stating that outside of some places, there is a real lack in financial ability to make such investments. By investing in increasing reprocessed material output, the Fund focuses on driving technological innovation, which many experts say is critical. Susan Robinson of Waste Management says projects like the PRF help develop solutions for material that no one else if focusing on, like plastic films. The emphasis on replicability is essential in applying lessons across state lines and such data is certainly missing and important to developing effectives business plans.
Cons: - Many experts agree that new technology, such as PRFs, is helpful, however many disagree that infrastructure
upgrades or conversion to single stream are the most useful investments. Tom Szaky notes that technology is not so much of an issue as design and value of the products going into the system. If there is no end market for the material, there was no point in investing in recycling it.
- While it is certainly true that most states and localities lack capital to invest recycling reform, the largest costs in recycling are operational rather than capital expenses, and so there is a call for the Fund to broaden its focus beyond infrastructure.
- The Fund’s membership is limited to a handful of big brands. Many suggested that membership in the Fund appears to be “invite only.” Tim Brown of Nestle Waters NA noted that they were not invited to be in the Fund and feels that NWNA’s former initiative may have driven some space between players working on the same issues. This perception however contradicts Rob Kaplan’s statement that membership is open to anyone, with the possible exception of companies that have vested interest in landfilling recyclables. He noted that he has been disappointed with some brands for not participating. For example, no brands that use much glass are involved. As discussed in this section, maximum collaboration is essential to avoid free riders, and so the Fund should focus efforts towards growing its membership, which may require variable membership fees to appeal to smaller, but interested brands such as New Belgium Brewing.
- Many critics say that the $100 million dedicated to the Fund is not nearly enough to fix the problem. However as outlined above, this is a working experiment, and depending on the success of the projects the Fund may continue or reform.
- The project is a new endeavor and so data on its effectiveness has still to be determined. (Kaplan, 2016 and others referenced in this case study)

34
Case Study 2: The Recycling Partnership The Recycling Partnership is another notable, collaborative producer initiative focused on improving recycling rates for packaging. The Recycling Partnership a mission driven nonprofit and works across many communities to address both the quantity of recyclables collected as well as the quality of these recyclables through providing technical guidance and grants. The Partnership compiles information on best practices in the areas of access and quality and connects cities to transfer these lessons between each other and test these best practices with the support of grants. Grants support programs to reduce contamination through education and improving recycling operations. The Partnership also supports programs to increase access to curbside collection, for example, by providing carts. Whereas the Closed Loop Fund operates like a bank for recycling, the Recycling Partnership operates more like a credit union. The group’s philosophy is to take a whole systems approach to assess and address key barriers to higher recovery rates. The Partnership has been around for longer than the Closed Loop Fund and has cultivated numerous relationships between communities and industry and continues to learn and grow as they go. "We're kind of a startup,” noted President of the Partnership, Keefe Harrison. The Partnership has been around since 2003. Previously the organization was called the ‘Curbside Value Partnership’ and focused primarily on consumer recycling education by working with a few communities per year. This initiative was started through the aluminum industry out of a desire for more recycled aluminum. Data from these early initiatives demonstrated that community projects could be effective in improving recycling programs and over time, the initiative expanded, pulling in other materials industry groups such as plastics, represented by the American Chemistry Council (ACC). The initiative therefore has producer access to recycled materials at its core. The Partnership rebranded in July of 2014 as the ‘Recycling Partnership,’ around the time the Closed Loop Fund formed and following the NWNA EPR initiative. When the Partnership rebranded, it added grants into its service mix, which it offers out to qualifying municipalities. Total grants so far total $11 million. Membership Membership is comprised of 22 funding partners. Partners include mostly trade associations and industry groups that represent different material types, including for example, Alcoa, Amcor, American Chemistry Counsel, American Forest and Paper Association, Can Manufacturer’s Institute, The Carton Council, Dow, The Foodservice Packaging Institute, the International Bottled Water Association, Novelis, and the Society of the Plastics Industry. The Partnership also includes a handful of consumer brands: Coca Cola, Heineken, Keurig Green Mountain, Kimberley Clark, and Proctor and Gamble. Some of this membership overlaps with the membership of the Closed Loop Fund. The Partnership also includes Waste Management as an affiliate member. For the most part, these members represent the big end users of recycled materials who have interest in getting high quality material into reverse supply chains. The Partnership believes it is important to maintain diverse membership that reflects diverse supply chains. The initiative has grown tremendously, from an initial 6 members to now 22 members, and has more grants than ever before. Initiatives The Partnership works primarily with communities because they represent the beginning of the reverse supply chain. They focus on communities with existing recycling infrastructure but bad performance. While their focus is on communities, they also serve the bracket between communities and MRFs and have started to increased their engagement in operations by providing technical advisory to a growing MRF network. When the Partnership rebranded and started offering grants and technical guidance, these efforts focused primarily on access issues, namely the provision of large collection carts for transition to single stream and a focus on quantity collected. The vast majority of their grants still focuses around community upgrades from bin to cart-based collection systems and tailored educational materials. To date they have helped put 165,000 carts on the

35
ground in communities across the U.S. Their current city partners include: Columbia, SC; Florence, AL; Richmond, VA; Roanoke, VA; East Lansing, MI; Greenville, SC; and Santa Fe, NM. In response to current economic conditions and the growth of contamination problems, the initiative expanded its focus to quality issues. The Partnership works with third party groups to test recovery rates and contamination before and after program changes. The models are then available for other local governments to adopt. New engagements in 2016 included improving quality across Massachusetts in partnership with Massachusetts Department of Environmental Protection. They Partnership has also engaged with other ongoing initiatives, for example they are a member of the new industry led Glass Coalition, which is working on the contaminant issue of glass in single stream recycling. They work to help connect members of the Coalition to their best practices resources. They have also worked collaborated with the Sustainable Packaging Coalition. Analysis Pros: - The Recycling Partnership has been around for longer than the Closed Loop Fund and is widely perceived as
doing important work in gathering data and connecting communities. Susan Robinson of Waste Management applauds them for harmonizing their messaging and touching a lot of people with really good information. The perception is that the more funding they get, the better they will be, which is a great motive to attract new members.
- The Partnership has demonstrated its ability to evolve and build coalitions. Many acknowledge the Fund in their broadened approach that addresses contamination and the Fund has also been successful in collaborating with other initiatives like the Sustainable Packaging Coalition and the Glass Partnership.
Cons:
- While the Partnership has engaged a significant number of communities and other players, the $11 million they have made available is not a significant financial commitment from some of the world’s largest industry organizations and is notably less than the $100 million promised by the Closed Loop Fund.
- It is noteworthy that this money comes in the form of grants rather than loans, however the giveaway financial mechanism holds less accountability to grantees than a loan-based system.
- The Partnership’s focus on access does not address all systemic barriers. Garth Hickle of Minnesota DEP called it an “additive but not transformative” approach. He noted that while providing carts to communities is good, this doesn’t address the larger issues around governance, finance and design.
(Harrison, 2016 and others cited in the Case Study)
36
Case Study 3: The Sustainable Packaging Coalition The Sustainable Packaging Coalition (SPC) is an industry working group dedicated to creating closed loop systems for all packaging materials. The SPC is a project of GreenBlue, a nonprofit organization started in 2003 by Bill McKenna, author of “Cradle to Cradle.” The stated purpose of the SPC is to create a safe space for diverse groups across the packaging supply chain to discuss various options to improve recycling and enable members to create and take action. Although there are many industry working groups out there, the study chooses to highlight the SPC since it has significant membership and its efforts focus on recovering more recycled content through the optimization of design, which is a largely underrepresented in industry led initiatives. SPC takes a holistic, lifecycle view of the recycling issue and draws from the Sustainable Materials Management approach mentioned in Part 1. Membership SPC has grown substantially since its initiation and has come to be a widely known industry initiative. Its 200 members span the packaging the value chain, including manufacturers, converters, brands, designers and retailers, academia and waste management. President Nina Goodrich notes that these members are primarily the inside champions in their companies who take information from their involvement in the SPC and go on to influence decisions in their respective organizations. This feature makes the initiative distinct from a trade association, which are only as good as their weakest member. Drivers are distinct for each member, but all have the desire to move needle in this debate. The coalition is a forum to bring these players together and educate them on the various arguments and ideas in the recycling reform debate with a focus on enabling peer to peer communication. Initiatives SPC has popularized the well-known “How to Recycle” label, which, according to Director Nina Goodrich, has received “phenomenal acceptance.” These labels contribute to consumer education on what materials are recyclable and are adapted to different systems. Brands widely support this label as it is a place where they can have impacts on recycling rates as well as communication on recyclability claims. On the design front, SPC has produced design guidelines for producers and packaging engineers. This guidance aims to help engineers and brands ask the right questions in designing packaging, drawing from exiting frameworks such as EPA’s Safer Choice Program and the Institute of Scrap Recycling Industries, (ISRI) Design for Recycling® initiative. Some of the SPC’s members are working to translate this information to their own company by training their packaging engineers. The SPC is however largely disaggregated into various industry leadership committees, where members can work on issues they are particularly keen on, for example, certification systems, residuals or material specific topics. SPC is also doing goals work with its members, by looking at 150 companies and benchmarking how strong or weak the goals are that they set. The SPC uses this information to inform its members’ goals for recycling. The SPC educates its members on issues related to weight-only goals, which often lead to under-consideration of impacts especially given the light weighting trend. The coalition disseminates information on new, much needed metrics for goal setting, such as carbon based targets. Analysis Pros: - Other than the SPC, most other industry-led initiatives and discussions focus narrowly on recovery and largely
ignore design. According to Director, Nina Goodrich, a lot of people lose sight of the beginning, upstream design part of the process. As shown in the MFA and Part 1 however, this piece of the system is critical since packaging design is often disastrous and product designs can disrupt the recycling stream.
- The SPC serves an important function of education of brands and other members that do not understand the complex problems of design and data measurement in the recycling industry. While historic and current market based initiatives focus on educating the consumer, the SPC fills a gap by educating the producer. Brands say that they want recycled content but in order to get it, their packaging has to be recyclable and the consumer has to recycle it.

37
Cons:
- The Coalition has a large membership that is widely representative of players from across various materials in the packaging supply chain. However, the large membership is representative of low membership requirements and expectations. The initiative does not commit any member resources to actual investment in improving systems and cannot enforce the adoption of best practices in design or labeling on its membership. There is therefore limited internal accountability in the initiative.
- Although the SPC is not a trade association, its primary activities are business-business communication in its membership, which makes the initiative largely member-focused, rather than distinctly mission-focused. The information and guidance produced by SPC are noteworthy by ultimately the steps SPC takes are influenced by different member priorities.
- The membership is sparse on relationships with governments and recyclers, who could also adopt and inform the How to Recycle Label.
(Goodrich, 2016 and others cited in this case study)
Analysis of Industry-led Initiatives The highlighted case studies demonstrate the growing trend of producer-led initiatives aimed at improving EoL management for their products. Historically, most voluntary, industry-led efforts have come from a limited number of players, namely the aluminum and plastics industry and beverage companies. Current initiatives incorporate more producers from across materials industries and the food and consumer products sector. Historic efforts have come primarily in the form of consumer education campaigns where industry largely did not acknowledge responsibility in contributing to the problem of low recycling rates. This remains a prevalent theme in industry-led initiatives, however the emergence of new market based tools that promote smart design, best practices in collection, and investment in technology reflects a growing understanding of the greater system, with many of these initiatives boasting a “systems based” mindset in their respective approaches. However, despite such claims, none of these initiatives addresses all systemic barriers in U.S. recycling and taken alone, these initiative will not be effective in producing system-wide change and correcting for market failures. Table 3: Comparison of Industry-led Initiatives in Addressing Systemic Barriers
Policy
Improve
Access to
Recycling
Collection
Address
Contamination
of Recycled
Content
Improve &
Innovate
Recycling
Technology
Promote
Policies that
support after-
markets
Promote
Recycling
contracts that
support after-
markets
Promote
Packaging
Design that
Considers EoL
Closed Loop Fund x x
Recycling
Partnership x x
SPC x x x
When taken together however, these initiatives are successful in addressing most systemic barriers. They act as compliments by offering different tools and demonstrate promise to catalyze more structural change in the system. For this reason, collaboration is key in getting these initiatives to scale and increasing their effectiveness. Two principle gaps remain in promoting effective policies and recycling contracts and as such, working with government and recyclers is also key.

38
As laid out above, the promise for system change lays in addressing all system barriers in a coordinated manner, drawing from distinct areas of expertise and interest as well as pooling both financial and informational resources that have been invested in to date. If these initiatives evolve separately they run the risk of working against each other, just as many policies do. The possibility for effective industry-led measures that addresses all barriers, minimizes free riders, and demonstrates sufficient action to government ultimately depends on the scale and comprehensiveness that comes with systematic collaboration. - The Recycling Partnership and the Closed Loop Fund have had conversations about ways they could
work together and acknowledge that there is opportunity here. Both initiatives work with cities, and the Partnership has a large network of city relationships and best practices that it has cultivated though these efforts. At minimum, the Partnership should share best practices and information about the cities they are working with. Beyond this, the Partnership can help the Fund target and connect with cities for access projects, thereby doubling up their access-related efforts. The Partnership can give guidance on best practices for city funding applications and the Fund can do the same once it has more data on the ROI on various projects. The Partnership focuses more of its work on curbside, which naturally aligns with the Fund’s work when it invests in curbside access projects. The Fund’s work on technology is also very important for the Partnership to leverage since it is the next recovery point for the materials the Partnership is promoting collection for. The Fund should serve in an advisory capacity for the Partnership’s growing technical guidance services to MRFs and share feedback that they receive from industry, developing their own best practices.
- The SPC has an important role to play in influencing both the Fund and the Partnership through their
consistent use of its excellent research and tools. The Partnership and Fund have collaborated on the SPC’s ongoing access study and the Partnership already uses some of SPC’s tools such as the ‘How to Recycle’ Label. The Fund should also use this tool in their access work.
- For the efforts to be comprehensive, more coordination with governments and recycling companies is
needed. The SPC has robust research on the effects of policies26, which can help inform the Fund’s ongoing research on policy frameworks and which the Partnership can help communicate to its city partners. By jointly working with government to promote supportive policies, these initiatives have much more collective sway in influencing the policies that their efforts feed into. Certain policies also have impacts on recycling contracts, such as the “utility” type hauling services offered in OR and CA described in the first section. On all fronts however, more needs to be done to work with recyclers and recyclers that also own landfills need to transform their reputation to be included in these initiatives.
- The SPC has research on closing material loops for distinct material groups and specific products,
reflecting the variable interests of each initiative’s membership. It is important that everyone working on this issue is aware of the best practices for recovering individual material types in an increasingly single stream society, which both the Fund and Partnership promote. This research can feed into the Partnership’s growing contamination work and can also feed into their and the Fund’s involvement in the newly launched Glass Coalition.
- Finally, as discussed in the Case Study, the SPC has unmatched research and knowledge on best
practices in packaging design. Given that the membership of both the Fund and Partnership represent material end-users, it is essential to communicate design as an equally important system barrier to
26 See GreenBlue’s “Road Map for Effective Material Value Recovery” in the reference section.

39
their members. As shown in the MFA in Part 1, design can destroy prospects for recovery of much material from the start, as no matter how many bins are available and how many optical sensors are installed in MRFS, if a product is complicated and costly to disassemble with little end of pipe value, it is not worth recycling. In many ways, having industry adopt sustainable design standards, such as those developed by the SPC, would be most effective, as consumers and collection systems could adapt to these standards, reducing inconsistency, and recycling infrastructure could more easily evolve around that. Government has played a role in this with material bans and specifications, but as the architects of these products and pioneers of packaging innovation, industry has an important role to play in this discussion that it has largely ignored. The Fund should help the SPC update its guidelines based on its own research. Both the Closed Loop Fund and the Recycling Partnership need to expand their scope of influence to design if they truly intend to transform the system.
At present, industry-led efforts are highly fragmented, regionally, by material, and between established companies vs. those that are new to the game. The case studies selected here are only a few of many industry recycling initiatives. For example, it is very difficult to harmonize interests between different material types. Katie Wallace of New Belgium Brewing noted that the interests of the glass industry often diverge, which was the incentive to create the recently formed Glass Coalition. Other materials are also doing this, such as the Carton Council for looking at wax-coated cardboard. In addition, different parts of the supply chain and different companies feel varying levels of responsibility and market draw, making free riders a major problem. In all of these initiatives, some companies are bearing all the costs of investments while everyone benefits from the success of these efforts. It should not be just a handful of producers taking on the full costs of transforming the system, however due to misaligned incentives, there will inevitably be some free riders. The more organizations that join these efforts and the more these efforts are systematically aligned, the more effective the initiatives will be. The market-based interests that an increasing number of producers have in improving the recycling system makes the case for industry-led initiatives more promising. These initiatives have evolved in both their form and in the extent of voluntary participation by industry. These changes demonstrate major learning by companies over the past several years. Despite the gradual alignment of environmental and market interests however, industry-led initiatives lack coordination, scale and the enforcement weight of policy. While it is not impossible to imagine market initiatives influencing 9000 cities simultaneously, with present fragmented efforts, it is difficult. As such, there is still a long way to go before these initiatives offer real promise. Prescriptive, policy-based controls are therefore both likely and needed. Regulators do not have the same knowledge to identify the least-cost efforts and all potential innovators and give them the right incentives (Parson and Kravitz, 2013). It is important therefore that policies aim to support and not stifle promising market initiatives.
Conclusions and Recommendations This study argues that recycling in the United States has reached a critical tipping point where domestic systemic flaws paired with current global economic conditions have resulted in market failure. Packaging materials comprise the largest portion of U.S. municipal solid waste and play a key role. Part 1 of this study defined the problem with packaging recovery in the United States through use of a Material Flow Analysis (MFA), which identified key leakage points for packaging overall as well as for different packaging materials. In addition to the MFA, this study drew from a literature review and a series of interviews with recycling experts from government, NGOS, the recycling industry and consumer product companies in order to

40
determine six systemic barriers that represent key inefficiencies in the recycling system and prevent higher recovery rates. The six principal sources of leakage include:
1. Households have limited access to recycling collection services 2. Recycled content is contaminated and low quality. 3. Recovery technologies are not sufficient to handle the evolving ton. 4. Recycling policies are inconsistent and don’t enable after-markets. 5. Recycling provider incentives are misaligned with recovery. 6. Packaging design interferes with recovery.
The identified barriers spanned the entire recycling system, from design to recovery. Most of the identified barriers have been in the system background for many years and been exacerbated by recent industry trends such as the evolving ton and the move towards single stream recycling. Most post-consumer collection schemes for less valuable and mixed plastics are problematic during the collection and sorting stages, augmented by contamination that comes from single stream recycling and complex, comingled products. Most current MRFs have difficulty handling complex, mixed packaging, and so reducing complexity is key, especially when the move towards low weight-to-volume packaging, which is especially uneconomically viable to recycle. Across material types, the most problematic materials are those with the lowest market value and recycling technology has not evolved to deal with lower value products, instead shipping them to foreign markets. Disruptive global economic trends exist in the system background, namely slowing demand in China and low commodity prices, which keep much of the problematic material in the U.S. and worsen the impacts of these barriers. Only half of recyclables are collected for recovery and, as shown by the MFA, only 25% of what is collected for recovery is ultimately available at end of pipe to U.S. secondary materials markets. However, within this crisis there is opportunity. Global companies have increasing interest in accessing recycled materials to create new packaging and products and so the demand for these markets exists and is growing driven by conscious consumerism. Disruptive global economic conditions mark an important opportunity for the U.S. to invest in its domestic recycling capabilities that will help meet recycled content demands and build a more resilient system. This is a necessary step in moving the U.S. towards a more circular economy. Part 2 of the study explored policy and market-based solutions that are currently being discussed an offered case studies demonstrating how producers are playing an increasingly prominent role in developing U.S. recycling markets. Of the policy instruments available, Extended Producer Responsibility (EPR) is the most systemically focused and therefore addresses the most systemic barriers. This is also an area of increased regulatory activity currently in the United States as policymakers search for more comprehensive solutions. Although this policy tool should theoretically best account for market failures, the governance of these programs is disputed as being wrought with costly inefficiencies, as regulators are not the best equipped to identify the least-cost efforts, assign and distribute costs among all players, or provide the right incentives for innovation. For this reason, producers have largely opposed EPR for packaging in the U.S. An important outlier is Nestle Waters North America (NWNA), which pursued an industry-led EPR initiative that serves as an important case study in producer leadership utilizing policy initiatives. This initiative was driven, at least in part, by market incentives for secondary materials. The initiative exposed many rifts in industry and did not gain widespread support. However, the initiative launched many conversations in government and industry that are ongoing. Much has happened since the NWNA initiative in the United States and the economic conditions as well as producer attitude have evolved, resulting in a growth in voluntary, industry led initiatives. Three of these initiatives, The Closed Loop Fund, the Recycling Partnership, and the Sustainable Packaging Coalition, were examined as case studies. While these initiatives
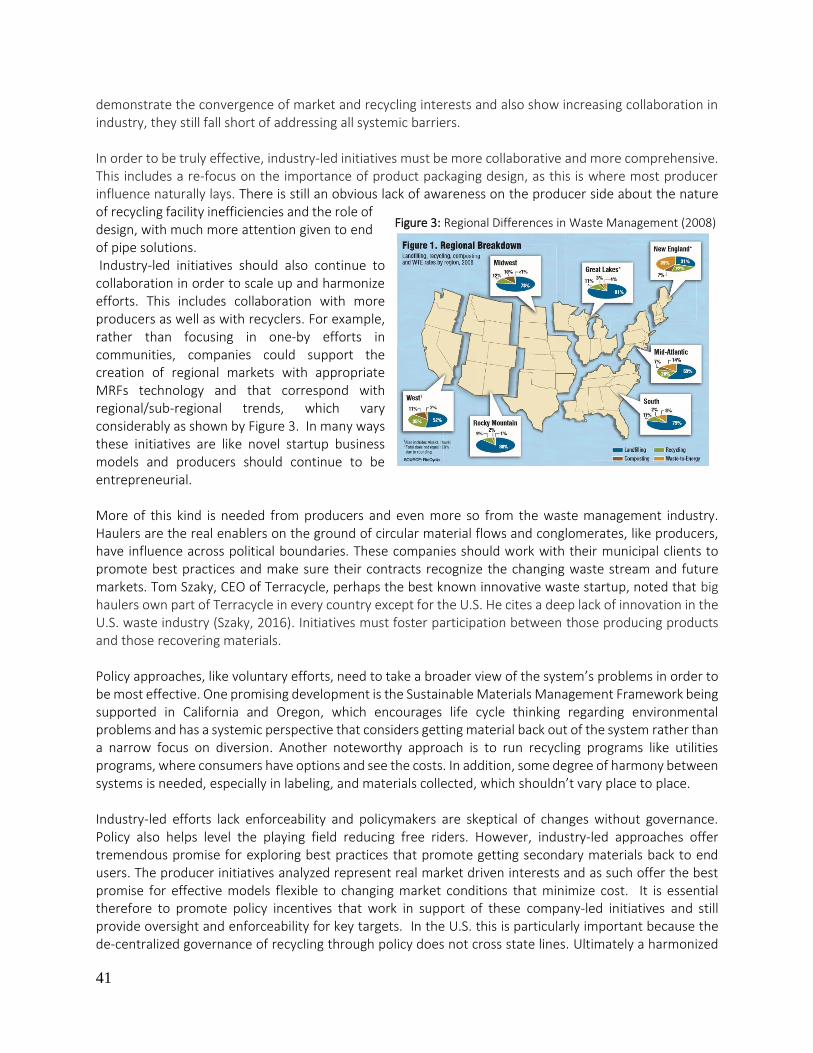
41
demonstrate the convergence of market and recycling interests and also show increasing collaboration in industry, they still fall short of addressing all systemic barriers. In order to be truly effective, industry-led initiatives must be more collaborative and more comprehensive. This includes a re-focus on the importance of product packaging design, as this is where most producer influence naturally lays. There is still an obvious lack of awareness on the producer side about the nature of recycling facility inefficiencies and the role of design, with much more attention given to end of pipe solutions. Industry-led initiatives should also continue to collaboration in order to scale up and harmonize efforts. This includes collaboration with more producers as well as with recyclers. For example, rather than focusing in one-by efforts in communities, companies could support the creation of regional markets with appropriate MRFs technology and that correspond with regional/sub-regional trends, which vary considerably as shown by Figure 3. In many ways these initiatives are like novel startup business models and producers should continue to be entrepreneurial. More of this kind is needed from producers and even more so from the waste management industry. Haulers are the real enablers on the ground of circular material flows and conglomerates, like producers, have influence across political boundaries. These companies should work with their municipal clients to promote best practices and make sure their contracts recognize the changing waste stream and future markets. Tom Szaky, CEO of Terracycle, perhaps the best known innovative waste startup, noted that big haulers own part of Terracycle in every country except for the U.S. He cites a deep lack of innovation in the U.S. waste industry (Szaky, 2016). Initiatives must foster participation between those producing products and those recovering materials. Policy approaches, like voluntary efforts, need to take a broader view of the system’s problems in order to be most effective. One promising development is the Sustainable Materials Management Framework being supported in California and Oregon, which encourages life cycle thinking regarding environmental problems and has a systemic perspective that considers getting material back out of the system rather than a narrow focus on diversion. Another noteworthy approach is to run recycling programs like utilities programs, where consumers have options and see the costs. In addition, some degree of harmony between systems is needed, especially in labeling, and materials collected, which shouldn’t vary place to place. Industry-led efforts lack enforceability and policymakers are skeptical of changes without governance. Policy also helps level the playing field reducing free riders. However, industry-led approaches offer tremendous promise for exploring best practices that promote getting secondary materials back to end users. The producer initiatives analyzed represent real market driven interests and as such offer the best promise for effective models flexible to changing market conditions that minimize cost. It is essential therefore to promote policy incentives that work in support of these company-led initiatives and still provide oversight and enforceability for key targets. In the U.S. this is particularly important because the de-centralized governance of recycling through policy does not cross state lines. Ultimately a harmonized
Figure 3: Regional Differences in Waste Management (2008)
Source: BioCycle, “The State of Garbage in America.” 17th National Survey.

42
approach will make the U.S. recycling system most efficient and resilient in the global marketplace. Recycling in the U.S. may be in crisis but often crisis is what it takes to create action to address problems society has been ignoring. We have only opportunity in front of us.
References 1. American Chemical Society (2013). ‘State e-waste disposal bans have been largely ineffective.’
Presented at a meeting of the American Chemical Society. Accessed at http://www.acs.org/content/acs/en/pressroom/newsreleases/2013/september/state-e-waste-disposal-bans-have-been-largely-ineffective.html
2. Austin Resource Recovery (2015). Environmental Effects of the Single Use Bag Ordinance in Austin,
Texas. Presented by: Aaron Waters For Austin Resource Recovery & The Zero Waste Advisory Commission. 10 June 2015. Accessed at http://www.austintexas.gov/edims/document.cfm?id=232679.
3. American Institute for Packaging and the Environment (AMERIPEN) (2013). AMERIPEN Analysis of
Strategies and Financial Platforms to Increase the Recovery of Used Packaging. August 27, 2013 Accessible at http://www.ameripen.org/wp-content/uploads/AMERIPEN_Recovery_White_Paper_Final_August_27-2013.pdf
4. Baldwin, Sherill (2016). Environmental Analyst. Personal communication, February, 2016.
5. Bell, Victor (2015). Presentation at 2015 Product Stewardship Forum. Product Stewardship Institute,
Boston, MA. Recording available at http://www.productstewardship.us/?page=2015_PS_Forum
6. Brown, Tim (2016). CEO of Nestle Waters North America. Personal communication, March 30, 2016. 7. CalRecycle (2014) a. 2013 California Exports of Recyclable Materials. CA Department of Resources,
Recycling and Recovery, August 2014. Accessible at http://www.calrecycle.ca.gov/publications/Documents/1501%5C20141501.pdf
8. CalRecycle (2014) b. CalRecycle Packaging Workshop Background Paper: Increasing collection and
recovery of packaging in California. November 13, 2014.
9. Cappadona, Bob (2015). EPA Sustainable Materials Management Webinar: Residential Recycling Top Contaminates. Casella Waste Systems presentation, December 17th, 2015. Accessible at https://www.epa.gov/sites/production/files/2015-12/documents/cappadona_.pdf
10. Carton Council (2014). Research and Analysis of Policies that Drive Increased Recycling. Final Report,
prepared by Reclay StewardEdge Inc, May 2014. 11. Cassel, Scott (2014). Scott Cassel. EPR’S Next Steps. Resource Recycling, December, 2014. Accessible
at http://c.ymcdn.com/sites/productstewardship.site-ym.com/resource/resmgr/News_articles_featuring_PSI/2014_December_-_Resource_Rec.pdf .

43
12. Collins, Susan (2012). Contamination In Single-Stream Materials (MRF and post-MRF). Container Recycling Institute. Presentation to Northeast Resource Recovery Association, June 2012. Accessible at http://www.nrra.net/wp-content/uploads/CRI-Collins-SS-NRRA-June-2012.pdf
13. Container Recycling Institute (2009). Understanding economic and environmental impacts of single-
stream collection systems. December 2009. Accessible at http://www.container-recycling.org/assets/pdfs/reports/2009-SingleStream.pdf.
14. Dunne, Cynthia (2016). Senior Environmental Scientist, CalRecycle. Personal communication, March
15, 2016. 15. E.B. (2015). Recycling in America: In the Bin. The Economist, Apr 22nd 2015. Accessible at
http://www.economist.com/blogs/democracyinamerica/2015/04/recycling-america 16. Elmore, Bartow J. (2012). The American Beverage Industry and the Development of Curbside
Recycling Programs, 1950–2000. Business History Review 86 (Autumn 2012): 477–501. doi:10.1017/S0007680512000785 © 2012 The President and Fellows of Harvard College. ISSN 0007-6805; 2044-768X (Web).
17. Embree, Kari (2016). Plastic containers in the U.S. to surpass $32 billion in 2016. Plastics Today,
January 22, 2016. Accessible at http://www.plasticstoday.com/plastic-containers-us-surpass-32-billion-2016/201641403724045
18. Environmental Protection Agency (EPA) (2015). Advancing Sustainable Materials Management: Facts
and Figures 2013. Assessing Trends in Material Generation, Recycling and Disposal in the United States. June, 2015. Accessible at https://www.epa.gov/sites/production/files/2015-09/documents/2013_advncng_smm_rpt.pdf
19. Gardner, Paul (2016). Director, Regional Municipal Partnerships at WasteZero, former Director of
Recycling Reinvented. Personal communication, February 19, 2016. 20. Gelles, David (2016). Skid in Oil Prices Pulls the Recycling Industry Down with it. The New York Times,
February 12, 2016. Accessible at http://www.nytimes.com/2016/02/13/business/energy-environment/skid-in-oil-prices-pulls-the-recycling-industry-down-with-it.html?_r=0
21. Goodrich, Nina. Director of the Sustainable Packaging Coalition. Personal communication, March 8,
2016. 22. GreenBlue (2012). Closing the Loop: Road Map for Effective Material Value Recovery. January 2012.
23. Grocery Manufacturers Association (2012). Evaluation of Extended Producer Responsibility for
Consumer Packaging. Prepared for by SAIC. September, 2012.
24. Groden, Claire (2015). The American recycling business is a mess: Can Big Waste fix it? Fortune Magazine. September 3, 2015. Accessible at http://fortune.com/2015/09/03/waste-management-recycling-business/

44
25. Harrison, Keefe (2016) President of the Recycling Partnership. Personal communication, March 8, 2016.
26. Hickle, Garth (2016). Product Stewardship Team Leader at Minnesota Pollution Control Agency.
Personal communication, February 25, 2016. 27. IBIS World (2016). Recycling Facilities in the US: Market Research Report, April 2016. IBISWorld’s
Industry Research Reports. Accessible at http://clients1.ibisworld.com/reports/us/industry/default.aspx?entid=1518
28. Jambeck, Jenna R., et. al (2015). Plastic waste inputs from land into the ocean. Science Magazine. VOL
347 ISSUE 6223. February 13, 2015.
29. Jamison, Cathy (2016). Solid Waste Program Manager, VT Department of Environmental Conservation. Personal communication, March 14, 2016.
30. Kaplan, Rob. Managing Director of the Closed Loop Fund. Personal Communication, March 8, 2016. 31. Leif and Himes (2015). Charting Legislation in 2015. Resource Recycling. Accessed at http://resource-
recycling.com/node/7057 32. MacKerron, Conrad (2016). Vice President, As You Sow. Personal communication, January 25, 2016.
33. MacKerron, Conrad (2015). Waste and Opportunity 2015: Environmental Progress and Challenges in
Food, Beverage, and Consumer Goods Packaging. Report, Natural Resources Defense Council and As You Sow. January, 2015.
34. Nguyen et al. (2014). Remaking the industrial economy. McKinsey Quarterly, February 2014.
Accessible at http://www.mckinsey.com/business-functions/sustainability-and-resource-productivity/our-insights/remaking-the-industrial-economy
35. Organisation for Economic Co-operation and Development (OECD) (2016). Extended Producer
Responsibility – Updated Guidance. Environment Policy Committee, April, 2016. 36. The Ocean Conservancy (2015). Stemming the Tide: Land-based strategies for a plastic - free ocean.
McKinsey Center for Business and Environment. Accessible at http://www.oceanconservancy.org/our-work/marine-debris/mckinsey-report-files/full-report-stemming-the.pdf
37. Paben, Jared (2016). Recycling realities through eyes of processing experts. Resource Recycling,
Plastics Recycling Update. February 24, 2016 Accessible at http://resource-recycling.com/node/7095 38. Parson, Edward A. and Eric L. Kravitz (2013). Market Instruments for the Sustainability Transition.
Annu. Rev. Environ. Resour. 2013. 38:415–40. doi: 10.1146/annurev-environ-061311-111640. July 29, 2013.

45
39. Podder, Api (2015). Closed Loop Fund Reveals First Three Investments That Will Transform U.S. Recycling. My Social Good News. September 24, 2015. Accessible at http://mysocialgoodnews.com/tag/recycling-infrastructure/
40. Product Stewardship Institute (PSI) (2015). Packaging + Printed Paper Strategies to Increase Recovery
in Connecticut. PSI final presentation to Connecticut DEEP. December 2015 41. Product Stewardship Institute (PSI) (2016). Quarterly Winter Update, January 2016.
https://productstewardship.site-ym.com/news/271373/PSI-Quarterly-Winter-2016.htm 42. Recycling Reinvented (2014). Extended Producer Responsibility Cost-Benefit Study. Prepared by
Reclay StewardEdge Inc. March, 2014
43. Robinson, Susan (2016). Federal Public Affairs Director, Waste Management. Personal communication, March 8, 2016.
44. Royte, Elizabeth (2013). China’s Too Good for Our Trash. Yay? Onearth. October 23, 2013. Accessible
at http://archive.onearth.org/articles/2013/10/china-to-u-s-we-dont-want-your-stinking-trash
45. RRS (2015). MRF Material Flow Study. Final Report, July 2015. 46. Stolaroff, Joseph (2009). Products, Packaging and US Greenhouse Gas Emissions. Product Policy
Institute, White Paper. September 2009. 47. Sustainable Brands (2015). Closed Loop Fund Reveals First Three Investments That Aim to Transform
U.S. Recycling. September 24, 2015. Accessible at http://www.sustainablebrands.com/news_and_views/waste_not/sustainable_brands/closed_loop_fund_reveals_first_three_investments_aim_tra
48. Sustainable Brands (2014). Shareholders Representing $35B Press P&G for Recyclable Packaging.
October 21, 2014. Accessible at http://www.sustainablebrands.com/news_and_views/packaging/sustainable_brands/shareholders_representing_35b_press_pg_recyclable_packag
49. Szeky, Tom (2016). CEO of Terracycle. Personal communication, March 25, 2016. 50. Valiante, Usman (2015). The Relative Economic Efficiency of Shared Responsibility versus the
Principled Application of Extended Producer Responsibility for Printed Paper and Packaging. Corporate Policy Group, Policy Brief, February 1, 2015.
51. Wallace Katie and Dana Villeneuve (2016) Assistant Sustainability Director and Sustainably Specialist.
Personal communication, March 31, 2016.
52. Washburn, Michael (2016). Former VP of Sustainability at Nestle Waters NA. Personal communication, February 19, 2016.

46
53. Wijkman, Anders and Kristian Skanberg (2015). The Circular Economy and Benefits for Society Jobs and Climate Clear Winners in an Economy Based on Renewable Energy and Resource Efficiency: A study pertaining to Finland, France, the Netherlands, Spain and Sweden. Club of Rome.
54. World Economic Forum, Ellen MacArthur Foundation and McKinsey & Company (2016). The New
Plastics Economy – Rethinking the future of plastics. Accessible at http://www.ellenmacarthurfoundation.org/publications.
55. World Packaging Organization (WPO) (2008). Market Statistics and Future Trends in Global Packaging.
Published by WPO, 2008. 56. WRAP (2015). Economic Growth Potential of More Circular Economies. September 9, 2015.
Accessible at http://www.wrap.org.uk/content/economic-growth-potential-more-circular-economies#sthash.pEUDOy0R.dpuf

47
Appendix
Appendix A. Interview Questions Producers
How environmentally/economically important is recycling to your organization?
What are main barriers to higher recycling rates/access to recycled content for your products in
the U.S. (i.e. lack of policy, technology barriers etc.)?
How do you see responsibility and blame breaking down for these various barriers to increased
recycling?
What policy issues are most relevant to your organization? How has this evolved over time?
Which are complementary and which are not?
Are you aware of or concerned about any ongoing policy discussions to increase recycling of
packaging?
Can you discuss your organization’s participation in Nestle Waters NA EPR efforts?
How do you see policy vs market based strategies as addressing key recycling barriers in the U.S.?
Are you engaged with any industry led initiatives like the Closed Loop Fund and Recycling
Partnership? How do these compliment your efforts? Do you think these are effective?
What else needs to happen to fix the recycling problem? How could be more coordinated?
Waste Management
What issues do you work on? How do you work on EPR issues? What other policy issues are most
relevant? How has this evolved over time?
Are you aware of or concerned about any ongoing policy discussions to increase recycling of
packaging? (EPR, PAYT, material bans)
How does WM feel about EPR laws? What about industry-led EPR like the model proposed by
Nestle Waters North America in MN or the one in British Columbia?
Can you discuss the market for recycling in the U.S? - Namely the percentage local government
collection/processing vs. private, small collectors vs. WM and Republic and how this varies
regionally.
What are the biggest issues currently facing the recycling industry? Which are U.S.-specific?
How do you see responsibility and blame breaking down for these various barriers to increased
recycling?
What is WM's and the industry's main strategy to deal with poor state of recycling economics?
How do you plan to fit your efforts in the policy context of state-wide % goals for recycling?

48
What are the key emerging technologies and important innovations?
How do you engage with product producers (brands) and packaging companies?
Have you worked with corporate initiatives like the Closed Loop Fund and Recycling Partnership?
Do you think these are effective? What else needs to happen to fix the recycling problem?
Governments
How economically and/or environmentally urgent is the recycling issue in your state for
packaging? How has this issue evolved?
What are the principle reasons behind unsatisfactory recycling rates for packaging in your state?
Are any of these unique to CA?
How do you see the roles of the state, municipalities, producers or other players on resolving this
issue? Where do you place most blame? How are you working with these players?
Discuss the evolving policy landscape:
o Are you considering EPR? Material bans? Other things? Why are you exploring these
options?
o For EPR systems, are you looking at any proposals or examples in particular?
o What initiatives are you watching in other states? How are these comparable to what's
happening in your state?
What is your opinion on voluntary or industry led efforts following the CA Manufacturer's
Challenge?
What is your opinion on industry initiatives such as the EPR system proposed by Nestle Waters
North America, the Closed Loop Fund, or Recycling Partnership? How do these play a part in
statewide policies? Where are they promising/where do they fall short?

49
Appendix B. EPR Models
Shared EPR: Shared responsibility based EPR models respond to the fears of municipalities by building in cost sharing and control among municipalities and manufacturers. Shared models are in place in the Canadian provinces of Manitoba, Ontario, and Quebec and the United Kingdom. Under this model, municipalities are typically responsible for collection and sometimes for sorting and the division of financial responsibilities for producers varies. The EPR model put forward by Upstream is a shared responsibility model. This model is less likely to cause significant changes in collection and processing systems because those with a stake in existing infrastructure have a role in decisions. This model reflects the sentiment that local governments should have a major say in how waste is managed under EPR as they bear legal or other obligations for waste management and public health in their communities. It also reflects the notion that producers don’t understand recycling market or have environmental goals at the forefront. Municipalities and environmentalists are more likely to support this model. However, producers find them undesirable since they invest in but do not control the system.
Full EPR model: This model, is also referred to in some places as Collective EPR, is producer funded and run, where brands have control over the system, ownership of material and decision making power. The financing of recycling for qualifying products is typically managed solely by manufacturers through a Producer Responsibility Organization (PRO)27. The program decisions are driven by performance and cost efficiency, are flexible to changing market conditions, and provide profit driven incentive for continuous improvement. This may drive changes in infrastructure, for example, by having transfer stations and MRFs strategically placed to maximize recycling. In the U.S. these models exist for paint and packaging. For packaging,
27 A single, monopoly PRO is most common and typically recommended, as it provides administrative simplicity for the producers
and for the government regulatory entities and in smaller jurisdictions, may reflect an effort to capture economies of scale. In these
systems, municipalities may serve as contractors to the PROs, providing local services, but have no automatic role in the system.
In other EPR systems described earlier as “dual systems,” they may compete to provide collection and sorting, but the PROs are
not obliged to use their services. This approach is used for packaging in Austria, Germany and Sweden.
Ontario
- 50% producer funded, 50% government funded
- 2011 recycling rate 64%
- bottle deposit scheme for all alcoholic beverages
- considers packaging design marketability
Manitoba
- 80% producer funded, 20% government
funded
- 2011 recycling rate 52%
- bottle deposit scheme for beer only
Source: Adapted from PSI presentation to CT DEEP,
http://www.ct.gov/deep/lib/deep/p2/ProductStewardship/Strategies_to_Increase_Recovery_in_Connecticut.pdf

50
full models are in place across Europe such as the German EPR system for packaging. In Canada, this model is only in place in British Columbia in Canada.
Companies with major interest in increasing recycling rates and building secondary markets, namely beverage companies, have been more involved in EPR conversations and tend to support producer run models. Municipal governments however fear the loss of control over the system that comes with this model, which has been a large barrier to its adoption. In addition, smaller waste haulers fear loss of market share and environmentalists fear overextending control to big brands whose incentives are not necessarily aligned with the greater good.

51
Appendix C. MFA Calculations
Data
Recovery Data
Weight data: EPA, 2013 https://www.epa.gov/sites/production/files/2015-09/documents/2013_advncng_smm_rpt.pdf
Value data http://www.plasticsnews.com/article/20140723/NEWS/140729969/successful-packaging-is-about-more-than-the-materials-you-use
triple check #s with sources
million tons tons % Value
Generated 75.8 75,800,000.00 100% 155,000,000,000.00$
Discarded 36.7 36,700,000.00 48%
Recovered 39.1 39,100,000.00 52%
Export 19.55 19,550,000.00 26% Variability by products within material type
Sort/Process 19.55 19,550,000.00 26%
Plastic Example Materials ton
t % total Market Share Value PET bottles 2,880,000
Generated 13,980,000 18% 28% 44,051,000,000.00$ recovered 900,000 31%
Discarded 11,940,000 85% 37,622,957,081.55$ Other continers 1,830,000
Recovered 2,040,000 15% 6,428,042,918.45$ recovered 330,000 18%
Export 1,020,000.0 Per ton value 3,151.00$ Bags, Sacks, and Wraps 3,780,000
Sort/Process 1,020,000.0
Paper Example Materials ton
t % total Market Share Value ccardboard 30,050,000
Generated 38,560,000.00 51% 38% 58,900,000,000.00$
Discarded 9,640,000.00 25% 14,725,000,000.00$ Other Paper & Paperboard Pkg 8,510,000
Recovered 28,950,000.00 75% 58,900,000,000.00$
Export 14,475,000.00 38% 22,110,412,344.40$
Sort/Process 14,475,000.00 38% Per ton value 1,527.49$
Glass Example Materials ton
t % total Market Share Value Beer and Soft Drink Bottles 5,420,000
Generated 9,260,000 12% 4% 6,200,000,000$ recovered 2,240,000 41%
Discarded 6,110,000 66% 4,090,928,725.70$ Other Bottles & Jars 2,100,000
Recovered 3,150,000 34% 2,109,071,274.30$ recovered 310,000 15%
Export 1575000 1,054,535,637.15$
Sort/Process 1575000 Per ton value 669.55$
Metal Example Materials ton
t % Market Share Value steel cans 1,870,000
Generated 4,200,000 6% 8,588,390,501.32$ recovered 1,320,000 71%
Discarded 1,760,000 42% 3,598,944,591.03$ al cans 1,270,000
Recovered 2,310,000 55% 4,723,614,775.73$ recovered 700,000 55%
Export
Sort/Process Per ton value 2,044.85$
Total Packaging
Rejected Loads
10% http://your.kingcounty.gov/solidwaste/about/documents/MRF_assessment.pdf
Also found older study citing 10% http://www.monksleigh.com/articles/img/ciwm_hitormiss_july2015.pdf
MRF Losses
Loss rates Source: Container recycling institute
Average Loss rate at single stream 27.20% http://www.container-recycling.org/assets/pdfs/reports/2009-SingleStream.pdf
25% http://www.nrra.net/wp-content/uploads/CRI-Collins-SS-NRRA-June-2012.pdf
PET plastic 24-32% Less in bottlebill states, higer losses for other plastics
Al 2-11%
paper 15-18%
glass 40% way less in dual and bottle bill systems
Material Loss at MRF 4.8875 million tons
Material existing MRF 14.6625 million tons
Mismanaged
Chose based on MRF study using EA data - 16.17 percent,
compared to a WDF figure of only 7.81 percent.

52
Mismanaged
MMT MT tons
Mismanaged waste 0.28 3.24 308,647.17 Mismanaged waste: material that is either littered or inadequately disposed. Inadequately disposed waste is not formally managed and includes disposal in dumps or open, uncontrolled landfills, where it is not fully contained. Mismanaged waste could eventually enter the ocean via inland waterways, wastewater outflows, and transport by wind or tides.
Plastic marine debris 0.04–0.11 http://www.iswa.org/fileadmin/user_upload/Calendar_2011_03_AMERICANA/Science-2015-Jambeck-768-71__2_.pdf
Average range marine debris 0.08 75,000.00 82,673.35
27% % total mismanaged is debris, rest is litter or dumps
Exports
Total MSW recovered 39.1 million tons https://www3.epa.gov/epawaste/nonhaz/municipal/pubs/2012_msw_fs.pdf
Average Exported 63% 62.5 The United States ships 50 to 75 percent of the material collected from curbside recycling programs to China each year.http://archive.onearth.org/articles/2013/10/china-to-u-s-we-dont-want-your-stinking-trash
24.44 million tons
Export countries
% exports MT The top three destination countries made up 69 percent by vessel weight of exports: China – 47 percent (19.9 million tons); Turkey – 13 percent (5.8 million tons); Korea – 9 percent (4 million tons)http://www.calrecycle.ca.gov/publications/Documents/1501%5C20141501.pdf
china 47% 11.49 This includes othr recyclables besides packaging, so used percentages only for packaging data
Turkey 13% 3.18
korea 9% 2.20
other 31% 7.58
24.4375
Post Green Fence
Total Exported to China (post green fence) 10.34 million tons *Assume 10% reductiontotal exportsOcean conservency: The import of plastic waste into China appears to have declined as a result of the “Green Fence,”. Estimates of recycling yields suggest that as much as 20 percent of imported plastic may still enter the waste stream, accounting for roughly 4 percent of total plastic waste in China.
Rejected 1.15 million tons 11% drop 2012-2013 http://www.plasticsnews.com/article/20150514/NEWS/150519958/most-chinese-recycling-firms-left-after-green-fence
Plastics Exported to China 10% CA net change 2012-2014 http://www.calrecycle.ca.gov/publications/Documents/1501%5C20141501.pdf
*Assume 33% drop plastic exports http://www.oceanconservancy.org/our-work/marine-debris/mckinsey-report-files/full-report-stemming-the.pdf
Collected waste leaked in China -
4%
Pre GF Leakage 0.46 million tons
Post GF Leakage 0.41 million tons
Major differences between plastics types: mixed plastics most dropping
10% total reduction plastics31% reduction mixed plastics
http://www.calrecycle.ca.gov/publications/Documents/1501%5C20141501.pdf
Recyling in China https://www.iswa.org/fileadmin/galleries/Task_Forces/TFGWM_Report_GRM_Plastic_China_LR.pdf
50%
50% WTE and Landfill
Recycling of waste accounts for less than 50% wt. of total recovered plastics in China. It can be inferred
that large quantities of domestic waste plastics are used for energy production EfW rather than recycled,
although data to confirm this are not available