Embed Size (px)
Citation preview

EXPLORING THE ENVIRONMENTS OF LONG-DURATION GAMMA-RAY BURSTS
A DISSERTATION SUBMITTED TO THE GRADUATE DIVISION OF THEUNIVERSITY OF HAWAI‘I IN PARTIAL FULFILLMENT OF THE
REQUIREMENTS FOR THE DEGREE OF
DOCTOR OF PHILOSOPHY
IN
ASTRONOMY
August 2010
ByEmily M. Levesque
Dissertation Committee:
L. J. Kewley, ChairpersonA. BoesgaardF. Bresolin
R. KudritzkiJ. LearnedP. Massey

We certify that we have read this dissertation and that, in our opinion, it is
satisfactory in scope and quality as a dissertation for the degree of Doctor
of Philosophy in Astronomy.
DISSERTATION COMMITTEE
Chairperson
ii

c© Copyright 2010by
Emily M. LevesqueAll Rights Reserved
iii

For Heather, who showed me what it means to reach for the stars.And for Pepere, who always believed I was already there.
iv
Acknowledgements
First and foremost, thanks so much to my enthusiastic, tireless, and talented adviser,
Lisa Kewley, for being an inspiring teacher, guide, and role model throughout the course
of my time here as a grad student. Warm thanks to the rest of my thesis committee
- Ann Boesgaard, Fabio Bresolin, Rolf Kudritzki, John Learned, and Phil Massey -
for their valuable and thought-provoking input on my increasingly ungainly thesis. A
special acknowledgment goes to Phil for his sanity-saving guidance, advice, and friendship
throughout all of my astronomy adventures!
Much gratitude must also go to Edo Berger at Harvard University’s Center for
Astrophysics for his guidance and assistance in deciphering the gritty details of every GRB
host I had to wrestle with. Thanks as well to Alicia Soderberg, Bob Kirshner, and Scott
Kenyon for their collaboration, advice, and support during my time as a CfA predoc.
I am indebted to the wonderful support staff, astronomers, and telescope operators
of the Keck Observatories and Las Campanas Observatory, in particular: Greg Wirth,
for his invaluable guidance on observing with LRIS; Scott Dahm and Jim Lyke, for their
vital assistance with NIRSPEC; and Nidia Morrell, for her mission-critical advice on using
IMACS.
Thanks to my many collaborators in our work on GRB and SN host galaxies (Megan
Bagley, Josh Bloom, Nat Butler, Brad Cenko, Lisa Chien, Ryan Chornock, Andy
Fruchter, John Graham, Emeric Le Floc’h, Maryam Modjaz, Dan Perley, Jason Prochaska,
Sandra Savaglio, Christina Thone, and Tiantian Yuan), stellar population synthesis and
photoionization modeling (Kirsten Larson, Claus Leitherer, Daniel Schaerer, and Leonie
v

Snijders), and red supergiants (Phil Bennett, Geoff Clayton, Peter Conti, Eric Josselin,
Andre Maeder, Georges Meynet, Knut Olsen, Bertrand Plez, and Dave Silva).
I wouldn’t have published a word, traveled anywhere, or gotten paid without the
unfailing patience and administrative magic of Amy Miyashiro. Thanks as well to Josh
Barnes, Lisa Catella, Christine Crowley, Shadia Habbal, Nancy Lyttle, Dave Sanders, Lori
Serikawa, Pui-Hin Rhoads, Narayan Raja, Sue Tedeski-Hamelin, Karen Teramura, Diane
Tokumura, Bill Unruh, and Karl Uyehara, without whom I would have none of the critical
paperwork, no working projectors, no internet access, no data analysis software, no room
reservations, and no keys to the building! I am also grateful for the support I received from
the Ford Predoctoral Diversity Fellowship and the Smithsonian Astrophysical Observatory
Predoctoral program.
My fellow Institute for Astronomy grad students, past and present, have been an endless
font of research help, code triage, advice, encouragement, and therapy during the past four
years! Special thanks to the class of “zzzz”s - Cooper, Geoff, Rach, Sonnett, Vivian, and
Tiantian - and to the past and present residents of Grad House for their generosity with
futons, wine, cheese, camaraderie, and the Wii. Thanks as well to the faculty and staff at
the IfA for making the department such an immensely enjoyable place to work, learn, and
grow as a scientist.
A lifetime of thanks must go to Dad, for dragging the 8” Celestron out of the basement
on lots of cold Massachusetts nights; to Mom, for doggedly insisting to the powers-that-
be that yes, there was in fact “math after Calculus”; and to my brother, for perpetually
giving me the dauntingly high goal of “I wanna be like Ben!” to strive for. Deep love and
appreciation to Andrea, Jocelyn, Aaron, and every single member of the big crazy Levesque
and Cabana families for their unwavering support, and to Sarah, Meredith, Cam, Heather,
Jake, Glen, Gina, Lisa, and the rest of the Pi Tau Zeta, MIT, Boston, and Colorado folks
for the adventures and friendship.
Finally, unending love and bottomless gratitude to Dave for his encouragement, patience,
and willingness to put himself at the front lines of a chaotic Ph.D. thesis for four long,
vi

challenging, and wonderful years. I love you as big as the sky...and coming from an
astronomer, that is truly saying something.
vii

Abstract
Long-duration gamma-ray bursts (LGRBs) are the signatures of extremely energetic
phenomena occurring throughout our universe. These events, commonly thought to be
associated with the deaths of massive stars, have been proposed as possible tracers of
star formation at high redshift; however, such an association is dependent on a thorough
understanding of LGRB host environments and progenitors. In particular, the metallicity of
LGRB host galaxies has become a matter of hot debate in recent years, with several studies
suggesting that these events may be biased towards low-metallicity environments. The main
goal of this dissertation is to perform the first in-depth study of the ISM environments and
host galaxies that produce LGRBs. I have conducted the first dedicated spectroscopic survey
of LGRB host galaxies, and used these observations along with data from the literature to
determine a wide range of ISM properties for 16 z < 1 LGRB hosts and compare them to
the general star-forming galaxy population. This work constructs the first mass-metallicity
relation determined for LGRBs out to z ∼ 1. I have also generated an extensive suite
of new stellar population synthesis and photoionization models, tailored towards modeling
the host environments of LGRBs - these models show key improvements over past work,
but also highlight several shortcomings in current model codes that must be addressed in
future studies. Finally, I have examined red supergiants in low-metallicity Local Group
galaxies, a poorly-understood but critical mass-losing phase of massive stellar evolution.
From this work, I have concluded that LGRBs do exhibit a trend towards lower-metallicity
host environments. However, observations of high-metallicity LGRB host galaxies and a
comparison of the energetic and environmental properties of LGRBs both demonstrate that
viii

the complex role metallicity plays in LGRB progenitor formation remains unclear. New
generations of galaxy models and continued studies of massive stellar evolution in low-
metallicity environments are both vital to improving our understanding of the progenitors
and host galaxies that give rise to these enigmatic events.
ix

Table of Contents
Acknowledgements . . . . . . . . . . . . . . . . . . . . . . . . . . . . . . . . . . . . . v
Abstract . . . . . . . . . . . . . . . . . . . . . . . . . . . . . . . . . . . . . . . . . . . viii
List of Tables . . . . . . . . . . . . . . . . . . . . . . . . . . . . . . . . . . . . . . . . xiii
List of Figures . . . . . . . . . . . . . . . . . . . . . . . . . . . . . . . . . . . . . . . xiv
Chapter 1: Introduction . . . . . . . . . . . . . . . . . . . . . . . . . . . . . . . . . . 1
1.1 Properties of LGRB Host Galaxies; Survey and Key Physical Properties . . 6
1.2 Modeling of Star-Forming Galaxies . . . . . . . . . . . . . . . . . . . . . . . 10
1.3 Massive Stellar Evolutionary Theory . . . . . . . . . . . . . . . . . . . . . . 12
Chapter 2: LGRB Host Galaxies - Observations and Analyses . . . . . . . . . . . . . 15
2.1 The Nearby LGRB Host Galaxy Survey . . . . . . . . . . . . . . . . . . . . 15
2.1.1 Keck: GRBs 980703, 991208, 010921, 020819, 020903, 031203,
030329, 051022, 060218, and 070612A . . . . . . . . . . . . . . . . . 15
2.1.2 Magellan: GRB 020405 and GRB 050826 . . . . . . . . . . . . . . . 18
2.1.3 Published LGRB Host Spectra: GRB 980425, GRB 990712, GRB
030528, and GRB 050824 . . . . . . . . . . . . . . . . . . . . . . . . 18
2.1.4 Data Reduction . . . . . . . . . . . . . . . . . . . . . . . . . . . . . . 19
2.2 Analysis of Host ISM Properties . . . . . . . . . . . . . . . . . . . . . . . . 20
2.2.1 Emission Line Fluxes . . . . . . . . . . . . . . . . . . . . . . . . . . 20
2.2.2 Metallicity . . . . . . . . . . . . . . . . . . . . . . . . . . . . . . . . 23
2.2.3 Star Formation Rates . . . . . . . . . . . . . . . . . . . . . . . . . . 27
x

2.2.4 Young Stellar Population Ages . . . . . . . . . . . . . . . . . . . . . 27
2.2.5 Stellar Masses . . . . . . . . . . . . . . . . . . . . . . . . . . . . . . . 31
2.2.6 AGN Activity in the Host of GRB 031203 . . . . . . . . . . . . . . . 31
Chapter 3: LGRB Host Galaxies - Comparison and Interpretation . . . . . . . . . . 33
3.1 LGRB Hosts and the General Galaxy Population . . . . . . . . . . . . . . . 33
3.1.1 Comparison Samples . . . . . . . . . . . . . . . . . . . . . . . . . . . 33
3.1.2 Emission Line Ratio Diagnostic Diagrams . . . . . . . . . . . . . . . 40
3.1.3 ISM Properties . . . . . . . . . . . . . . . . . . . . . . . . . . . . . . 45
3.2 The Mass-Metallicity Relation for LGRB Hosts . . . . . . . . . . . . . . . . 50
3.3 Host Metallicity and the Isotropic Energy Release of LGRBs . . . . . . . . 54
3.4 Discussion . . . . . . . . . . . . . . . . . . . . . . . . . . . . . . . . . . . . . 59
Chapter 4: Unusual Events and Their Host Galaxies . . . . . . . . . . . . . . . . . . 64
4.1 The High-Metallicity Host of the “Dark” GRB 020819 . . . . . . . . . . . . 64
4.1.1 Observations . . . . . . . . . . . . . . . . . . . . . . . . . . . . . . . 65
4.1.2 ISM Properties . . . . . . . . . . . . . . . . . . . . . . . . . . . . . . 66
4.1.3 Discussion . . . . . . . . . . . . . . . . . . . . . . . . . . . . . . . . . 68
4.2 The Relativistic Supernova 2009bb . . . . . . . . . . . . . . . . . . . . . . . 69
4.2.1 Observations . . . . . . . . . . . . . . . . . . . . . . . . . . . . . . . 71
4.2.2 Physical Properties of the SN 2009bb Environment . . . . . . . . . . 71
4.2.3 Comparison with Nearby (z < 0.3) Galaxy Samples . . . . . . . . . 74
4.2.4 Discussion . . . . . . . . . . . . . . . . . . . . . . . . . . . . . . . . . 74
4.3 The Environment of the z = 2.609 Short GRB 090426 . . . . . . . . . . . . 78
4.3.1 Discovery and Afterglow Observations of GRB 090426 . . . . . . . . 80
4.3.2 Analysis and Interpretation . . . . . . . . . . . . . . . . . . . . . . . 82
4.3.3 The Host Galaxy of GRB 090426 . . . . . . . . . . . . . . . . . . . . 83
4.3.4 Discussion . . . . . . . . . . . . . . . . . . . . . . . . . . . . . . . . . 86
Chapter 5: Stellar Population Synthesis and Photoionization Models - Design and
Applications . . . . . . . . . . . . . . . . . . . . . . . . . . . . . . . . . . . . . . . 88
xi

5.1 Introduction . . . . . . . . . . . . . . . . . . . . . . . . . . . . . . . . . . . . 88
5.2 Starburst99/Mappings III Model Grids . . . . . . . . . . . . . . . . . . . . . 92
5.2.1 Model Grid Parameters . . . . . . . . . . . . . . . . . . . . . . . . . 92
5.2.2 Stellar Evolutionary Tracks . . . . . . . . . . . . . . . . . . . . . . . 95
5.2.3 Starburst99 Ionizing Spectra . . . . . . . . . . . . . . . . . . . . . . 97
5.3 Optical Emission Line Diagnostics . . . . . . . . . . . . . . . . . . . . . . . 102
5.3.1 [NII]/Hα . . . . . . . . . . . . . . . . . . . . . . . . . . . . . . . . . 104
5.3.2 [NII]/[OII] . . . . . . . . . . . . . . . . . . . . . . . . . . . . . . . . . 105
5.3.3 [OIII]/Hβ . . . . . . . . . . . . . . . . . . . . . . . . . . . . . . . . . 106
5.3.4 [OIII]/[OII] . . . . . . . . . . . . . . . . . . . . . . . . . . . . . . . . 106
5.3.5 [SII]/Hα . . . . . . . . . . . . . . . . . . . . . . . . . . . . . . . . . . 108
5.4 Emission Line Diagnostic Diagrams . . . . . . . . . . . . . . . . . . . . . . . 109
5.4.1 Comparison With Star-Forming Galaxies . . . . . . . . . . . . . . . 109
5.4.2 Comparison with LGRB Host Galaxies . . . . . . . . . . . . . . . . . 118
5.4.3 Comparison with Previous Model Grids . . . . . . . . . . . . . . . . 121
5.5 Late-Age Models and the Stellar Populations of LGRB Hosts . . . . . . . . 125
5.6 Discussion and Future Work . . . . . . . . . . . . . . . . . . . . . . . . . . . 129
Chapter 6: Red Supergiants: The Physical Properties of Evolved Massive Stars . . . 134
6.1 Introduction . . . . . . . . . . . . . . . . . . . . . . . . . . . . . . . . . . . . 134
6.2 Literature Review . . . . . . . . . . . . . . . . . . . . . . . . . . . . . . . . 137
6.2.1 Red Supergiants and the H-R Diagram . . . . . . . . . . . . . . . . . 137
6.2.2 Metallicity Effects on RSG Evolution . . . . . . . . . . . . . . . . . . 139
6.2.3 Dust Production in Red Supergiants . . . . . . . . . . . . . . . . . . 144
6.2.4 Variable Red Supergiants . . . . . . . . . . . . . . . . . . . . . . . . 146
6.3 Low-Metallicity RSGs in the Local Group . . . . . . . . . . . . . . . . . . . 149
6.3.1 The Local Group Galaxies NGC 6822 and WLM . . . . . . . . . . . 149
6.3.2 Sample Selection . . . . . . . . . . . . . . . . . . . . . . . . . . . . . 152
6.3.3 Observations . . . . . . . . . . . . . . . . . . . . . . . . . . . . . . . 154
xii

6.3.4 Spectral Types . . . . . . . . . . . . . . . . . . . . . . . . . . . . . . 158
6.3.5 Future Work: Physical Parameters for Low-Metallicity RSGs . . . . 163
Chapter 7: Conclusions, Progress, and Future Work . . . . . . . . . . . . . . . . . . 168
Appendix: LGRB Host Galaxy Properties . . . . . . . . . . . . . . . . . . . . . . . . 176
A.1 GRB 980425 . . . . . . . . . . . . . . . . . . . . . . . . . . . . . . . . . . . 176
A.2 GRB 980703 . . . . . . . . . . . . . . . . . . . . . . . . . . . . . . . . . . . 176
A.3 GRB 990712 . . . . . . . . . . . . . . . . . . . . . . . . . . . . . . . . . . . 177
A.4 GRB 991208 . . . . . . . . . . . . . . . . . . . . . . . . . . . . . . . . . . . 178
A.5 GRB 010921 . . . . . . . . . . . . . . . . . . . . . . . . . . . . . . . . . . . 178
A.6 GRB 020405 . . . . . . . . . . . . . . . . . . . . . . . . . . . . . . . . . . . 179
A.7 GRB 020819 . . . . . . . . . . . . . . . . . . . . . . . . . . . . . . . . . . . 179
A.8 GRB 020903 . . . . . . . . . . . . . . . . . . . . . . . . . . . . . . . . . . . 180
A.9 GRB 031203 . . . . . . . . . . . . . . . . . . . . . . . . . . . . . . . . . . . 180
A.10 GRB 030329 . . . . . . . . . . . . . . . . . . . . . . . . . . . . . . . . . . . 181
A.11 GRB 030528 . . . . . . . . . . . . . . . . . . . . . . . . . . . . . . . . . . . 181
A.12 GRB 050824 . . . . . . . . . . . . . . . . . . . . . . . . . . . . . . . . . . . 182
A.13 GRB 050826 . . . . . . . . . . . . . . . . . . . . . . . . . . . . . . . . . . . 182
A.14 GRB 051022 . . . . . . . . . . . . . . . . . . . . . . . . . . . . . . . . . . . 183
A.15 GRB 060218 . . . . . . . . . . . . . . . . . . . . . . . . . . . . . . . . . . . 184
A.16 GRB 070612A . . . . . . . . . . . . . . . . . . . . . . . . . . . . . . . . . . 184
xiii

List of Tables
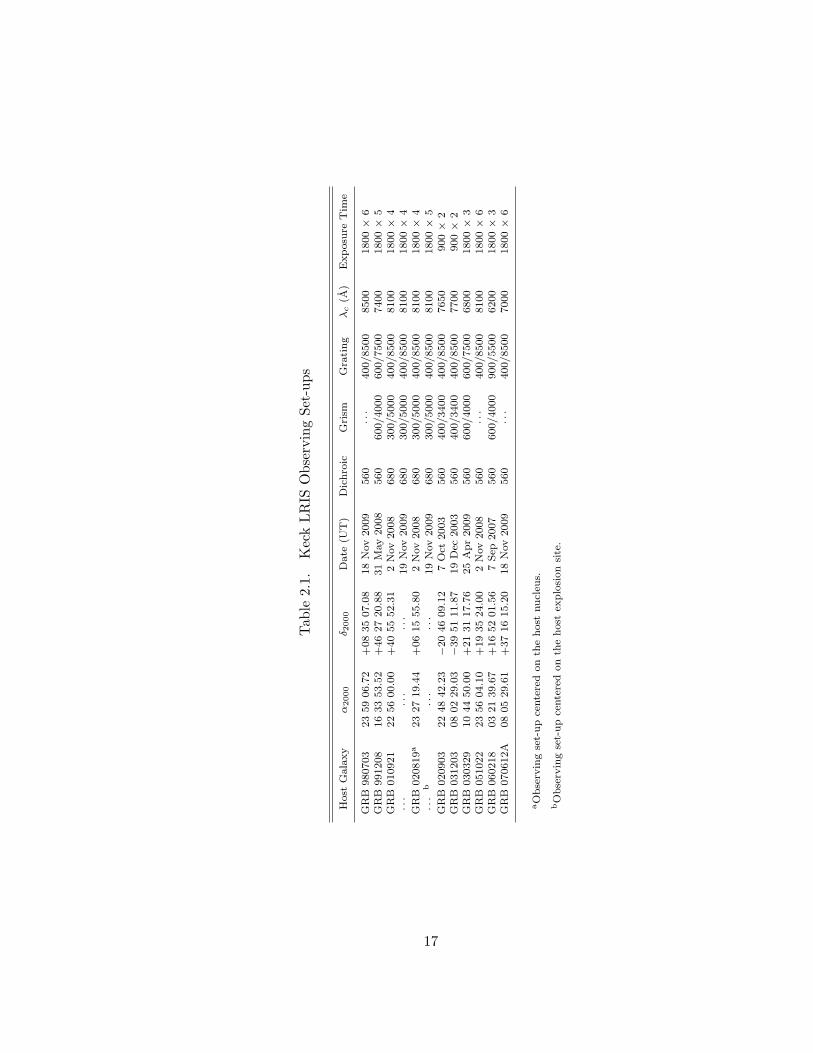
2.1 Keck LRIS Observing Set-ups . . . . . . . . . . . . . . . . . . . . . . . . . . 17
2.2 Diagnostic Emission-Line Fluxes of LGRB Hostsa . . . . . . . . . . . . . . . 22
2.3 ISM Properties of LGRB Host Galaxies . . . . . . . . . . . . . . . . . . . . 26
2.4 Coefficients for the Schaerer & Vacca Age-WHβ Relations . . . . . . . . . . 30
3.1 ISM Properties of Comparison Galaxy Samples . . . . . . . . . . . . . . . . 37
3.1 ISM Properties of Comparison Galaxy Samples . . . . . . . . . . . . . . . . 38
3.1 ISM Properties of Comparison Galaxy Samples . . . . . . . . . . . . . . . . 39
3.2 Kolmogorov-Smirnoff Percentiles for the Nearby (z < 0.3) LGRB Host Sample 45
1 Properties of Nearby (z < 1) LGRBs . . . . . . . . . . . . . . . . . . . . . . 58
4.1 Species detected in Keck/LRIS GRB 090426 afterglow spectrum . . . . . . 82
4.2 Photometry of the GRB 090426 Host-Galaxy Complex . . . . . . . . . . . . 85
6.1 WLM and NGC 6822 Red Supergiants . . . . . . . . . . . . . . . . . . . . . 160
xiv

List of Figures
1.1 Previous work on LGRBs and the luminosity-metallicity relation . . . . . . 5
3.1 Comparison of LGRB hosts to star-forming galaxies: [NII]/Hα vs. [OIII]/Hβ 41
3.2 Comparison of LGRB hosts to star-forming galaxies: [NII]/[OII]vs. [OIII]/[OII] 43
3.3 Comparison of LGRB hosts to star-forming galaxies: [SII]/Hα vs. [OIII]/Hβ 44
3.4 Comparison of LGRB hosts to star-forming galaxies: R23 vs. [OIII]/[OII] . 46
3.5 The luminosity-metallicity relation for LGRB host galaxies . . . . . . . . . 48
3.6 Metallicity vs. young stellar population age for LGRB hosts and star-forming
galaxies . . . . . . . . . . . . . . . . . . . . . . . . . . . . . . . . . . . . . . 49
3.7 Metallicity vs. ionization parameter for LGRB hosts and star-forming galaxies 51
3.8 The mass-metallicity relation for LGRB host galaxies . . . . . . . . . . . . 55
3.9 Host metallicity vs. gamma-ray energy release for LGRBs . . . . . . . . . . 60
4.1 Spectra of the GRB 020819 host nucleus and explosion site . . . . . . . . . 66
4.2 Slit position of the host of SN 2009b . . . . . . . . . . . . . . . . . . . . . . 72
4.3 Spectrum of the SN 2009bb explosion site . . . . . . . . . . . . . . . . . . . 73
4.4 Spectral energy distribution of the SN 2009bb host galaxy . . . . . . . . . . 75
4.5 Comparison of the SN 2009bb host environment to LGRB host galaxies . . 76
4.6 Spectrum of the GRB 090426 optical afterglow . . . . . . . . . . . . . . . . 81
4.7 Image of the GRB 090426 host complex . . . . . . . . . . . . . . . . . . . . 84
5.1 FUV spectra generated by Starburst99 . . . . . . . . . . . . . . . . . . . . . 100
xv
5.2 Relative ionization fractions produced by Mappings III . . . . . . . . . . . . 103
5.3 Evolution of diagnostic emission line ratios with age . . . . . . . . . . . . . 107
5.4 Instantaneous burst model grids for [NII]/Hα vs. [OIII]/Hβ . . . . . . . . . 111
5.5 Continuous SFH model grid for [NII]/Hα vs. [OIII]/Hβ . . . . . . . . . . . 112
5.6 Instantaneous burst model grids for [NII]/[OII]vs. [OIII]/[OII] . . . . . . . 114
5.7 Continuous SFH model grid for [NII]/[OII]vs. [OIII]/[OII] . . . . . . . . . . 115
5.8 Instantaneous burst model grids for [SII]/Hα vs. [OIII]/Hβ . . . . . . . . . 116
5.9 Continuous SFH model grid for [SII]/Hα vs. [OIII]/Hβ . . . . . . . . . . . 117
5.10 LGRB hosts compared to our model grids: [NII]/Hα vs. [OIII]/Hβ . . . . . 119
5.11 LGRB hosts compared to our model grids: [NII]/[OII]vs. [OIII]/[OII] . . . 120
5.12 LGRB hosts compared to our model grids: [SII]/Hα vs. [OIII]/Hβ . . . . . 120
5.13 Comparison of our models to past work . . . . . . . . . . . . . . . . . . . . 124
5.14 Stellar population synthesis model fits to the GRB 020819 host continuum . 128
5.15 Starburst99 ionizing spectra with varied Geneva mass loss treatments . . . 132
6.1 Galactic RSGs and the Geneva evolutionary tracks . . . . . . . . . . . . . . 139
6.2 Explaining the shift in RSG spectral type with metallicity . . . . . . . . . . 141
6.3 The variable spectrum of HV 11423 . . . . . . . . . . . . . . . . . . . . . . 148
6.4 Local Group Galaxy Survey imaging of WLM and NGC 6822 . . . . . . . . 151
6.5 Example of IMACS multslit spectroscopy . . . . . . . . . . . . . . . . . . . 156
6.6 Spectrophotometry of WLM RSGs . . . . . . . . . . . . . . . . . . . . . . . 161
6.7 Spectroscopy of NGC 6822 RSGs . . . . . . . . . . . . . . . . . . . . . . . . 162
6.8 Histograms of RSG spectral types in the Local Group . . . . . . . . . . . . 164
A.1 Spectrum of GRB 980703 host galaxy . . . . . . . . . . . . . . . . . . . . . 185
A.2 Spectra of GRB 991208 host galaxy . . . . . . . . . . . . . . . . . . . . . . 186
A.3 Spectra of GRB 010921 host galaxy . . . . . . . . . . . . . . . . . . . . . . 187
A.4 Spectrum of GRB 020405 host galaxy . . . . . . . . . . . . . . . . . . . . . 188
A.5 Spectrum of GRB 020903 host galaxy . . . . . . . . . . . . . . . . . . . . . 189
xvi

A.6 Spectrum of GRB 031203 host galaxy . . . . . . . . . . . . . . . . . . . . . 190
A.7 Spectrum of GRB 030329 host galaxy . . . . . . . . . . . . . . . . . . . . . 191
A.8 Spectra of GRB 050826 host galaxy . . . . . . . . . . . . . . . . . . . . . . 192
A.9 Spectrum of GRB 05122 host galaxy . . . . . . . . . . . . . . . . . . . . . . 193
A.10 Spectrum of GRB 060218 host galaxy . . . . . . . . . . . . . . . . . . . . . 194
A.11 Spectra of GRB 070612A host galaxy . . . . . . . . . . . . . . . . . . . . . 195
xvii

Chapter 1
Introduction
Gamma-ray bursts (GRBs) are the signatures of extraordinarily high-energy events
occurring in our universe. These phenomena were serendipitously discovered in the late
1960s by the Vela nuclear test detection satellites (Klebesadel et al. 1973) . Subsequent
satellite observatories, including the Burst and Transient Source Explorer (BATSE) of
the Compton Gamma Ray Observatory (Fishman et al. 1989) and the BeppoSAX X-ray
astronomy satellite (Boella et al. 1997), determined that these events were extragalactic
in origin, and that they could be characterized by brief (10−2-103 s) “prompt” emission in
the gamma-ray regime followed by fading “afterglow” emission in the X-ray, optical, and
radio regimes. Examination of the BATSE catalog also led to our current duration-based
classification system for GRBs: short GRBs (SGRBs) with burst durations of <2 s, and
long GRBs (LGRBs) with burst durations of >2 s (Kouveliotou et al. 1993). In recent years,
several observatories dedicated to the study of GRBs, such as the High Energy Transient
Explorer 2 (HETE-2; Ricker 1997), the Swift Gamma-Ray Burst Mission (Gehrels et al.
2004), and the Fermi Gamma-ray Space Telescope (Atwood et al. 2009), have been used to
study the high-energy properties and afterglow emission of these fleeting events.
Currently, the predominant belief is that two distinct progenitor scenarios can be
associated with most GRBs, split according to their duration classifications. The progenitors
of SGRBs are currently a mystery, but have been tentatively associated with coalescing
compact object binaries (consisting of two neutron stars, or a neutron star and a black
1

hole; e.g. Eichler et al. 1989, Paczynski 1991, Narayan et al. 1992, Gehrels et al. 2005).
LGRBs, however, have long been associated with the deaths of unusual massive stars.
In the most widely-adopted progenitor scenario for LGRBs, the rapidly-rotating core
of a massive star known as a collapsar (Woosley 1993) collapses to form a black hole.
The extremely hot remnants of the progenitor will then spiral in towards the newly-
formed rotating black hole. This rapid and high-mass accretion ignites extremely energetic
relativistic jets perpendicular to the rotational plane of the black hole. It is these jets that
are thought to be the source of LGRBs (see Woosley & Bloom 2006). Studies of LGRB
afterglows have revealed changes in brightness and color that are consistent with the thermal
signature of accompanying core-collapse supernovae (see, for example, Zeh et al. 2004, Della
Valle et al. 2006, Soderberg et al. 2006a, Woosley & Bloom 2006, Cobb et al. 2010). In the
past 12 years, we have also associated 5 of the most nearby LGRBs with spectroscopically-
confirmed luminous broad-lined Type Ic supernovae (SNe), confirming their association
with the core-collapse of massive stars. These include GRB 980425/SN 199bw (z = 0.009;
Galama et al. 1998, Patat et al. 2001), GRB 030329/SN 2009dh (z = 0.168; Hjorth et
al. 2003, Stanek et al. 2003, Matheson et al. 2003), GRB 031203/SN 2003lw (z = 0.105;
Malesani et al. 2004, Gal-Yam et al. 2004), GRB 060218/SN 2006aj (z = 0.034; Modjaz et
al. 2006, Mirabal et al. 2006, Pian et al. 2006) and, most recently, GRB 100316D/SN 2010bh
(z = 0.059; Starling et al. 2010, Chornock et al. 2010). Type Ic supernovae SNe are thought
to be caused by the collapse of massive stars that have shed their outer hydrogen and helium
envelopes (see Filippenko 1997), and unusually broad absorption features present in the SNe
spectra indicate the presence of large ejecta velocities (∼30,000 km s−1) due to the effects
of velocity broadening (e.g. Galama et al. 1998, Patat et al. 2001, Pian et al. 2006, Modjaz
et al. 2008).
The proposed massive star progenitors of LGRBs have very short lifetimes (≤10
Myr; Woosley et al. 2002), suggesting that LGRBs should occur in actively star-forming
galaxies such as young starbursts. This property sets them apart from the sample of
SGRB host galaxies, which include elliptical galaxies with much older stellar populations
2
(Berger 2009). The association with star formation has also led to LGRBs being cited
as potentially powerful and unbiased tracers of star formation at high redshifts. The
correlation of LGRB optical afterglow locations with the brightest UV regions of their
hosts supports this connection with star formation (Bloom et al. 2002). Fynbo et al.
(2007) reviewed recent work examining LGRBs and their host galaxies, and concluded
that at high redshifts (z > 2), GRB hosts may be unbiased tracers of star formation, citing
the relatively high levels of star formation relative to luminosity for high-redshift galaxies
with similar morphologies to the LGRB hosts. Chary et al. (2007) also showed that there
is good agreement between the star formation rate inferred by GRBs at z ∼> 4 and the
extinction corrected rates estimated from Lyman break galaxies. Finally, Savaglio et al.
(2009) examined star formation properties for a large sample of archival GRB host galaxy
observations, and concluded that the hosts are comparable to normal star-forming galaxies
in both the local and distant universe.
In recent years, however, several studies have uncovered a connection between the most
nearby LGRBs (z < 0.3) and low-metallicity galaxies, a property that could threaten their
utility as unbiased tracers of star formation in the universe. Most of this past work has
focused on comparing LGRB host galaxies to the general star-forming galaxy population,
or other populations such as metal-poor galaxies or SN host galaxies, on the luminosity-
metallicity (L-Z) diagram, where star-forming galaxies with higher luminosities are generally
found to have higher metallicities (e.g. Lequeux et al. 1979, Skillman et al. 1989, Zaritsky
et al. 1994). Stanek et al. (2006) found that the metallicities of five nearby (z < 0.3) LGRB
hosts were lower than their equally-luminous counterparts, placing them below the standard
L-Z relation for star-forming galaxies (Figure 1.1, top left). Kewley et al. (2007) placed these
nearby LGRB host galaxies below the standard L-Z relation for dwarf irregular galaxies
(Richer & McCall 1995), in a region of the diagram that also includes galaxies officially
classified as “metal-poor” (Figure 1.1, top right; see also Brown et al. 2008). Modjaz et al.
(2008) found that these same 5 LGRB host galaxies had systematically lower metallicities
3

that the host galaxies of nearby (z < 0.14) broad-lined Type Ic SNe with no accompanying
GRB (Figure 1.1, bottom).
Moving beyond the L-Z relation, Fruchter et al. (2006) compared the morphologies of
LGRB and core-collapse supernova host galaxies and found that the LGRB environments
were significantly different than those of core-collapse supernovae out to z ∼ 1. They noted
that LGRBs were found in fainter and more irregular galaxies (Wainwright et al. 2007)
and occurred in the brightest regions of their hosts, which are associated with concentrated
populations of young massive stars. More recently, Kocevski et al. (2009) modeled the
mass-metallicity (M-Z) relation for LGRB host galaxies and found that at z ∼< 1 LGRBs
appeared to be biased towards low metallicity, though they suggested that this bias should
disappear at higher redshifts as a result of metallicity evolution in the earlier universe.
It is possible that the observed connection between LGRBs and low-metallicity
environments may not be a direct result of metallicity at all, but rather an artifact of
other galactic properties that might be favored by LGRBs. It has been proposed that
this apparent low-metallicity bias is instead an artifact of an age bias. Due to the short
lifetimes of their presumed progenitors, LGRBs are expected to occur in galaxies with
younger stellar populations, which typically have lower metallicities (Bloom et al. 2002,
Berger et al. 2007). LGRBs may also favor young star-forming galaxies because of their
association with burst-like star formation histories, as bursts of star formation can generate
dense clusters of massive stars that are conducive to the formation of GRB progenitors.
This second explanation considers both the collapsar model of GRB progenitors and an
alternative progenitor model that generates LGRBs during the formation of black hole X-
ray binaries (e.g. Podsiadlowski et al. 2004, 2010; Fryer & Heger 2005, van den Heuvel &
Yoon 2007).
Unraveling the complex relationship between LGRBs and low-metallicity host
environments is extremely important. A large-scale metallicity bias extending to higher
redshifts could challenge the use of these phenomena as tracers of star formation in normal
galaxies at large look-back times. Such a result would suggest that LGRBs are not the best
4

-10 -12 -14 -16 -18 -20 -22MB
7.0
7.5
8.0
8.5
9.0
12+l
og
(O/H
)
Pilyugin dIrrsRicher & McCall dIrrsShi/Kong BCGsGRB HostsLow-Z galaxiesLZ0809+1729
Figure 1.1 Top left: From Stanek et al. (2006); five z < 0.3 LGRB host galaxies (filled circles)compared to local star-forming galaxies (red points) from the Sloan Digital Sky Survey (SDSS;Tremonti et al. 2004) and the metallicities of the Milky Way, Large Magellanic Cloud, and SmallMagellanic Cloud in the L-Z parameter space. Top right: From Kewley et al. (2007); a comparisonof star-forming galaxies (crosses, open triangles), z < 0.3 LGRB hosts (squares), and extremelymetal-poor galaxies (filled circles). The L-Z relation for dwarf irregular galaxies from Richer &McCall (1995) is shown as a solid black line, while the L-Z relation for star-forming SDSS galaxiesfrom Kewley & Ellison (2008) is shown as a blue dotted line. Bottom: From Modjaz et al. 2008;z < 0.3 LGRB host galaxies (red squares), broad-lined Type Ic SN hosts (blue circles), and thestar-forming SDSS galaxies of Tremonti et al. (2004; yellow points). Circled and squared pointsrepresent galaxies found in non-targeted searches. The dashed line marks the proposed dividing linein metallicity between LGRB host galaxies and Type Ic SN hosts.
5

means of probing early star formation, since they would be considerably less likely to occur
in normal star-forming galaxies (Stanek et al. 2006). Conversely, a low-metallicity trend
may be present but still not entirely preclude the use of LGRBs as tracers of star formation
in the high-redshift universe. The metallicity of the star-forming galaxy population is known
to evolve with redshift; galaxies at z ≥ 1 are less enriched and have lower metallicities on
average (e.g., Kobulnicky & Kewley 2004, Shapley et al. 2004, Erb et al. 2006, Chary et al.
2007, Dave & Oppenheimer 2007, Liu et al. 2008), so at higher redshifts a low-metallicity
trend in LGRB hosts may make them more likely to sample the general population.
Understanding the connection between LGRBs and their host galaxy metallicities is a
complex problem. Properly examining this issue requires a detailed investigation of several
key questions:
1. What kinds of galaxy environments are hosting LGRBs? How do these
compare to the general galaxy population?
2. Can current stellar population synthesis and photoionization codes
produce satisfactory models of LGRB host galaxies?
3. How do massive stars evolve in and contribute to LGRB host
environments? What can this tell us about progenitor evolution and stellar
population modeling in these galaxies?
This dissertation presents the research that I have conducted in the hopes of addressing
these key questions.
1.1 Properties of LGRB Host Galaxies; Survey and Key
Physical Properties
Previous studies of LGRB host galaxies and their interstellar medium (ISM) environments
(e.g. Modjaz et al. 2008, Savaglio et al. 2009) have been limited by the available data.
Typically, observations of LGRB host galaxies are obtained on a case-by-case basis, using
6

instruments with varying sensitivities and resolutions. These galaxies are sometimes
observed only shortly after the LGRB, when the host spectrum is still contaminated by an
optical afterglow or supernova contribution. Most observations have been undertaken with
the primary goal of obtaining a host redshift, or occasionally constraining star formation
rates and metallicities, and often don’t have sufficient S/N or wavelength coverage to be
used in detailed ISM studies.
A detailed study of the ISM environments and stellar populations present in LGRB
host galaxies requires a uniform, deep, and high-quality (S/N ∼> 20) spectroscopic survey
covering a rest-frame optical wavelength range that encompasses the key emission features
employed in ISM diagnostics. For my thesis, I have conducted such a survey, consisting of
12 LGRB host galaxies with optically-confirmed coordinates and spectroscopic redshifts of
0 < z < 1. Chapter 2 discusses these LGRB host observations in detail, and outlines the
techniques that were employed to determine key ISM properties such as:
Metallicity: Here the metallicity of a galaxy is measured according to the abundance of
oxygen present in the nebula relative to hydrogen, as determined from the [OII] and [OIII]
emission features in the galaxy spectra. This is generally expressed as the value of log(O/H)
+ 12, where solar metallicity is log(O/H) + 12 = 8.69 following Asplund et al. (2005). The
metallicity of a galaxy can also be depicted as a fraction of solar metallicity, Z, or as the
metal fraction of a galaxy’s total composition, z (where solar metallicity corresponds to a
2% composition made up of elements beyond hydrogen and helium, and therefore z(solar)
= 0.02).
Ionization parameter: Ionization parameter, q, is defined here in cm s−1 as the maximum
velocity possible for an ionization front being driven by the local radiation field in a galaxy.
Ionization parameter can also be represented by the dimensionless parameter U , where
U ≡ q/c and c = 3× 1010 cm s−1.
Extinction: For this work, extinction is defined as the total reddening due to interstellar
dust in the direction of the galaxy. Extinction can be measured by calculating the excess
flux present in B − V color, E(B − V ), based on the observed flux ratios of the Balmer
7

emission line series. Here we assume a Cardelli et al. (1989) reddening law, with a standard
total-to-selective extinction ratio in the V band of RV = 3.1.
Young stellar population age: From the equivalent widths of the Hβ emission features
of our galaxy spectra, we can estimate the age of the youngest, most recently formed stellar
population present in the galaxy. In star-forming galaxies this population is expected to
dominate the stellar contribution to the ionizing radiation field due to its population of hot
massive OB stars.
Star formation rate: The rate at which a galaxy is forming new stars can be calculated
based on the fluxes of emission features in LGRB host spectra such as Hα or [OII] λ3727,
which scale with the total ionizing flux of newly-formed stars in the ionization nebulae of
star-forming galaxies and HII regions.
Stellar mass: The portion of the mass in a galaxy that is contained in stars (as opposed
to gas or dark matter) can be estimated using multiband photometry of a galaxy and
fitting with stellar population synthesis models. These models include assumptions about
the galaxy’s initial mass function (IMF), star formation history, and age.
With these parameters in hand, the LGRB host galaxies can be compared to the general
star-forming galaxy population. By splitting the LGRB host galaxies into nearby (z < 0.3)
and intermediate-redshift (0.3 < z < 1) samples, I can compare the hosts to star-forming
galaxies from surveys at comparable redshift ranges, investigating whether LGRBs occur
preferentially in galaxies with lower metallicities and whether such a trend may be driven
by other ISM properties such as young stellar population age. Smaller samples of unique
galaxies, such as host galaxies of Type Ic SNe without accompanying LGRBs, are also a
source of interest. Differences in ISM properties between LGRB host galaxies and these
comparison samples could shed light on the precise environments that must be present in
order for LGRB progenitors to form.
Metallicity and stellar mass in particular will be key parameters in this study. Previous
studies have noted that LGRB host galaxies fall below the standard L-Z relation for star-
forming galaxies (e.g. Stanek et al. 2006, Kewley et al. 2007, Modjaz et al. 2008; see
8

Figure 1.1). However, the M-Z relation is cited as the fundamental property that drives
the observed L-Z relation (while luminosity is often adopted as a proxy for stellar mass, a
galaxy’s luminosity is also extremely dependent on star formation rate and star formation
history as well as metallicity). The M-Z relation for nearby galaxies may be attributable to
the larger neutral gas fractions and more efficient stripping of heavy elements by galactic
winds in lower-mass galaxies (McGaugh & de Blok 1997, Bell & de Jong 2000, Boselli et al.
2001, Garnett 2002, Tremonti et al. 2004), though this process may not be the dominant
effect driving the M-Z relation at higher redshifts (see Zahid et al. 2010).
Work on the M-Z relation dates back to Lequeux et al. (1979), who found a positive
correlation between mass and metallicity that agreed with model predictions for six nearby
irregular galaxies. More recently, Tremonti et al. (2004) derived the M-Z relation for
∼53,000 nearby (z < 0.3) star-forming galaxies from the Sloan Digital Sky Survey. Savaglio
et al. (2005) found that this correlation extended to higher redshifts, based on observations of
galaxies from the Gemini Deep Deep Survey (GDDS; Abraham et al. 2004) at 0.4 < z < 1.
Erb et al. (2006) measured a monotonic M-Z relation for galaxies at a mean redshift of
z ∼ 2, and found that this relation was offset from the local M-Z relation by ∼0.3 dex, with
galaxies of a given mass having lower metallicities at higher redshifts.
Previous studies of the M-Z relation in LGRB host galaxies have been limited by small
sample sizes and poorly-constrained host ISM properties (e.g. Castro Ceron et al. 2006,
Savaglio et al. 2009, Han et al. 2010). However, a comparison between LGRB host galaxies
and the general star-forming galaxy population on the M-Z relation is key to determining
whether these events show a trend towards low-metallicity galaxies. Chapter 3 presents
a comparison of the LGRB host sample to a variety of star-forming galaxy samples. This
includes a new M-Z relation for LGRBs, as well as an examination of the L-Z relation,
specific ISM properties as compared to the general star-forming galaxy samples, and the
observed emission line diagnostic ratios in the galaxy samples. The ISM properties are also
compared to the gamma-ray energy release for the LGRBs in this sample, investigating
9
whether or not a direct correlation exists between the natal environments of the progenitors
and the explosive properties of the bursts.
One goal of the LGRB host galaxy survey is to construct a detailed profile of the
ISM environments that produce “typical” LGRBs. With this information in hand, the
host galaxies of “atypical” GRBs or similar core-collapse events could potentially offer
important clues for understanding phenomena which may pose a challenge to our current
progenitor models and classification scheme for LGRBs. During the course of this work,
three such events have been serendipitously included in this research. Chapter 4 examines
each of these cases in detail, and considers the importance of host environment studies in
understanding the origins of these unusual explosive events.
1.2 Modeling of Star-Forming Galaxies
Synthetic galaxy spectra are valuable tools for studying the ISM properties and stellar
populations of galaxies. Stellar population synthesis codes, such as Starburst99 (Leitherer
et al. 1999, Vazquez & Leitherer 2005), Pegase (Fioc & Rocca-Volmerange 1997), and the
models of Bruzual & Charlot (2003) and Gonzalez Delgado et al. (1999, 2005), are used to
generate synthetic continuum spectra for galaxies, which in turn can be applied to observed
galaxy spectra for determining starburst age, metallicity, and stellar mass. Models such
as these assume several key initial parameters, including IMF, star formation rate, and
star formation history. These models also adopt detailed stellar evolutionary models and
synthetic stellar atmospheres, and generate a final synthetic galaxy spectrum by using
evolution synthesis or isochrone synthesis techniques to interpolate between stellar masses.
In addition to modeling the continuous spectrum of a star-forming galaxy, it is also
beneficial to generate synthetic emission line spectra. The emission spectrum of a star-
forming galaxy can be used to constrain physical parameters for the galaxy’s ionized gas,
interstellar medium, and total star formation rate. Stellar population synthesis models
generate a synthetic ionizing radiation field in the ultraviolet regime, which can be used as
10

input by a photoionization model such as Mappings III (Binette et al. 1985, Sutherland
& Dopita 1993) or Cloudy (Ferland et al. 1998). By adopting a synthetic ionization
spectrum and assuming a specific geometry, electron density, and ionization parameter
for the nebula, these models generate a synthetic emission spectrum. Combined, stellar
population synthesis and photoionization models are capable of producing detailed model
galaxy spectra, which can be compared directly to spectrophotometric observations of star-
forming galaxies and used to generate extensive model grids spanning a wide range of free
parameters.
A number of model studies have made progress in recent years towards reproducing
the optical emission line ratios seen in observed galaxy spectra (e.g., Kewley et al. 2001,
Fernandes et al. 2003, Dopita et al. 2006, Martin-Manjon et al. 2008). However, these
models have also highlighted several shortcomings in current stellar population synthesis and
photoionization codes. Kewley et al. (2001) find that the ionizing spectra produced by the
Starburst99 stellar population synthesis code of Leitherer et al. (1999) are not hard enough
in the far ultraviolet to reproduce the emission line ratios of nearby star-forming galaxies,
leading to deficiencies in the fluxes of emission features with higher ionization potentials.
Similarly, past work has found that reproducing the emission features observed in low-
metallicity galaxies is a challenge to current photoinization codes. These difficulties have
been attributed to shortcomings in various components of the model codes, such as metal
opacities in stellar atmosphere models, treatments of dust, and mass loss approximations
in stellar evolutionary tracks.
Modeling LGRB host galaxies, which may have low metallicities, requires a new suite
of stellar population synthesis and photoionization models that are specifically tailored
towards addressing the problems highlighted in past work. For this work I have generated
a new grid of models, using the new Starburst99 stellar population synthesis code (Vazquez
& Leitherer 2005) and the latest generation of the Mappings III code (Groves et al. 2004).
Improvements in these models include non-LTE treatments of metal opacities in the stellar
atmosphere models (Hillier & Miller 1998, Pauldrach et al. 2001), a more sophisticated
11

treatment of dust effects in the photoionization modeling, and the first investigation of
how mass loss assumptions in the stellar evolutionary tracks affect the ionizing spectra and
emission line fluxes. Chapter 5 details past work in this area along with the goals, design,
and results of these new model grids. The new model grids are compared to star-forming
galaxy samples as well as the LGRB host galaxy spectra.
1.3 Massive Stellar Evolutionary Theory
Our current understanding of massive stellar evolutionary theory highlights the complexities
of LGRB progenitor models. The most commonly-proposed progenitors for LGRBs are
thought to be unusual rapidly-rotating Wolf-Rayet (WR) stars that have never evolved
through the red supergiant (RSG) stage, a high-mass-loss phase expected to severely
decrease these stars’ angular momentum (e.g., Hirschi et al. 2005, Yoon et al. 2006, Langer
& Norman 2006, Woosley & Heger 2006). It is also theorized that WR progenitors of
LGRBs are of the evolved carbon-rich (WC) or even oxygen-rich (WO) subtype rather than
the nitrogen-rich (WN) subtype (e.g. Woosley & Bloom 2006).
The mass loss rates of these stars are dependent on their stellar winds (Vink & de Koter
2005). Stellar winds in turn are driven by radiation pressure at the stellar surface; the
high luminosities of massive stars generate momentum transfer from the radiation field to
the gas through absorption of photons in spectral lines, particularly the resonance lines
of highly ionized metals (Abbott 1982, Massey 2003). As a result, a massive star’s wind-
driven mass loss is heavily dependent on its surface metallicity (Kudritzki 2002). Vink et
al. (2001), who consider the important fact that terminal velocity is weakly dependent on
metallicity (v∞ ∝ Z0.13; Leitherer et al. 1992), determine a mass loss-metallicity relation of
Mw ∝ Z0.7. As a result, surface velocities are higher for WR stars at low metallicities, a
consequence of the lower mass loss rate and a potentially important property of collapsars
(Kudritzki & Puls 2000, Meynet & Maeder 2005). These surface velocities in turn generate
a rotation-driven mass loss component (Meynet & Maeder 2000).
12
Some mass loss in LGRB progenitors is clearly required - the association of broad-lined
Type Ic SNe with LGRBs implies that the progenitors must undergo a level of mass loss
sufficient to shed their H and He envelopes prior to core-collapse. Recent progress has been
made in satisfying these complicated collapsar parameters. Models of late-type massive
stars in low-metallicity environments have managed to sustain high rates of rotation while
still shedding their hydrogen envelopes (Yoon, Langer, & Norman 2006, Woosley & Heger
2006). RSGs in low-metallicity galaxies are found to exhibit unique physical instabilities
and episodes of high mass loss that can be associated with the evolutionary limitations of
their environment (Levesque et al. 2007), offering observational evidence of the extreme
effect that low-metallicity environments are expected to have on the later phases of stellar
evolution (see also Leitherer 2008). Combined, these arguments present compelling evidence
that a low-metallicity environment may help massive stars evolve into LGRB progenitors.
However, the WR progenitor model and its association with low-metallicity LGRB host
galaxies is paradoxical when considering current observations of massive stellar populations
at low metallicities. The WR/RSG ratio is actually found to decrease strongly as a function
of decreasing metallicity in Local Group galaxies, with WR stars becoming rare in low-
metallicity Local Group galaxies such as the Small Magellanic Cloud and NGC 6822 (Massey
2003). Furthermore, the ratio of WC/WN stars also decreases with metallicity; WC stars in
particular are found to be very rare in low-metallicity environments (Massey 2003, Eldridge
& Vink 2006). It is unclear how this observed metallicity effect on the WR star population
statistically impacts current LGRB progenitor models and host studies. Current stellar
evolutionary tracks are also at odds with the observed WR/RSG and WC/WN ratios. These
tracks are critical in stellar population synthesis models, and also provide an important
litmus test for how our current understanding of stellar evolution compares to observational
data. Poor agreement between the tracks and observed populations illustrates that our
understanding of massive stellar evolution, particularly at low metallicities, is still limited.
For evolved massive stars in particular, mass loss remains a poorly understood and vital
13

component of these stars’ lifetimes, and a critical phase in the evolution of LGRB progenitors
under the assumptions of the collapsar model.
RSGs are a key mass loss phase in the lifetimes of moderately massive (∼ 10-25M)
stars. While current models do not predict that these stars will produce LGRB progenitors,
they are expected to dominate the evolved massive star population in low-metallicity star-
forming galaxies (Massey 2003). RSGs are also expected to be the main producers of
dust in galaxies with young stellar populations at large look-back times, a sample which
is expected to include LGRB hosts (Massey et al. 2005). Finally, RSGs have shown
evidence of unusual variability and sporadic mass loss behaviors in low-metallicity galaxies
(Levesque et al. 2007, Massey et al. 2007), offering potentially valuable insight into the
effects that low-metallicity natal environments will have on massive stellar evolution and
mass loss. An improved understanding of the physical properties, variability, and mass loss
of RSGs at low metallicities would be extremely valuable to our ongoing studies of LGRB
host environments, attempts at modeling the stellar populations in these galaxies, and
probing the evolutionary effects and mass loss processes that may influence the formation
of LGRB progenitors. Chapter 6 presents an overview of recent work studying the
effects of metallicity on RSGs, and details work that is currently underway to examine
the physical properties of RSGs in the low-metallicity Local Group galaxies NGC 6822 and
Wolf-Lundmark-Melotte (WLM).
In the final chapter of this thesis, Chapter 7, I summarize the results of the previous
chapters and evaluate the impact that this work has had on the questions presented above. I
also considering the new questions and potential future endeavors that have been highlighted
by this research.
Throughout this work we assume a cosmology of H0 = 70 km s−1 Mpc−1, Ωm = 0.3,
and ΩΛ = 0.7.
14

Chapter 2
LGRB Host Galaxies - Observations and Analyses
2.1 The Nearby LGRB Host Galaxy Survey
We have conducted a uniform rest-frame optical spectroscopic survey of 12 LGRB host
galaxies using the Keck telescopes at Mauna Kea Observatory and the Magellan telescopes
at Las Campanas Observatory. The sample included in this survey was compiled from the
GRB Host Studies (GHostS) database (Savaglio et al. 2006) and the GRB Coordinates
Network maintained by NASA. We restricted our sample to confirmed host galaxies of
long-duration (> 2 s) GRBs with redshifts of z < 1 and BV R magnitudes of ∼< 24,
allowing us to obtain rest-frame optical spectra from 3000-7000A using optical and near-
infrared observations of ≤3 hours per host. This spectral range was focused on the key
diagnostic emission lines required for our ISM analyses, including: [OII]λ3727, [OIII]λ4363,
[OIII]λλ4959, 5007, [NII]λ6584, [SII]λ6717,6731, and the hydrogen Balmer series.These lines
can be used to determine extinctions, metallicities, young stellar population ages, and star
formation rates for the LGRB host galaxies in our sample.
2.1.1 Keck: GRBs 980703, 991208, 010921, 020819, 020903, 031203,
030329, 051022, 060218, and 070612A
Ten LGRB host galaxy spectra were obtained using the Low-Resolution Imaging
Spectrograph (LRIS; Oke et al. 1995) and the Near Infrared Spectrograph (NIRSPEC;
15

McLean et al. 1998) on the Keck telescopes at Mauna Kea. We observed all ten of these
host galaxies in the rest-frame optical using LRIS, and obtained additional observations of
GRB 991208 and GRB 070612A using NIRSPEC to detect the Hα and [NII] λ6584 emission
features shifted into the near-infrared.
For the LRIS observations, we used the long 1” slitmask for our observations. To
calibrate the observations we obtained internal flat fields and comparison lamp spectra
with the standard Hg, Ne, Ar, Cd, and Zn lamp setup available at LRIS. We flux-calibrated
the host spectra using contemporaneous observations of spectrophotometric standards. The
dates and details of our observations are given in Table 2.1 In most of these cases, the host
galaxies were quite dim (V ∼ 20 to 24 mag). In order to ensure that we successfully acquired
these host galaxies in the slit, we first centered on a nearby bright star. We then rotated
the slit to the position angle that would place both the bright star and the host galaxy on
the slit, and nodded along the slit to ensure that we observed spectra of both objects. This
approach also allowed the bright spectrum to be used as a trace when extracting the dim
host spectrum during data reduction. As a result of this method, we did not observe the
host galaxies at the parallactic angle.
The host galaxies of GRB 010921 (z = 0.451) and GRB 0208191 (z = 0.410) were
observed twice with LRIS during this work. Original observations in the rest-frame 3000A -
6000A regime were acquired in November of 2008. We also obtained additional observations
in November of 2009 using the newly updated red side of the LRIS detector, which offered
improved sensitivity in the >9500A regime and made it possible for us to observe the key
diagnostic emission features Hα and [NII] λ6584 (for which we determine an upper limit) at
the host redshifts. For more detailed discussion regarding our observations of the unusual
GRB 020819 host galaxy, see 4.1.1.
For our NIRSPEC observations of GRB 991208 and 070612A, we used the 42”×0.76”
slit with the low-resolution grating. We observed internal flatfields and darks for calibration
purposes. The host of GRB 991208 was observed using the NIRSPEC-2 filter in six 9001While this burst is commonly referred to in the literature as GRB 020819, it is officially designated as
GRB 020819B, following the IPN detection of GRB 020819A ∼7 hours earlier on 19 Aug 2002.
16
Tab
le2.
1.K
eck
LR
ISO
bser
ving
Set-
ups
Host
Gala
xy
α2000
δ 2000
Date
(UT
)D
ich
roic
Gri
smG
rati
ng
λc
(A)
Exp
osu
reT
ime
GR
B980703
23
59
06.7
2+
08
35
07.0
818
Nov
2009
560
···
400/8500
8500
1800×
6G
RB
991208
16
33
53.5
2+
46
27
20.8
831
May
2008
560
600/4000
600/7500
7400
1800×
5G
RB
010921
22
56
00.0
0+
40
55
52.3
12
Nov
2008
680
300/5000
400/8500
8100
1800×
4···
···
···
19
Nov
2009
680
300/5000
400/8500
8100
1800×
4G
RB
020819a
23
27
19.4
4+
06
15
55.8
02
Nov
2008
680
300/5000
400/8500
8100
1800×
4···
b···
···
19
Nov
2009
680
300/5000
400/8500
8100
1800×
5G
RB
020903
22
48
42.2
3−
20
46
09.1
27
Oct
2003
560
400/3400
400/8500
7650
900×
2G
RB
031203
08
02
29.0
3−
39
51
11.8
719
Dec
2003
560
400/3400
400/8500
7700
900×
2G
RB
030329
10
44
50.0
0+
21
31
17.7
625
Ap
r2009
560
600/4000
600/7500
6800
1800×
3G
RB
051022
23
56
04.1
0+
19
35
24.0
02
Nov
2008
560
···
400/8500
8100
1800×
6G
RB
060218
03
21
39.6
7+
16
52
01.5
67
Sep
2007
560
600/4000
900/5500
6200
1800×
3G
RB
070612A
08
05
29.6
1+
37
16
15.2
018
Nov
2009
560
···
400/8500
7000
1800×
6
aO
bse
rvin
gse
t-u
pce
nte
red
on
the
host
nu
cleu
s.
bO
bse
rvin
gse
t-u
pce
nte
red
on
the
host
exp
losi
on
site
.
17

s exposures. GRB 070612A was observed using the NIRSPEC-1 filter in a single 900 s
exposure with one coadd. The host is sufficiently bright (R ∼ 21.4, D’Avanzo et al. 2007)
that we could center on it directly, rather than employing the technique described above
for observing faint objects with LRIS using nearby bright stars placed on the slit. For both
of these hosts we detect the Hα emission feature and place an upper limit on the relative
flux of the [NII]λ6584 emission line.
2.1.2 Magellan: GRB 020405 and GRB 050826
The host galaxies of GRB 050826 and GRB 020405 were observed using LDSS3 mounted
on the Clay 6.5m Magellan telescope at Las Campanas Observatory. The host galaxy of
GRB 050826 was observed twice, on 6 January 2006 and 14 January 2008. Two 1800 second
exposures of the host galaxy were taken in 2006, using the VPH-Red grism and an OG590
blocking filter and including strong detections of the Hα, [NII]λ6584, and [SII]λλ6717,6731
emission features. An additional two 1800 second exposures were taken of the host in 2008,
using the VPH-All grism and a 1” slit to include full spectral coverage from the Hα feature
down to the [OII]λ3727 features. The observations were taken at the parallactic angle. The
GRB 020405 host was observed on 2008 Jan 15 for a total of 4500 s, using the VPH-Red
grism with an OG590 order blocking filter and a 1” slit. Internal flatfields, along with
lamp spectra of He, Ne, and Ar, were observed for calibration purposes. Contemporaneous
observations of spectrophotometric standards were used for flux calibration.
2.1.3 Published LGRB Host Spectra: GRB 980425, GRB 990712, GRB
030528, and GRB 050824
In addition to the 12 LGRB host galaxies included in our observational survey, we have
included 4 LGRB host galaxies in our sample - the host galaxies of GRB 980425, GRB
990712, GRB 030528, and GRB 050824 - with high-quality spectroscopic data and emission-
line fluxes available in the current literature. Christensen et al. (2008) obtained integral
field spectroscopy of the host of GRB 980425 in April and May 2006 using VIMOS at the
18

VLT; we adopt their published fluxes corrected for extinction. Kupcu Yoldas et al. (2006)
obtained spectra of the GRB 990712 host galaxy for ∼6 years after the burst, scrutinizing
how the fluxes of several strong emission lines varied with time. We adopt emission line
fluxes from their spectrum observed on 2005 July 5-6 with FORS2 at the VLT. Rau et
al. (2005) observed the host of GRB 030528 using the Focal Reducer and low-dispersion
Spectrograph 2 (FORS2) at the 8.2m Very Large Telescope (VLT) on 12 April 2005 and 6
May 2005. Sollerman et al. (2007) observed the afterglow and host of GRB 050824 using
FORS2 at the VLT on 26-27 August 2005; the afterglow contribution to the emission line
fluxes observed in this host is assumed to be negligible. For both of these observations, we
adopt the published fluxes, uncorrected for extinction.
2.1.4 Data Reduction
We reduced and analyzed the LGRB host galaxy data from Keck and Magellan using
IRAF2. For the LRIS observations, we used the lrisbias IRAF task distributed by the W.
M. Keck Observatories to subtract overscan from the LRIS images, and applied a flatfield
correction based on the internal lamp flats. The spectra were extracted using an optimal
extraction algorithm, with deviant pixels identified and rejected based upon the assumption
of a smoothly varying profile. For the dimmest host galaxies, we used the spectrum of a
nearby bright star placed on the slit during observations to determine a trace for extraction.
Wavelength calibration was performed based on our comparison lamp observations, and
flux calibration was based on our observations of spectrophotometric standards. In most
cases, emission line fluxes were determined using the IRAF task splot in the kpnoslit
package to fit Gaussians to the line profiles. In cases where the emission lines were found
to have asymmetric shapes (GRB 991208, GRB 030329, GRB 060218; see the Appendix
for discussion), the fluxes were determined by fitting the lines with the sum of multiple
Gaussians, using the IRAF task ngaussfit in the stsdas.analysis.fitting package.
2IRAF is distributed by NOAO, which is operated by AURA, Inc., under cooperative agreement withthe NSF.
19
To reduce the NIRSPEC data, we used the wmkonspec data reduction package
distributed by the W. M. Keck Observatories. We used the xdistcor, ydistcor, and
mktracer IRAF tasks to correct for x- and y-axis distortion in the observed spectrum. The
spectra were extracted using the same algorithm applied to the LRIS data; in addition, a
sky spectrum was extracted, and we used the skyplot task in the wmkonspec package to
generate a comparison spectrum that could be used in conjunction with the extracted sky
spectrum for wavelength calibration.
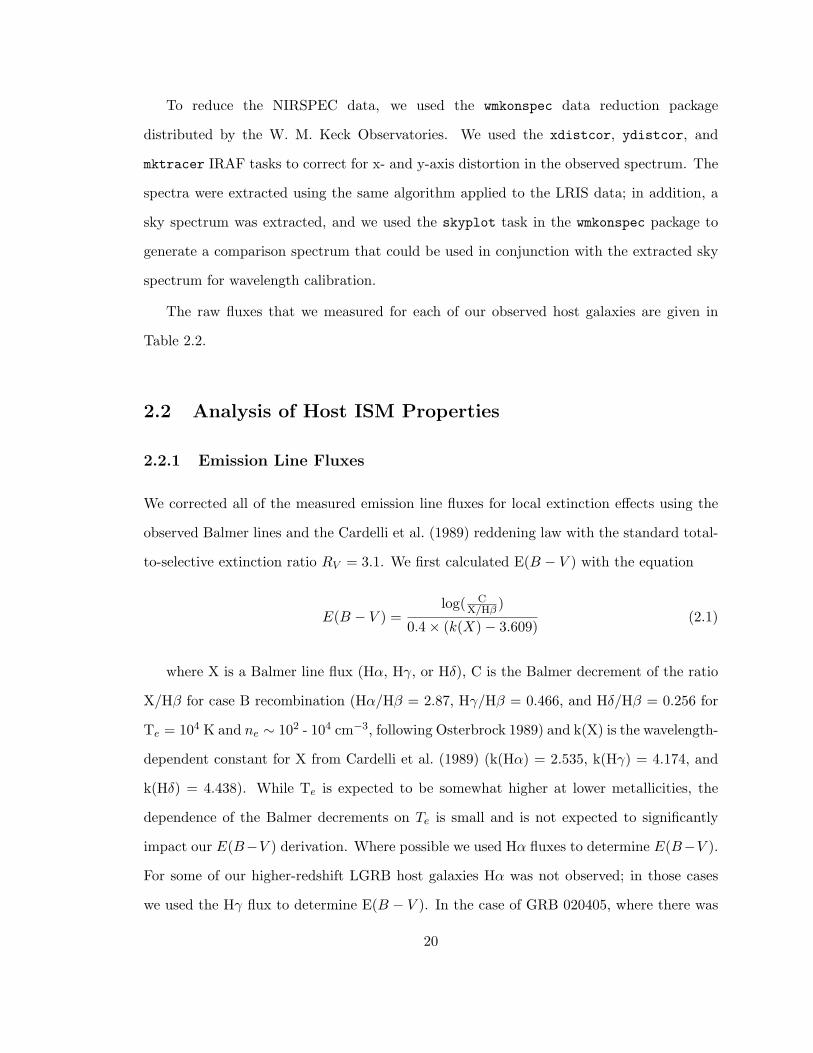
The raw fluxes that we measured for each of our observed host galaxies are given in
Table 2.2.
2.2 Analysis of Host ISM Properties
2.2.1 Emission Line Fluxes
We corrected all of the measured emission line fluxes for local extinction effects using the
observed Balmer lines and the Cardelli et al. (1989) reddening law with the standard total-
to-selective extinction ratio RV = 3.1. We first calculated E(B − V ) with the equation
E(B − V ) =log( C
X/Hβ )
0.4× (k(X)− 3.609)(2.1)
where X is a Balmer line flux (Hα, Hγ, or Hδ), C is the Balmer decrement of the ratio
X/Hβ for case B recombination (Hα/Hβ = 2.87, Hγ/Hβ = 0.466, and Hδ/Hβ = 0.256 for
Te = 104 K and ne ∼ 102 - 104 cm−3, following Osterbrock 1989) and k(X) is the wavelength-
dependent constant for X from Cardelli et al. (1989) (k(Hα) = 2.535, k(Hγ) = 4.174, and
k(Hδ) = 4.438). While Te is expected to be somewhat higher at lower metallicities, the
dependence of the Balmer decrements on Te is small and is not expected to significantly
impact our E(B−V ) derivation. Where possible we used Hα fluxes to determine E(B−V ).
For some of our higher-redshift LGRB host galaxies Hα was not observed; in those cases
we used the Hγ flux to determine E(B − V ). In the case of GRB 020405, where there was
20

no detection of Hγ, we used the Hδ flux. Once E(B − V ) was determined for a galaxy, the
observed emission line fluxes were then dereddened using the ccm unred function in
21

Tab
le2.
2.D
iagn
osti
cE
mis
sion
-Lin
eF
luxe
sof
LG
RB
Hos
tsa
Host
Gala
xy
[OII
][N
eII
I]Hδ
Hγ
[OII
I]Hβ
[OII
I][O
III]
Hα
[NII
][S
II]
[SII
]3727A
3869A
4101A
4340A
4363A
4861A
4959A
5007A
6563A
6584A
6717A
6731A
GR
B980703
5.7
2···
···
1.0
9···
1.7
31.6
04.8
2···
···
···
···
GR
B991208
0.4
40.0
70.0
60.1
2···
0.3
40.2
40.5
71b
0.0
5b
···
···
GR
B010921
2.7
40.4
70.9
8···
···
0.8
80.6
02.0
61b
<0.0
4b
···
···
GR
B020405
2.0
90.3
10.2
1···
···
0.7
40.8
42.7
7···
···
···
···
GR
B020819
2.4
1···
···
···
···
1.6
6···
0.8
69.6
24.1
0···
···
···
0.9
2···
···
···
···
···
···
···
4.1
41.5
1···
···
GR
B020903
3.3
50.8
30.5
21.0
9···
4.8
48.3
222.5
11.4
0.3
0<
0.3
2<
0.5
9G
RB
031203
0.3
70.2
10.1
50.3
40.1
11.5
73.8
212.1
14.3
1.0
10.8
50.6
7G
RB
030329
5.9
51.2
20.6
20.8
80.3
34.4
55.4
416.9
14.5
0.2
8<
0.4
4<
0.4
9G
RB
050826
1.3
6···
···
···
···
1.5
01.1
62.6
01b
0.1
7b
0.1
6b
0.1
0b
GR
B051022
20.9
1.6
71.6
23.0
9···
8.6
29.0
221.4
···
···
···
···
GR
B060218
8.5
21.6
21.1
62.0
00.4
14.2
45.8
214.4
12.3
0.3
71.1
20.6
6G
RB
070612A
7.3
1···
···
1.1
2···
3.3
6···
3.7
81b
<0.0
1b
···
···
aR
aw
mea
sure
dfl
uxes
inu
nit
sof
10−
16
ergs
cm2
s−1
A−
1
bR
elati
ve
flu
x,
norm
alize
dto
Hα
.
22
IDL. We used these extinction-corrected emission line fluxes to determine ISM properties
for these galaxies. These values are all given in Table 2.3.
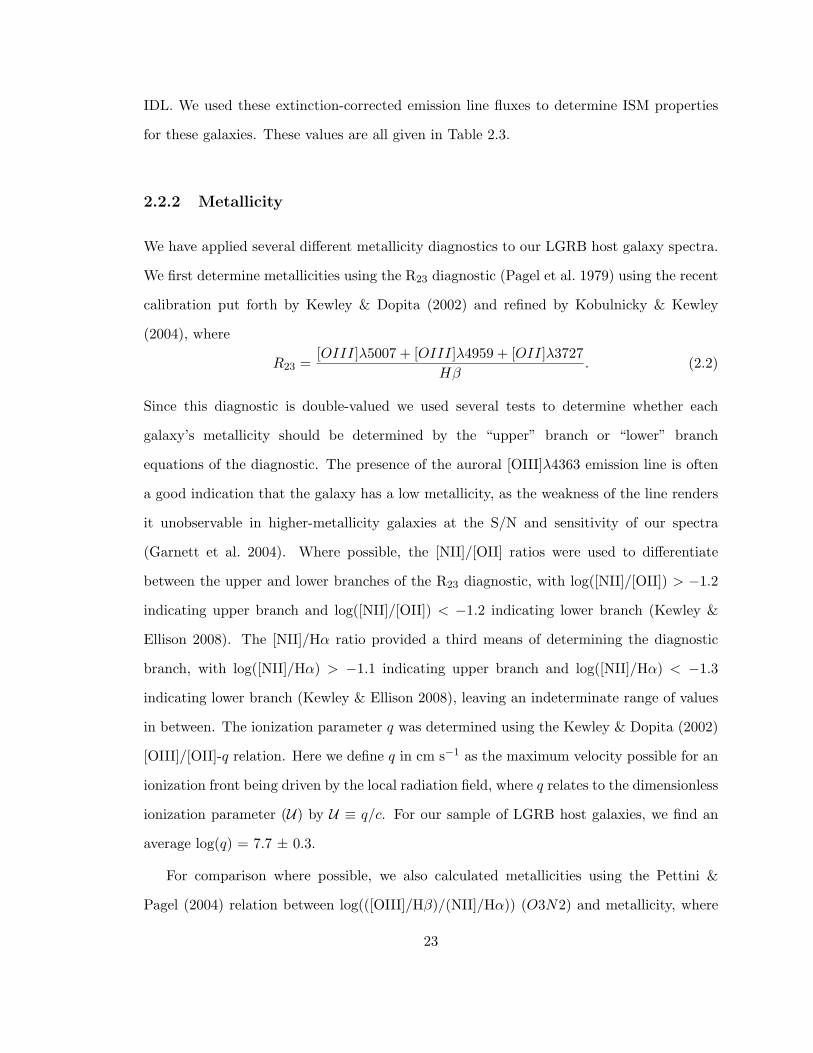
2.2.2 Metallicity
We have applied several different metallicity diagnostics to our LGRB host galaxy spectra.
We first determine metallicities using the R23 diagnostic (Pagel et al. 1979) using the recent
calibration put forth by Kewley & Dopita (2002) and refined by Kobulnicky & Kewley
(2004), where
R23 =[OIII]λ5007 + [OIII]λ4959 + [OII]λ3727
Hβ. (2.2)
Since this diagnostic is double-valued we used several tests to determine whether each
galaxy’s metallicity should be determined by the “upper” branch or “lower” branch
equations of the diagnostic. The presence of the auroral [OIII]λ4363 emission line is often
a good indication that the galaxy has a low metallicity, as the weakness of the line renders
it unobservable in higher-metallicity galaxies at the S/N and sensitivity of our spectra
(Garnett et al. 2004). Where possible, the [NII]/[OII] ratios were used to differentiate
between the upper and lower branches of the R23 diagnostic, with log([NII]/[OII]) > −1.2
indicating upper branch and log([NII]/[OII]) < −1.2 indicating lower branch (Kewley &
Ellison 2008). The [NII]/Hα ratio provided a third means of determining the diagnostic
branch, with log([NII]/Hα) > −1.1 indicating upper branch and log([NII]/Hα) < −1.3
indicating lower branch (Kewley & Ellison 2008), leaving an indeterminate range of values
in between. The ionization parameter q was determined using the Kewley & Dopita (2002)
[OIII]/[OII]-q relation. Here we define q in cm s−1 as the maximum velocity possible for an
ionization front being driven by the local radiation field, where q relates to the dimensionless
ionization parameter (U) by U ≡ q/c. For our sample of LGRB host galaxies, we find an
average log(q) = 7.7 ± 0.3.
For comparison where possible, we also calculated metallicities using the Pettini &
Pagel (2004) relation between log(([OIII]/Hβ)/(NII]/Hα)) (O3N2) and metallicity, where
23

12 + log(O/H) = 8.73 − 0.32 × O3N2. We applied this relation for all galaxies whose
spectra included [NII] line fluxes. This method, based on a calibration of nebular HII
region metallicities, is known to yield systematically lower metallicities than theoretical
methods based on photoionization models (see Kewley & Ellison 2008).
Finally, for three of our LGRB hosts (GRBs 030329, 031203, and 060218) we detected
the auroral [OIII] λ4363 emission line. The presence of [OIII]λ4363 allowed us to calculate
the electron temperature (Te) metallicities for these three hosts (in addition to metallicities
based on the R23 and O3N2 strong line methods). Higher chemical abundances increase
the rate of nebular cooling in galaxies, lowering temperatures in HII regions. As a result,
the oxygen abundance (and therefore an estimate of Te) can be measured from the ratio of
[OIII]λ4363 to lines with a lower excitation potential, such as [OIII]λ5007 and [OIII]λ4959.
This yields Te(O++), which we used to calculate Te(O+) by the relation Te(O+) = 0.7Te(O+)
+0.3 from Stasinska (1980), with Te in units of 10,000 K.
Electron density (ne) was estimated from the ratio of the [SII]λ6717/[SII]λ6731 doublet
lines, and Te was estimated from the [OIII]λ4363/([OIII]λ5007+[OIII]λ4959) ratio. With
these ratios, we determined values for ne and Te using the IRAF task temden in the
stsdas.analysis.nebular package. In the case of GRB 030329, we do not detect the
[SII] doublet; instead we calculate Te assuming electron densities of both 100 cm−3 and 200
cm−3 (in agreement with our other ne values) and find identical results, as Te is insensitive
to small changes in ne (Kewley et al. 2007). These parameters were used in equations for
the abundances of O++/H+ and O+/H+ (Shi, Kong, & Cheng 2006, Garnett 1992). Once
these abundances were determined the log(O/H) + 12 values could be calculated. It should
be noted that this method is known to yield systematically lower metallicities than those
determined from strong-line diagnostics (Kennicutt, Bresolin, & Garnett 2003; Kewley &
Ellison 2008).
Kewley & Ellison (2008) and Bresolin et al. (2009) both discuss the short-comings of
metallicity diagnostics based on the strong emission-line methods. Different diagnostic
calibrations can yield dramatically different metallicities from the same spectra and emission
24

line fluxes, up to ∼0.8 dex (Kewley & Ellison 2008). Bresolin et al. (2009) find that
Te metallicities are generally more robust than strong line methods when compared to
abundance studies of blue supergiants; however, restricting metallicity determinations in
our sample to only those galaxies with Te metallicities introduces a bias towards the lowest-
metallicity hosts due to the low [OIII]λ4363 fluxes at higher metallicities. However, we note
the shortcomings of the strong line methods and take care in our analyses to only compare
metallicities derived from the same calibration.
For our full sample of 16 z < 1 LGRB host galaxies we find an average Kobulnicky &
Kewley (2004) R23 metallicity of log(O/H) + 12 = 8.4 ± 0.3. For the eight host galaxies in
our sample with Pettini & Pagel (2004) metallicities, we find an average O3N2 metallicity
of log(O/H) + 12 = 8.3 ± 0.3. Finally, we find an average log(q) = 7.7 ± 0.3 for our LGRB
host galaxy sample.
During these analyses, we examined the z = 0.410 host environment of GRB 020819,
with an extremely high host metallicity of log(O/H) + 12 = 9.0 ± 0.1 (derived from the
[NII]/[OII] diagnostic of Kewley & Dopita 2002; for more discussion of this host see 4.1).
Subsequent work uncovered a second high-metallicity LGRB host galaxy, the z = 0.296
host of GRB 050826, with a metallicity of log(O/H) + 12 = 8.83 ± 0.1. These are the
first examples of LGRBs occurring in host galaxies with such high metallicities (another
galaxy in our sample, the host of GRB 051022, has also been cited as a moderately high-
metallicity LGRB host with an R23 metallicity of log(O/H) + 12 = 8.62 ± 0.1; for more
discussion see Graham et al. 2009). While it is true that several studies have measured
high metallicities in other LGRB host galaxies based on afterglow spectra (e.g. Watson et
al. 2006, Elıasdottir et al. 2009, Prochaska et al. 2009), the relationship between afterglow
absorption metallicities and emission-line metallicities has not yet been examined, and these
values may not be directly comparable.
Metallicities for the LGRB host galaxies are included in Table 2.3.
25

Tab
le2.
3.IS
MP
rope
rtie
sof
LG
RB
Hos
tG
alax
ies
Gala
xy
zlo
g(O
/H
)+
12a
log(q
)E
(B−V
)bWHβ
cA
ge
(Myr)
dMB
(mag)e
SF
R(M
/yr)
log
M∗
Te
R23
PP
04
(M
)
GR
B980425
0.0
09
···
∼8.4
08.2
8···
0.3
4···
∼5.0
f-1
7.6
0.5
79.2
2±
0.5
2G
RB
060218
0.0
34
7.6
28.2
18.0
77.7
10.0
133.2
5.7±
0.2
-15.9
0.0
38.3
7±
0.1
4G
RB
031203g
0.1
05
7.9
68.2
78.1
08.3
71.1
7103.9
4.7±
0.1
-21.0
4.8
8.2
6±
0.4
5
GR
B030329
0.1
68
7.7
28.1
38.0
07.8
00.1
359.6
4.9±
0.1
-16.5
1.2
7.9
1+
0.1
2−
0.4
4
GR
B020903
0.2
51
···
8.0
77.9
88.1
50.0
031.3
5.8±
0.2
-18.8
1.7
8.7
9+
0.1
9−
0.2
4
GR
B050826
0.2
96
···
8.8
3···
7.5
10.4
831.2
95.2±
0.6
-19.7
4.1
110.1
0+
0.2
2−
0.2
6
GR
B020819h
0.4
10
···
9.0
8.8
···
0.7
15.0
87.8±
0.9
···
23.6
10.6
5±
0.1
9G
RB
990712
0.4
34
···
∼8.4
0···
···
0.5
7···
···
-18.6
10.7
i9.1
5±
0.0
4
GR
B010921
0.4
51
···
8.2
4···
7.4
40.0
011.7
8.0±
0.2
-19.4
0.7
0i
9.5
6+
0.0
9−
0.1
1
GR
B070612A
0.6
71
···
8.2
9···
7.2
80.6
430.5
35.8±
0.2
···
81i
···
GR
B020405
0.6
91
···
8.3
3/8.5
9···
7.6
5/7.7
80.0
025.6
6.2±
0.2
/5.4±
0.3
···
1.6
1/2.0
5i
···
GR
B991208
0.7
06
···
8.0
2···
7.3
80.5
899.8
4.2±
0.2
-18.5
3.4
7i
8.8
5±
0.1
7
GR
B030528
0.7
82
···
∼8.4
0···
···
>0.4
6j
···
···
-20.5
3>
12.1
i9.1
1+
0.2
3−
0.2
6
GR
B051022
0.8
07
···
8.6
28.3
77.5
50.5
029.0
5.2±
0.3
-21.8
271i
10.4
2±
0.0
5G
RB
050824
0.8
28
···
∼8.4
0···
···
<0.1
6k
···
···
···
<0.9
41i
···
GR
B980703
0.9
66
···
8.3
1/8.6
5···
7.5
1/7.6
60.0
090.5
4.7±
0.1
/4.4±
0.2
-21.4
9.9
/13.6
i9.8
3±
0.1
3
aM
etallic
itie
shave
asy
stem
ati
cer
ror
of±
0.1
dex
du
eto
un
cert
ain
ties
inth
est
ron
glin
ed
iagn
ost
ics
(Kew
ley
&D
op
ita
2002).
bT
ota
lco
lor
exce
ssin
the
dir
ecti
on
of
the
gala
xy,
use
dto
corr
ect
for
the
effec
tsof
both
Gala
ctic
an
din
trin
sic
exti
nct
ion
.
cR
est-
fram
eeq
uiv
ale
nt
wid
ths.
dA
ges
com
efr
om
the
equ
ati
on
sd
eriv
edfo
rth
eS
chaer
er&
Vacc
a(1
998)
mod
els
rela
tin
gHβ
equ
ivale
nt
wid
ths
an
dgala
xy
ages
,ad
op
tin
gth
eR
23
met
allic
itie
s.
eMB
valu
esco
me
from
the
lite
ratu
reas
follow
s:H
am
mer
etal.
2006
(GR
B980425),
Ch
rist
ense
net
al.
2004
(GR
B980703,
GR
B990712,
GR
B991208,
GR
B010921),
Sod
erb
erg
etal.
2004
(GR
B020903),
Rau
etal.
2005
(GR
B030528),
Marg
utt
iet
al.
2007
(GR
B031203),
Goro
sab
elet
al.
2005
(GR
B030329),
Cast
ro-T
irad
oet
al.
2007
(GR
B051022),
Mir
ab
al
etal.
2007
(GR
B050826),
an
dW
iers
ema
etal.
2007
(GR
B060218).
fV
alu
efr
om
Ch
rist
ense
net
al.
(2008).
gS
ince
the
host
of
GR
B031203
isn
ot
class
ified
as
ap
ure
lyst
ar-
form
ing
gala
xy,
all
ISM
pro
per
ties
shou
ldb
eta
ken
as
ap
pro
xim
ate
,giv
enth
ep
ote
nti
al
un
kn
ow
nco
ntr
ibu
tion
of
AG
Nact
ivit
y.
hG
RB
020819
valu
esare
from
ob
serv
ati
on
sof
the
host
nu
cleu
s;fo
rm
ore
dis
cuss
ion
see
4.1
.
i SF
Rd
eter
min
edfr
om
the
[OII
]li
ne
flu
xan
dth
em
etallic
ity-d
epen
den
tre
lati
on
from
Kew
ley
etal.
(2004).
j Low
erlim
itfr
om
Rau
etal.
(2005).
j Up
per
lim
itfr
om
Soller
man
etal.
(2007).
26

2.2.3 Star Formation Rates
At present, the Hα emission feature is the most reliable optical tracer of the star formation
rate (SFR) in a galaxy, because Hα scales directly with the total ionizing flux of newly-
formed stars in the ionization nebulae of star-forming galaxies and HII regions (e.g.,
Kennicutt 1998, Kewley et al. 2004). However, for galaxies with z ∼> 0.5 the Hα line is
redshifted out of the optical regime, making it impractical as a SFR indicator. A popular
alternative for higher-redshift galaxies is the [OII] λλ3727,3729 doublet. However, this line
is strongly dependent on Te, and hence the chemical abundance of the galaxy, requiring that
relations between [OII] and SFR take metallicity into account. Considering this dependence,
Kewley et al. (2004) determined a metallicity-dependent SFR calibration for [OII].
We calculated Hα SFRs using the relation of Kennicutt (1998) where SFR(M/yr) =
(7.9 × 10−42) × L(Hα). When the Hα flux was not available, as was the case for many
of our LGRB host galaxies (9 out of 16), we instead used the metallicity-dependent SFR
relation for the [OII]λ3727 luminosities from Kewley et al. (2004). For some of our LGRB
host galaxies, we also determined Hα-based SFRs using the Hβ emission line flux, assuming
a Balmer decrement of 2.87 (Osterbrock 1989) to approximate the flux of the Hα line; these
SFRs are given in the Appendix. These Hβ-derived SFRs assume no contamination from
an underlying old stellar population. The SFRs for the host sample are included in Table
2.3.
From our sample, we have found that the SFRs for LGRB host galaxies span an
exceptionally wide range, from 0.03 M/yr for the host of GRB 060218 to the remarkably
high 271 M/yr for the host of GRB 051022 (the latter host may possibly be a merging
system; see Graham et al. 2009). The SFRs of these LGRB hosts are consistent with
galaxies undergoing active star formation.
2.2.4 Young Stellar Population Ages
We determined the young stellar population ages for the LGRB hosts using their rest-frame
values for the equivalent width of the Hβ emission line (WHβ). Copetti et al. (1986) find
27

that WHβ decreases nearly monotonically with the age of an HII region. This parameter is
largely independent of the electron temperature Te and electron density ne, but sensitive
to the IMF, stellar mass loss rate, and metallicity. However, WHβ is primarily dependent
on the evolution of the HII region, and as such is a strong indicator of the young stellar
population age.
Schaerer & Vacca (1998) use the Geneva HIGH evolutionary tracks in conjunction with a
series of theoretical stellar spectra (Schaerer et al. 1996a, 1996b; Schaerer & deKoter 1996;
Kurucz 1991; Schmutz et al. 1992) and observed Wolf-Rayet emission lines to construct
evolutionary synthesis models for young starburst galaxies. From these models they plot the
evolution of WHβ for the Geneva group metallicities (see Figure 7 of Schaerer & Vacca 1998).
Using these data, we derived equations that give a quantitative relation between WHβ and
young stellar population age for galaxies at each of the Geneva tracks’ metallicities (Z/Z
= 0.05, 0.20, 0.40, 1.00, and 2.00, where for these older tracks Z corresponds to log(O/H)
+ 12 = 8.93 from Anders & Grevesse 1989), with the hopes that they will be useful tools for
determining the young stellar population ages of starburst galaxies at various metallicities
in the future. The equations take the form:
log(Age) = A + BWHβ + CW2Hβ + DW3
Hβ + EW4Hβ
+FW5Hβ + GW6
Hβ + HW7Hβ + IW8
Hβ + JW9Hβ ±K, (2.3)
where the constants (A-J) and the error of the fit (K) are given in Table 2.4 for the
various metallicities. The high-order polynomial is necessary to preserve the fluctuating
contributions of the Wolf-Rayet-rich stellar evolutionary phase between ∼2 - 7 Myr;
additional discussion of stellar population contributions in an instantaneous burst star
formation history is given in Chapter 5.
It is important, however, to note the shortcomings of such a method. The progression of
WHβ with age necessitates the assumption of a zero-age instantaneous burst star formation
history (Copetti et al. 1986), since it decreases monotonically with the age of the burst
28
due to a decrease in ionizing photons and an increase in regional continuum luminosity.
While this assumption is robust across variations in the IMF (Stasinska & Leitherer 1996),
it also assumes complete absorption of the ionizing photons and uniform extinction across
nebular and stellar emission, both of which are not necessarily true. Finally, the stellar
model atmospheres adopted by Schaerer & Vacca (1998) are outdated and do not include
the effects of line blanketing.
For our sample of LGRB host galaxies, we find an average age of 5.6 ± 1.2 Myr, an age
which corresponds to the Wolf-Rayet evolutionary phase in young stellar populations (e.g.
Schaller et al. 1992; Schaerer et al. 1993a, 1993b; Charbonnel et al. 1993).
29

Tab
le2.
4.C
oeffi
cien
tsfo
rth
eSc
haer
er&
Vac
caA
ge-W
Hβ
Rel
atio
ns
Z(Z
=0.0
2)
AB
C(×
10−
4)
D(×
10−
6)
E(×
10−
8)
F(×
10−
11)
G(×
10−
13)
H(×
10−
16)
I(×
10−
19)
J(×
10−
22)
K
0.0
01
6.9
092
0.0
103
-4.2
885
5.3
862
-3.4
268
12.5
22
-2.7
352
3.5
244
-2.4
669
0.7
2156
0.0
160
0.0
04
7.0
507
-0.0
154
2.5
237
-2.0
683
0.8
8392
-2.0
336
0.2
3925
-0.1
1307
···
···
0.0
127
0.0
08
7.0
736
-0.0
293
9.1
706
-14.3
06
12.0
76
-59.3
74
17.5
12
-30.5
19
28.9
65
-11.5
40
0.0
209
0.0
20
6.9
548
-0.0
131
2.4
042
-2.5
412
1.4
763
-4.7
918
0.8
4861
-0.7
3986
0.2
2950
···
0.0
505
0.0
40
6.9
615
-0.0
172
4.8
163
-9.0
032
9.4
962
-57.9
44
20.9
48
-44.2
97
50.6
35
-24.1
75
0.0
417
30

2.2.5 Stellar Masses
We have estimated stellar masses for our LGRB host galaxies, and include them in Table
2.3. Using the Le Phare3 code developed by S. Arnouts & O. Ilbert, we fit multiband
photometry for the host galaxies, taken from Savaglio et al. (2009), to stellar population
synthesis models generated from the Bruzual & Charlot (2003) synthetic stellar templates
and the IMF of Chabrier (2003). For these mass determinations we adopt the extinction
law of Calzetti et al. (2000). This fitting yields a stellar mass probability distribution for
each galaxy, and we take the median of the distribution as an estimate of the final stellar
mass. For a more detailed discussion of how stellar mass is estimated using the Le Phare
code, see Ilbert et al. (2009). This differs from the method of determining stellar masses
described in Savaglio et al. (2009), who adopt different stellar population synthesis models
and simulate contributions from both old and young stellar populations (for more discussion
see Glazebrook et al. 2004). We find that our stellar mass determinations generally agree
with the values from Savaglio et al. (2009) to within the errors. For the complete sample
of LGRB host galaxies, we find a mean stellar mass of log(M?/M) = 9.25+0.19−0.23.
2.2.6 AGN Activity in the Host of GRB 031203
During our emission line analyses, we found that the host galaxy of GRB 031203 displayed
several unusual emission line ratios that were not consistent with the other LGRB host
galaxies or the star-forming galaxies in our comparison samples. Instead, these ratios
suggested that GRB 031203 might show evidence of AGN activity. To determine whether
or not GRB 031203’s host was a typical star-forming galaxy, we applied the emission line
ratio classification scheme from Kewley et al. (2006) used to separate star-forming galaxies,
composite galaxies, and Seyfert or Low Ionization Narrow Emission-Line Region (LINER)
AGN. These diagnostics utilize the [OIII]λ5007/Hβ, [NII]λ6584/Hα, [SII]λλ6717,6731/Hα,
and [OI]λ6300/Hα line ratios (GRB 031203 was the only galaxy in our LGRB host sample
that included a detection of [OI] λ6300). Based on these diagnostics and our measured line
3http://www.cfht.hawaii.edu/∼arnouts/LEPHARE/cfht lephare/lephare.html
31

fluxes, the host of GRB 031203 appears to show definitive evidence of AGN activity, and
cannot be classified as a purely star-forming galaxy. The exact AGN classification of the
host cannot be determined without further analysis, as even small uncertainties in the line
fluxes can accommodate either a composite or Seyfert galaxy scenario (the host does not
agree with the criteria for LINER galaxies). This is the first evidence of AGN activity in a
LGRB host galaxy.
This is at odds with the results of Margutti et al. (2007) and Prochaska et al. (2004),
who both classify the host of GRB 031203 as star-forming. However, these classifications
fail to accommodate for the sometimes considerable error bars on the published emission
line fluxes. Based on the Kewley et al. (2006) criteria, and taking the flux errors into
consideration, the Prochaska et al. (2004) and Margutti et al. (2007) fluxes cannot be used
to distinguish whether the host of GRB 031203 is a star-forming, composite, or Seyfert
galaxy.
While this result is intriguing, it must be noted that the emission-line diagnostics used
to determine properties such as metallicity are meant for use with star-forming galaxies.
We consider the ISM properties derived in this paper to be good approximations of the
ISM environment of GRB 031203; however, we cannot quantify how the presence of AGN
activity might affect these results. Therefore, in our comparisons with the general galaxy
population we must be careful to consider how the inclusion or exclusion of the GRB 031203
host in our sample affects our overall conclusions.
For a detailed discussion of the parameters we determined for each individual host
galaxy, please see the Appendix.
32

Chapter 3
LGRB Host Galaxies - Comparison and
Interpretation
3.1 LGRB Hosts and the General Galaxy Population
3.1.1 Comparison Samples
To place the observations and derived ISM properties of our LGRB hosts in context with
the general galaxy population, we have assembled a number of comparison samples drawn
from different surveys of star-forming galaxies:
Sloan Digital Sky Survey (SDSS): To compare our LGRB hosts to the general local
(z ≤ 0.1) star-forming galaxy population, we include the sample of emission-line galaxies
from SDSS described in Kewley et al. (2006). These galaxies were originally taken from
Data Release 4 of SDSS (Adelman-McCarthy et al. 2006) and restricted to 85224 galaxies
with a S/N ≥ 8 in the strong emission lines and a redshift range between 0.04 < z < 0.1.
The lower limit of this redshift range corresponds to an aperture covering fraction of 20%,
the minimum required to avoid domination of the spectrum by aperture effects (Kewley et
al. 2006, Kewley & Ellison 2008). The spectra were acquired with 3” diameter fibers. We
further restrict this sample to the 60920 galaxies classified as star-forming by Kewley et al.
(2006). This classification is based on the criteria of Kauffmann et al. (2003) derived from
the [NII]/Hα vs. [OIII]/Hβ diagnostic diagram, and the Kewley et al. (2001) criteria based
33
on the [SII]/Hα vs. [OIII]/Hβ and [OI]/Hα vs. [OIII]/Hβ diagnostic diagrams; equations
are given in Kewley et al. (2006). This classification removes contaminations from composite
galaxies, Seyferts, LINERs, and ambiguous galaxies that cannot be definitively classified
based on the Kauffmann et al. (2003) and Kewley et al. (2001) criteria.
Nearby Field Galaxy Survey (NFGS): To ensure that the local galaxy population
comparison is not affected by any residual aperture effects present in the SDSS sample,
we also include a sample of galaxies from NFGS. NFGS has integrated emission-line
spectrophotometry of 196 galaxies that span from −14 < MB < −22 and include the full
range of Hubble sequence morphologies, with a median redshift of z = 0.01 and a maximum
redshift of z ∼ 0.07 (Jansen et al. 2000a, 2000b). The galaxies were selected from the CfA
redshift catalog, which has a limiting blue photographic magnitude of mZ = 14.5 (Huchra
et al. 1983), and observed with the FAST spectrograph at the Whipple 1.5 m telescope
(Jansen et al. 2000b). We limit this sample to 95 star-forming galaxies by applying the
emission-line criteria for star-forming galaxies in Kewley et al. (2006) described above for
the SDSS sample.
Blue Compact Galaxies (BCGs): To compare the LGRB hosts to a sample of
galaxies that show evidence of burst-like star formation histories, we include a sample of
blue compact galaxies (BCGs) from Kong & Cheng (2002) and Kong et al. (2002). Their
sample consists of 97 galaxies selected from the catalogs of Gordon & Gottesman (1981),
Thuan & Martin (1981), Kinney et al. (1993), and Thuan et al. (1999), limited to MB < −17
mag. The spectra were observed with the OMR spectrograph on the 2.16m telescope of
the Beijing Astronomical Observatory. Here we restrict our sample to those galaxies with a
complete set of spectral line fluxes that satisfy the star-forming galaxy emission line criteria
in Kewley et al. (2006), giving us 36 BCGs in our final sample. Note that, for consistency
with our other star-forming galaxy samples, we use the Kewley et al. (2006) criteria rather
than the classifications use in Kong et al. (2002) to remove AGN and non-emission-line
galaxies from their sample. This sample of BCGs has a redshift range of 0.003 < z < 0.029,
with a median redshift of z = 0.016.
34
Metal-Poor Galaxies (MPGs): We include a sample of 10 MPG spectra from Brown
et al. (2008). The 10 MPG spectra are part of a survey of 38 MPG candidates, selected
from Data Release 4 of SDSS based on restrictions on their (u′−g′)0, (g′−r′)0, and (r′−i′)0
colors, a magnitude limit of g′ < 20.5, and removal of HII regions in nearby galaxies through
visual inspection. The remaining MPG candidates were observed with the Blue Channel
spectrograph at the MMT telescope. Brown et al. (2008) find 10 MPGs in this sample,
with log(O/H) + 12 < 8 based on their electron temperature metallicities (Izotov et al.
2006). These 10 galaxies have a redshift range of 0.03 < z < 0.081 with a median redshift
of z = 0.073.
Type Ic SN Host Galaxies (SNHGs): Modjaz et al. (2008) present a sample of
nearby host galaxies where broad-lined Type Ic supernovae have been observed without
accompanying GRBs. From their sample we select eight SNHGs with the full set of published
emission line fluxes required for our analyses, including additional fluxes in cases where
observations of the SN position differed from the galaxy center. To better clarify selection
effects, Modjaz et al. (2008) distinguish between host galaxies of supernovae that were
detected through galaxy-targeted searches (and therefore reflect a selection bias towards
more luminous host galaxies), and supernovae detected in large-scale surveys, which have a
slightly fainter mean luminosity and selection criteria that are more comparable to GRBs.
Our subsample includes two hosts of targeted-search supernovae and six hosts of supernovae
detected through surveys, and ranges from −20.3 < MB < −16.9. The SNHGs used here
have a redshift range of 0.012 < z < 0.137, with a median redshift of z = 0.058.
Team Keck Redshift Survey (TKRS) galaxies: For a comparison of our
intermediate-redshift (0.3 < z < 1) LGRB host galaxies with similar star-forming galaxies,
a deeper survey is required. The Great Observatories Origins Deep Survey-North (GOODS-
N; Giavalisco et al. 2004) includes 0.3 < z < 1 emission-line galaxies and is 90% complete
at ZAB = 24. Kobulnicky & Kewley (2004) measured nebular oxygen abundances for 204 of
these galaxies using publicly available spectra from the TKRS observations with DEIMOS
35

on Keck II (Wirth et al. 2004). The TKRS sample has a median redshift of z = 0.65, and
is 53% complete at its limiting magnitude of RAB = 24.4.
For the MPGs, SNHGs, and BCGs, we have compiled their ISM properties from the
literature and our own diagnostics, previously described in 2.2. Like our LGRB host sample,
all of the emission line fluxes used in our comparison samples have been corrected for total
reddening in the direction of the galaxy. These derived properties are given in Table 3.1.
36
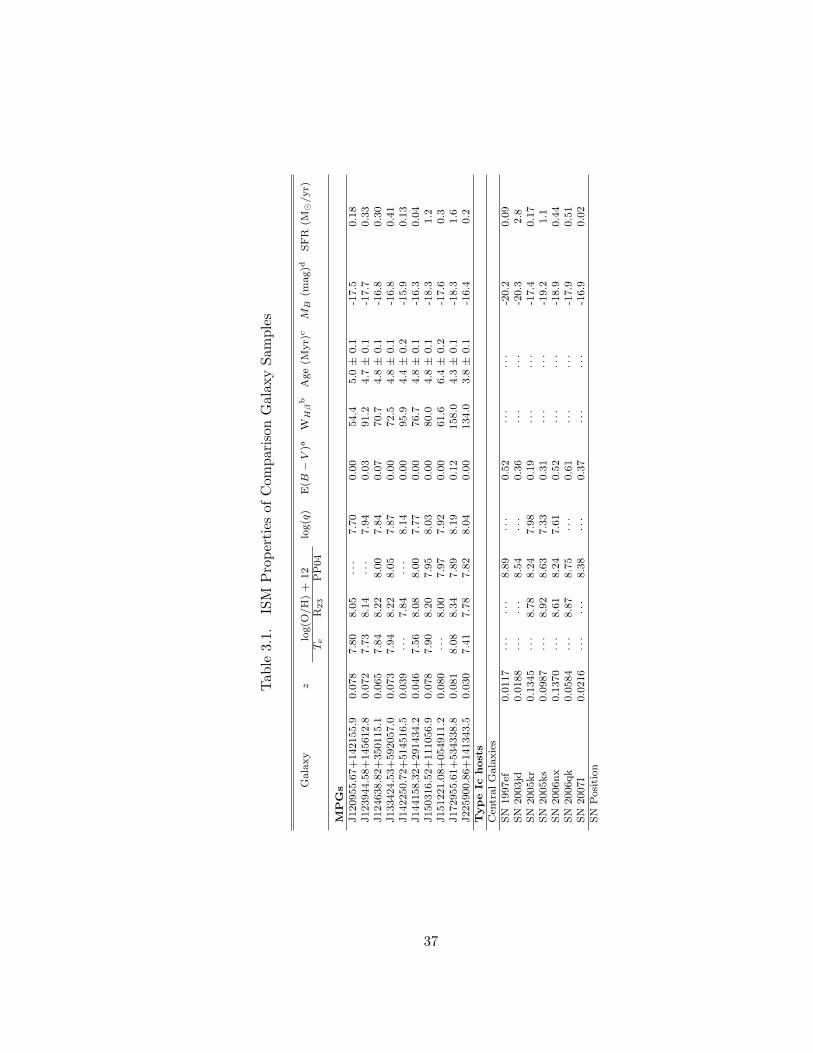
Tab
le3.
1.IS
MP
rope
rtie
sof
Com
pari
son
Gal
axy
Sam
ples
Gala
xy
zlo
g(O
/H
)+
12
log(q
)E
(B−V
)aWHβ
bA
ge
(Myr)
cMB
(mag)d
SF
R(M
/yr)
Te
R23
PP
04
MP
Gs
J120955.6
7+
142155.9
0.0
78
7.8
08.0
5···
7.7
00.0
054.4
5.0±
0.1
-17.5
0.1
8J123944.5
8+
145612.8
0.0
72
7.7
38.1
4···
7.9
40.0
391.2
4.7±
0.1
-17.7
0.3
3J124638.8
2+
350115.1
0.0
65
7.8
48.2
28.0
07.8
40.0
770.7
4.8±
0.1
-16.8
0.3
0J133424.5
3+
592057.0
0.0
73
7.9
48.2
28.0
57.8
70.0
072.5
4.8±
0.1
-16.8
0.4
1J142250.7
2+
514516.5
0.0
39
···
7.8
4···
8.1
40.0
095.9
4.4±
0.2
-15.9
0.1
3J144158.3
2+
291434.2
0.0
46
7.5
68.0
88.0
07.7
70.0
076.7
4.8±
0.1
-16.3
0.0
4J150316.5
2+
111056.9
0.0
78
7.9
08.2
07.9
58.0
30.0
080.0
4.8±
0.1
-18.3
1.2
J151221.0
8+
054911.2
0.0
80
···
8.0
07.9
77.9
20.0
061.6
6.4±
0.2
-17.6
0.3
J172955.6
1+
534338.8
0.0
81
8.0
88.3
47.8
98.1
90.1
2158.0
4.3±
0.1
-18.3
1.6
J225900.8
6+
141343.5
0.0
30
7.4
17.7
87.8
28.0
40.0
0134.0
3.8±
0.1
-16.4
0.2
Type
Ichost
sC
entr
al
Gala
xie
sS
N1997ef
0.0
117
···
···
8.8
9···
0.5
2···
···
-20.2
0.0
9S
N2003jd
0.0
188
···
···
8.5
4···
0.3
6···
···
-20.3
2.8
SN
2005kr
0.1
345
···
8.7
88.2
47.9
80.1
9···
···
-17.4
0.1
7S
N2005ks
0.0
987
···
8.9
28.6
37.3
30.3
1···
···
-19.2
1.1
SN
2006n
x0.1
370
···
8.6
18.2
47.6
10.5
2···
···
-18.9
0.4
4S
N2006qk
0.0
584
···
8.8
78.7
5···
0.6
1···
···
-17.9
0.5
1S
N2007I
0.0
216
···
···
8.3
8···
0.3
7···
···
-16.9
0.0
2S
NP
osi
tion
37

Tab
le3.
1—C
onti
nued
Gala
xy
zlo
g(O
/H
)+
12
log(q
)E
(B−V
)aWHβ
bA
ge
(Myr)
cMB
(mag)d
SF
R(M
/yr)
Te
R23
PP
04
SN
1997ef
0.0
117
···
9.0
28.6
97.3
40.2
2···
···
-20.2
0.0
7S
N2003jd
0.0
188
···
8.7
98.3
57.4
80.1
4···
···
-20.3
0.0
7S
N2005nb
0.0
238
···
8.7
58.4
67.3
20.3
4···
···
-21.3
0.3
4B
CG
siiiz
w12
0.0
19
···
8.5
78.5
27.1
50.3
012.3
86.7±
0.3
-19.9
1.5
8iiiz
w33
0.0
28
···
8.6
48.3
77.3
20.5
08.8
07.6±
0.4
-20.6
15.9
1vzw
155
0.0
29
···
8.7
08.7
27.0
70.9
05.6
88.7±
0.4
-20.2
32.6
4iiiz
w43
0.0
14
···
8.9
88.6
47.4
70.6
818.5
36.0±
0.7
-19.3
6.2
9iizw
40
0.0
03
···
8.4
37.9
28.3
00.0
7271.1
2.9±
0.1
-15.6
0.7
2m
rk5
0.0
03
···
8.6
48.1
17.9
70.0
5114.1
3.8±
0.2
-15.5
0.0
3viizw
156
0.0
12
···
8.6
58.3
87.5
10.4
212.2
16.8±
0.3
-20.3
0.3
7h
aro
10.0
14
···
8.8
28.5
47.2
50.7
112.4
66.7±
0.8
-21.1
3.2
7m
rk390
0.0
25
···
8.4
28.4
27.2
20.5
211.1
67.0±
0.3
-20.4
9.3
1zw
0855
0.0
10
···
8.7
68.3
57.6
80.2
656.2
85.1±
0.2
-18.9
0.7
0m
rk105
0.0
13
···
8.9
48.5
67.5
50.4
915.2
26.4±
0.7
-17.6
0.8
6m
rk402
0.0
24
···
8.4
58.2
97.4
80.3
825.0
05.4±
0.3
-19.3
6.3
4iizw
44
0.0
21
···
8.8
98.7
77.2
10.5
89.4
57.1±
0.8
-18.8
1.6
8h
aro
20.0
05
···
8.7
28.4
17.4
40.4
530.0
55.2±
0.3
-18.5
1.0
3h
aro
30.0
03
···
8.6
08.2
17.7
30.1
560.6
75.0±
0.2
-17.9
0.3
1h
aro
25
0.0
26
···
8.7
78.3
37.7
80.3
042.8
85.1±
0.2
-19.5
11.0
8h
aro
40.0
03
···
8.2
27.9
77.9
60.0
468.3
84.8±
0.1
-14.0
0.0
2
38

Tab
le3.
1—C
onti
nued
Gala
xy
zlo
g(O
/H
)+
12
log(q
)E
(B−V
)aWHβ
bA
ge
(Myr)
cMB
(mag)d
SF
R(M
/yr)
Te
R23
PP
04
haro
29
0.0
01
···
8.2
57.8
68.2
20.0
6302.0
2.8±
0.1
-14.2
0.0
1m
rk215
0.0
20
···
8.8
28.7
37.0
80.8
08.6
07.2±
0.8
-20.0
15.9
8h
aro
32
0.0
16
···
8.6
28.6
17.3
40.3
415.1
46.3±
0.3
-20.4
1.8
2h
aro
34
0.0
23
···
8.9
28.7
07.1
60.5
811.6
26.8±
0.8
-20.0
4.7
9h
aro
35
0.0
26
···
8.7
08.4
27.4
50.2
615.7
66.2±
0.3
-19.1
2.3
3h
aro
37
0.0
14
···
8.8
08.4
87.4
80.2
020.1
55.9±
0.7
-18.6
0.8
1m
rk57
0.0
26
···
8.6
18.5
57.1
80.4
89.5
17.4±
0.4
-20.0
1.2
6m
rk235
0.0
24
···
8.9
28.6
17.3
90.4
511.1
46.9±
0.8
-19.9
1.9
8m
rk241
0.0
27
···
8.9
48.6
97.2
60.7
48.4
47.3±
0.8
-19.2
4.8
2iz
w53
0.0
16
···
8.6
68.5
57.2
90.6
75.6
68.6±
0.4
-19.2
0.5
6h
aro
39
0.0
09
···
8.5
08.2
17.3
70.3
712.5
26.7±
0.3
-18.2
0.1
4iizw
70
0.0
04
···
8.0
98.1
47.6
20.0
051.8
25.0±
0.1
-17.2
0.0
8iz
w117
0.0
19
···
8.9
08.6
47.2
40.6
312.5
26.7±
0.8
-20.3
3.9
7iz
w159
0.0
10
···
8.5
68.2
57.6
00.1
934.4
55.1±
0.2
-17.2
0.5
2iz
w191
0.0
19
···
8.9
28.7
37.1
50.5
99.9
27.0±
0.8
-19.8
3.2
3iv
zw93
0.0
12
···
8.4
08.2
67.4
10.2
922.5
76.5±
0.2
-18.3
0.5
7zw
2220
0.0
23
···
8.8
88.5
97.4
60.4
015.8
56.3±
0.7
-21.3
4.9
0iv
zw149
0.0
11
···
8.4
78.4
17.3
30.3
315.2
46.3±
0.3
-21.9
0.7
3zw
2335
0.0
05
···
8.6
58.5
07.2
90.3
411.0
97.0±
0.3
-16.3
0.0
9
aT
ota
lco
lor
exce
ssin
the
dir
ecti
on
ofth
egala
xy,
use
dto
corr
ect
for
the
effec
tsofb
oth
Gala
ctic
an
din
trin
sic
exti
nct
ion
.
bR
est-
fram
eeq
uiv
ale
nt
wid
ths.
cA
ges
com
efr
om
the
equ
ati
ons
der
ived
for
the
Sch
aer
er&
Vacc
a(1
998)
mod
els
rela
tin
gHβ
equ
ivale
nt
wid
ths
an
dgala
xy
ages
,ad
op
tin
gth
eR
23
met
allic
itie
s.
dMB
valu
esco
me
from
the
lite
ratu
reas
follow
s:M
od
jaz
etal.
(2008;
Typ
eIc
host
s),
Bro
wn
etal.
(2008;
MP
Gs)
,an
dK
on
g&
Ch
eng
(2002;
BC
Gs)
.
39
3.1.2 Emission Line Ratio Diagnostic Diagrams
We begin by simply comparing the dereddened emission line flux ratios of our samples on a
series of optical emission line ratio diagnostic diagrams. We have separated all comparisons
between our LGRB host sample and the general galaxy population according to redshift,
considering the “nearby” galaxy samples at z < 0.3 separately from the “intermediate-
redshift” populations at 0.3 < z < 1; this is done to avoid any effects that might otherwise
be present due to the overall evolution of metallicity with redshift.
Nearby (z < 0.3) Galaxies
We use three emission line diagnostic diagrams to compare our nearby (z < 0.3) LGRB
host galaxies to the local SDSS, NFGS, BCG, MPG, and SNHG comparison samples. The
LGRB sample has a redshift range of 0.009 < z < 0.296, with a median redshift of z = 0.17.
The comparison samples range from 0.003 < z < 0.137, with median redshifts ranging from
0.01 < z < 0.073.
[NII]/Hα vs. [OIII]/Hβ: [NII]λ6584/Hα correlates strongly with metallicity as well as
ionization parameter (Kewley et al. 2001, Kewley & Dopita 2002), while [OIII]λ5007/Hβ is
primarily a measure of ionization parameter with a degenerate dependence on metallicity
(Baldwin et al. 1981, Kewley et al. 2004). The close proximity of the emission lines used
in each ratio also renders this diagnostic relatively insensitive to extinction corrections. In
Figure 3.1 we use this diagnostic diagram to compare our nearby LGRB host galaxies to
the local comparison samples. We have also applied the two-sample Kolmogorov-Smirnov
(KS) test to the emission line ratios, comparing each of our samples to the z < 0.3 LGRB
host galaxies; results of these calculations are given in Table 3.2. We find that the nearby
LGRB host galaxies are not representative of the general galaxy population, with a very
low probability (<6%) that they are from the same parent population as the SDSS, NFGS,
BCG, or SNHG host galaxy samples. Instead, the LGRB host galaxies’ [OIII]/Hβ ratios
are more statistically similar to the MPG sample (70%), although their metallicity-sensitive
[NII]/Hα ratios show poor a statistical agreement with the MPG sample as well (4%); see
40

Figure 3.1 Comparison of our z < 0.3 LGRB host galaxies (red stars) to the SDSS galaxies(points), NFGS galaxies (blue triangles), BCGs (green filled circles), MPGs (large opencircles), and SNHGs (squares; yellow squares correspond to global spectra while orangesquares correspond to explosion site spectra) on the [NII]/Hα vs. [OIII]/Hβ diagnosticdiagram. GRB 031203 is marked with an asterisk.
Table 3.2. This lack of agreement with the general galaxy population is in sharp contrast to
the SNHG sample; while the environments hosting Type Ic supernovae appear to be evenly
distributed throughout the range of emission line ratios found in the SDSS, NFGS, and
BCG comparison samples, the LGRB host galaxies show strong agreement with the MPGs
but are not statistically similar to these general populations.
[NII]/[OII] vs. [OIII]/[OII]: The metallicity-sensitive [NII]λ6584/[OII]λ3727 ratio and
the ionization-parameter-sensitive [OIII]λ5007/[OII]λ3727 ratio are a more effective means
of isolating these ISM properties than the [NII]/Hα vs. [OIII]/Hβ diagnostic. [NII]/[OII] has
a minimal dependence on ionization parameter thanks to the similar ionization thresholds
41

of [NII] and [OII] (van Zee et al. 1998, Dopita et al. 2000). [OIII]/[OII], unlike [OIII]/Hβ,
does not show a degenerate dependence on metallicity, though a metallicity dependence is
still evident (Dopita et al. 2000, Kewley & Dopita 2002). Together, these ratios produce a
diagnostic grid with very little degeneracy that clearly separates metallicity and ionization
parameter. We show a comparison of these ratios for the nearby LGRB host galaxies and
local comparison samples in Figure 3.2. The nearby LGRB host galaxies once again occupy
a distinct parameter space from the general galaxy population (with KS test probabilities of
≤13% for the [NII]/[OII] diagnostic ratio and ≤9% for the [OIII]/[OII] diagnostic ratio); we
again see a higher statistical correspondence between the LGRB host galaxies and the MPGs
for these ratios (71% for [NII]/[OII] and 44% for [OIII]/[OII]; see Table 3.2). Here we can
also see that the [OIII]/[OII] ratio is notably high for two of our LGRB host galaxies (GRB
020903 and GRB 031203); this corresponds to the unusually high ionization parameters of
these two galaxies (log q = 8.15 and 8.37, respectively), and in the case of GRB 031203 is
likely due in part to a contribution from AGN activity.
[SII]/Hα vs. [OIII]/Hβ: Finally, the [SII]λλ6717,6731/Hα line ratio is a useful means
of tracing the hardness of the photoionizing spectrum present in a galaxy (Dopita et al.
2000). This diagnostic is clearly double-valued; however, it still allows us to compare the
properties of different galaxy populations. In Figure 3.3 we compare our nearby LGRB host
galaxy flux ratios to the local comparison sample. Our host spectra of GRB 020903 and
GRB 030329 do not include sufficient [SII]λλ6717,6731 detections to determine fluxes for
these lines; in these cases we determine upper limits for the [SII]/Hα ratio. The small size
of our LGRB host sample with definitive [SII] detections precludes us from drawing any
strong conclusions, but we do see a very similar distribution to the [NII]/Hα vs. [OIII]/Hβ
comparison, with the LGRB hosts bridging the gap between the MPGs and the general
galaxy populations and showing very poor statistical agreement with the [SII]/Hα fluxes
for all samples (≤6%; see Table 3.2). In these statistics we exclude the [SII]/Hα upper
limits determined for GRB 020903 and GRB 030329.
42

Figure 3.2 Comparison of our z < 0.3 LGRB host galaxies (red stars) to the SDSS galaxies(points), NFGS galaxies (blue triangles), BCGs (green filled circles), MPGs (large opencircles), and SNHGs (squares; yellow squares correspond to global spectra while orangesquares correspond to explosion site spectra) on the [NII]/[OII] vs. [OIII]/[OII] diagnosticdiagram. GRB 031203 is marked with an asterisk.
43

Figure 3.3 Comparison of our z < 0.3 LGRB host galaxies (red stars) to the SDSS galaxies(points), NFGS galaxies (blue triangles), BCGs (green filled circles), MPGs (large opencircles), and SNHGs (squares; yellow squares correspond to global spectra while orangesquares correspond to explosion site spectra) on the [SII]/Hα vs. [OIII]/Hβ diagnosticdiagram. For two of our host galaxies (GRB 020903 and GRB 030329), we are only able toplace upper limits on the [SII] line fluxes; the [SII]/Hα ratios for these galaxies are thereforedenoted as upper limits with arrows. GRB 031203 is marked with an asterisk.
44

Table 3.2. Kolmogorov-Smirnoff Percentiles for the Nearby (z < 0.3) LGRB Host Sample
Sample [NII]/Hα [NII]/[OII] [OIII]/Hβ [OIII]/[OII] [SII]/Hα
SDSS 0.0002 0.003 0.0002 0.002 0.0000NFGS 1.27 5.86 0.08 0.22 0.006BCGs 3.56 13.1 5.39 1.06 6.37SNHGs 3.78 9.08 5.56 9.08 1.12MPGs 3.68 70.7 70.0 44.3 0.005
For a more detailed discussion of the physics governing these emission line diagnostic
line ratios and their correspondence to ISM properties, please see 5.3.
Intermediate-Redshift (0.3 < z < 1) Galaxies
To compare our higher-redshift LGRB host galaxies (median z = 0.71) to the intermediate-
redshift comparison sample of galaxies from TKRS (median z = 0.65), we employ the R23
vs. [OIII]/[OII] diagnostic diagram. In Figure 3.4 the higher-redshift LGRB hosts and the
TKRS sample cover similar ranges in the ratio space, unlike the lower-redshift LGRB hosts
when compared with the local sample. Applying the KS test to the R23 and [OIII]/[OII]
diagnostic ratios gives a 3% and 42% probability, respectively, that the 0.3 < z < 1.0 LGRB
host galaxies and the TKRS sample originate from the same parent population; it is notable
that the probability is much lower for the metallicity-sensitive R23 ratio. However, it must
be emphasized that this diagnostic is strongly double-valued, preventing us from drawing
any definitive conclusions from this data.
3.1.3 ISM Properties
Luminosity vs. Metallicity
In Figure 3.5 (top), we place our low-redshift (z < 0.3) LGRB hosts on a luminosity-
metallicity (L-Z) plot, and compare their position to the BCGs, MPGs, and SNHGs included
in our sample. All of the metallicities plotted in Figure 3.5 were calculated using the R23
diagnostic calibration described in 2.2.2. We find that the BCGs and SNHGs follow a very
45

Figure 3.4 Comparison of our 0.3 < z < 1 LGRB host galaxies (red stars) to the TKRSgalaxies (black squares) on the R23 vs. [OIII]/[OII] diagnostic diagram. On this diagramthere appears to be good agreement between the LGRB hosts and the TKRS sample;however, it must be stressed that the R23 diagnostic is double-valued, which prevents usfrom drawing any definitive conclusions regarding the agreement between these two samples.
46

similar L-Z relation. By contrast, the MPGs and LGRB host galaxies lie well below the L-Z
relation of the BCGs, with the MPGs falling slightly lower than the LGRB hosts at the same
MB on the diagram; the exception is the high-metallicity host of GRB 050826, which falls
above the BCG L-Z relation. Our work shows no similar skew towards lower metallicities
in the SNHGs. This is also in agreement with the findings of Modjaz et al. (2008), who
conclude that the SNHGs have higher metal abundances than LGRB host galaxies and
occupy a distinct and separate higher-metallicity region of the L-Z plot as compared to
LGRB host galaxies. From applying the KS test to these galaxies’ metallicities, we find
that the probability that LGRB host galaxies and the BCG sample originate from the same
parent population is 0.4% (or 2% if we exclude the potentially aberrant data from the AGN
host of GRB 031203); comparing the LGRB host galaxies and the SNHGs we find a similar
KS test probability of 1% (or 3% excluding GRB 031203). By contrast, the LGRB host
galaxies and MPGs have a 47% KS test probability of originating from the same parent
sample - this increases to 54% if we exclude GRB 031203.
To extend this comparison to higher redshifts, we perform a similar comparison between
our intermediate-redshift (0.3 < z < 1.0) LGRB host sample and the TKRS galaxies (Figure
3.5, bottom). For the z = 0.966 host of GRB 980703, we are not able to distinguish whether
the galaxy metallicity falls on the lower or upper branch of the Kobulnicky & Kewley (2004)
R23 diagnostic; to illustrate this in our comparison we plot both the lower- and upper-branch
metallicity, connected by a dotted line. If the lower-branch metallicity is assumed for the
host of GRB 980703, we find a 0.2% KS test probability that these galaxies are drawn from
the same parent population; adopting the upper-branch metallicity for this host yields a
slightly higher KS test probability of 3%. This suggests that the low-metallicity bias of
LGRB host galaxies extends out to z ∼ 1.
Metallicity vs. Young Stellar Population Age
In Figure 3.6 we compare metallicity to the age of the young stellar population for the
z < 0.3 LGRB host galaxies, BCGs, and MPGs. Here we can immediately see that the
47

Figure 3.5 Top: Comparison of luminosity vs. metallicity for the BCGs (dots), SNHGs(green squares), MPGs (blue circles), and our low-redshift (z < 0.3) LGRB host galaxies(red stars). Solid green squares represent SNHG global galaxy spectra, while open greensquares represent SNHG spectra taken at the site of the supernova. The L-Z relations forthe BCG and MPG host samples are plotted as black and blue solid lines, respectively.GRB 031203, which could potentially be contaminated by contribution from an AGN, ismarked with an asterisk. Bottom: Comparison of the luminosity vs. metallicity relation forthe TKRS galaxies (black squares) and our higher-redshift (0.3 < z < 1.0) LGRB hosts (redstars), based on metallicites for the TKRS sample from Kobulnicky & Kewley (2004); lowerlimits on the TKRS metallicities are illustrated by the arrows. For the host galaxy of GRB980703, where an upper or lower branch on the R23 diagnostic could not be determined,both metallicities are plotted and connected by a red dotted line to illustrate their sharedorigin from a single galaxy spectrum. The L-Z relation for the TKRS sample is plottedas a solid black line. For the LGRB host sample, we plot the L-Z relation based on boththe lower-branch (solid red line) and upper-branch (dashed red line) metallicities. In bothpanels the solar metallicity is marked by the black dotted line, taken to be log(O/H) + 12= 8.69 from Asplund et al. (2005). All metallicities for the galaxy samples were derivedusing the Kobulnicky & Kewley (2004) R23 diagnostic.
48

Figure 3.6 Metallicity plotted against young stellar population age for the BCGs (dots),MPGs (blue circles), and our low-redshift (z < 0.3) LGRB hosts (red stars). The Asplundet al. (2005) solar metallicity log(O/H) + 12 = 8.69 is shown by the black dotted line. Allmetallicities for the galaxy samples were derived using the Kobulnicky & Kewley (2004)R23 diagnostic. GRB 031203 is marked with an asterisk.
MPGs and BCGs occupy very distinct regions of the diagram. However, we find that the
LGRB host galaxies show moderate statistical agreement with both samples. The average
young stellar population age of the LGRB hosts is 5.6 ± 1.2 Myr, compared to 6.2 ± 0.5
Myr for the BCGs and 4.8 ± 0.1 Myr for the MPGs. Applying the KS test to the ages
for these samples, we find a 7.3% probability that the LGRB hosts and BCGs are drawn
from the same parent population, and a 5.6% probability when comparing the LGRB hosts
and MPGs. From these comparisons, we find that age does not appear to be the primary
discriminator between LGRB hosts and the general star-forming galaxy population.
49

Metallicity vs. Ionization Parameter
In Figure 3.7 we compare the LGRB host galaxies, BCGs, MPGs, and SNHGs on a
metallicity vs. ionization parameter plot. In this case, the BCG and SNHG samples both
appear to have higher metallicities and lower ionization parameters that the MPGs and
LGRB hosts, occupying opposing ends of the parameter space. A comparison of the MPG
and BCG ionization parameters yields an extremely low KS test probability of 10−3%, a
measurement reflected in the strong division seen in Figure 3.3 between the MPG+LGRB
host samples (which share a KS test probability of 54%) and the BCG+SNHG samples
(which share a KS test probability of 42%); the host of GRB 050826 is the sole exception
to this division in our LGRB host sample. We also calculate low KS test probabilities when
comparing the LGRB host galaxy ionization parameters to the BCG and SNHG samples,
finding 1.4% and 9.9% respectively. In this respect, we find that our nearby LGRB host
sample shows only a very weak agreement with the general BCG galaxy population, in
marked contrast with the SNHG sample. The agreement between the LGRB host sample
and MPGs is much more robust.
3.2 The Mass-Metallicity Relation for LGRB Hosts
In recent years, stellar masses for LGRB host galaxies have been examined in some detail.
Castro Ceron et al. (2006) estimated the stellar masses for 6 LGRB host galaxies at z ∼ 1
using K band fluxes; in Castro Ceron et al. (2008) this was extended to K-band stellar mass
estimates for 16 LGRB hosts and upper limits on stellar mass for an additional 14 hosts.
The LGRB hosts were all found to be low-mass star-forming systems with 7 < log(M?/M)
< 11 (median M? = 109.7), with 0.009 < z < 2.66. Castro Ceron et al. (2008) found that
the median stellar mass for LGRB hosts was lower than the median of galaxies from the
Gemini Deep Deep Survey (GDDS, Abraham et al. 2004) and did not detect any intrinsic
evolution of stellar mass with redshift.
50

Figure 3.7 Metallicity plotted against ionization parameter q for the BCGs (dots), SNHGs(green squares), MPGs (blue circles), and our low-redshift (z < 0.3) LGRB host galaxies(red stars). Solid green squares represent SNHG global galaxy spectra, while open greensquares represent SNHG spectra taken at the site of the supernova. The Asplund et al.(2005) solar metallicity log(O/H) + 12 = 8.69 is shown by the black dotted line. Allmetallicities for the galaxy samples were derived using the Kobulnicky & Kewley (2004)R23 diagnostic. GRB 031203 is marked with an asterisk.
51
Savaglio et al. (2009) determined stellar masses and metallicities for a number of LGRBs,
as well as short-duration GRBs, finding an average log(M?/M) = 9.3. Based on these
data they do not find any M-Z relation for the 14 LGRB hosts with measured metallicities.
Savaglio et al. (2009) also see no metallicity offset when comparing the LGRB host sample
to local star-forming dwarf galaxies from Lee et al. (2006) and higher-redshift galaxies from
GDDS. However, they do note that for 8 of the LGRB hosts the metallicities are poorly
constrained. These comparisons are also conducted across several different metallicity
diagnostics, which are known to show considerable disagreements and offsets in their results
(see discussion in Kewley & Ellison 2008).
Most recently, Han et al. (2010) compared the M-Z relation for SDSS galaxies from
Liang et al. (2007) to a small sample of 5 nearby LGRB host galaxies. While the sample
size is small, and the comparison sample redshift is inhomogenous with the LGRB host
redshifts, the LGRB host galaxies are found to consistently lie below the M-Z relation for
SDSS galaxies.
In Figure 3.8 we plot the M-Z relation for our sample of z < 1 LGRB host galaxies. We
find that these two parameters have a strong and statistically significant positive correlation
(Pearson’s r = 0.80, p = 0.001). This is a significant deviation from the results of Savaglio
et al. (2009), who find no M-Z relation for their sample of GRB host galaxies. We postulate
that this is primarily due to differences in metallicity determinations. While our stellar
masses derived for these host galaxies are in agreement with the stellar masses from Savaglio
et al. (2009), our metallicities are largely based on newer high-S/N emission line spectra
of the host galaxies, and the data plotted in Figure 3.8 are based solely on metallicities
determined using the Kobulnicky & Kewley (2004) R23 calibration.
SDSS galaxies: For the nearby (z < 0.3) LGRB host galaxies, we adopt data from
∼53,000 star-forming SDSS galaxies as a comparison sample. The values plotted in Figure
3.8 are taken from Table 3 of Tremonti et al. (2004), where the data has been binned
by mass in increments of ∼0.1 dex. The Tremonti et al. (2004) metallicities have been
corrected to agree with the R23 metallicity diagnostic of Kobulnicky & Kewley (2004) using
52

the conversion coefficients given in Table 3 of Kewley & Ellison (2008). In addition, the
Tremonti et al. (2004) stellar masses were derived using spectral indices, and Zahid et al.
(2010) find that these masses differ from masses determined using the Le Phare code by a
constant offset, attributable to the different IMFs and techniques (spectral vs. photometric)
used in the two methods. As a result, we have decremented the Tremonti et al. (2004) stellar
masses by the recommended offset of 0.17 dex to bring them into agreement with the stellar
mass determinations of the Le Phare code; for more discussion see Zahid et al. (2010). The
sample covers a redshift range of 0.005 < z < 0.25, with a median redshift of z ∼ 0.1.
DEEP2 galaxies: For the intermediate-redshift (0.3 < z < 1) LGRB host galaxies, we
compare our results to stellar mass-binned data for 940 emission line galaxies from the Deep
Extragalactic Evolutionary Probe 2 (DEEP2) survey. The stellar masses and metallicities
for these galaxies were determined by Zahid et al. (2010), using the Le Phare stellar mass
code and the Kobulnicky & Kewley (2004) R23 metallicity diagnostic. The data cover a
redshift range from 0.75 < z < 0.82.
From this comparison, we find that most of the LGRB hosts in our sample fall below
the standard M-Z relation for star-forming galaxies at similar redshifts, with differences
ranging from −0.10 to −0.75 dex across a fixed stellar masses. We do note that, for the
high-metallicity hosts of GRB 050826 and GRB 020819, the measured metallicities agree
with the SDSS and DEEP2 M-Z relations to within the systematic errors. Across the
whole sample we find an average offset from the general star-forming galaxy populations
of −0.50 ± 0.19 dex in metallicity (−0.51± 0.24 dex for the z < 0.3 sample, −0.49± 0.18
dex for the 0.3 < z < 1 sample). This confirms the result that was suggested by our L-Z
comparison in Section 3.1.3.
Finally, in Figure 3.8 we compare the M-Z relation determined for our intermediate-
redshift LGRB hosts to binned data from the Erb et al. (2006) M-Z relation for a sample
of 87 ultraviolet-selected star-forming galaxies at z ∼> 2. The metallicities for this sample,
originally derived using the [NII]λ6584/Hα diagnostic from Pettini & Pagel (2004), have
been converted to agree with Kobulnicky & Kewley (2004) metallicities according to the
53

coefficients in Table 3 of Kewley & Ellison (2008); the masses are in agreement with the
Le Phare code determination and do not require the offset decrement applied to the SDSS
sample. Erb et al. (2006) find that their z ∼ 2 sample is offset from the local M-Z relation
by ∼0.3 dex. This difference is ∼0.2 dex less than the average offset that we measure for
our LGRB host sample at 0.3 < z < 1. From this we can conclude that the low-metallicity
offset seen here for LGRB host galaxies is smaller, though still present, when compared to
star-forming galaxies at z ∼ 2. Future observations of LGRB host galaxies out to z ∼> 2
are necessary to draw further conclusions about whether LGRB host galaxies may be useful
tracers of the general star-forming galaxy population at higher redshifts.
3.3 Host Metallicity and the Isotropic Energy Release of
LGRBs
Despite the number of recent studies examining the host galaxies of LGRBs, the role
that metallicity plays in progenitor evolution and LGRB production remains unclear. If
metallicity does indeed have a direct impact on the progenitor properties, such as angular
momentum, that are key to producing such high-energy core-collapse events, one would
expect that metallicity would have some correlation with the explosive properties of LGRBs.
A low-metallicity environment produces stars with higher helium core masses and faster
rotation rates, leading to LGRBs that are expected to be more energetic and less collimated
(e.g. MacFadyen & Woosley 1999); in other words, from these assumptions we would expect
lower metallicities to produce LGRBs with a higher energy release in the gamma-ray regime
(Eγ).
Several previous studies have investigated this possibility. Ramirez-Ruiz et al. (2002)
found a tentative positive correlation between the isotropic energy release (Eγ,iso) and the
offset of a GRB from the brightest component of its host galaxy (r0). This offset correlation
was proposed to be a potential artifact of a correlation between Eγ,iso and low metallicity –
chemical abundance gradients have shown that stars at higher r0, in the outskirts of their
54

Figure 3.8 The mass-metallicity relation for both nearby (z < 0.3, top) and intermediate-redshift(0.3 < z < 1, bottom) LGRB host galaxies (filled circles). We compare the nearby LGRB hosts to thebinned mass-metallicity data from Tremonti et al. (2004) for a sample of ∼53,000 star-forming SDSSgalaxies, where the open diamonds represent the median in each bin, and the dashed and dotted linesshow the contours which include 68% and 95% of the data, respectively. For the intermediate-redshiftLGRB hosts, we plot binned mass-metallicity data for a sample of 940 emission line galaxies fromthe DEEP2 survey (Zahid et al. 2010; open squares). All metallicities correspond to the Kobulnicky& Kewley (2004) R23 diagnostic. For the z = 0.966 host galaxy of GRB 980703, where we cannotdistinguish between the lower and upper branches of the R23 diagnostic, we plot both metallicitiesand connect the resulting data points with a dotted line to indicate their origin from a single hostspectrum. The Erb et al. (2006) M-Z relation at z ∼ 2 is adapted for R23 metallicities and plottedagainst our intermediate-redshift data as a gray dashed line.
55
hosts, have lower metallicities on average (e.g. Zaritsky et al. 1994, van Zee 1998, Henry
& Worthey 1999). Since Eγ,iso is calculated assuming a quasi-spherical GRB explosion
geometry, rather accounting for the expected effects of a potential conical geometry with a
narrow opening angle for the GRB jet (θj ; see Frail et al. 2001), this result suggested that
low metallicity was associated with either a higher Eγ or a narrower GRB jet.
The most comprehensive comparison between host metallicity and Eγ,iso was performed
by Stanek et al. (2006). Using metallicities determined for the hosts of five nearby (z < 0.3)
LGRBs, an inverse correlation was found between metallicity and Eγ,iso. All but one of
the bursts in this sample were “sub-luminous” GRBs, a potentially unique class of GRB
with Eγ,iso values that are much lower than the general LGRB population (e.g. Soderberg
et al. 2004a, Soderberg 2006). Stanek et al. (2006) argued that this correlation supported
the idea of a “threshold” metallicity for producing “cosmological” GRBs with more typical
luminosities, given that the burst with the highest Eγ,iso in the sample was produced in the
host galaxy with the lowest metallicity. However, they also cautioned that this conclusion
was speculative due to the small size and sub-luminous nature of their sample.
Wolf & Podsiadlowski (2007) also investigated the possibility of a trend relating Eγ,iso
and metallicity, performing the same comparison described in Stanek et al. (2006) and
including a sample of 13 “cosmological” (z > 0.2) LGRBs. They concluded that, while the
Stanek et al. (2006) relation holds true for the nearby sub-luminous LGRBs, no relation is
apparent in the larger sample. However, the metallicies derived for these “cosmological”
LGRBs were extrapolated from the general luminosity-metallicity relation for star-forming
galaxies, a relation that LGRB host galaxies are now known to not follow (Kewley et al.
2007, Modjaz et al. 2008, this work).
To perform a robust test for a correlation between metallicity and gamma-ray energy
release, a large and uniform sample of LGRBs with known host metallicities, Eγ,iso, and θj
is required. Here we present the results of such a comparison, using our LGRB R23 host
metallicities and Eγ,iso and θj measurements for these LGRBs drawn from the literature.
The redshifts for our LGRB hosts were drawn from GCN circulars and other current
56
literature (see Table 3.3). Metallicities for all but one of host galaxies were taken from
our sample presented in Chapter 2; for this comparison we also include the recent z = 0.059
GRB 100316D, and adopt the R23 metallicity from Chornock et al. (2010)4. No Eγ,iso
measurement was available for GRB 070612A, and as a result the host is not included here.
For all but two of the LGRBs in our sample, values for Eγ,iso were taken from Amati
(2006) and Amati et al. (2008). In the case of GRB 050826, we adopt the value for Eγ,iso
from Butler et al. (2007), and for GRB 100316D we adopt Eγ,iso from Starling et al. (2010).
Amati (2006) and Amati et al. (2008) determine Eγ,iso ranging over (10 - 10,000)/(1+z) keV,
extrapolating from fits to gamma-ray data drawn from various instruments and assuming a
quasi-spherical explosion geometry. While Amati (2006) note that this approach could
produce systematic errors, the data are internally self-consistent. Butler et al. (2007)
determined Eγ,iso in the 1-10,000 keV band for GRB 050826. Amati (2006) estimates
that the difference inherent in integrating from 1-10,000 keV rather than 10-10,000 keV
integrations is typically on the order of 3-5%, and no larger than 10%. Starling et al.
(2010) find a lower limit for Eγ,iso in the 1-160 keV range for GRB 100316D (Swift satellite
observations were temporarily halted before γ-ray emission from the burst had fully ceased).
They note that there is very little flux observed for this nearby (z = 0.059) sub-luminous
GRB above 50 keV; as a result, additional contribution to the isotropic energy from the
higher-energy regime is expected to be negligible.
To convert from Eγ,iso into Eγ , we followed the convention where Eγ = Eγ,iso×1−cos(θj)
(Frail et al. 2001). Our values for θj were taken from the literature. The jet opening angle θj
is typically calculated based on the time of an observed “break” in the afterglow lightcurve
of a GRB and the formula of Sari et al. (1999); in cases where the jet break time is unclear, a
lower or upper limit can be placed on θj . For GRB 030528, we adopt the Rau et al. (2004)
approximation of a jet break at ∼3 days, and use this to calculate a θj = 0.14 radians.
For bursts that have shown evidence of a quasi-spherical, rather than conical, explosion4The host galaxy data for this LGRB is not included in our survey, as the spectra include some
contamination from the accompanying supernova that cannot be fully subtracted or accounted for indetermining properties such as young stellar population age or SFR. Here we adopt the metallicity estimatedirectly from Chornock et al. (2010).
57

Table 1. Properties of Nearby (z < 1) LGRBs
GRB z log(O/H) + 12a Eγ,iso (1052 erg) θj (radians) Eγ (1052 erg) Referencesb
980425 0.009 ∼8.40 0.001 ± 0.00002 quasi-spherical 0.001 ± 0.00002 1,2,3,4,5060218 0.034 8.21 0.0053 ± 0.0003 quasi-spherical 0.0053 ± 0.0003 6,2,7,8100316D 0.059 8.3 ≥ 0.0059 ± 0.0005 quasi-spherical ≥ 0.0059 ± 0.0005 9,10,11,12031203 0.105 8.27 0.10 ± 0.004 quasi-spherical 0.10 ± 0.004 13,2,3,14030329 0.168 8.13 1.5 ± 0.3 0.45 0.15 ± 0.03 1,2,7,15,16020903 0.251 8.07 0.0024 ± 0.0006 quasi-spherical 0.0024 ± 0.0006 ,17,2,7,18
050826 0.296 8.83 0.03+0.04−0.02 >0.2 >0.0006 6,19,20,21
020819B 0.410 9.0 0.68 ± 0.17 · · · <0.68 ± 0.17 22,23,7,24990712 0.434 ∼8.40 0.67 ± 0.13 >0.71 ± 0.03 >0.16 ± 0.04 1,2,7,25010921 0.451 8.24 0.95 ± 0.10 0.56 ± 0.04 0.15 ± 0.04 1,19,7,25020405 0.691 8.33/8.59 10 ± 0.9 0.14 ± 0.02 0.10 ± 0.04 1,2,7,25991208 0.706 8.02 22.3 ± 1.8 <0.15 ± 0.01 <0.25 ± 0.06 26,19,7,25030528 0.782 ∼8.40 2.5 ± 0.3 0.14 0.024 ± 0.003 27,19,7,28051022 0.807 8.62 54 ± 5 0.08 0.17 29,2,7,30050824 0.828 ∼8.40 0.130 ± 0.029 0.08 0.0004 6,19,3,31980703 0.966 8.31/8.65 7.2 ± 0.7 0.20 ± 0.02 0.14 ± 0.5 1,19,7,25
aHost metallicity, derived from the Kobulnicky & Kewley (2004) R23 diagnostic. Metallicities have a systematicerror of ±0.1 dex.
bReferences: (1) Ghirlanda et al. (2004), (2) Levesque et al. (2010a), (3) Amati (2006), (4) Kulkarni et al. (1998),(5) Li & Chevalier (1999), (6) Swift data archive, (7) Amati et al. (2008), (8) Soderberg et al. (2006), (9) Sakamotoet al. (2010), (10) Chornock et al. (2010), (11) Starling et al. (2010), (12) Soderberg et al. (2010), (13) Mereghetti& Gotz (2003), (14) Soderberg et al. (2004b), (15) Berger et al. (2003), (16) Frail et al. (2005), (17) Ricker etal. (2002), (18) Soderberg et al. (2004a), (19) Levesque et al. (2010b), (20) Butler et al. (2007), (21) Mirabal etal. (2007), (22) Hurley et al. (2002), (23) Levesque et al. (2010c), (24) Jakobsson et al. (2005) (25) Bloom et al.(2003), (26) Hurley & Cline (1999), (27) Atteia et al. (2003), (28) Rau et al. (2004) (29) Hurley et al. (2005), (30)Nakagawa et al. (2006), (31) Racusin et al. (2009)
geometry (GRBs 980425, 020819B, 020903, 031203, 060218, and 100316D), Eγ,iso and Eγ
are roughly equivalent.
We plot host metallicity against, redshift, Eγ,iso, and Eγ in Figure 1. We have included
the redshift comparison to illustrate any potential correlation that may appear as an artifact
of metallicity evolution with redshift. For host galaxies with both upper and lower branch
metallicities from the Kobulnicky & Kewley (2004) R23 diagnostic, we plot two data points
connected by a dotted line to illustrate their correspondence to a single host. We find that
there is no statistically significant correlation between metallicity and redshift (Pearson’s
r = 0.10, p = 0.71 assuming lower-branch metallicities, and Pearson’s r = 0.28, p = 0.29
assuming upper-branch metallicities).
Similarly, when comparing metallicity and Eγ,iso, we again find no statistically significant
correlation (Pearson’s r = 0.08, p = 0.78 assuming lower-branch metallicities, and Pearson’s
58

r = 0.10, p = 0.72 assuming upper-branch metallicities). This result is at odds with
the inverse correlation between Eγ,iso and metallicity proposed by Stanek et al. (2006).
However, Stanek et al. (2006) do note that their proposed relation is based on a small
and non-representative sample of z < 0.3 and sub-luminous LGRBs. Finally, we find no
statistically significant correlation between metallicity and Eγ (Pearson’s r = 0.16, p = 0.64
assuming lower-branch metallicities, and Pearson’s r = 0.32, p = 0.34 assuming upper-
branch metallicities). Therefore, even taking beaming effects into account we find no
evidence for a relation between host metallicity and the true gamma-ray energy release
in LGRBs
3.4 Discussion
We have compared our sample of LGRB hosts to a variety of samples from the general galaxy
population. From our comparison of these galaxies’ emission line ratios and ISM properties,
we see that LGRB hosts are not statistically representative of the general population out
to z ∼ 1. Instead, these galaxies are much more likely to be drawn from the same parent
population as metal-poor galaxies. From an examination of the L-Z relation, LGRB host
galaxies also appear to have lower metallicities than the general galaxy population for both
nearby (z < 0.3) and intermediate-redshift (0.3 < z < 1) comparisons. We also find that
this apparent low-metallicity trend cannot be attributed to any bias towards young stellar
population ages in these host galaxies.
The trend towards lower metallicities that is suggested by the L-Z comparison is further
confirmed when we consider the implications of the robust M-Z relation (Pearson’s r = 0.80,
p = 0.001) for LGRB host galaxies. From this, we can conclude that LGRBs tend to occur
in host galaxies with lower metallicities than the general population according to their
masses, and this that trend extends out to z ∼ 1, with an average offset of −0.50±0.19 dex
in metallicity. However, it is worth noting that this trend may become less pronounced
at higher redshifts, where star-forming galaxy metallicities are lower on average (e.g.,
59

Figure 3.9 The metallicity vs. redshift (top), Eγ,iso (center), and Eγ relations for our sampleof LGRB host galaxies. The hosts have been separated into redshift bins by color in orderto better illustrate redshift effects in these comparisons. Host galaxies with both lower-and upper-branch metallicities from the Kobulnicky & Kewley (2004) R23 diagnostic areindicated by lower and upper data points connected by dotted lines. Upper and lower limitsare indicated by arrows. Host galaxies with both upper and lower limits on their Eγ valuesare indicated by data points connected by solid lines. The five nearby LGRB host galaxiesincluded in the original Stanek et al. (2006) relation are marked with outer circles.
60

Kobulnicky & Kewley 2004, Shapley et al. 2004, Erb et al. 2006, Chary et al. 2007, Dave
& Oppenheimer 2007, Liu et al. 2008).
Interestingly, while this tendency towards lower-metallicity galaxies is evident in our
analyses, the physical explanation driving this trend remains unclear. The average
metallicity for our LGRB host sample is log(O/H) + 12 = 8.4 ± 0.3 according to the R23
Kobulnicky & Kewley (2004) diagnostic; however, the sample also includes two galaxies, the
z = 0.410 host of GRB 020819 and the z = 0.296 host of GRB 050826, with metallicities of
log(O/H) + 12 = 9.0 ± 0.1 and log(O/H) + 12 = 8.83 ± 0.1 respectively. GRB 020819 is
a “dark” GRB with no detected optical afterglow (for more discussion see 4.1), while GRB
050826 is a typical, even subluminous, z < 0.3 LGRB. The high metallicities of these hosts
challenge the proposed belief that LGRBs follow a strict “cut-off” metallicity imposed by
stellar evolution effects. Modjaz et al. (2008) propose a metallicity upper limit for LGRB
formation of log(O/H) + 12 < 8.66 according to the Kobulnicky & Kewley (2004) diagnostic
(Kocevski et al. 2009), which is contradicted by the host metallicities measured here.
Finally, we find no statistically significant correlation between host environment
metallicity and the gamma-ray energy release of LGRBs, a result that is at odds with the
predictions and observed relations of past work (e.g. MacFadyen & Woosley 1999, Ramirez-
Ruiz et al. 2002, Stanek et al. 2006). This is also at odds with the standard predictions of
metallicity-driven wind effects in LGRB progenitor evolutionary models.
Based on the work described above, the complexities of metallicity’s role in the
production of LGRBs and the evolution of their progenitors can be summarized by several
key results:
1. We have demonstrated that LGRBs do preferentially occur in galaxies with lower
metallicities than the general galaxy population, falling below the standard L-Z and
M-Z relations for star-forming galaxies.
2. There does not appear to be a strict cutoff metallicity for the host galaxies of LGRBs,
as has been previously proposed.
61
3. We find no evidence of a correlation between host metallicity and gamma-ray energy
release for these events.
The key assumptions that are refuted by items 2 and 3 - a correlation between lower
host metallicities and higher gamma-ray energy releases, and a proposed upper metallicity
cut-off for LGRB host galaxies - are based on the traditional collapsar model and current
assumptions regarding the effects of metallicity on massive star evolution. Specifically, under
the assumption of the collapsar model, lower-metallicity host environments are expected to
produce progenitors with higher angular momentum, which should in turn produce LGRBs
with higher Eγ,iso and/or Eγ (e.g. MacFadyen & Woosley 2001, Hirschi et al. 2005, Yoon et
al. 2006, Woosley & Heger 2006). However, current evolutionary models for massive stars
do not properly address the difficulties of modeling mass loss mechanisms, which may be
anisotropic (Meynet & Maeder 2007) and could also include complex effects such as wind
clumping (Crowther et al. 2002) and rotation-driven mass loss effects (Meynet & Maeder
2000). According to Dessart et al. (2008), current magnetohydrodynamic simulations of
low-metallicity massive stars actually produce core angular momenta that are too high
to generate GRB-producing collapsars. In future work, adopting complete and rigorous
treatments of mass loss components and magnetic processes in massive stellar evolutionary
models could potentially yield evolutionary pathways for collapsars that are not strongly
dependent on a strict cut-off for the progenitor’s natal metallicity.
Alternatively, it is also possible that these recent results regarding LGRBs and their host
metallicities may be in better agreement with other alternative progenitor pathways, such
as magnetar or binary scenarios. These models do not necessarily require a low-metallicity
environment for the evolution and development of the critical mechanism that produces a
LGRB (see, for example, Fryer & Heger 2005; Podsiadlowski et al. 2010). However, it is not
yet clear whether any of these possibilities can adequately address the phenomenon detailed
in item 1. We cannot yet provide a physical explanation for why LGRB hosts would only
have lower metallicities relative to their mass, rather than metallicities that are uniformly
low or fall below a particular threshold, although this may relate to the young progenitor
62

ages and star formation histories of the hosts (see Berger et al. 2007). For the moment
it is clear that, while a lower-than-average host metallicity is a key component of LGRBs,
the role of metallicity in progenitor evolution and LGRB production currently remains a
mystery. In the future, it would be helpful to extend the studies and comparisons shown
above to include more LGRBs across a greater range of redshifts. Subsequent work in this
area would also benefit greatly from an improved understanding, both observational and
theoretical, of the various mechanisms that drive mass loss and impact late-type evolution
in massive stars.
63

Chapter 4
Unusual Events and Their Host Galaxies
4.1 The High-Metallicity Host of the “Dark” GRB 020819
GRB 020819 was originally detected by the High Energy Transient Explorer 2 (HETE-2;
Ricker 1997), and found to have the energetic properties of a typical LGRB, with a duration
of T90 ∼ 20s and a peak brightness of ∼5 crab (Hurley et al. 2002, Vanderspek et al. 2002).
However, follow-up observations of the burst detected no optical afterglow to a limiting
magnitude of R = 22.2 and K ′ = 19 at only 9 hours after the burst; this lack of an optical
afterglow detection classifies GRB 020819 as a “dark” burst (Levan et al. 2002, Klose et
al. 2003). Frail & Berger (2002) detected a radio afterglow associated with the burst, and
Levan et al. (2002) found this position to be coincident with a clearly resolved galaxy at
R ∼ 19.8. Jakobsson et al. (2005) later confirmed that this galaxy, at a redshift of z = 0.410,
was the likely host of GRB 020819, with a chance superposition probability of 0.8%. The
radio afterglow is specifically located on a faint R ≈ 24 “blob” of emission, ∼3” from the
bright barred spiral host and assumed to be at the same redshift (Jakobsson et al. 2005).
Klose et al. (2003) speculate that the dark nature of GRB 020819 could be due to large
amounts of dust extinction in the host. Under this hypothesis, the optical afterglow could
have been extincted past the limits of detection by a high host AV . Jakobsson et al. (2005)
considered this possibility in the context of the host redshift. Using fits to the radio light
curve to predict maximum optical fluxes for a variety of afterglow models, they find that
64

a modest amount of extinction, AV ∼ 0.6-1.5 mag, is required to extinguish an optical
afterglow with a classical luminosity. However, it is also possible that the optical afterglow
of GRB 020819 is undetected due to intrinsically low optical luminosity, a scenario proposed
for other dark bursts (e.g., Fryer et al. 1999, De Pasquale et al. 2003, Jakobsson et al. 2004,
Rol et al. 2005).
The host galaxy of GRB 020819 has been included in our LGRB host survey (see
Chapter 2) and our comparisons of LGRB host galaxies with the general star-forming galaxy
population (see Chapter 3). Here we examine the host environment of this unusual GRB
in greater detail.
4.1.1 Observations
We obtained two separate spectra of the GRB 020819 spiral host galaxy using LRIS on the
Keck I telescope at Mauna Kea. On 2 November 2008 we obtained a spectrum of the host
galaxy’s nucleus, and on 19 November 2009 we obtained an additional spectrum of the star-
forming region associated with the GRB 020819 radio afterglow (Jakobsson et al. 2005).
Details of our observing setups are given in Table 2.1. In 2008 the slit was centered on a
nearby bright star and turned to the position angle that would place both the star and the
nucleus of the GRB 020819 host on the slit (PA = 345.88). In 2009, the slit was positioned
such that both the host galaxy nucleus and the “blob” designated as the explosion site by
Jakobsson et al. (2005) fell on the slit (PA = 9.5). As a result, the observations were not
taken at the parallactic angle. We observed the spectrophotometric standard GD 248 (Oke
1990) on both nights for flux calibration purposes.
From our 2008 observations, we detected [OII]λ3727, Hβ, [OIII]λ5007, Hα, and
[NII]λλ6548,6584 features in emission for the host galaxy nucleus. In 2009, problems
with the response of the blue side CCD unfortunately prevented detection of Hβ and
[OIII]λ5007 emission features in the explosion site spectra; however, [OII]λ3727, Hα, and
[NII]λλ6548,6584 emission features were detected at a redshift of z = 0.41, confirming
its association with the bright spiral host. Emission line fluxes were determined using the
65

Figure 4.1 Spectra of the GRB 020819 host galaxy nucleus (top; November 2008) andexplosion site (bottom; November 2009), showing the rest-frame optical emission linesdetected in the blue (left) and red (right).
IRAF task splot in the kpnoslit package to fit Gaussians to the line profiles. The detected
emission lines for the nucleus and explosion site spectra are shown in Figure 4.1.
4.1.2 ISM Properties
We find a total line-of-sight E(B − V ) = 0.71 mag for the nucleus of the GRB 020819 host
galaxy; when Galactic extinction E(B−V ) = 0.07 in the direction of the host (Schlegel et al.
1998) is accounted for, this suggests a host E(B−V ) = 0.64, or a host AV = 1.98, following
the Cardelli et al. (1989) reddening law. This AV exceeds the required host extinction
of AV ≈ 0.6 − 1.5 mag proposed by Jakobsson et al. (2005) to account for the absence
of an optical afterglow. In the absence of an Hβ detection in the “blob” spectrum, we
cannot determine an E(B − V ) for the explosion site. We adopt E(B − V ) = 0.71 as an
approximation for the amount of extinction present at the explosion site.
66
After finding that the host galaxy of GRB 020819 had a high metallicity, we applied
the Kewley & Dopita (2002) polynomial diagnostic based on the [NII]λ6584/[OII]λ3727
ratio, which is recommended over the R23 diagnostic for high-metallicity hosts where
log([NII]λ6584/[OII]λ3727) ≥ −1.2 following Kewley & Ellison (2008). Using this relation,
we find log(O/H) + 12 = 9.0 ± 0.1 for the nucleus of the GBR 020819 host galaxy. We
also adopt the [NII]λ6584/Hα diagnostic relation presented in Pettini & Pagel (2004), a
diagnostic independent of extinction effects, and find a metallicity of log(O/H) + 12 = 8.8
± 0.1. The discrepancy between these two metallicities is consistent with the systematic
offset seen between the two diagnostics (see Kewley & Ellison 2008 and references therein,
and Section 2.2.2).
From our spectrum of the explosion site, we similarly find log(O/H) + 12 = 9.0 ± 0.1
adopting the Kewley & Dopita (2002) [NII]/[OII] relation and log(O/H) + 12 = 8.7 ±
0.1 adopting the Pettini & Pagel (2004) [[NII]λ6584/Hα diagnostic. For these abundance
determinations we adopt the E(B − V ) = 0.71 associated with the nucleus of the host.
At lower E(B − V ) the metallicity derived from the Kewley & Dopita (2002) [NII]/[OII]
relation increases (and vice versa), but the Pettini & Pagel (2004) [NII]/Hα metallicity
stays constant. The metallicity measured at the explosion site is identical to that measured
at the nucleus to within the errors.
Adopting R magnitudes from Jakobsson et al. (2005), and M?R = −21.57 from Brown et
al. (2001), we find a luminosity of ∼ 2L? for the host galaxy and ∼ 0.05L? for the explosion
site. We determine a young stellar population age of 7.8 ± 0.9 Myr for the nucleus of the
GRB 020819 host galaxy, based on the rest-frame equivalent width of the Hβ emission line;
however, we are unable to apply this age determination to the explosion site due to our
lack of an Hβ emission line detection. For the nucleus we find an extinction-corrected star
formation rate of 23.6 M/yr based on the flux of the Hα line (Kennicutt 1998); for the
explosion site we find 10.2 M/yr.
67

4.1.3 Discussion
Our spectroscopic observations and metallicity diagnostics have demonstrated that GRB
020819 did not occur in a low-metallicity region of the spiral host, but rather that the
progenitor formed and evolved in a host environment with a high metallicity. Observations
of the host galaxy of GRB 050826 yield a similarly high metallicity of log(O/H) + 12 = 8.83
± 0.1 according to the Kobulnicky & Kewley (2004) R23 diagnostic, and both of these hosts
are set apart from the general LGRB host sample by their position on the mass-metallicity
relation shown in Figure 3.8. However, GRB 020819 is unique in that it is currently the
only LGRB with a high metallicity calculated for the actual explosion site, rather than a
more general global metallicity (as is the case for the GRB 050826 host).
The only other “dark” GRB host in our sample is the log(O/H) + 12 = 8.62 ± 0.1 host
of GRB 051022, which has the third-highest R23 metallicity in our sample following the
hosts of GRB 020819 and GRB 050826 (it is also worth nothing that these are the three
most massive host galaxies in our sample, with log(M?) > 10). The question of what role
high metallicity might play in the production of “dark” bursts is an intriguing one, and
requires a detailed comparison of the host environments and energetic properties of these
two bursts. While both the GRB 051022 and GRB 020819 host galaxies include a moderate
amount of extinction (AV = 1.55 for GRB 051022, AV = 1.98 for GRB 020819), we cannot
rule out the possibility that direct effects of higher metallicities on progenitor evolution
might be responsible for the “dark” nature of these bursts. For example, the enhanced
mass loss rates associated with higher metallicities could potentially contribute to large
amount of circumburst extinction, an artifact of larger amounts of mass lost during the
progenitor’s lifetime (e.g., Vink et al. 2001). This is particularly intriguing if anisotropies
in stellar winds and mass loss are considered for a single-star collapsar progenitor model.
Polar mass ejections remove much less angular momentum than equatorial ejections (Maeder
2002), making them an appealing mass loss mechanism for collapsars, particularly at high
metallicities. A polar mass loss mechanism could both permit the production of GRB
progenitors at higher metallicities by allowing higher rotation rates to be maintained, and
68
increase the circumburst extinction at the poles where the GRB itself is produced, leading
to increased extinction of the optical afterglow. However, the full implications that GRB
020819 and its unusual host environment have for our understanding of “dark” bursts and
their progenitor evolution still remain to be explored.
4.2 The Relativistic Supernova 2009bb
Relativistic supernovae (SNe) mark the explosive deaths of massive stars, and until recently
were discovered exclusively through their association with long-duration gamma-ray bursts
(LGRBs). Thanks to the discovery of several LGRBs at z ∼< 0.3, we now know that these
are Type Ic SNe (SNe Ic) with broad absorption lines (hereafter “broad-lined”; see Woosley
& Bloom 2006 and references therein). These LGRB-associated SNe are distinguished from
ordinary SN Ic explosions by the production of a relativistic outflow powered by a central
engine (an accreting black hole or neutron star) which gives rise to the gamma-ray emission
and a non-thermal afterglow (Piran 1999). A dichotomy is also indicated by their relative
rates, with just 0.1−1% of SNe Ic giving rise to an LGRB after accounting for collimation of
the ejecta (Soderberg 2006, Soderberg et al. 2006b, Guetta & Della Valle 2007). While these
relativistic ejecta are typically manifested in the form of LGRBs, this is not an exclusive
association (see, for example, X-ray flashes; Heise et al. 2001), and the gamma-ray emission
does not always dominate the total relativistic yield. For example, in the case of GRB
980425 and the associated SN 1998bw, the total energy released in high-energy emission
was dwarfed by the kinetic energy of the blast-wave by a factor of 100, as inferred from
radio observations (Kulkarni et al. 1998).
While there is growing evidence that LGRBs and SNe Ic share Wolf-Rayet (WR)
progenitor stars (e.g., Woosley et al. 2002), the critical physical ingredient that enables
only a small fraction to explode relativistically remains unknown. Numerical simulations of
the explosions indicate that high angular momentum may be the critical physical parameter
that sets LGRB progenitors apart from regular SNe Ic progenitors (e.g. MacFayden et al.
69

2001, Dessart et al. 2008). Since the metallicity-dependent line-driven winds of WR stars
serve to strip away angular momentum (Woosley & Heger 2006), low metallicity has been
proposed for LGRB progenitors as a means of reducing the line-driven mass loss rate and
sustaining this fast rotation - a relation M ∝ Z0.86 has been calculated for WN-type WR
stars (Vink & de Koter 2005).
Observations of nearby (z ∼< 0.3) LGRB host galaxies offer some support for this
theoretical prediction, with metallicities that are lower, on average, than those inferred
for the explosion sites of local broad-lined SNe Ic (Modjaz et al. 2008) and the standard
MZ relation (see Chapter 3). Modjaz et al. (2008) propose a cutoff metallicity for
LGRB formation of log(O/H) + 12 < 8.66 according to metallicities determined from the
Kobulnicky & Kewley (2004) R23 diagnostic (Kocevski et al. 2009). However, our work has
found that the host galaxies of both GRB 020819 and GRB 050826, as well as the specific
explosion site of GRB 020819, have R23 metallicities of log(O/H) + 12 > 8.66, suggesting
that such a strict “cut-off” metallicity for the formation of LGRB progenitors cannot be
readily assumed. We also see no clear relation between host metallicity and the energetic
properties of LGRBs. As a result, further observations of central engine-driven explosions
such as LGRBs are required to better understand any dependence that the SN explosion
properties might have on the inferred progenitor metallicities.
SN 2009bb marks the first relativistic SN discovered without a gamma-ray trigger. It was
first detected on 2009 Mar 21.11 (UT) in the nearby (d ≈ 40 Mpc) face-on spiral galaxy NGC
3278 (Pignata et al. 2009). Stritzinger et al. (2009) examined an optical spectrum of the
event and classified it as a broad-lined SN Ic. Radio observations revealed that SN 2009bb
also produced a relativistic explosion likely powered by a central engine. Such outflows have
previously only been observed in LGRBs; however, satellites reveal no detected LGRB in
association with SN 2009bb (Soderberg et al. 2010).
Here we present observations of the explosion site of the relativistic SN 2009bb. We
discuss the ISM properties derived for the host site and the implications that these have for
the progenitor of SN 2009bb and our understanding of engine-driven relativistic explosions.
70
4.2.1 Observations
We observed the SN 2009bb explosion environment with the MagE spectrograph (Marshall
et al. 2008) mounted on the Magellan/Clay 6.5m telescope on Apr 26.1 UT with a 1.0 arcsec
slit for 1800 sec in good conditions, obtaining data on a ∼1 arcsec2 (190 × 190 pc) region
centered on the explosion site (Figure 4.2). The extraction box was 1” × 0.75”. CCD
processing and spectral extraction were carried out with standard IRAF packages. The
data were extracted using an optimal extraction algorithm. Low-order polynomial fits to
calibration-lamp spectra were used to establish the wavelength scale, and small adjustments
derived from night-sky lines in the object frames were applied. The sky was subtracted from
the images using the method described by Kelson (2003). We employed IDL routines (see
Foley et al. 2009 and references therein) to flux calibrate the data and remove telluric lines
using the well exposed continuum of the spectrophotometric standard Hiltner 600 (Hamuy
et al. 1992).
Strong Balmer series emission lines from the underlying star-forming region dominate the
spectrum. We also clearly identify [OII]λ3727, [OIII]λλ4959,5007, [NII]λλ6548,6584, and
[SII]λλ6717,6731 emission lines, as well as the Na I D feature in absorption for the Milky
Way and the SN 2009bb host. To isolate the host galaxy emission at the explosion site, we
subtract a high order polynomial fit to the broad SN spectral features. The explosion site
spectrum both before and after the subtraction of the SN contribution is shown in Figure
4.3.
4.2.2 Physical Properties of the SN 2009bb Environment
We find a total line-of-sight E(B−V ) = 0.48 mag for the explosion site following the Cardelli
et al. (1989) reddening law, in excess of the Galactic E(B−V ) ≈ 0.098 mag in the direction
of SN 2009bb (Schlegel et al. 1998). We use this value to correct for extinction effects in
the observed fluxes measured from the emission line spectrum.
For SN 2009bb we can adopt the Kewley & Dopita (2002) polynomial relation between
the [NII]/[OII] ratio and metallicity, and find log(O/H) + 12 = 9.0 ± 0.1. We also determine
71

E
N
SN
10 asec
NGC 3278
Figure 4.2 An image of the host galaxy, NGC 3278, and SN 2009bb was obtained with theSWOPE telescope at Las Campanas Observatory shortly after explosion (see Pignata et al.2009 for details). Our MagE spectrum was obtained with a 10” x 1” slit centered on theSN at a position angle of 28 degrees.
72

Figure 4.3 Emission line spectrum taken at the SN 2009bb explosion site both before (grey)and after (black) subtraction of the supernova contribution.
a young stellar population age of 4.5 ± 0.5 Myr at the site of SN 2009bb, in good agreement
with the 3-5 Myr age range expected for Wolf-Rayet stars, particularly at high metallicities
(e.g., Schaerer et al. 1993 and references therein).
The host galaxy of SN 2009bb, NGC 3278, is a star-forming galaxy with a diameter of ∼1
arcmin. Broadband optical data indicate an integrated luminosity of MB = −19.98± 0.02
mag (Lauberts & Valentijn 1989), comparable to those of other nearby broad-lined SNe
Ic (Prieto et al. 2008, Modjaz et al. 2008). Mid-IR and radio observations reveal the host
galaxy to be luminous at longer wavelengths, reminiscent of starburst galaxies with elevated
star-formation rates. Observations of the host galaxy from the literature with the Infrared
Astronomy Satellite (IRAS; Sanders et al. 2003) and the Very Large Array (VLA; Mauch &
Sadler 2007), combined with our own measurements of the 617 MHz integrated flux with the
Giant Metrewave Radio Telescope (GMRT; see Soderberg et al. 2010 Suppl. Info), indicate
integrated luminosities of LIR ≈ 1.2× 1044 erg s−1 (8 - 1000 µm), L1.4GHz ≈ 1.3× 1037 erg
73

s−1, and L617MHz ≈ 1.3 × 1038 erg s−1, respectively. Adopting the SFR determinations of
Kennicutt (1998) and Yun & Carilli (2002), we estimate an integrated SFR ≈ 5−7M yr−1.
We construct radio-to-optical galaxy templates from Silva et al. (1998) and Yun & Carilli
(2002), and compare these with the observed spectral energy distribution (SED) for NGC
3278. As shown in Figure 4.4, the broadband SED of the host galaxy is most consistent with
an Sc spiral, indicative of a stronger SFR than a typical Sa galaxy and a lower SFR than
the extreme case of Arp 220. Soderberg et al. (2010) find that SN 2009bb coincides with
the brightest and bluest region of the galaxy, which is indicative of star-forming activity
and consistent with both regular Type Ic SNe and LGRBs (Kelly et al. 2008).
4.2.3 Comparison with Nearby (z < 0.3) Galaxy Samples
In Figure 4.5 we compare the SN 2009bb host to the L-Z relations for our samples of BCGs,
SNHGs, MPGs, and z < 0.3 LGRB host galaxies, as described in Chapter 3. From this
comparison, we can see that the SN 2009bb host falls above the general L-Z relation for the
star-forming BCGs. It occupies the same region of the diagram as the other Type Ic hosts
in the SNHG sample from Modjaz et al. (2008). Its placement is also quite similar to the
host galaxy of GRB 050826, the only LGRB host in our z < 0.3 sample that falls above the
BCG L-Z relation. Due to the host’s similarity with both Type Ic host galaxies and the
high-metallicity GRB 050826 host, we cannot draw any definitive conclusions as to whether
SN 2009bb was generated by an off-axis or extremely subluminous GRB, or by a unique SN
progenitor with no accompanying high-energy emission. Additional observations of LGRB
hosts at z < 0.3, along with a larger sample of Type Ic SN host galaxies, are required to
place this unusual event into context.
4.2.4 Discussion
SN 2009bb marks the first discovery of a relativistic SN in a high-metallicity environment;
previously, such observations have been restricted to SNe with accompanying GRBs in
low-metallicity environments. We find that the SN 2009bb explosion site has a very high
74

Figure 4.4 The spectral energy distribution is shown for the host galaxy, NGC 3278, fromradio to optical frequencies. We compiled integrated broadband flux densities for NGC 3278extending from the optical (Lauberts & Valentijn 1989) and near-IR bands (Two MicronAll Sky Survey; 2MASS), to the mid-IR (IRAS; Sanders et al. 2003) radio wavelengths(VLA; Mauch & Sadler 2007) and combined them with our 617 MHz measurements fromthe GMRT (this work). The galaxy is strongly star-forming (SFR ≈ 5 − 7 M yr−1) asevidenced by the bright mid-IR emission. In comparison with standard galaxy templates(gray lines, from Silva et al. 1998), the spectrum of the host galaxy is most consistent withthe broadband spectrum of an Sc galaxy with a star-formation which is elevated comparedto a standard Sa spiral galaxy, but not as high as Arp 220.
75

Figure 4.5 Comparison of the SN 2009bb host environment (yellow star) to the luminosityvs. metallicity relation for z < 0.3 galaxies. For comparison we include our sample of BCGs(dots), SNHGs (green squares), and MPGs (blue circles), and the low-redshift (z < 0.3)LGRB host galaxies (red stars) as described in 3.1. Solid green squares represent SNHGglobal galaxy spectra, while open green squares represent SNHG spectra taken at the siteof the supernova. The luminosity-metallicity relations for the BCG, MPG, and LGRB hostsamples are plotted as black, blue, and red solid lines, respectively. GRB 031203, whichcould potentially be contaminated by contribution from an AGN, is marked with an asterisk.
76

metallicity of log(O/H) + 12 = 9.0 ± 0.1, much higher than the average metallicity for
LGRB host galaxies (log(O/H) + 12 = 8.4 ± 0.3) but in good agreement with broad-lined
SNe Ic host galaxies (Modjaz et al. 2008) and the log(O/H) + 12 = 8.83 z = 0.296 host
of GRB 050826. The age of the young stellar population, the star formation rate of the
host galaxy, and the derived mass loss rate of the progenitor (Soderberg et al. 2010) are all
consistent with both broad-lined SNe Ic and LGRB host environments.
Like the explosion environment of GRB 020819, the host site of SN 2009bb is at
odds with several recent studies that propose a metallicity cut-off for environments that
can produce the relativistic explosions associated with LGRBs (e.g. Modjaz et al. 2008,
Kocevski et al. 2009). Combined with the lack of any observed correlation between
metallicity and Eg,iso (see 3.3), these two unusual events confirm the need for a more detailed
understanding of the effects that metallicity is expected to have on massive stellar evolution
and the physical mechanisms that govern the explosive properties of LGRB and relativistic
SN progenitors. However, these results do contradict the supposition that engine-driven
relativistic supernovae can only be produced by low-metallicity progenitors.
In addition, it is not clear how the progenitor of SN 2009bb compares to the population
of massive stars that are thought to produce LGRBs. Addressing this question requires
future host environment observations of more nearby engine-driven relativistic SNe, both
with and without gamma-ray triggers. Discovery of this event in the absence of any detected
accompanying LGRB (Soderberg et al. 2010) suggests that future searches for relativistic
SNe should pursue identification based on joint optical and radio observations rather than
being limited only to those accompanied by a gamma-ray trigger. With the Panoramic
Survey Telescope And Rapid Response System (Pan-STARRS; Kaiser et al. 2002) and the
Palomar Transient Factory (PTF; Law et al. 2009) surveys now online, we expect to discover
Ic supernovae and identify a relativistic subset with the Expanded VLA at a rate of ∼ 1
yr−1 (Soderberg et al. 2010). This will allow us to pinpoint and observe host environments
of relativistic events that may have otherwise gone undetected, and to assess the continuum
of events with and without gamma-ray emission.
77
4.3 The Environment of the z = 2.609 Short GRB 090426
As discussed in Chapter 1, the bifurcation of GRBs into “long” (>2 s) and “short” (<2
s) subclasses has encouraged the current belief that two distinct progenitor scenarios can
be assigned to these events. This thesis has focus primarily on events that have been
phenomenologically classified as LGRBs, which have been observationally linked to SNe Ic
and the core-collapse deaths of massive stars. However, the progenitors of SGRBs remain
poorly understood.
Recently, several lines of evidence have suggested that the true progenitor diversity
associated with GRBs does not map with one-to-one correspondence to this two-class
phenomenological landscape. In particular, several other progenitor scenarios have recently
entered the discussion. For example, a small fraction of SHBs probably originate from
massive flaring activity of extragalactic magnetars (highly magnetized neutron stars; Abbott
et al. 2008; Hurley 2008; Chapman et al. 2009). Classification of individual events even
among the two well-established cosmological groups has also proven extremely difficult. This
occurs both at the overlap region of the duration-hardness diagram where the population
distributions merge (at ∼1-2 s) and for much longer bursts. At least two LGRBs at low
redshift, GRB 060505 and GRB 060614, were not accompanied by observable supernovae
despite intense follow-up campaigns (Fynbo et al. 2006; Gehrels et al. 2006), and it is
still debated whether these events group most naturally with short-duration events, long-
duration events, or a new class entirely (e.g. Jakobsson & Fynbo 2007; Levesque & Kewley
2007; Lu et al. 2008; Thone et al. 2008; Xu et al. 2009). Most recently, the two highest
redshift GRBs detected to date, GRB 080913 at z = 6.7 and GRB 090423 at z = 8.2
(Greiner et al. 2009; Salvaterra et al. 2009; Tanvir et al. 2009; Zhang et al. 2009), were
observed to have rest-frame durations of <2 s, yet few have argued that these events did
not arise from massive stars.
To date, the strongest evidence that many SGRBs and LGRBs arise from different
progenitor populations comes from analysis of their respective host galaxy associations.
78

The host galaxies of LGRBs are observed to have blue colors and strong emission features
associated with high specific star formation rates (Stanek et al. 2006; Modjaz et al. 2008;
Berger 2009; Savaglio et al. 2009). The burst position, when well constrained, is nearly
always at small offset (Bloom et al. 2002) and typically traces the brightest regions of
the host galaxy (Fruchter et al. 2006), which itself is typically blue and morphologically
disturbed (Wainwright et al. 2007). LGRB host galaxies also have lower luminosities on
average compared to the galaxy population probed by surveys at similar redshifts (Stanek
et al. 2006, Fruchter et al. 2006, Kewley et al. 2007). In contrast, the host galaxies of
SGRBs to date have been observed to be much more heterogeneous, including both star-
forming and non-star-forming hosts. Afterglow offsets range from negligible to many times
the half-light radius of the putative host (Prochaska et al. 2006; Berger 2007; Bloom et al.
2007; Troja et al. 2008; Berger 2009).
It is in this context that we consider GRB 090426. This event has a “short” duration
of only 1.28 ± 0.09 s in the observer frame. We obtained an optical spectrum of the burst
afterglow - the first of its kind for a SGRB - and determined a surprisingly high redshift of
z = 2.609 for this event (most host galaxy associations for SGRBs are at z < 1), yielding a
rest-frame duration for the burst of only 0.35 s. Based on the classifications of past GRBs,
the probability of GRB 090426 belonging to the SGRB class is 92.8%. However, such
a high confidence indication could occur by chance given a sufficient number of detected
SGRBs. For ∼400 Swift LGRBs detected to date, the chance probability of detecting one
or more LGRBs with durations short enough to appear as short bursts with such high
confidence in this classification scheme is >90%. This marks a fundamental shortcoming in
the classification by high-energy properties alone, where the parameter distributions suffer
broad overlap, and motivates further investigation into the afterglow and host properties.
Here we use our afterglow spectrum, along with follow-up observations of the luminous
star-forming host, to probe the origins of this burst.
79

4.3.1 Discovery and Afterglow Observations of GRB 090426
GRB 090426 triggered the Burst Alert Telescope (BAT) on board the NASA Swift satellite
(Gehrels et al. 2004) at 12:48:47 on 2009 April 26 (UT). The X-Ray Telescope (XRT;
Burrows et al. 2005) began observing the field at 84.2 s after the trigger, and the
Ultraviolet/Optical Telescope (UVOT; Roming et al. 2005) followed at 89 s after the trigger.
UVOT detected a candidate optical afterglow at α = 12.h36.m18.s07, δ = +32.d59′09′′.6, which
was reported by Cummings et al. (2009) 13.8 minutes after the burst trigger. The optical
counterpart at these coordinates was also confirmed 43.5 minutes after the burst by Xin et
al. (2009) based on observations obtained 76 s after the burst with the Tsinghau-National
Astronomical Observatories Telescope at Xinglong Observatory in China. The Sloan Digital
Sky Survey shows no object near the position of the afterglow; the closest object is a faint
and extended source at α = 12.h36.m19.s49, δ = +32.d59′05′′.5, 18′′ away from the optical
afterglow with a photometric redshift of z ∼ 0.3 (D’Avanzo et al. 2009).
LGRB host galaxy observations for this thesis were serendipitously taking place at the
time of the burst trigger. We obtained a spectrum of the GRB 090426 optical afterglow using
the Keck Low-Resolution Imaging Spectrograph (LRIS; Oke et al. 1995) at 13:55 UT on
2009 April 26, ∼1.1 hr after the BAT trigger, making possible the first spectroscopic redshift
determination for a SGRB afterglow The observations were conducted in photometric
conditions with a seeing of ∼0.6′′. We obtained two 300 sec exposures on the LRIS blue
side using the long 1′′ slit mask, the 680 dichroic, and the 300/5000 grism, as well as six
600 sec exposures on the LRIS red side using the 400/8500 grating at a central wavelength
of 8100A. We observed internal flatfield lamps as well as spectra of Hg, Ne, Ar, Cd, and
Zn arc lamps to be used for wavelength calibration. We also obtained a 60 sec spectrum of
the spectrophotometric standard HZ 43 (Hamuy et al. 1992). The observations of the GRB
090426 afterglow were conducted at a high effective airmass of 3.05; HZ 43 was observed at
an effective airmass of 3.60.
The data were reduced using IRAF. We use the lrisbias IRAF task distributed by the
W. M. Keck Observatory to subtract overscan from the LRIS images, and apply a flatfield
80

Figure 4.6 Keck spectrum of the GRB 090426 afterglow. The spectrum was observed withLRIS on Keck I at 13:55 on 2009 April 26, ∼1.1 hr after the BAT trigger. The observationswere conducted in photometric conditions. The data were reduced using IRAF, and havebeen corrected for a heliocentric velocity of −16.88 km s−1. We plot both the observedwavelength (lower abscissa) and the rest-frame wavelength at our redshift of 2.609 (upperabscissa). We note detections of the Lyα, N V, Si II, C II, Si IV, and C IV features at thisredshift.
and wavelength correction based on our internal lamp observations. The spectrum was
extracted using an optimal extraction algorithm, with deviant pixels identified and rejected
based upon the assumption of a smoothly varying profile. We flux calibrated the data by
using our observations of HZ 43 to derive a sensitivity curve, which was then applied to
the GRB 090426 afterglow observation. Finally, we corrected for a heliocentric velocity of
−16.88 km s−1 and corrected the spectrum to rest-frame wavelengths. Our GRB 090426
afterglow spectrum is show in Figure 4.6.
81
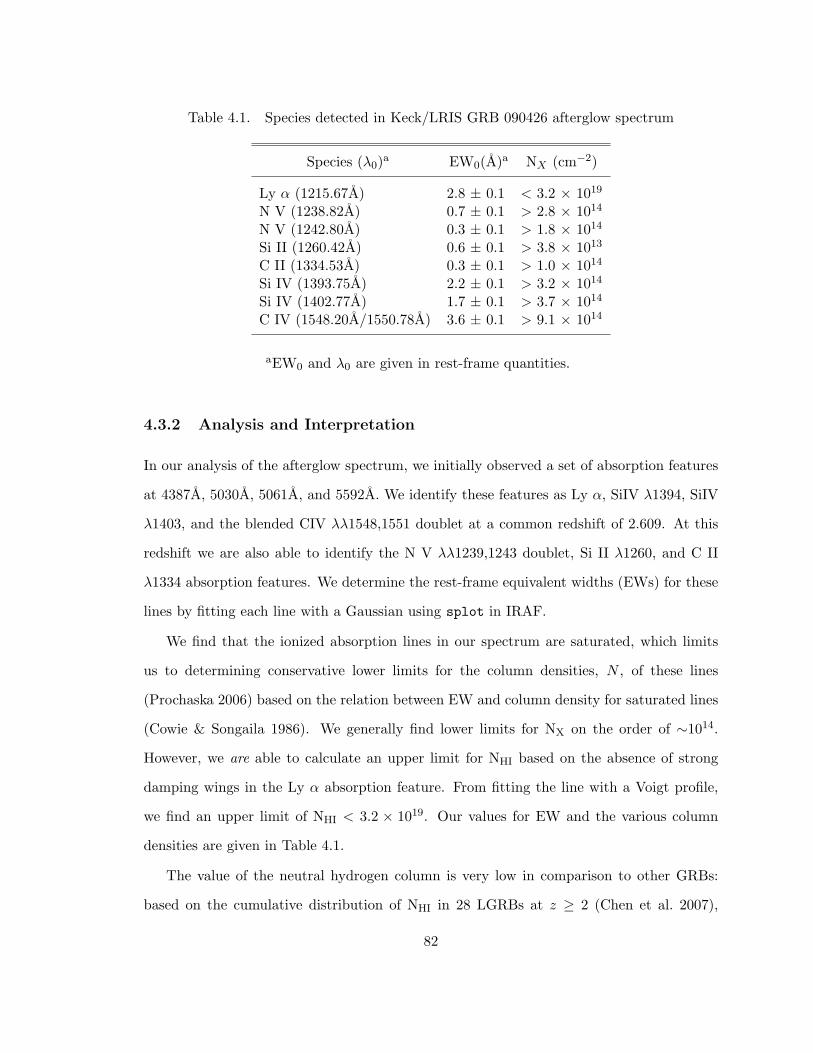
Table 4.1. Species detected in Keck/LRIS GRB 090426 afterglow spectrum
Species (λ0)a EW0(A)a NX (cm−2)
Ly α (1215.67A) 2.8 ± 0.1 < 3.2 × 10¹⁹
N V (1238.82A) 0.7 ± 0.1 > 2.8 × 10¹⁴
N V (1242.80A) 0.3 ± 0.1 > 1.8 × 10¹⁴
Si II (1260.42A) 0.6 ± 0.1 > 3.8 × 10¹³
C II (1334.53A) 0.3 ± 0.1 > 1.0 × 10¹⁴
Si IV (1393.75A) 2.2 ± 0.1 > 3.2 × 10¹⁴
Si IV (1402.77A) 1.7 ± 0.1 > 3.7 × 10¹⁴
C IV (1548.20A/1550.78A) 3.6 ± 0.1 > 9.1 × 10¹⁴
aEW0 and λ0 are given in rest-frame quantities.
4.3.2 Analysis and Interpretation
In our analysis of the afterglow spectrum, we initially observed a set of absorption features
at 4387A, 5030A, 5061A, and 5592A. We identify these features as Ly α, SiIV λ1394, SiIV
λ1403, and the blended CIV λλ1548,1551 doublet at a common redshift of 2.609. At this
redshift we are also able to identify the N V λλ1239,1243 doublet, Si II λ1260, and C II
λ1334 absorption features. We determine the rest-frame equivalent widths (EWs) for these
lines by fitting each line with a Gaussian using splot in IRAF.
We find that the ionized absorption lines in our spectrum are saturated, which limits
us to determining conservative lower limits for the column densities, N , of these lines
(Prochaska 2006) based on the relation between EW and column density for saturated lines
(Cowie & Songaila 1986). We generally find lower limits for NX on the order of ∼1014.
However, we are able to calculate an upper limit for NHI based on the absence of strong
damping wings in the Ly α absorption feature. From fitting the line with a Voigt profile,
we find an upper limit of NHI < 3.2 × 10¹⁹. Our values for EW and the various column
densities are given in Table 4.1.
The value of the neutral hydrogen column is very low in comparison to other GRBs:
based on the cumulative distribution of NHI in 28 LGRBs at z ≥ 2 (Chen et al. 2007),
82

we find that the afterglow of GRB 090426 has a lower NHI than ∼90% of GRB afterglow
spectra. Our GRB 090426 afterglow spectrum also appears to have weaker low-ionization
absorption (Si II, CII) than ∼95% of previous afterglow spectra. This sets GRB 090426
apart as atypical when compared to the host environments of LGRBs, which generally
have much stronger absorption features (Prochaska et al. 2008). However, even among
“typical” LGRBs such low column densities are not completely without precedent, and
a few long-duration GRB afterglow spectra are found to have similarly low NHI to GRB
090426. Typically, GRB afterglows with Lyα have column densities of NHI ≈ 1021 cm−2;
one notable exception is GRB 021004, which has NHI ≈ 1 × 1019 cm −2. It is suggested
that the low NHI measured in that afterglow spectrum is due to ionization of the neutral
hydrogen by the radiation field of the massive progenitor (Fynbo et al. 2005). Another
unusual LGRB afterglow is that of GRB 060607; with NHI = 6.3 × 1016 cm−2, it has the
lowest HI column density of any GRB afterglow. The GRB 060607 spectrum lacks any
detection of the N V lines, though it does show C IV and Si IV in absorption at the redshift
of the GRB (Prochaska et al. 2008). However, no host galaxy has been detected for GRB
060607 thusfar, down to an H-band limiting magnitude of AB(H) = 26.5 (Chen et al.
2009). By contrast, we do in fact detect the N V doublet in the afterglow spectrum of
GRB 090426. N V is thought to originate in the immediate circumburst environment of the
GRB, and this absorption feature is quite typical of most other observed GRB afterglows
(Prochaska et al. 2008).
Similarly, examples of systems with extremely weak low-ionization lines, while quite
rare, are not unprecedented among ordinary LGRBs: GRB 070125 and GRB 071003 were
both found to have extremely weak host Mg II absorption systems (Cenko et al. 2008, Perley
et al. 2008), indicative of a low-density galactic environment, possibly in a tidal tail or halo.
4.3.3 The Host Galaxy of GRB 090426
On 2009 May 21 (UT) we imaged the field of GRB 090426 using GMOS-S on Gemini-
South and the i band filter for 20 exposures of 180 seconds each, yielding one hour of total
83

Figure 4.7 False-colour optical image of the host galaxy field from combined i band datafrom GMOS-S on Gemini South and V band data from FOCAS on Subaru. A magnifiedregion of the host complex is inset at top right. The afterglow position identified by ourLRIS acquisition imaging is shown in both images as a yellow circle of radius 0.2 arcsec(2σ) and is consistent with the northeast component of the complex. The large galaxy 18arcsec to the East of the host complex is that noted by D’Avanzo et al. 2009.
integration time. Images were processed using archival twilight flats and fringe corrected
within the gemini package in IRAF. The following night (2009 May 22 UT) we acquired
additional imaging in the V band using the FOCAS instrument on Subaru. A total of 9
images of 300 seconds each were acquired for a total integration time of 45 minutes. Images
were processed using standard techniques in IRAF. Both optical images show a bright,
extended object with a complicated morphology (a bright, elongated object with fainter
lobes of emission to the northeast and south) near the afterglow location (Figure 4.7).
Finally, on the night of 2009 May 31 (UT) we imaged the field using NIRC on the Keck I
telescope. A total of 31 exposures of 1 min (10 coadds × 6 s) were acquired in K band, plus
84

Table 4.2. Photometry of the GRB 090426 Host-Galaxy Complex
Filter Date Telescope/Instrument Extended Host Compact Knot(2009 UT) (AB Magnitude) (AB Magnitude)
V May 22.26 Subaru / FOCAS 24.21± 0.15 24.73± 0.15i′ May 21.05 Gemini South / GMOS 24.09± 0.15 24.61± 0.18J May 31.30 Keck I / NIRC > 23.9 > 23.9H May 31.30 Keck I / NIRC > 23.5 > 23.5Ks May 31.35 Keck I / NIRC > 23.8 > 23.8
9 in the H band (also 10×6 s), and 9 in the J band (3 × 20 s). Images were processed and
stacked using a modified Python/pyraf script. No object consistent with the optical band
is detected in any filter. Based on a calibration to Two Micron All Sky Survey (2MASS)
standards observed in frames taken later in the night, we place 3σ limiting magnitudes on
the host galaxy flux of J > 23.0, H > 22.1, and K > 22.0.
To calculate the offset of the afterglow relative to the putative host galaxy, we aligned
both the LRIS acquisition image (taken the night of the burst) and the Subaru V band
observation to reference stars in the Sloan Digital Sky Survey, giving a position of α =
12h36m18s.05, δ = +3259′09′′.1. This position places the afterglow within 0.1 ′′ (800 pc in
projection) of the center of the northeastern lobe that we subsequently identify as the host
galaxy complex.
Aperture photometry of the brightest (central) region of the host, as well as the knot
at the afterglow location, was performed with IRAF using a 1” radius. The resulting
photometry, corrected for the modest Galactic extinction of E(B−V ) = 0.017 mag (Schlegel
et al. 1998), is presented in Table 4.2. In addition to the spatial coincidence, the identical
colors strongly suggest that the two objects are physically related. Interpolating to the flux
at 1700 A (see Reddy et al. 2008), the photometric magnitude of the northeast component
of the host corresponds to a rest-frame UV luminosity of approximately 0.7L?, or ∼2L? for
the entire host complex, indicating a luminous host galaxy.
85

Recently, Thone et al. (2010) obtained spectra of this galaxy using FORS2 at the VLT
on 2009 June 18 and 19. They find that the host complex consists of two interacting and
possibly merging galaxies, with a separation of only 9 kpc and redshifts of z = 2.61. This is
consistent with our afterglow redshift and confirms this complex as the host of GRB 090426.
4.3.4 Discussion
The duration classification of GRB 090426 is that of a SGRB; however, the progenitor of
this event remains unclear and highlights the current ambiguity faced in phenomenologically
classifying these events.
Several key afterglow and host environment properties suggest that this event may be
due to the collapse of a massive star despite its short duration. The detection of N V in the
afterglow spectrum and the significant circumburst density implied by the relatively bright
afterglow both indicate that the immediate circumburst environment of GRB 090426 is
comparable to other LGRBs. Antonelli et al. (2009) also find that this burst is consistent
with the correlation between peak energy and isotropic energy for LGRBs proposed by
Amati et al. (2008), and note that most SGRBs are significant outliers to this correlation.
Finally, Thone et al. (2010) find that the host is actively forming stars, consistent with
current expectations for LGRB host galaxies.
The implications of a massive star progenitor for GRB 090426 are profound. This
suggests that the mechanism that produces GRBs during the death of the massive progenitor
is capable of operating on timescales as short as ∼0.3s, imposing strong demands on the
central engine. These inferences also cast doubt on the classification of a large population of
what would otherwise have been considered classical SGRBs; if GRB 090426 had occurred
at the z = 0.2 − 0.3 redshift of the SGRBs 050509B and 050724, it would have still been
unambiguously classified as a SGRB according to its duration. It is this last point in
particular that illustrates the insufficiency of duration alone as a classification criterion.
When considering only duration, there is no clear distinction between GRBs 090426,
050509B, and 050724. However, an examination of the hosts reveals that both GRB 050509B
86

and 050724 have elliptical host galaxies with stellar populations and SFRs that cannot
produce the young massive progenitors of classical LGRBs (Berger 2009). As a result, GRB
090426 is a powerful demonstration of the importance of GRB host galaxies - particularly
their physical properties, stellar populations, and subsequent progenitor evolution - in future
phenomenological studies of these enigmatic events.
87

Chapter 5
Stellar Population Synthesis and Photoionization
Models - Design and Applications
5.1 Introduction
Robust analysis of star-forming galaxy emission-line spectra can provide constraints on
key physical parameters of the ionizing radiation field and the interstellar medium (ISM).
The star formation rates (SFRs) of these galaxies can be estimated from luminosities of
the Hα line (Hunter & Gallagher 1986, Kennicutt 1998, Bicker & Fritze-v. Alvensleben
2005, Kewley et al. 2007) or the [OII] line (Gallagher et al. 1989, Kennicutt 1998, Rosa-
Gonzalez et al. 2002, Kewley et al. 2004, Moustakas et al. 2006), and multiple studies
have examined the use of the Hβ equivalent width to estimate the age of the young stellar
population in galaxies (Schaerer & Vacca 1998, Gonzalez Delgado et al. 1999, Fernandes
et al. 2003, Martin-Manjon et al. 2008). Metallicity is another critical parameter in the
study of star-forming galaxy ISM environments, shedding light on star formation histories
and subsequent chemical evolution. A variety of optical emission line ratio diagnostics have
been presented and employed to determine metallicities, including measuring the [OIII] line
ratios to determine electron temperatures (and therefore abundances, e.g. Peimbert 1967,
Garnett 1992), and use of the [NII]λ6584/Hα and [NII]λ6584/[OIII]λ5007 ratio diagnostics
from Pettini & Pagel (2004), the [NII]λ6584/[OII]λ3727 ratio from Kewley & Dopita (2002),
and the ([OIII]λ5007 + [OIII]λ4959 + [OII]λ3727)/Hβ (R23) ratio (e.g., Pagel et al. 1979,
88

McGaugh 1991, Zaritsky et al. 1994, Pilyugin 2000, Charlot & Longhetti 2001, Kewley &
Dopita 2002, Kobulnicky & Kewley 2004).
Baldwin et al. (1981) present the technique of plotting optical emission line ratios,
such as [NII]λ6584/Hα vs. [OIII]λ5007/Hβ, on a series of diagnostic diagrams to separate
extragalactic objects according to their primary excitation mechanisms. These and other
diagrams were later used by Veilleux & Osterbrock (1987) to derive a semi-empirical
classification scheme to distinguish between star-forming galaxies and active galactic nuclei.
Kewley et al. (2001) used these same diagrams to derive a purely theoretical classification
scheme, which was later extended by Kauffmann et al. (2003a) and Stasinska et al. (2006)
using data from the Sloan Digital Sky Survey. Emission line diagnostic diagrams can also
be used to probe the shape of the far-ultraviolet ionizing spectrum of a galaxy (Dopita et
al. 2000, Kewley et al. 2001, Kewley & Dopita 2002). As a result, diagnostic ratio grids are
often employed to test the agreement of stellar population synthesis and photoionization
model grids with emission-line ratios measured in observations of star-forming galaxies.
These comparisons effectively illustrate the evolution and improvements of such models,
and are also useful in highlighting the shortcomings of different grids and the challenges
faced in modeling these galaxies and their emission spectra.
Kewley et al. (2001) use both the Starburst99 (Leitherer et al. 1999) and Pegase
(Fioc & Rocca-Volmerage 1997) evolutionary synthesis models in conjunction with the
Mappings III photoionization code (Binette et al. 1985, Sutherland & Dopita 1993) to
compute photoionization models that they compare to a sample of 157 warm IR starburst
galaxies on a variety of optical emission line ratio diagnostic diagrams. They find that
assuming a continuous star formation history is more realistic than the assumption of
a single instantaneous burst. Moy et al. (2001) find a similar result; using the Pegase
evolutionary synthesis models and the CLOUDY photoionization code (Ferland 1996) they
model young stellar populations along with underlying older stellar populations, and find
that underlying populations with continuous star formation histories are more compatible
with observed spectra of starburst galaxies. Fernandes et al. (2003) also find support for
89

modeling underlying stellar populations in their population synthesis analysis of starburst
and HII galaxies, using the Bruzual & Charlot (1993) evolutionary synthesis code.
Kewley et al. (2001) do, however, find that the ionizing spectra produced by the
Starburst99 models are not hard enough in the far ultraviolet (FUV) region of the spectrum
to reproduce the observed line ratios, and propose that including the effects of continuum
metal opacities in stellar atmospheres should be a way of improving future models. This
deficiency in the FUV ionizing spectrum is noted in Panuzzo et al. (2003) and Magris et al.
(2003). Starburst99 models at the time used older stellar atmosphere models that do not
include treatments of opacities beyond hydrogen and helium (Schmutz et al. 1992), or else
are not complete at the high temperatures or masses that prove critical when modeling the
FUV ionizing radiation field (Rauch 1997, Lejeune et al. 1997, 1998).
Another challenge that is common among previous stellar population synthesis and
photoionization models is a difficulty in modeling the environments of metal-poor galaxies
(e.g. Fernandes et al. 2003, Dopita et al. 2006, Martin-Manjon et al. 2008). Dopita
et al. (2006) use the latest Starburst99 code from Vazquez & Leitherer (2005) and the
Mappings III photoionization code to generate models of isobaric dusty HII regions, as well
as integrated galaxy spectra that model the galaxies as composites of multiple HII regions.
Dopita et al. (2006) removes the ionization parameter (q) as a free parameter, fixing the
ISM pressure and central cluster mass and instead allowing q to vary with time, pointing
out that q also varies with metallicity. Dopita et al. (2006) find that these models still
do not reproduce the observed emission line diagnostic ratios of lower-metallicity galaxies
(Z < 0.4Z). They also note that the ionizing fluxes are not hard enough to agree with the
integrated spectra. Martin-Manjon et al. (2008, 2009) take a different approach, using sets
of stellar yields from Gavilan et al. (2005) to model the chemical evolution of HII galaxies,
allowing metallicity to evolve with age rather than generating a grid with a range of fixed
metallicities. They also use the newer generation of CLOUDY (Ferland et al. 1998) to model
environments that have undergone multiple bursts of star formation (Martin-Manjon et al.
90

2009), but still find that these models don’t account for the most metal-deficient HII galaxies
in their sample.
Metal-poor galaxies are an important avenue of study in their own right. With a gas-
phase oxygen abundance of log(O/H) + 12 < 7.9 (Yin et al. 2007), they offer a relatively
pristine pre-enrichment ISM in which star formation, as well as current and previous
episodes of enrichment, can be examined (Brown et al. 2008). These galaxies also pose
challenges to scenarios seeking to reproduce their metal-poor environments through a variety
of evolutionary mechanisms (see Kewley et al. 2007 and references therein). It has also
recently been proposed that the host galaxies of long-duration gamma-ray bursts belong
to the metal-poor galaxy population (Stanek et al. 2006, Fruchter et al. 2006, Kewley et
al. 2007, Modjaz et al. 2008), a conclusion supported by this work (see 3.1, 3.2). Proper
modeling of these galaxies is critical to our understanding of the star formation processes
and evolving stellar populations present in such environments.
Here we present models generated using the Vazquez & Leitherer (2005) Starburst99
stellar population synthesis code and the latest generation of the Mappings III code,
with recent improvements that include a more rigorous treatment of dust (Groves et al.
2004). Our models are tailored towards addressing the difficulties found in past work
with producing a harder FUV spectrum; we do this by adopting the WMBASIC stellar
atmosphere models of Pauldrach et al. (2001) and the CMFGEN Hillier & Miller (1998)
atmospheres, both of which include the rigorous treatments of continuum metal opacities
that were suggested in Kewley et al. (2001; see also the work of Smith et al. 2002). Our grid
was also designed to precisely model the emission line flux of the local galaxy population,
including low-metallicity galaxies, adopting the full range of metallicities available in the
evolutionary tracks published by the Geneva group (Schaller et al. 1992; Schaerer et al.
1993a, 1993b; Charbonnel et al. 1993).
We describe our new grid of stellar population synthesis models, detailing the inputs
and free parameters that we adopt when generating the grid and examining the ionizing
FUV spectra that are produced by Starburst99 in detail. We consider how these spectra
91

affect the behavior of a variety of optical emission line diagnostics. With these diagnostic
ratios, we generate a series of optical emission line diagnostic diagrams, and compare our
model grids to spectra of a variety of nearby (z ≤ 0.1) star-forming galaxy populations,
our sample of LGRB host galaxies, and previous modeling work. We also investigate the
possibility of using later-age stellar population synthesis models to probe the older stellar
populations of LGRB host galaxies. Finally, we summarize the results of these comparisons
and discuss potential future work in this area.
5.2 Starburst99/Mappings III Model Grids
5.2.1 Model Grid Parameters
To model our sample of galaxies we have used the Starburst99 code (Leitherer et al. 1999,
Vazquez & Leitherer 2005) to generate theoretical spectral energy distributions (SEDs),
which in turn were used in the Mappings III photoionization models to produce model
galaxy spectra that could be compared to our observations.
Starburst99 is an evolutionary synthesis code that can be used to generate synthetic
ionizing far-ultraviolet (FUV) radiation spectra as a function of metallicity, star formation
history, and the age and evolution of the stellar populations. These populations are
produced by use of model stellar atmospheres and spectra along with evolutionary tracks
for massive stars. For this work, we have used a Salpeter initial mass function (α
= 2.35, Salpeter 1955) with a 100M upper mass boundary, along with Starburst99’s
“Pauldrach/Hillier” model atmospheres. These employ the WMBASIC wind models of
Pauldrach et al. (2001) for younger ages when O stars dominate the luminosity (< 3 Myr),
and the CMFGEN Hillier & Miller (1998) atmospheres for later ages at which Wolf-Rayet
stars are dominant. This differs from the Starburst99 models presented in Dopita et al.
(2000) and Kewley et al. (2001), which adopt the plane-parallel Lejeune et al. (1997) grid
of atmosphere models along with the Schmutz et al. (1992) extended model atmospheres
for stars with higher winds. The Schmutz et al. (1992) models, which include the critical
92

Wolf-Rayet phase, only include continuous opacities for hydrogen and helium, neglecting
what are expected to be considerable effects from continuum metal opacities. Kewley
et al. (2001) suggest this as a potential shortcoming in their models, proposing that the
inclusion of continuum metal opacities will result in a fraction of higher-energy radiation
being absorbed and reemitted at lower energies, in the region of the FUV spectrum that is
responsibly for ionizing the optical emission lines. The Pauldrach et al. (2001) and Hillier &
Miller (1998) model atmospheres address this shortcoming by including rigorous non-LTE
treatments of metal opacities. In conjunction with the Pauldrach/Hillier atmospheres we
also adopt two different sets of evolutionary tracks produced by the Geneva group, and
consider the particulars of these tracks’ mass loss rates (see 5.2.2). Starburst99 generates
the final synthetic FUV spectrum output through use of the isochrone synthesis method
first introduced by Charlot & Bruzual (1991), fitting isochrones to the evolutionary tracks
across different masses rather than discretely assigning stellar mass bins to specific tracks.
The resulting FUV spectrum is then taken as input by the Mappings III code. The
Mappings shock and photoionization code was originally developed by Binette et al. (1985),
improved by Sutherland & Dopita (1993), and used in Dopita et al. (2000) and Kewley
et al. (2001). The recent improvements to the Mappings code, used in Dopita et al.
(2006) and Snijders et al. (2007), include a more sophisticated treatment of dust which
simulates the effects of absorption, charging, and photoelectric heating by the grains -
for a more detailed discussion, see Groves et al. (2004) and Snijders et al. (2007). We
take the synthetic ionizing FUV spectrum output of Starburst99 and an adopted nebular
geometry model, which we assume to be plane-parallel. Kewley et al. (2001) find that
plane-parallel and spherical nebular geometries in the Mappings models produce equivalent
results, although the effects of other nebular geometries (such as those simulating structural
inhomogeneities) are unknown at this time. We select a variety of electron densities and
ionization parameters as inputs for the Mappings III code. Using these parameters we
compute a complete grid of plane-parallel isobaric (constant gas plus photon pressure;
Groves et al. 2004) photoionization models.
93

When generating our Starburst99/Mappings III model spectra, we adopted a broad grid
of input parameters to facilitate comparison with a wide range of galaxy samples:
Star Formation History (SFH): We model both a zero-age instantaneous burst of star
formation, with a fixed mass of 106M, and a continuous SFH where the star formation rate
(SFR) is constant at a rate of 1 M per year, starting from an initial time and assuming a
stellar population that is large enough to fully sample the IMF at high masses.
Metallicity: We adopt the full range of metallicities available from the evolutionary
tracks of the Geneva group, which includes five metallicities of z = 0.001 (Z = 0.05Z),
z = 0.004 (Z = 0.2Z), z = 0.008 (Z = 0.4Z), z = 0.02 (Z = Z), and z = 0.04
(Z = 2Z). Note that for these older models, Z is taken to be log(O/H) + 12 = 8.93,
following Anders & Grevesse (1989).
Evolutionary Tracks: We adopt the two evolutionary tracks of the Geneva group that
are currently available in Starburst99: the Geneva “Standard” mass loss tracks, and the
Geneva “High” mass loss tracks. The differences in these tracks are discussed in more detail
in 5.2.2.
Age: We generate models ranging in age from 0 to 5 Myr in 0.5 Myr increments for
the case of an instantaneous burst star formation history. For the continuous SFH models
we adopt a constant age of 5 Myr, the age at which a continuous SFH stellar population
reaches equilibrium (Kewley et al. 2001). Further discussion of the age range of these model
grids can be found in 5.2.3.
Ionization parameter: The ionization parameter q (cm s−1) can be thought of as the
maximum velocity possible for an ionization front being driven by the local radiation field.
The value itself is calculated for the inner surface of the nebula. By this definition q
relates to the dimensionless ionization parameter U by U ≡ q/c, where U = S∗/nHc,
where S∗ is the ionizing flux per unit area, nH is the hydrogen density, and c is the
speed of light (Groves et al. 2004). Rigby & Rieke (2004) find a range of −3 < log
U < −1.5 for the dimensionless ionization parameter in local starburst galaxies. In our
model grid, we adopted seven different values for our ionization parameter q, where q =
94
1×10⁷, 2×10⁷, 4×10⁷, 8×10⁷, 1×10⁸, 2×10⁸, and 4×108 cm s−1). These values correspond
to dimensionless ionization parameters of log U ≈ −3.5,−3.2,−2.9,−2.6,−2.5,−2.2, and
−1.9, respectively. While these are slightly lower than the log U values found in Rigby
& Rieke (2004), they are similar to the range of ionization parameters adopted in Kewley
(2001) and Snijders et al. (2007).
Electron density: Dopita et al. (2000) find ne = 10 cm−3 to be typical of giant
extragalactic HII regions, while Dopita et al. (2006) constrain the electron density in their
models of HII regions to ne ∼< 100 cm−3. In addition, Kewley et al. (2001) find an average
electron density ne = 350 cm−3 for the Kewley et al. (2000) sample of warm infrared
starburst galaxies. Since we wish to compare our models to normal and low-metallicity
star-forming galaxies, which are expected to have lower ne than those found in the gas-rich
warm infrared galaxies, we adopt two different electron densities in our full model grid,
adopting both ne = 10 cm−3 and ne = 100 cm−3. We assume an isobaric density structure
for these models, and thus ne is specified by the dimensionless pressure/mean temperature
ratio. We found that the lower ne = 10 cm−3 produced only a very slight decrease in ionizing
flux flux for the more q-sensitive emission features at higher metallicities; the change in ne
did not impact the overall agreement of the model grid with our comparison samples. For the
remainder of this paper, we therefore present results that adopt ne = 100 cm−3, following
the findings of Kewley et al. (2001) for starburst galaxies, and note that results adopting
ne = 10 cm−3 are comparable.
5.2.2 Stellar Evolutionary Tracks
Currently, Starburst99 includes two different evolutionary tracks produced by the Geneva
group, which differ primarily in their treatment of mass loss rates for massive stars. Mass
loss rates are a critical parameter when considering the contributions of massive stars to
ISM enrichment (Maeder & Conti 1994).
The “standard” (STD) mass loss evolutionary tracks were originally published in a
series of papers by the Geneva group (Schaller et al. 1992; Schaerer et al. 1993a, 1993b;
95

Charbonnel et al. 1993). These models adopt mass loss rates throughout the HR diagram
from de Jager et al. (1988) that are scaled with metallicity according to the models of
Kudritzki et al. (1989), where M ∝ Z0.5. Wolf-Rayet (WR) stars are an exception - the
mass loss rates for these stars are taken from Langer (1989) and Conti (1988) and include
no correction for initial metallicity effects.
The “high” mass loss evolutionary tracks (HIGH), published in Meynet et al. (1994),
include enhanced mass loss rates, meant to more realistically reproduce observations of
low-luminosity Wolf-Rayet stars and blue-to-red supergiant ratios in the Magellanic Clouds
(Schaller et al. 1992, Meynet 1993). The adopted mass loss rates are derived by doubling
the rates adopted by the “standard” grid from de Jager et al. (1988), as well as doubling
the “standard” mass loss rate assumed for late-type WN-type WR stars. The mass-loss
rates for early-type WN WR stars and later stages of WR stars (WC and WO) were left
unchanged - for a complete discussion, see Meynet et al. (1994). Again, the mass loss rates
of WR stars are left uncorrected for initial metallicity effects.
While many advances have since been made in our understanding of stellar physics,
adopting these tracks in our stellar population synthesis models is still scientifically sound.
The STD mass loss tracks are the more applicable of the two when considering recent work
on the effects that wind clumping has on mass loss rates (Crowther et al. 2002); however,
the HIGH mass loss tracks produce a reasonable approximation of the enhanced mass loss
rates resulting from the effects of rotation, when surface mixing results in an earlier start of
the WR phase (Meynet, private communication). Rotation is an important component
of stellar evolution that is expected to have considerable influence on the Starburst99
ionizing spectrum and the agreement of these models with observations at low metallicity in
particular (Leitherer 2008). Since the effects of rotation are not explicitly included in these
tracks, the HIGH mass loss tracks can be considered a more appropriate approximation of
the rotation-driven mass loss undergone by massive stars.
96

5.2.3 Starburst99 Ionizing Spectra
The far-ultraviolet (FUV) ionizing spectra produced by Starburst99 are primarily influenced
by age and metallicity. The effects of a changing model age derive largely from the evolution
of the massive stellar population, and are easily examined in our models which adopt an
instantaneous burst model of star formation - this star formation history allows us to observe
the effects of a single stellar population that is formed at 0 Myr and evolves uniformly.
By contrast, for the continuous SFH models, we set the age constant at 5 Myr. This
age describes an active (emission-line) star-forming galaxy, where the number of stars being
formed is equal to the number of stars dying. At younger ages this equilibrium is not yet
reached, and at older ages there is little to no evolution in the FUV ionizing spectrum
produced by the stellar population. This is consistent with the evolution of continuous SFH
models for starburst galaxies, as described in Kewley et al. (2001).
Figure 5.1 (left) shows the FUV spectra generated when adopting an instantaneous burst
SFH and the HIGH evolutionary tracks, plotted from 0 Myr to 6 Myr in 1 Myr increments
for our full range of metallicities. The hardness of the spectra decreases with age for this star
formation history, most noticeably in the higher-energy regime of the spectra (100-300A),
a result of the massive stellar population evolving out of the OB main sequence phase.
It is apparent that the behavior of the FUV spectrum differs dramatically across the
different metallicities. The low-metallicity spectra maintain a significantly harder ionizing
spectrum throughout their evolution as compared to the Z = Z and Z = 2Z model
spectra. Since high-metallicity stars spend a larger fraction of their high-energy photons
ionizing their own atmospheric metals (due to the increased effects of line blanketing), there
is a resulting depletion of high-energy photons available to ionize the surrounding ISM,
which leads to a softer radiation field (Snijders et al. 2007). The effective temperatures of
massive stars are also higher at lower metallicities across similar spectral types due to a
shift of the evolutionary limits of hydrodynamic equilibrium (the Hayashi limit; Hayashi &
Hoshi 1961) to warmer temperatures at lower metallicities (Elias et al. 1985; Levesque et
al. 2006), resulting in a hotter environment and harder spectrum in the case of our low-
97

metallicity spectra. Finally, main sequence lifetimes are longer at low metallicities as a
result of lower mass loss rates, leading to a greater amount of time spent in the hot main-
sequence evolutionary phases and a larger contribution to the ionizing radiation field that
extends to later ages (e.g. Meynet et al. 1994, Maeder & Conti 1994).
Figure 5.1 (left) also indicates that the Wolf-Rayet (W-R) phase for these galaxies
contributes to a hardening of the ionizing spectrum, producing a distinctive bump in the
high-energy region of the spectrum. The net effect of this population is only visible in the
high-Z ionizing spectra, appearing from 3 to 5 Myr in the Z = Z spectrum, and from 4
to 6 Myr in the Z = 2Z. The wind-driven ISM enhancement by W-R stars is stronger
and longer at high metallicities, and the minimum mass required to reach the W-R stage
decreases at higher metallicities (taken to be 85 M at Z = 0.05Z as compared to 40M
at Z = Z for the Geneva models used here; Schaller et al. 1992).
However, the most pronounced change in the spectra occurs at ages later than 5 Myr.
For the 6 Myr model, there is a dramatic drop in the hardness of the spectra at ∼ 225
A, coinciding almost perfectly with the ionizing wavelength of [OIII]. This behavior is
consistent with the origin of the FUV spectrum for this SFH. An instantaneous burst of
star-formation at 0 Myr will result in a single coeval population of massive stars as the sole
source of ionizing radiation, decreasing the hardness of the FUV spectrum at later ages as
the hottest massive stars (and therefore the dominant contributors of ionizing radiation),
evolve rapidly off the main sequence and end their lives. The lifetimes employed in the
Geneva models give the explanation for the behavior of the FUV spectra shown here; the
main-sequence (H-burning phase) lifetimes of a typical hot massive star of initial mass 40
M all terminate at an age of 5 Myr or earlier (Schaller et al. 1992, Schaerer et al. 1993b,
Charbonnel et al. 1993). As a result, beyond 5 Myr the dominant massive stellar population
is comprised mainly of lower-mass (≤ 25 M) stars that are beginning to evolve redwards on
the Hertzsprung-Russell diagram, and producing insufficient ionizing radiation at shorter
wavelengths (∼< 225 A) to generate the line fluxes we observe for highly ionized species.
98

Because of this lack of ionizing photons, we restrict our photoionization grids generated for
an instantaneous star formation history to 5 Myr and younger.
In practice, stellar populations in star-forming galaxies are thought to originate from
episodic bursts of star formation, or from a continuous SFH. For example, Izotov & Thuan
(2004) find evidence of current ongoing star formation with an age of about 4 Myr in the
extremely low-metallicity galaxy I Zw 18. In addition, they detect supergiant populations
that indicate an intense star formation episode occuring 10-15 Myr ago and evidence of still
older stellar populations with ages of hundreds of Myr. Noeske et al. (2007a, 2007b) examine
2905 star-forming galaxies from the All Wavelength Extended Groth Strip International
99

Fig
ure
5.1
Left:
FU
Vsp
ectr
age
nera
ted
byth
eSt
arbu
rst9
9co
dead
opti
ngan
inst
anta
neou
sbu
rst
SFH
.The
spec
tra
wer
ege
nera
ted
usin
gth
eG
enev
aH
IGH
evol
utio
nary
mod
els,
show
ing
the
prog
ress
ion
ofth
esp
ectr
aw
ith
age
in1
Myr
incr
emen
tsfo
rth
efu
llra
nge
ofm
etal
licit
ies.
At
5M
yrth
eF
UV
spec
tra
gene
rate
dby
Star
burs
t99
assu
min
gan
cont
inuo
usSF
Har
eal
sosh
own
(dot
ted
line)
.Io
niza
tion
pote
ntia
lsfo
rth
ere
leva
ntel
emen
tsar
em
arke
don
the
x-ax
is.
Rig
ht:
Subt
ract
ion
ofth
eF
UV
spec
tra
whe
nad
opti
ngth
eG
enev
aH
IGH
evol
utio
nary
trac
ksan
dth
eST
Dev
olut
iona
rytr
acks
;H
IGH−
STD
ispl
otte
d.In
both
pane
lsth
ew
avel
engt
hsar
epl
otte
don
alo
gsc
ale.
100

Survey (AEGIS), and find that the dominant star formation mechanism in these galaxies
appears to be a gradual decline of the average star formation rate, as opposed to a series
of episodic bursts that decrease in frequency. Previous grids of stellar population synthesis
models also find that the assumption of a continuous SFH, with the presence of underlying
older stellar populations, is more appropriate than a single instantaneous burst in most
cases (Kewley et al. 2001, Moy et al. 2001, Fernandes et al. 2003, Barton et al. 2003). This
suggests that, rather than modeling a single burst of star-formation at 0 Myr (the current
approach in Starburst99 for a burst-like SFH), a continuous SFH or multiple bursts of star
formation through time would be a more realistic treatment for modeling spectra of star-
forming galaxies (see also Lee et al. 2009). The instantaneous burst models presented here
can therefore be employed mainly as an approximation of a burst-like SFH, representing a
lower limit on star formation, while our continuous star formation models can be considered
an upper limit.
After examining the behavior of the FUV spectra when adopting the HIGH evolutionary
tracks, we can then compare these to the FUV spectra produced from the STD evolutionary
tracks, subtracting the two spectra to examine their differences in greater detail (Figure
5.1, right). In this comparison, we can see that the largest differences occur at higher
metallicities (Z = 0.4Z, Z, and 2Z) and in the 3 to 6 Myr age range, coinciding
with the ionizing flux contribution of the mass-loss-sensitive Wolf-Rayet phase. Additional
discrepancies at later ages focus on the age of the 225A drop, which is also expected to vary
slightly with mass loss.
Finally, we find that the FUV spectra shown here are harder than those shown in Kewley
et al. (2001) for both the PEGASE and the Starburst99 stellar population synthesis models.
The increased hardness between 225A and 1000A is particularly notable, with log(λFλ, ergs
s−1 M−1 ) ≈ 25 to 30 for the solar-metallicity Kewley et al. (2001) models as compared to
log(λFλ, ergs s−1 M−1 ) ≈ 35 to 45 for the solar-metallicity models shown here. This
corresponds to the 1 to 4 Ryd region that Kewley et al. (2001) cite as potentially benefiting
from more rigorous treatments of continuum metal opacities, which we have adopted here via
101

the inclusion of the Pauldrach et al. (2001) and Hillier & Miller (1998) model atmospheres.
These FUV spectra are therefore a notable improvement over the Kewley et al. (2001)
grids, with higher ionizing fluxes expected to reproduce the emission line fluxes observed in
star-forming galaxies.
Figure 5.2 shows the relative ionization fractions for a number of species produced by
Mappings III, plotted as a function of relative distance from inner surface of the nebula.
This figure illustrates that the [SII] flux in particular is a good tracer of the hardness of the
ionizing radiation field. This is largely due to the effects of [SIII] ionization. In a soft ionizing
radiation field [SIII] will be ionized out to a greater distance in the nebula, decreasing the
ionization fraction of [SII] as a result. Conversely, in a hard ionizing radiation field, [SIII]
will be ionized very close to the inner surface of the nebula and [SII] will dominate the
ionization fraction. As a result, [SII] can be used as a powerful diagnostic tool in these
models, particularly as it is a commonly-detected emission feature in star-forming galaxy
spectra.
5.3 Optical Emission Line Diagnostics
The final output of the Starburst99/Mappings III code is a model galaxy emission
spectrum. The model spectra calculated for our grid of input parameters allows us to
probe the ISM properties of these galaxies through the use of emission line diagnostics.
In this work we employ the [NII]λ6584/Hα, [NII]λ6584/[OII]λ3727, [OIII]λ5007/Hβ,
[OIII]λ5007/[OII]λ3727, and [SII]λλ6717,6730/Hα line ratios. As these fluxes can vary
with the age of the young stellar population, we examine the evolution of each ratio as a
function of time across our instantaneous burst SFH model grids, and consider this evolution
in the context of the FUV ionizing spectra shown in Figure 5.1. For these ratios we assume
an ionization parameter q = 2× 108 cm s−1; this corresponds to log U ≈ −2.2, our closest
ionization parameter to the log U = −2.3 value adopted by Rigby & Rieke (2004) in their
models.
102

Figure 5.2 Relative ionization fractions for emission lines produced by Mappings III, plottedas a function of relative distance from the inner surface of the nebula. The emission featuresshown here are [NII] (dashed green line), [OII] (dashed red line), [OIII] (dashed-dotted redline), [SII] (dashed blue line), and [SIII] (dashed-dotted blue line). For these outputs azero-age instantaneous burst SFH, a metallicity of Z = 0.05Z, an ionization parameterq = 1× 10⁷, and an electron density ne = 100 cm−3 are assumed.
103

5.3.1 [NII]/Hα
The [NII] λ6594/Hα ratio correlates strongly with both metallicity and ionization
parameter, and is useful in diagnostic diagrams comparing these parameters (Veilleux &
Osterbrock 1987, Kewley et al. 2001). The [NII] flux at low metallicities is dominated by
the abundance of primary nitrogen (Chiappini et al. 2005, Mallery et al. 2007). Primary
nitrogen production is largely independent of metallicity and occurs predominantly in
intermediate-mass stars (Matteucci & Tosi 1985, Matteucci 1986); however, some primary
nitrogen production by massive stars is thought to be dependent on stellar mass and
metallicity (Chiappini et al. 2005, 2006; Mallery et al. 2007). At higher metallicities
the production of secondary nitrogen becomes prevalent (Alloin et al. 1979, Considere
et al. 2000, Mallery et al. 2007); secondary nitrogen is synthesized from carbon and
oxygen originally present in the star and is therefore proportional to abundance. At
low metallicities, nitrogen abundance is also relatively sensitive to the star formation
history of the galaxy, introducing some scatter into the relation between [NII]/Hα and
metallicity (Kewley & Dopita 2002). The relatively low ionization potential of [NII], allowing
production of this line at the lower-energy end of the FUV ionizing spectrum, also makes
this ratio sensitive to ionization parameter (Kewley & Dopita 2002).
The evolution of this ratio with age is shown in Figure 5.3 (top left), where we plot
all five metallicities and the HIGH and STD mass loss rates for the instantaneous burst
SFH models. We can see an increase of the [NII]/Hα ratio with metallicity. At the lowest
metallicities (Z = 0.05Z, Z = 0.2Z) the [NII]/Hα ratio increases by ∼80%-160% at
later ages (> 3 Myr), while at higher metallicities the ratio varies across all ages, showing
deviations from the mean of up to ∼75%-85%. We can also see that [NII]/Hα becomes
double-valued at later ages (> 4 Myr) for the highest metallicities (Z = Z and Z = 2Z).
To understand the variation of this ratio with age for an instantaneous burst SFH, we can
consider the FUV ionizing spectrum. In the instantaneous burst FUV spectra, we see a
larger variation with age at the ionizing threshold of [NII] as compared to the continuous
burst FUV spectra, a consequence of the varying contribution from the coeval massive star
104

population. This variation also becomes more prominent at higher metallicities, explaining
the increased variation of the [NII]/Hα ratio in that regime.
5.3.2 [NII]/[OII]
The [NII] λ6594 and [OII] λ3727 lines have very similar ionization potentials, making this
ratio almost independent of the ionizing parameter of the radiation field. This ratio also
avoids the pitfall of being double-valued with abundance, scaling smoothly from high to low
abundance (van Zee et al. 1998) and rendering it a reliable means of isolating metallicity
on diagnostic diagrams (Dopita et al. 2000). [NII]/[OII] correlates very strongly with
metallicity above Z = 0.4Z; [NII]’s status as a secondary element causes it to more strongly
scale with increasing metallicity than [OII]. In addition, the lower electron temperature
at high metallicity produces fewer thermal electrons, decreasing the number of collisional
excitations in the high-energy-threshold [OII] feature as compared to the lower-energy [NII]
features (Kewley & Dopita 2002). At lower metallicities (Z ≤ 0.23Z) this ratio’s utility
as a tracer of metallicity decreases slightly, since nitrogen and oxygen are both primary
nucleosynthesis elements and begin to scale uniformly with metallicity as a result (Dopita
et al. 2000).
The evolution of this ratio is shown in Figure 5.3 (top right). This ratio shows increased
variation with age at higher metallicities, similar to the behavior observed in the [NII]/Hα
ratio. As described in the [NII]/Hα case, there is a variation with age in the FUV spectrum
at the [NII] ionizing threshold that increases at higher metallicities, leading to increased
variations in the flux of the [NII] line. In this case, we see the same behavior in the
FUV spectrum at the ionizing threshold of [OII]. The slope of the FUV ionizing spectrum
between these two thresholds increases with metallicity and age. This change in the relative
ionizing flux between the two species leads to greater variation in the [NII]/[OII] flux at
higher ages and higher metallicities. We can, however, see that the [NII]/[OII] ratio increases
significantly with metallicity, demonstrating that on a diagnostic diagram a clear separation
with metallicity will be evident across the [NII]/[OII] axis.
105

5.3.3 [OIII]/Hβ
The [OIII] λ5007/Hβ ratio is sensitive to the hardness of the ionizing radiation field, and a
useful means of tracing the ionizing parameter of a galaxy (Baldwin et al. 1981). However,
this ratio is sensitive to metallicity and double-valued with respect to abundance, although
it is far more sensitive to ionization parameter at sub-solar metallicities (Kewley et al. 2004).
The close proximity of these emission lines also renders this ratio relatively insensitive to
reddening corrections.
The evolution of the [OIII]/Hβ ratio is shown in Figure 5.3 (center left). We can see
immediately that, as described in Kewley et al. (2004), [OIII]/Hβ is double-valued with
metallicity, reaching its highest value at Z = 0.4Z and decreasing for both lower and
higher metallicities. We can also see that the value of the ratio decreases with age. This
decrease is gradual at the lowest metallicities but is interrupted by local maxima at 3 to
5 Myr as metallicity increases. This age range combined with the behavior of the FUV
ionizing spectrum indicates that these local maxima in the [OIII]/Hβ ratio are due to the
short-lived contribution of the Wolf-Rayet phase to the flux of the [OIII] line. We can see at
Z = 0.2Z that this contribution from the Wolf-Rayet population is observed in the HIGH
mass loss models but not the STD models; recall that at low metallicities in particular the
HIGH mass loss models are expected to produce an earlier Wolf-Rayet population than the
STD models. The overall decrease with age in the [OIII]/Hβ flux can be attributed to the
gradual decrease in hardness of the FUV ionizing spectrum at the ionization threshold of
[OIII].
5.3.4 [OIII]/[OII]
The [OIII] λ5007/[OII] λ3727 serves a similar function as the [OIII]/Hβ ratio, and is a
commonly-employed ionization parameter diagnostic. Dopita et al. (2000) and Kewley &
Dopita (2002) do find that the [OIII]/[OII] is sensitive to metallicity as well, with higher
106

Figure 5.3 Evolution of the diagnostic emission line ratios with age, shown for all fivemetallicies and ranging from 0 to 5 Myr assuming an instantaneous burst star formationhistory. Models generated with the Geneva HIGH (solid line) and Geneva STD (dashedline) evolutionary tracks are compared. An ne = 100 is assumed.
107

abundances corresponding to lower values, but both the metallicity and ionization parameter
relations are monotonic and do not result in this ratio being double-valued.
The evolution of the [OIII]/[OII] ratio is shown in Figure 5.3 (center right), and supports
the conclusions of Dopita et al. (2000); we can see that the value of this diagnostic ratio
decreases as metallicity increases. The evolution of this diagnostic with age is quite similar
to that of the [OIII]/Hβ ratio. As in the case of [OIII]/Hβ, the [OIII] flux here is affected by
the slowly decreasing hardness of the FUV spectra and the contributions of the Wolf-Rayet
phase. By contrast, the flux of the FUV spectrum stays relatively constant at the ionizing
threshold of [OII] for both SFHs, isolating the behavior of the [OIII] flux in the evolution
of this ratio.
5.3.5 [SII]/Hα
The [SII] (λ6716 + λ6731)/Hα line ratio is a useful means of tracing the hardness of the
photoionizing spectrum present in a galaxy. While the ratio retains a slight dependence
on the ionization parameter, we define this value at the innermost boundary of the nebula.
[SII], by contrast, forms at a greater distance from this boundary in a partially ionized zone.
As the hardness of the ionizing radiation field increases the partially ionized zone becomes
more extended, generating increased [SII] flux.
The evolution of the [SII]/Hα ratio is shown in Figure 5.3 (bottom left). We can see
that the value of this ratio increases gradually with abundance across the lower metallicities
but becomes degenerate at high metallicities (Z = Z, Z = 2Z). We see that the [SII]/Hα
flux increases with age and undergoes large fluctuations at higher metallicities, showing
a ∼90%-95% deviation from the mean. This is, once again, a signature of the increased
variation with metallicity seen in the FUV ionizing spectrum at the [SII] ionizing threshold.
Out of all of our diagnostic ratios, the [SII] flux is also the most sensitive to small variations
in the hardness of the FUV ionizing spectrum.
We find that all the ratios are degenerate with age, particularly at high metallicity.
108
It is therefore important to determine the young stellar population age for a galaxy before
drawing any robust conclusions through the use of the instantaneous burst SFH models.
The relation between Hβ and young stellar population age given in Equation 2.3 would be
valuable for these purposes, particularly since it is derived under the assumption of a zero-
age instantaneous burst SFH (Copetti et al. 1986). We also find a measurable difference
between the HIGH and STD mass loss rate models. This once again demonstrates that an
instantaneous burst SFH traces the effect that a single coeval population of massive stars
has on the FUV ionizing spectrum and clearly illustrates differences in the emission line
spectrum imposed by the different stellar evolutionary tracks.
5.4 Emission Line Diagnostic Diagrams
5.4.1 Comparison With Star-Forming Galaxies
We wish to test our Starburst99/Mappings models against observed spectra from a
variety of local (z < 0.1) galaxy populations. For this we compare our models to the
SDSS, NFGS, BCG, and MPG samples of star-forming galaxies described in 3.1. These
comparisons samples allow us to examine the agreement of our stellar population synthesis
and photoionizaion models when applied to the local galaxy population, including nearby
low-metallicity galaxies. We plot these comparison samples along with our models on a
series of optical emission line ratio diagnostic diagrams, utilizing the ratios detailed in 5.3
[NII]/Hα vs. [OIII]/Hβ
In 5.3, we note that [NII]/Hα correlates strongly with metallicity as well as with ionization
parameter (Veilleux & Osterbrock 1987, Kewley et al. 2001; see Section 3.1), while [OIII]/Hβ
is primarily a measure of ionization parameter with a degenerate dependence on metallicity
(Baldwin et al. 1981, Kewley et al. 2004; see Section 3.3). The [NII]/Hα vs. [OIII]/Hβ
grid of Baldwin et al. (1981) allows us to examine these two ISM properties by examining
the evolution of the grids with age and comparing the agreement of our models to observed
109

galaxy spectra. In Figure 5.4 we plot the evolution of the [NII]/Hα vs. [OIII]/Hβ diagnostic
grid for our instantaneous burst SFH models ranging from 0.0 to 5.0 Myr, while Figure 5.5
shows the diagnostic diagram assuming a continuous SFH and an age of 5.0 Myr; both
figures compare the model grid to the SDSS, NFGS, BCG, and MPG samples.
Following the observed evolution of these diagnostic ratios in 5.3, we can see that the
instantaneous burst models in Figure 5.4 show a substantial decrease in the [OIII]/Hβ flux
with age, attributable to the significant decrease in the hardness of the FUV spectrum with
age. When comparing these grids to our galaxy sample, we see satisfactory agreement for the
youngest instantaneous burst models (0.0 Myr, 1.0 Myr); these models accommodate 69%
of the SDSS galaxies, 78% of the NFGS sample, 58% of the BCGs, and 86% of the MPGs,
a great improvement over previous model grids that show poor agreement with metal-poor
galaxies. However, this agreement rapidly deteriorates with age as the [OIII]/Hβ ratio in the
models decreases and the fluctuating contributions of the Wolf-Rayet phase are introduced
at 3.0 to 5.0 Myr. The MPG sample in particular is in poor agreement with the models at
3.0 to 5.0 Myr. At later ages (4.0 Myr, 5.0 Myr) the HIGH mass loss models show slightly
better agreement with the data as compared to the STD models. By comparison, we find
that the continuous SFH models in Figure 5.5 show a better agreement with the data at
5.0 Myr, although deficiencies in the model [OIII]/Hβ fluxes are apparent.
From this diagnostic, it appears that our sample population is restricted to the higher
metallicities included in our models (with the MPGs and a small sample of outliers as the
only exception) and spans the full range of ionization parameters included in our models,
again with only a small sample of outliers. However, the double-valued nature of this
diagnostic makes it an impractical sole means of drawing strong conclusions about galaxies’
metallicities and ionization parameters.
[NII]/[OII] vs. [OIII]/[OII]
In Figure 5.6 we plot the evolution of [NII]/[OII] vs. [OIII]/[OII] with age for the
instantaneous burst SFH models and compare them to our galaxy samples; in Figure 5.7
110
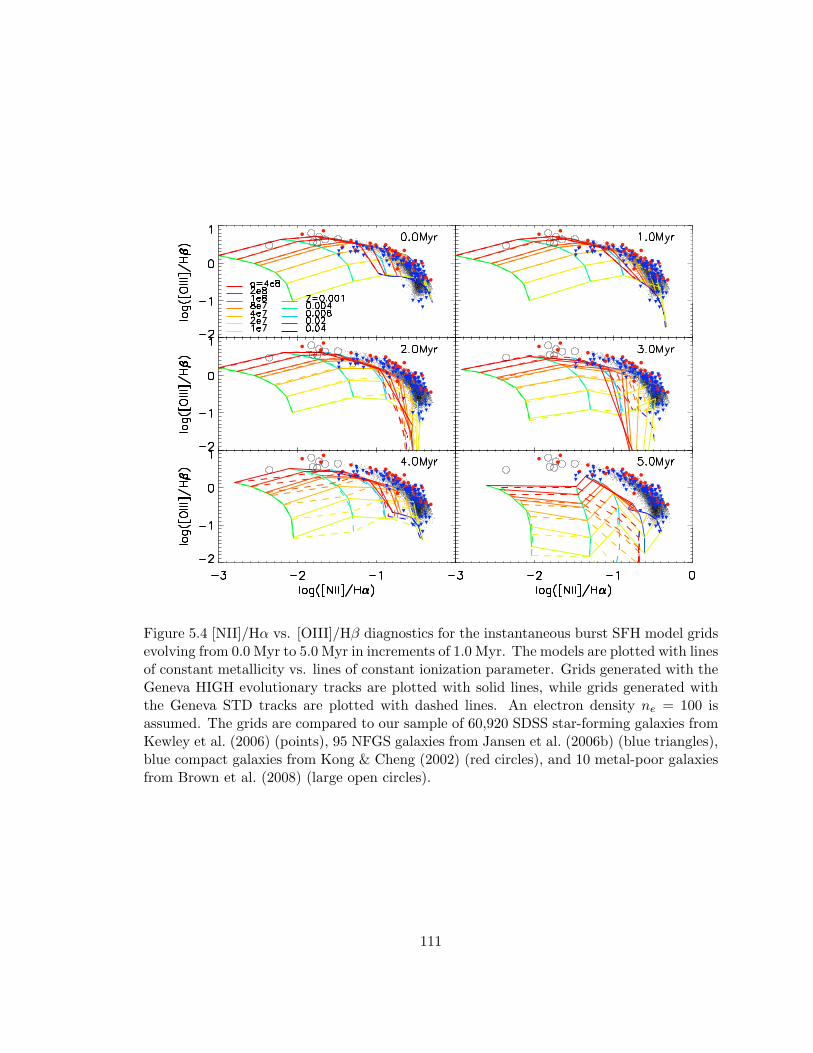
Figure 5.4 [NII]/Hα vs. [OIII]/Hβ diagnostics for the instantaneous burst SFH model gridsevolving from 0.0 Myr to 5.0 Myr in increments of 1.0 Myr. The models are plotted with linesof constant metallicity vs. lines of constant ionization parameter. Grids generated with theGeneva HIGH evolutionary tracks are plotted with solid lines, while grids generated withthe Geneva STD tracks are plotted with dashed lines. An electron density ne = 100 isassumed. The grids are compared to our sample of 60,920 SDSS star-forming galaxies fromKewley et al. (2006) (points), 95 NFGS galaxies from Jansen et al. (2006b) (blue triangles),blue compact galaxies from Kong & Cheng (2002) (red circles), and 10 metal-poor galaxiesfrom Brown et al. (2008) (large open circles).
111

Figure 5.5 [NII]/Hα vs. [OIII]/Hβ diagnostics for the continuous SFH model grids at anage of 5.0 Myr. The models are plotted with lines of constant metallicity vs. lines ofconstant ionization parameter. Grids generated with the Geneva HIGH evolutionary tracksare plotted with solid lines, while grids generated with the Geneva STD tracks are plottedwith dashed lines. An electron density ne = 100 is assumed. Lines of constant metallicityand ionization parameter, as well as representations of our star-forming galaxy comparisonsamples, follow the definitions in Figure 5.4.
112

we again plot the 5.0 Myr continuous SFH models. We can see from the model grids
plotted in Figure 5.6 and Figure 5.7 that [NII/OII] is primarily sensitive to metallicity,
while [OIII/OII] is primarily sensitive to ionization parameter, following from discussion of
these diagnostic ratios in 5.3.
This diagnostic shows much more consistent agreement with our samples - the best-fit
model grids at 0.0Myr accommodate 91% of the SDSS galaxies, 66% of the NFGS sample,
86% of the BCGs, and 86% of the MPGs. For the instantaneous burst models, we see
a rapid decrease with age in the [OIII]/[OII] ratio and fluctuations from the Wolf-Rayet
phase contribute at 3.0 to 5.0 Myr. The 1.0 to 2.0 Myr instantaneous burst models also
appear to be somewhat deficient at higher metallicities in the case of the SDSS sample,
while the 5.0 Myr grid shows poor agreement with the low-metallicity MPG sample. At 5.0
Myr, the HIGH mass loss models are also found to be in better agreement with our galaxy
samples than the STD models. By contrast, the continuous SFH models show consistent
agreement (66%-95%) with our galaxy samples at 5.0 Myr for both the HIGH and STD
mass loss evolutionary track models, including all but the most metal-poor galaxy in the
MPG sample.
In this non-degenerate diagnostic we can see that the SDSS galaxies span the full range
of metallicities adopted in our models, although they appear to be restricted to the lower
ionization parameters (q ≤ 8 × 107 cm s−1). The NFGS and BCG samples span a similar
range in ionization parameter, but do not extend to the highest-metallicity regime of our
models. The MPG sample coincides with both the lowest metallicities (Z = 0.05Z to
Z = 0.2Z) and the highest ionization parameters present across our comparison samples,
along with several of the most metal-poor BCGs, ranging from q = 8 × 107 cm s−1 to
q = 2× 108 cm s−1.
[SII]/Hα vs. [OIII]/Hβ
In Figure 5.8 we plot the evolution of the [SII]/Hα vs. [OIII]/Hβ diagnostic ratio for our
models ranging from 0.0 to 5.0 Myr assuming an instantaneous burst SFH, while Figure
113

Figure 5.6 [NII]/[OII] vs. [OIII]/[OII] diagnostics for the instantaneous burst SFH modelgrids evolving from 0.0 Myr to 5.0 Myr in increments of 1.0 Myr. The models are plottedwith lines of constant metallicity vs. lines of constant ionization parameter. Grids generatedwith the Geneva HIGH evolutionary tracks are plotted with solid lines, while grids generatedwith the Geneva STD tracks are plotted with dashed lines. An electron density ne = 100 isassumed. Lines of constant metallicity and ionization parameter, as well as representationsof our star-forming galaxy comparison samples, follow the definitions in Figure 5.4.
114

Figure 5.7 [NII]/[OII] vs. [OIII]/[OII] diagnostics for the continuous SFH model grids atan age of 5.0 Myr. The models are plotted with lines of constant metallicity vs. lines ofconstant ionization parameter. Grids generated with the Geneva HIGH evolutionary tracksare plotted with solid lines, while grids generated with the Geneva STD tracks are plottedwith dashed lines. An electron density ne = 100 is assumed. Lines of constant metallicityand ionization parameter, as well as representations of our star-forming galaxy comparisonsamples, follow the definitions in Figure 5.4.
115

Figure 5.8 [SII]/Hα vs. [OIII]/Hβ diagnostics for the instantaneous burst SFH model gridsevolving from 0.0 Myr to 5.0 Myr in increments of 1.0 Myr. The models are plotted with linesof constant metallicity vs. lines of constant ionization parameter. Grids generated with theGeneva HIGH evolutionary tracks are plotted with solid lines, while grids generated withthe Geneva STD tracks are plotted with dashed lines. An electron density ne = 100 isassumed. Lines of constant metallicity and ionization parameter, as well as representationsof our star-forming galaxy comparison samples, follow the definitions in Figure 5.4.
5.9 shows the diagnostic at 5.0 Myr for a continuous SFH. In both figures we compare the
model grid to our galaxy samples.
Both the instantaneous burst and continuous SFH models show partial agreement with
the galaxy samples; however, it is clear in these diagrams that the model grid is not able to
accommodate a large number of the galaxies. For the best-fit instantaneous burst models
at 0.0 Myr, the models only show agreement with 61% of the SDSS galaxies, 26% of the
NFGS galaxies, 33% of the BCGs, and 50% of the MPGs. Agreement is better across
the [SII]/Hα axis, but due to the double-valued nature of the diagram we cannot isolate
116

Figure 5.9 [SII]/Hα vs. [OIII]/Hβ diagnostics for the continuous SFH model grids at anage of 5.0 Myr. The models are plotted with lines of constant metallicity vs. lines ofconstant ionization parameter. Grids generated with the Geneva HIGH evolutionary tracksare plotted with solid lines, while grids generated with the Geneva STD tracks are plottedwith dashed lines. An electron density ne = 100 is assumed. Lines of constant metallicityand ionization parameter, as well as representations of our star-forming galaxy comparisonsamples, follow the definitions in Figure 5.4.
117

the behavior of this line ratio. In the instantaneous burst models, we see fluctuations in
the [OIII]/Hβ ratio with age and progressively poorer agreement with the galaxy samples,
beginning with a failure to accommodate any of the galaxies in the MPG sample by 3.0
Myr but progressing to only agreeing with 35% of the SDSS galaxies, 13% of the BCGs, and
6% of the NFGS galaxies by 5.0 Myr for the HIGH mass loss grid; the STD mass loss grid
shows a ∼0% agreement with our galaxy samples at 5.0 Myr. The continuous SFH models
maintain a somewhat more satisfactory agreement at 5.0 Myr and show little distinction
between the HIGH and STD mass loss rates, but the grids are still insufficient and show
on 30% agreement with the MPG sample. As discussed in Section 3.5, use of the [SII]/Hα
diagnostic allows us to examine the hardness of the FUV ionizing spectrum; Figures 5.8
and 5.9 suggest that a generally harder FUV ionizing spectrum is required from the models
to produce a more extended partially ionized zone in the theoretical nebula.
5.4.2 Comparison with LGRB Host Galaxies
In Figure 5.10 we plot the models against our complete sample of LGRB host galaxies
with the required flux ratios on the [NII]/Hα vs. [OIII]/Hβ diagnostic diagram. For
this comparison, we adopt both the continuous SFH models at 5.0 Myr (left; this age
is comparable to the average age of 5.6 ± 1.2 Myr determined for our LGRB host sample)
and the zero-age instantaneous burst SFH models (right). We find that 6 of the 10 LGRB
host galaxies are in agreement with the continuous SFH models; this increases to 9 of 10
LGRBs for the zero-age instantaneous burst models. The host galaxy of GRB 031203 shows
poor agreement with both models; this appears to be due to its unusually high [OIII]/Hβ
ratio. This is consistent with our classification of the GRB 031203 host as an AGN, based on
criteria from Kewley et al. (2006) that are derived based on these emission line diagnostics.
Similarly, in Figure 5.11 we show a comparison between the LGRB host galaxies and
models on the [NII]/[OII] vs. [OIII]/[OII] diagnostic diagram. For both the continuous
SFH models (Figure 5.11, left) and the instantaneous burst models (Figure 5.11, right),
we see that 5 out of the 6 LGRB hosts with these measured fluxes ratios agree with the
118

Figure 5.10 Our LGRB host galaxies (filled stars) compared to the continuous SFH modelsat 5.0 Myr (left) and the zero-age instantaneous SFH models (right) on the [NII]/Hα vs.[OIII]/Hβ diagnostic diagram. The host of GRB 031203 is marked with an asterisk. Linesof constant metallicity and ionization parameter follow the legend in Figure 5.4.
models. The single exception is again the host of GRB 031203, due to its high [OIII]/[OII]
ratio. GRB 020903 is also found to have a somewhat high [OIII]/[OII] ratio in Figure
5.11, but is still in agreement with the models shown here. However, the high [OIII]/[OII]
ratio of the GRB 020903, along with the unusual line ratios from the AGN host of GRB
031203, suggest that generating a grid which extends to higher ionization parameters, and
potentially a grid which adopts treatments of alternative excitation mechanisms such as
shocks, might be prudent when modeling the environments of LGRB hosts.
The agreement between the models and the LGRB hosts is less satisfactory in the case
of the [SII]/Hα vs. [OIII]/Hβ diagnostic diagram; none of LGRB host line ratios agree with
the continuous SFH models (Figure 5.12, left), and only 1 LGRB host out of the 6 in our
sample agree with the zero-age instantaneous burst models (FIgure 5.12, right). This is,
however, consistent with the results of our comparison with the nearby star-forming galaxies
for this diagnostic in 5.4.1. The lack of agreement between our hosts and models suggest
that a sufficiently hard ionizing spectrum is critical when modeling the environments of
LGRB host galaxies.
119

Figure 5.11 Our LGRB host galaxies (filled stars) compared to the continuous SFH modelsat 5.0 Myr (left) and the zero-age instantaneous SFH models (right) on the [NII]/[OII] vs.[OIII]/[OII] diagnostic diagram. The host of GRB 031203 is marked with an asterisk. Linesof constant metallicity and ionization parameter follow the legend in Figure 5.4.
Figure 5.12 Our LGRB host galaxies (filled stars) compared to the continuous SFH modelsat 5.0 Myr (left) and the zero-age instantaneous SFH models (right) on the [SII]/Hα vs.[OIII]/Hβ diagnostic diagram. The host of GRB 031203 is marked with an asterisk. Linesof constant metallicity and ionization parameter follow the legend in Figure 5.4.
120

5.4.3 Comparison with Previous Model Grids
The stellar population synthesis and photoionization models presented in Dopita et al.
(2006) are comparable in many ways to the models presented in this work. They use the
Starburst99 stellar population synthesis code, adopting the Pauldrach et al. (2001) and
Hillier & Miller (1998) model atmospheres that include treatments of metal opacities and
the five metallicities of the Geneva HIGH evolutionary tracks. They also use the latest
generation of Mappings III to compute their photoionization models. The Dopita et al.
(2006) models adopt a spherical geometry in the photoionization models, while this work
assumes a plane-parallel nebular geometry - these different Mappings geometries have been
compared and produce equivalent results (Kewley et al. 2001). There are, however, two
noteworthy differences between the models of Dopita et al. (2006) and those presented
here.
First, the Dopita et al. (2006) models do not take ionization parameter (q) as one of
their free parameters; instead, q is replace by R, a parameter representing the ratio of the
mass of the central aging star cluster to the pressure of the surrounding ISM. This allows
q to vary with age (as well as with metallicity). In this treatment, R is fixed at a variety
of values (−6,−4,−2, 0, and 2) and a sequence of model HII regions are computed at each
of the Geneva metallicities with ages that are increased in increments of 0.5Myr, up to a
maximum age of 6.5Myr.
Second, Dopita et al. (2006) generate models of individual HII regions. To model the
spectra of star-forming galaxies, they integrate the fluxes of a model HII region for each of
their model ages, essentially considering star-forming galaxies to have spectra that consist
of contributions from multiple HII regions at different ages. This removes age as a free
parameter in these models, restricting the free parameters to metallicity and R.
As compared to the Kewley et al. (2001) models, the primary difference in the work
presented here lies in the choice of model atmospheres. While this work adopts the
Pauldrach et al. (2001) and Hillier & Miller (1998) model atmospheres, the Kewley et
al. (2001) grids utilize the Lejeune et al. (1997) and Schmutz et al. (1992) models, which do
121

not include treatments of metal opacities. Kewley et al. (2001) cite this as a shortcoming
of their models and suggest that the inclusion of continuum metal opacities will result in a
harder FUV spectrum, a prediction that is supported by our models (see 5.3). The Kewley
et al. (2001) models also include slightly different treatments of ne (ne = 350 cm−3 as
compared to the ne = 100 cm−3 models shown here) and age (adopting a continuous SFH
model age of 8.0 Myr as opposed to the 5.0 Myr used in this work). However, both of these
differences are expected to have negligible effects on the diagnostic grids produced by these
models.
In Figure 5.13 (left) we compare our 0.0 Myr instantaneous burst SFH models to the
Kewley et al. (2001) and Dopita et al. (2006) models on the emission line diagnostic diagrams
described above, considering the agreement of all three grids with the SDSS and MPG
galaxy samples. The Kewley et al. (2001) models also assume a 0.0 Myr instantaneous
burst SFH and range from q = 1× 10⁷ to q 3× 10⁸; the Dopita et al. (2006) models assume
an instantaneous burst SFH and range from 0.0 Myr to 4.0 Myr (q is not a free parameter
in the Dopita et al. 2006 models). For the [NII]/Hα vs. [OIII]/Hβ diagnostic diagram (top
left), our models are found to more closely agree with the data than either the Kewley et
al. (2001) or the Dopita et al. (2006) grids. The Dopita et al. (2006) models do not produce
sufficient [OIII] fluxes at higher metallicities. The Kewley et al. (2001) models accommodate
all of the galaxies but do not properly track the empirical Kauffmann et al. (2003a) cut-off
for star-forming galaxies that has been applied to the SDSS sample, suggesting that the
[OIII] fluxes produced by these models are unrealistically high. By contrast, the model grids
produced by this work track the Kauffmann et al. (2003a) cut-off perfectly. In the case of
the [NII]/[OII] vs. [OIII]/[OII] diagram (center left), all three models show agreement with
the SDSS and MPG samples, although the agreement with the MPG sample is better for
the Dopita et al. (2006) models and this work (6 out of 7) than for the Kewley et al. (2001)
models (3 out of 7). Finally, the [SII]/Hα vs. [OIII]/Hβ diagram (bottom left) shows the
failure of the Dopita et al. (2006) models to produce the observed [SII]/Hα ratios for either
sample. The Kewley et al. (2001) models have higher [OIII] fluxes than this work; however,
122

our models extend to higher values of [SII]/Hα in the SDSS sample. Across all three of these
models, we find that changes in the treatment of dust have minimal effects in the optical
regime; however, this is expected to make a more substantial difference in the infrared.
This comparison is noteworthy when considering that the models presented here are
found to be an improvement over, or at least equivalent to, the integrated model spectra
of Dopita et al. (2006). In our work we are modeling galaxy environments in a simple way
by assuming the HII regions observed within an aperture can be modeled by a luminosity-
weighted mean HII region represented by a plane parallel model. It is significant that this
simple approach produces comparable results when compared with the more sophisticated
treatment of modeling the integrated spectra of multiple HII regions employed in the
Dopita et al. (2006) models. We can therefore conclude that treating model galaxies as
single luminosity-weighted HII regions, particularly when assume a zero-age instantaneous
burst SFH, is a simpler and equally effective approach in stellar population synthesis and
photoionization modeling.
In Figure 5.13 (right) we compare our 5.0 Myr continuous SFH models to the Kewley
et al. (2001) 8.0 Myr continuous SFH models, which again range from q = 1 × 10⁷ to
q 3 × 10⁸. For the [NII]/Hα vs. [OIII]/Hβ diagnostic diagram (top right), we can see
that the agreement of our models with the Kauffmann et al. (2003a) cut-off in the SDSS
sample has degraded for these later-age models; the Kewley et al. (2001) models maintain
higher [OIII] fluxes. In the [NII]/[OII] vs. [OIII]/[OII] diagnostic diagram (center right),
we again see a slightly improved agreement with the MPG sample for our models (6 out
of 7) as compared to the Kewley et al. (2001) models (4 out of 7); our models appear to
extend to lower metallicities for the [NII]/[OII] diagnostic ratio. Finally, on the [SII]/Hα
vs. [OIII]/Hβ diagnostic diagram (bottom right) we can see that both model grids do a
poor job of accommodating the SDSS and MPG samples, although the Kewley et al. (2001)
once again has higher [OIII] fluxes as compared to the models in this work.
This result is surprising considering the speculation by Kewley et al. (2001) that
the inclusion of model atmospheres with metal opacities should lead to a harder FUV
123

Figure 5.13 Left: Comparison of instantaneous burst model grids from Kewley et al. (2001;green dash-dotted lines), Dopita et al. (2006) (blue; dashed lines), and this work (redsolid lines) for the [NII]/Hα vs. [OIII]/Hβ (top), [NII]/[OII] vs. [OIII]/[OII] (middle), and[SII]/Hα vs. [OIII]/Hβ (bottom) diagnostic diagrams. The Kewley et al. (2001) diagnosticsrange from q = 1× 10⁷ to q = 3× 10⁸, and use the Starburst99 stellar population synthesismodels and the Geneva evolutionary tracks. The Dopita et al. (2006) grids range from 0.0 to4.0 Myr in increments of 1.0 Myr. The models are plotted with the SDSS galaxies (Kewleyet al. 2006) and metal-poor galaxies (Brown et al. 2008). Right: Comparing the 8.0 MyrStarburst99/Geneva model grids from Kewley et al. (2001) to the 5.0 Myr continuous SFHmodels from this work (red solid lines). The models are plotted with the SDSS galaxies(Kewley et al. 2006) and metal-poor galaxies (Brown et al. 2008).
124

spectrum and strong line fluxes. While we do indeed produce a harder FUV spectrum by
including the Pauldrach et al. (2001) and Hillier & Miller (1998) models in our Starburst99
simulations, the effect on the line ratios produced by Mappings III appears to be less
than anticipated. Our models do include a more detailed treatment of physical conditions,
and show improvements in the agreement with the Kauffmann et al. (2003a) criteria for
star-forming galaxies and the metal-poor galaxies along the metallicity-sensitive [NII]/[OII]
diagnostic ratio. However, it is clear that more substantial improvements in models of
star-forming galaxies will require further systematic changes in existing stellar population
synthesis and photoionization codes.
5.5 Late-Age Models and the Stellar Populations of LGRB
Hosts
In addition to the analyses described above, which focus on the emission line fluxes produced
by the ionizing radiation field from young massive stars, we can also use our models to
probe the old stellar populations of galaxies with high-quality continuum spectra. Stellar
population synthesis models can be a powerful tool for examining the integrated light of
a galaxy’s stellar population. Modeling the contribution of the underlying older stellar
population that dominate the continuum of a galaxy’s spectrum is extremely beneficial,
offering insights into the detailed star formation history of the galaxy (see, for example, Cid
Fernandes et al. 2001, 2004; Gonzalez Delgado et al. 1999, 2001, 2004, 2005; Kauffmann et
al. 2003a,b,c). A sufficiently detailed model of the galaxy’s stellar population can also be
used to subtract underlying absorption effects and isolate the nebular emission features in
star-forming galaxy spectra. With this we can improve our determinations of the Balmer
emission-line fluxes, and thereby refine parameters which depend on these features, such as
Hα-based star formation rates or E(B − V ) derivations.
Most of our LGRB host galaxies are too dim, and in some cases appear too young, to
acquire sufficient detections of any underlying old stellar population in the continuum of the
125

galaxy spectra. The one exception to this in our sample is the unusual high-metallicity host
galaxy of GRB 020819. From our observations of the host galaxy nucleus (see 4.1.1, and
Figure 4.1) we detect absorption features for the higher-order Balmer lines, which can be
used in fitting older (>100Myr) stellar population synthesis models to the galaxy continuum
to determine the age of the underlying stellar population.
To investigate the possibility of using our models for future work with detailed continuum
spectra of LGRB host galaxies, we have run a series of late-age Starburst99 stellar
population synthesis models with parameters specifically tailored to the ISM properties
and stellar mass that we determine for the GRB 020819 host environment in previous
chapters. We assume a zero-age instantaneous star formation history with a fixed mass of
log(M∗/M) = 10.65, derived from the Le Phare stellar mass code, and adopt the HIGH
mass loss z = 0.04 Geneva evolutionary tracks. We generate models ranging from 100 Myr
to 4 Gyr in increments of 100 Myr.
For this preliminary work, we focus only on fitting the continuum absorption features
in the GRB 020819 continuum spectrum. In particular, we concentrate on the higher-older
Balmer emission lines. For this fitting, we deredden our observed continuum spectrum for
GRB 020819 according to the Calzetti et al. (2000) law, taking E(B−V )star = 0.31 following
the conversion of Calzetti (1997) and our determination of E(B − V )gas = 0.71 from 2.2.1.
In fitting our observed spectra, we must first drastically smooth and rebin our data, with a
resolution of ∼1A, to match the much coarser 20A resolution of the Starburst99 synthetic
SED. With these models and data, we we are able to determine a satisfactory best fit for the
500 Myr models (see Figure 5.14, top); however, this necessary resolution-matching results
in a significant loss of detail.
As a result, we also compare our spectra to the stellar population synthesis models
generated by Gonzalez Delgado et al. (2005), with a dispersion of ∼0.3A. These models
adopt the same Geneva evolutionary tracks used in our late-age Starburst99 models, along
with a combination of non-LTE and LTE synthetic stellar atmosphere libraries described
in Gonzalez Delgado et al. (1999) and Martins et al. (2005). We compare the best-fit
126

models from this work to our GRB 020819 spectrum in Figure 5.14 (bottom). To account
for the effects of nebular emission overlaid in the higher-order Balmer absorption features,
we have combined the Gonzalez Delgado et al. (2005) models with a synthetic nebular
emission spectrum from the Starburst99/Mappings model grid presented here. For this
we adopt a zero-age instantaneous burst model with a metallicity of z = 0.04 and an
ionization parameter of q = 2 × 10⁷, or log(q) = 7.3, in agreement with the results of our
metallicity diagnostics. We approximate the emission features as Gaussians, and generate a
synthetic nebular emission spectrum with a resolution of 1A. It is apparent that the effects
of the nebular emission overlaid in the higher-order Balmer absorption features are complex,
with some absorption features still showing poor agreement and suggesting the potential
contribution of multiple younger stellar popualtions. However, from the overall continuum
fit and the strengths of these features, a best fit of 500Myr is also found with the Gonzalez
Delgado et al. (2005) models.
It would be beneficial to extend these analyses to future studies of the most nearby
and bright GRB hosts, including the host galaxies of GRB 980426 (z = 0.009), GRB
0608219 (z = 0.034), and the recently-discovered GRB 100316D (z = 0.059). Such work
would require high-S/N observations of the hosts (to sufficient detect critical continuum
features such as Hδ and the 4000-A break), as well as higher-resolution Starburst99 stellar
population synthesis models (∼1A or better) combined with synthetic nebular emission
line spectra from our existing photoionizaton models. Such models could used for detailed
fitting of the complex spectra produced by the combination of strong nebular emission line
features and higher-order Balmer absorption features produced by these young, actively
star-forming LGRB host galaxies. The Starburst99 and Mappings III codes allow us to
tailor the models presented here to galaxies with ISM properties (metallicities, ionization
parameters, young stellar population ages) that have already been determined, as is the
case for our LGRB host sample. However, the resolution of the Starburst99 models must
be improved in future work if they are to be effectively employed as probes of the star
formation histories and older stellar populations in LGRB host galaxies.
127

Figure 5.14 Top: Comparison of the best-fit late-age Starburst99 model, with an age of500 Myr (red), to our spectrum (black) of the GRB 020819 host galaxy nucleus. Emissionfeatures have been removed, and the spectrum has been smoothed to a coarse resolutionof 20A to match the Starburst99 synthetic spectrum. Bottom: Comparison of the best-fit stellar population synthesis model from Gonzalez Delgado et al. (2005) combined witha synthetic nebular emission spectrum from the Starburst99/Mappings model grid, withan age of 500 Myr (red dashed), to our spectrum (black) of the GRB 020819 host galaxynucleus. Here the 0.3A Gonzalez Delgado et al. (2005) models have been smoothed toa resolution of 1A to match our data. We can see in the higher-resolution comparisonthat the Balmer absorption features in the host spectrum show evidence of substantialnebular emission. For both comparisons the GRB 020819 spectrum has been dereddenedby E(B − V )star = 0.31 following Calzetti (1997) and Calzetti et al. (2000).
128

5.6 Discussion and Future Work
We have generated an extensive suite of models for star-forming galaxies, utilizing the
newest generations of the Starburst99 stellar population synthesis code and the Mappings
III photoionization code. With these codes we have constructed a grid of models with a
variety of metallicities and ionization parameters, adopting both an instantaneous burst
SFH and a continuous SFH as well as both the HIGH and STD mass loss prescriptions
from the evolutionary tracks of the Geneva group. This grids have been made available to
the public5 .
We have examined the ionizing spectrum generated by Starburst99 for these models,
along with the evolution of a number of optical emission line diagnostic ratios with time.
We have compared these models to our SDSS, NFGS, BCG, and MPG star-forming galaxy
samples, as well as our sample of LGRB host galaxies. By comparing our models to these
data, we are able to make the following conclusions:
(1) Models that assume a continuous SFH at 5.0 Myr produce a harder FUV ionizing
spectrum and show better agreement with the observed emission line ratios of our galaxy
sample as compared to models with an instantaneous burst SFH at 5.0 Myr. This is in
accordance with past work that suggests a continuous treatment of star formation is more
realistic than a single zero-age instantaneous burst when modeling star-forming galaxies
(Kewley et al. 2001, Moy et al. 2001, Ferndandes et al. 2003, Noeske et al. 2007a, 2007b).
(2) Assumption of either the HIGH or STD Geneva mass loss rates is found to make
very little difference in the precision of the continuous SFH models; however, in the case of
the instantaneous burst models, the HIGH mass loss rates produce better agreement with
our galaxy sample, suggesting that an enhanced rate of mass loss is more realistic under
the assumption of an instantaneous burst.
(3) From the [NII]/Hα vs. [OIII]/Hβ and [NII]/[OII] vs. [OIII]/[OII] diagnostic
diagrams, we find that the metallicity and ionization parameter range of our models are
in agreement with the ISM properties of the galaxies in our comparison samples, including5The models are available for download at http://www.emlevesque.com/model-grids/
129
the low-metallicity galaxy sample. We find that that these metal-poor galaxies appear to
include both lower metallicities and higher ionization parameters than our general local
galaxy sample. These diagnostics also agree with our LGRB host galaxy sample, although
the agreement is better for zero-age instantaneous burst SFH models than the continuous
SFH models at 5.0 Myr.
(4) From the [SII]/Hα vs. [OIII]/Hβ diagnostic diagram, it appears that our models still
produce an insufficiently hard FUV ionizing spectrum that cannot fully reproduce some of
the line fluxes observed in our LGRB hosts or star-forming comparison galaxy sample.
(5) Our models of a single luminosity-weighted HII region are comparable in precision
to models such as those presented in Dopita et al. (2006), which integrate the spectra of
multiple HII regions when modeling star-forming galaxies.
(6) Higher-resolution stellar population synthesis models, such as those presented in
Gonzalez Delgado et al. (2005), are required in order to determine the star formation
histories and older stellar population ages of star-forming galaxies such as LGRB hosts.
It is important to note that these models still include several shortcomings that must
be considered when applying them to star-forming galaxies and considering future work in
this area. One ongoing challenge we must consider is the required hardness of the FUV
ionizing spectrum. The Starburst99 stellar population synthesis models shown here have a
considerably harder FUV ionizing spectrum in the 225A to 1000A regime than the Kewley
et al. (2001) models, a regime that is critical in ionizing the forbidden optical emission
lines used in these analyses. This is a consequence of adopting the Pauldrach et al. (2001)
and Hillier & Miller (1998) model atmospheres, which include detailed treatments of metal
opacities, an improvement originally proposed in Kewley et al. (2001). However, our results
show that the models still do not produce sufficient flux in the FUV ionizing spectrum; this
is most evident in the case of the [SII]/Hα vs. [OIII]/Hβ diagnostic. [SII] in particular
requires a larger partially ionized zone generated by a harder radiation field in the models
before it can properly reproduce the fluxes observed in our galaxy samples. This suggests
that further systematic changes are required in the stellar population synthesis models to
130

produce harder FUV ionizing spectra, although it is also possible that updating the atomic
parameters for sulfur used in the Mappings III model code will improve the agreement with
observed fluxes.
One potential means of addressing this issue could be the adoption of stellar evolutionary
tracks that include the effects of rotation on the stellar population, such as the new
generation of Geneva evolutionary tracks presented in Vazquez et al. (2007). Starburst99
outputs generated using the z = 0.02 rotating Geneva models have been made available to
us (Leitherer, personal communication), allowing us to examine the effect that rotation has
on the ionizing radiation field produced by this code. Figure 5.15 shows a comparison of
the FUV ionizing spectra generated by Starburst99 when adopting the HIGH, STD, and
rotating models of the Geneva group; it is evident that evolutionary tracks that include
rotation produce an ionizing spectrum that is in general harder than either of the tracks
employed in this work, with the difference becoming most pronounced at wavelengths
shorter than ∼225A. This is precisely the effect that would be anticipated as a result of
including rotation in massive stellar evolutionary models. As just one example of the changes
expected with these new tracks, massive stars are found to be hotter and more luminous
than previously thought, leading to a hardening of the SED that is most prominent in the
higher-energy regime of the spectrum (Leitherer et al. 2008). In particular, these rotation
effects are expected to become more pronounced at lower metallicity, as rotation eventually
becomes a dominant parameter in the evolution of extremely metal-poor stars (Hirschi et
al. 2008, Leitherer 2008). In the future, we plan to expand our current grid of evolutionary
models by generating a new set of Starburst99/Mappings III synthetic spectra once the full
grid of Geneva evolutionary tracks with rotation are available.
In summary, we find that our stellar population synthesis and photoionization models
of a single luminosity-weighted HII region, adopting a continuous SFH, reproduce the
line ratios of up to 91% of the local population of star-formation galaxies, as well as
up to 86% of the low-metallicity population. These models will allow us to study the
ISM properties of metal-poor galaxies in unprecedented detail, allowing study of the pre-
131
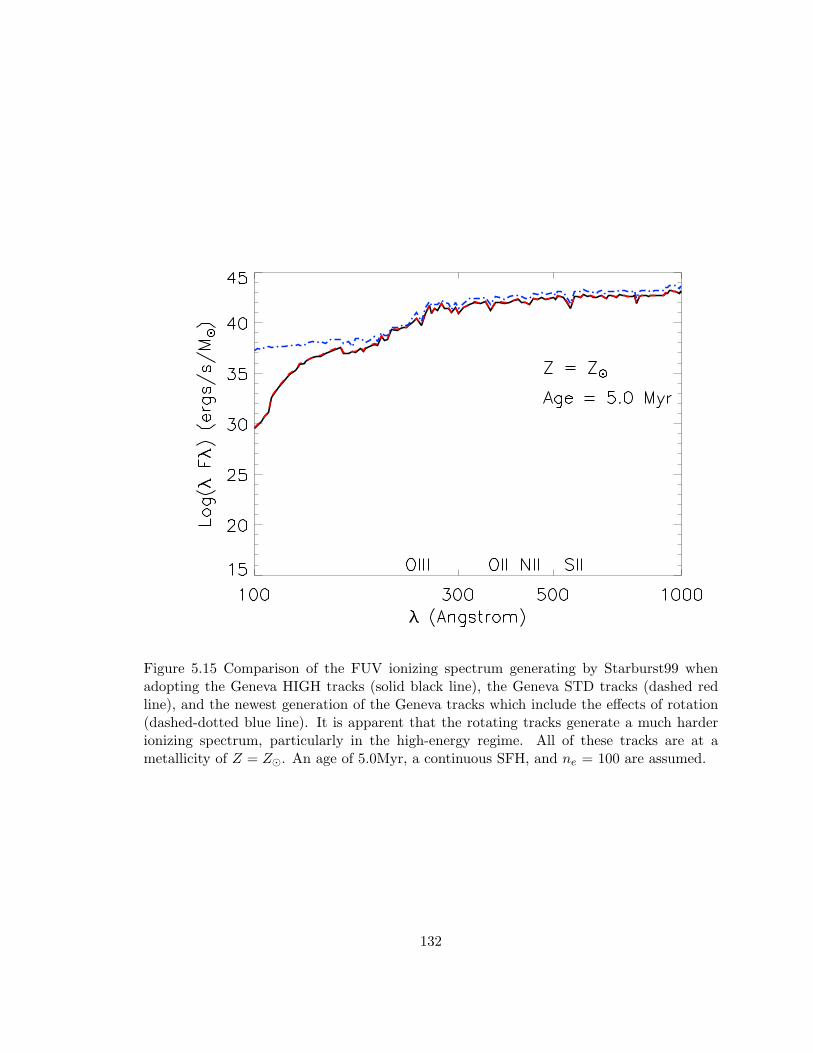
Figure 5.15 Comparison of the FUV ionizing spectrum generating by Starburst99 whenadopting the Geneva HIGH tracks (solid black line), the Geneva STD tracks (dashed redline), and the newest generation of the Geneva tracks which include the effects of rotation(dashed-dotted blue line). It is apparent that the rotating tracks generate a much harderionizing spectrum, particularly in the high-energy regime. All of these tracks are at ametallicity of Z = Z. An age of 5.0Myr, a continuous SFH, and ne = 100 are assumed.
132

enrichment ISM that could shed new light on star formation processes and mechanisms of
ISM enrichment (Brown et al. 2008). Models of low-metallicity galaxies can also be used to
probe potential evolutionary mechanisms for metal-poor environments (Kewley et al. 2007.
Finally, a thorough understanding of metal-poor galaxies and their stellar populations could
prove beneficial to studying the host galaxies of long-duration gamma-ray bursts, which
are thought to be low-metallicity (Stanek et al. 2006, Fruchter et al. 2006, Kewley et al.
2007, Modjaz et al. 2008). These models still include several shortcomings that must be
considered, in particular their production of an insufficiently hard FUV ionizing spectrum
that specifically affects the [SII] emission line strength. Future model grids that include the
effects of rotation on the stellar population may help to resolve this issue.
133

Chapter 6
Red Supergiants: The Physical Properties of
Evolved Massive Stars
6.1 Introduction
Red supergiants (RSGs) are a He-burning evolutionary phase in the lifetimes of moderately
massive (10M ∼< M ∼< 25M) stars. According to the Conti (1976) scenario for the
evolution of massive stars, and its subsequent illustration in Massey (2003), RSGs are the
end result of a nearly horizontal evolution across the Hertzsprung-Russell (H-R) diagram
as their blue H-burning predecessors leave the main sequence and cross the “yellow void”,
passing through the very short-lived yellow supergiant stage. In some cases this is the
terminal stage for massive stars, which spend a significant fraction of their time as RSGs
before ending their lives as hydrogen-rich Type II supernovae. In other more massive cases,
stars will spend a portion of their He-burning lifetimes as RSGs but then evolve back
across the H-R diagram, passing once again through the brief yellow supergiant phase and
exploding as either blue supergiants or Wolf-Rayet (W-R) stars depending on their initial
masses and mass loss rates.
The assumed physical properties of RSGs mark them as a unique and extreme phase
of massive stellar evolution. They have the largest physical size of any stars, and their
very cool effective temperatures (Teff) and extended atmospheres lead to a spectrum that is
dominated by molecular absorption lines. The latter two of these characteristics both pose
134

a challenge to the development of accurate stellar atmosphere models; the extended RSG
atmospheres, with their large scale heights, invalidate the typical assumption of a plane
parallel atmospheric geometry, and their cool temperatures demand a careful and complete
treatment of molecular opacities. The cool temperatures of RSGs also result in significant
negative and Teff -sensitive bolometric corrections on the order of a few magnitudes. As
a result, determining these stars’ luminosities is dependent on careful Teff measurements,
making an accurate picture of their physical properties vital to any attempts at placing
these stars in their proper place on the H-R diagram.
Such measurements are a challenge in and of themselves; until recently, the physical
properties of RSGs have remained poorly understood and at odds with the predictions of
stellar evolutionary theory. This is due in part to the significant complexities introduced
as a result of these stars’ mass loss rates and dusty circumstellar environments. Their
extreme physical properties also make them very difficult to model in detail. Despite their
importance in massive stellar evolution, RSGs were generally ignored for many years by
the massive star community, with a few important exceptions (e.g. Kudritzki & Reimers
1978, Humphreys 1978, 1979a, 1979b, Humphreys & McElroy 1984, Elias et al. 1985). New
investigations of RSGs in recent years have made important strides towards answering many
outstanding questions about these stars. These same studies have also introduced a number
of new questions and revealed the true complexity of RSGs and their critical place in the
grand scheme of massive stellar evolution.
Understanding the late stages of evolution for massive stars, particularly key mass-loss
phases such as RSGs, is critical for future studies of LGRB progenitor evolution and analyses
of LGRB host environments. The current collapsar progenitor model for LGRBs, and our
current interpretation of the observed low-metallicity trend in LGRB host galaxies, are both
strongly dependent on how mass-loss phases impact progenitor evolution. The role that
metallicity plays in the evolution of these stars is still poorly understood, particularly for
low metallicities where the effects of rotation (a critical component in the collapsar model)
are enhanced. The physical properties, lifetimes, and maximum luminosities of RSGs are
135

all dependent on metallicity and pose a challenge to current stellar evolutionary models,
which are vital to producing improved stellar population synthesis models in the future.
The mass loss, and consequent dust production, of RSGs is of particular importance - these
stars are expected to be the dominant dust producers in young star-forming galaxies at large
look-back times, which includes the LGRB host galaxy population. Finally, recent work on
low-metallicity RSGs has uncovered several stars that display unusual variable behavior,
which may be tied to non-standard mass loss mechanisms and their evolution in metal-poor
host environments. The physical mechanism driving this behavior remains a mystery, and
may prove critical to understanding the late stages of massive stellar evolution.
Past work has investigated RSGs in the Milky Way as well as the Magellanic Clouds.
Here we have taken the first steps towards extending this work down to even lower
metallicities, studying RSGs in the Local Group galaxies NGC 6822 (Z = 0.35Z) and
WLM (Z = 0.12Z). The latter is the lowest-metallicity galaxy in the Local Group
currently forming stars. These samples allow us to extend studies of RSGs down to
unprecedented low metallicities, at abundances that are comparable to those measured
in our LGRB host survey. It also offers an opportunity to search for additional cases of
unusual variable behavior in these stars, and to investigate the connection between this
behavior and the evolution of low-metallicity RSGs.
We begin by presenting a detailed literature review on RSGs, highlighting their
importance to massive stellar evolution, population synthesis modeling, and our
understanding of LGRB progenitors and their host environments. We then discuss the
sample of low-metallicity RSGs in NGC 6822 and WLM that were selected for this work.
We describe our observations, the analyses that can be applied to these data, and the
early results of our ongoing study. Finally, we outline future steps that should be taken to
investigate the effects of metallicity on late-type stellar evolution.
136

6.2 Literature Review
6.2.1 Red Supergiants and the H-R Diagram
Massey (2003) and Massey & Olsen (2003) were the first to note that RSGs appeared
to be at odds with the current predictions of stellar evolutionary theory. The Galactic-
metallicity evolutionary tracks of the Geneva group (Schaller et al. 1992, Meynet et al. 1994)
failed to extend to temperatures cool enough to accommodate the Galactic RSG samples
of Humphreys (1978) and Humphreys & McElroy (1984) on the Hertzsprung-Russell (HR)
diagram. A similar discrepancy was found in the lower-metallicity Magellanic Clouds; the
evolutionary tracks of Schaerer et al. (1993) (z = 0.008) and Charbonnel et al. (1993)
(z = 0.004) did not agree with RSG samples from Elias et al. (1985) and Massey & Olsen
(2003).
Such a disagreement was not surprising, considering the many challenges that RSGs
present to evolutionary models. Initially, the problem was attributed to difficulties in
modeling mixing-length. The velocities of convective layers in RSGs are nearly sonic, and
even supersonic in the atmospheric layers, which produces shocks (Freytag et al. 2002) and
invalidates mixing-length assumptions. This also results in an asymmetric photosphere and
a poorly defined radius, a phenomenon demonstrated in high angular resolution optical and
near-infrared observations of Betelgeuse (e.g., Young et al. 2000, Tatebe et al. 2007, Ohnaka
et al. 2009, Kervella et al. 2009). In addition to asymmetries in these stars’ atmospheres,
the highly extended atmospheres are at odds with the plane-parallel geometry assumptions
of stellar atmosphere models. Finally, the cool Teffs of RSGs demand models that include
detailed opacities for molecular transitions, such as the TiO bands that dominate their
spectra.
Levesque et al. (2005) considered the additional fact that the derived physical properties
of RSGs were also highly uncertain. The position of an RSG on the H-R diagram is
primarily dictated by the star’s Teff . These cool stars have significant Teff -dependent
bolometric corrections; as a result, a 10% error in Teff corresponds to a factor of 2 error in
137

their bolometric luminosities (Mbol; Kurucz 1992, Massey & Olsen 2003), making rigorous
determinations of Teff critical to proper placement on the H-R diagram.
Unfortunately, careful determinations of Teff scales for RSGs have been difficult to derive.
A lack of nearby RSGs precludes the use of measured stellar diameters to generate a basic
relation between Teff and spectral subtype, as has been done in the past for red giants.
Humphreys & McElroy (1984) produced a Teff scale for Galactic RSGs; Teff was determined
by assuming a blackbody continuum and using broadband colors to assign Teff based on
the small sample of nearby RSGs with measured diameters (Johnson 1964, 1966, Lee 1970).
However, the gravity-dependent line blanketing effects described by Massey (1998) strongly
affect the (B − V ) colors of these stars. In the case of RSGs in the Magellanic Clouds,
Massey & Olsen (2003) shifted the Dyck et al. (1996) scale for red giants (determined from
interferometric data and lunar occultation measurements) down by 400 K based on the more
limited Dyck et al. (1996) RSG data. They note that this is a very uncertain determination
that does not take into account, for example, potential metallicity effects, and stress that a
more careful scale derived using detailed spectrophotometry and RSG-appropriate surface
gravities is needed.
The new generation of the MARCS stellar atmosphere models (Gustafsson et al. 1975,
Plez et al. 1992) include improved treatments of the effects of opacities of oxygen-rich
molecules, especially TiO (Plez 2003, Gustafsson et al. 2003, Gustafsson et al. 2008). In
conjunction with the spectrophotometric observations proposed in Massey & Olsen (2003),
these models could be used to make robust determinations of Teff based on the rich TiO
bands that dominate RSG spectra, particularly M supergiants. This in turn made the
models ideal tools for constructing a new Teff scale for RSGs.
Levesque et al. (2005) obtained moderate-resolution spectrophotometry of 74 Galactic
RSGs. These data were fit with MARCS stellar atmosphere models to determine a new Teff
scale for RSGs, along with measurements of AV and surface gravity. Levesque et al. (2005)
also employed an alternative means of determining Teff from RSG (V −K)0 colors. In the
end, Teff determinations from the molecular band strengths and the (V −K)0 colors agreed
138

Figure 6.1 Comparison of Galactic RSGs with the evolutionary tracks, adapted fromLevesque et al. (2005). The H-R diagram for the Milky Way compares the predictionsof the evolutionary tracks to the position of RSGs from Humphreys (1978), adopting theeffective temperatures and bolometric corrections of Humphreys & McElroy (1984) (left),and to RSGs from Levesque et al. (2005) (right). The evolutionary tracks are from Meynet& Maeder (2003) and include both non-rotating tracks (solid lines), and tracks that assumean initial rotation velocity of 300 km s−1 (dashed lines). The Galactic RSGs from Levesqueet al. (2005) show greatly improved agreement with the tracks.
to within 100 K, with the (V −K)0 colors generally giving slightly higher Teff than those
derived from spectral fitting.
The Teff determined from model fitting in Levesque et al. (2005) was used to derive Mbol
for the RSG sample, using the Teff -dependent bolometric corrections in the V band derived
from the MARCS stellar atmosphere models. This new Teff scale brought the Milky Way
RSG population into excellent agreement with the predictions of the new Geneva group
evolutionary models (see Figure 6.1).
6.2.2 Metallicity Effects on RSG Evolution
Effective Temperatures
Following the redetermination of a Galactic Teff scale for RSGs, Levesque et al. (2006)
performed a similar analysis on spectrophotometry of 36 RSGs in the LMC and 37 RSGs
139

in the Small Magellanic Cloud (SMC). The Teff scales for the Magellanic Clouds produced
comparable results to the analysis in the Milky Way, resolving the disagreement between the
RSGs and evolutionary tracks noted in Massey & Olsen (2003). While the LMC RSGs were
brought into excellent agreement with the Geneva evolutionary tracks (Schaerer et al. 1993b,
Meynet & Maeder 2005), there was an improved but not wholly satisfactory agreement with
the SMC tracks (Charbonnel et al. 1993, Maeder & Meynet 2001). The SMC sample showed
a considerably larger spread in Teff across a given luminosity as compared to their LMC
and Milky Way counterparts. However, such a spread is not entirely surprising due to
the expected enhancement of rotational mixing effects in stars at these lower metallicities
(Maeder & Meynet 2001).
The metallicity effects on the RSG population, and the challenges they pose to stellar
evolutionary theory, are not limited to disagreements between Teff and the predictions of
the evolutionary tracks. When comparing RSGs in the Milky Way and the Clouds, Elias
et al. (1985) noted an interesting shift in the spectral types of these stars, with the average
RSG spectral subtype shifting toward earlier types at lower metallicities. More precisely,
the average RSG subtype is found to be K5-K7 in the Z = 0.2Z SMC, M1 I in the
Z = 0.5Z LMC, and M2 I in the Z = Z Milky Way (Massey & Olsen 2003). Levesque
et al. (2006) present two distinct explanations for this shift. Firstly, the TiO bands that
dictate the spectral type of M and late-K RSGs are sensitive to chemical abundance as well
as temperature. A RSG with a Teff of 3650 K, for example, would be assigned a spectral
type of M2 I in the Milky Way, M1.5 I in the LMC, and K5-M0 I in the SMC, based purely
on TiO bands that become weaker at lower metallicity (Figure 6.2, left). Secondly, the
Hayashi limit (Hayashi & Hoshi 1961) imposes a restriction on how cool, and hence how
late-type, RSGs are permitted to be while remaining in hydrostatic equilibrium. This limit
shifts to warmer temperatures, and therefore earlier spectral types, at lower metallicity; a
15-25M RSG at the coolest point of its evolution will be about 100-150 K warmer in the
LMC as compared to the the Milky Way, and about 500 K warmer than the Milky Way in
the SMC (Figure 6.2, right).
140

Fig
ure
6.2
Exp
lain
ing
the
shift
inav
erag
eR
SGsp
ectr
alty
pes
wit
hm
etal
licit
y,ad
apte
dfr
omL
eves
que
etal
.200
6.Le
ft:
The
Teff
scal
esfo
rR
SGs
inth
eM
ilky
Way
(sol
idlin
e),
LM
C(d
ashe
dlin
e),a
ndSM
C(d
ashe
d-do
tted
line)
.A
dott
edlin
eof
cons
tantT
eff
isdr
awn
at36
50K
,and
illus
trat
esth
atth
esa
meT
effco
rres
pond
sto
asp
ectr
alty
peof
M2
inth
eM
ilky
Way
,M1.
5in
the
LM
C,
and
K5-
M0
inth
eSM
C,
are
sult
ofab
unda
nce
effec
tson
the
stre
ngth
sof
the
TiO
lines
.Rig
ht:
Aco
mpa
riso
nof
non-
rota
ting
evol
utio
nary
trac
ksfo
rth
eM
ilky
Way
(sol
idlin
e),L
MC
(das
hed
line)
,and
SMC
(dot
ted
line)
,illu
stra
ting
the
shift
inth
eH
ayas
hilim
itto
war
mer
tem
pera
ture
sat
low
erm
etal
licit
ies.
The
evol
utio
nary
trac
ksar
efr
omM
eyne
t&
Mae
der
(200
3)fo
rth
eM
ilky
Way
,Sc
haer
eret
al.
(199
3b)
for
the
LM
C,
and
Cha
rbon
nel
etal
.(1
993)
for
the
SMC
.
141

This 500 K difference is actually in excess of the 350 K change seen in observations of SMC
RSGs.
Lifetimes
Another challenge metallicity poses to the modeling of RSGs concerns the ratios of blue to
red supergiants (B/R) and RSGs to Wolf-Rayet stars (RSG/W-R). Van den Bergh (1968,
1973) first noted that the relative number of blue supergiants and RSGs in nearby galaxies
decreased with the galaxies’ absolute magnitude. They proposed that this was potentially
due to a corresponding decrease in chemical abundance, following the direct relation between
luminosity and metallicity for galaxies. Humphreys & Davidson (1979) notes that B/R in
a galaxy or cluster may be indicative of the time spent in different evolutionary stages; this
explanation was further expanded upon by Maeder et al. (1980), who suggested that the
change in B/R is due to lower mass loss rates in low-metallicity environments, which would
in turn lead to longer RSG lifetimes.
Maeder et al. (1980) also propose that the RSG/W-R ratio should decrease with
increasing metallicity, again as a function of abundance-dependent mass loss rates and
the corresponding effects on RSG and W-R lifetimes. Massey (2002) confirm this trend,
finding a factor of 160 difference in the RSG/W-R ratio over a spread of ∼0.9 dex in
metallicity (from the SMC to M31, taking M31’s oxygen abundances to be log(O/H) + 12
= 9.0 from Zaritsky et al. 1994). Evolutionary models for massive stars have not yet fully
reproduced the change in these ratios, but models that include treatments of enhanced mass
loss (Meynet et al. 1994) and stellar rotation (Maeder & Meynet 2001) have made significant
strides in accommodating the observed B/R and RSG/WR ratios in recent years. It is also
important to note that B/R and RSG/W-R ratios run the risk of being contaminated by
samples such as luminous AGB stars or under-sampled due to the non-inclusion of warmer
(and hence “yellower”) RSGs in low-metallicity environments.
142

Maximum Luminosities
Massey (1998) argue that there is a relation between the maximum luminosities (Lmax) of
RSGs and metallicity, with lower-metallicity RSGs having higher luminosities. Like the
B/R and RSG/W-R ratios, the dependence of Lmax on metallicity can be traced back to
abundance-dependent mass loss effects. In higher-metallicity environments, it is expected
that a massive star of a particular mass will immediately become a Wolf-Rayet star upon
leaving the main sequence, a consequence of the high rate of mass loss enabling the outer
H and He layers to be shed at a faster rate. By contrast, at lower metallicities a star with
the same mass will evolve through an intermediate, and perhaps even terminal, RSG phase
because the outer layers are shed via a much slower mass loss rate.
Massey et al. (2009) derive Mbol for RSGs in the Milky Way, the Magellanic Clouds,
and M31, and find that the most luminous RSGs have consistent log L/L ∼ 5.2-5.3 across
the ∼0.9 dex metallicity spread between M31 and the SMC. This is at odds with the
expectation that Lmax should vary across these metallicities. However, these results should
not necessarily be seen as a challenge to evolutionary theory. The shift in the Hayashi
track with metallicity complicates any analyses that require a complete picture of the RSG
population in galaxies beyond the Milky Way. In low-metallicity galaxies such as the SMC,
for example, massive stars are not expected to evolve past the K or early-M spectral type, a
result of the higher-Teff limitations of the Hayashi track restricting their Teff to >4500 K for
rotating evolutionary models (Meynet & Maeder 2005) or an even warmer limit of >5600 K
for non-rotating models (Charbonnel et al. 1993). As a result, a complete sample of the late-
type massive star population at these metallicities must therefore include yellow supergiants
as well as K- and M-type RSGs. Massey (2002) notes that including both M-type and K-
type supergiant candidates when determining B/R for the LMC and SMC significantly alters
the ratios, and Massey et al. (2009) point out that yellow supergiants must be included in
samples of low-metallicity late-type stars to ensure a proper determination of Lmax. Recent
strides have been made in identifying extragalactic yellow supergiant populations, although
such surveys are challenging due to the very short lifetimes of the yellow supergiant phase
143

and the dominance of foreground contamination, expected to be between 50% and 95% for
galaxies in the local group (Massey et al. 2006a, 2007a, Drout et al. 2009, Neugent et al.
2010).
6.2.3 Dust Production in Red Supergiants
The first detections of circumstellar dust shells around RSGs came in the late 1960s.
Johnson (1968) proposed the presence of an extensive circumstellar cloud surrounding the
extreme RSG NML Cyg, based on infrared spectroscopy of the star showing a large infrared
excess and a very high luminosity. Hyland et al. (1969) also predicted the presence of a
circumstellar dust shell around the extreme RSG VY CMa based on infrared photometry
and spectra. This work also found that the extinction curve for the circumstellar dust
surrounding VY CMa differed from that of normal interstellar dust, showing larger relative
extinction in the infrared as compared to the optical and consistent with a larger-than-
average grain size. Snow et al. (1987) found similar results when examining the circumstellar
envelope surrounding the RSG binary α Sco, indicating that the dust grains are large and
consist primarily of silica. Hagen (1978) did a detailed analysis of circumstellar gas around
M giants and supergiants, based on studies of line profiles, and found that mass loss in
these stars was not being driven by radiation pressure on the dust grains, as had been
previously believed; see also Hagen et al. (1983). Finally, work by Stencel et al. (1988,
1989) revealed that circumstellar dust shells are not unique to the most extreme RSGs, but
are also common in the Galactic RSG population as a whole.
Circumstellar dust shells are formed as a consequence of grain condensation during
stellar mass loss. Massive stars are thought to lose more than half of their mass after they
evolve off of the main sequence (e.g., Stothers & Chin 1996), and much of this mass loss
has been found to occur during the RSG phase. Danchi et al. (1994) found variations
in the distance of the circumstellar dust shells from RSG photospheres, and cited this as
evidence of sporadic mass loss episodes in RSGs separated by several decades. Salasnich
et al. (1999) modeled a new luminosity-dependent mass loss rate for Magellanic Cloud
144

RSGs that was ∼2-5 times higher than previous estimates and incorporated a metallicity-
dependent component. By contrast, Josselin et al. (2000) surprisingly found no clear
correlation between luminosity and mass loss rate across a large sample of Galactic RSGs.
However, this was determined by adopting distances to these stars based on the individual
spectroscopic parallaxes of Humphreys (1978), which leads to a poor approximation of these
stars’ luminosities.
The Levesque et al. (2005) survey of Galactic RSGs noted that many of these stars’
spectra had excess flux in the near-ultraviolet (NUV) as compared to the predictions of
the MARCS stellar atmosphere models. Upon closer examination in Massey et al. (2005),
this excess flux was found to be closely correlated with the amount of excess reddening
present in the RSGs relative to their OB associations. In addition, Massey et al. (2005) also
revisit the mass loss rate determined by Josselin et al. (2000) by taking the RSG distances
to be the average cluster values for their OB association. The result produced a mass
loss rate for Galactic RSGs that is dependent on luminosity. More recently, Bennett et al.
(2010) use IR, optical, and ultraviolet spectra to demonstrate that the circumstellar dust
surrounding the Galactic RSG µ Cep does not follow a standard reddening law, instead
finding RV ∼> 6 (at odds with the RV = 3.1 Cardelli et al. 1989 reddening law found for
the diffuse Galactic ISM). However, we currently have a very poor understanding of the
post-main sequence mass loss rates and dust production occurring in RSGs, particularly as
it relates to metallicity and the currently assumed lifetimes for massive stars in their later
evolutionary phases (P. Massey and G. Meynet, private communication; see also Neugent
et al. 2010).
The dust production of RSGs is important in the study of extragalactic ISM
environments. In a galaxy such as the Milky Way, or other environments with an underlying
old stellar population component, AGB stars and SNe contribute the majority of the dust
in the ISM. However, in starburst galaxies at large lookback times where there is no older
population of low-mass stars, RSGs are expected to dominate dust production. This should
be particularly prevalent in low-metallicity starbursts, including LGRB host galaxies, where
145

evolved dust-producing Wolf-Rayet stars are rare. Low-metallicity starburst galaxies at
high redshifts are also important components in studying the evolution of metallicities
and star-formation rates as a function of redshift. As a result, there is great interest
in producing proper and detailed stellar population synthesis and photoionization models
of these low-metallicity starbursts. This requires thorough treatments of extinction and
other dust effects, and demands that the mass loss rates, dust properties, and circumstellar
environments of RSGs be examined in more detail.
6.2.4 Variable Red Supergiants
As discussed in 6.2.2, the H-R diagram shows a shift of the Hayashi limit to warmer
temperatures at lower metallicities. This rightmost reach of the evolutionary tracks should
impose a hard limit on how cool RSGs can get, and hence how late their spectral types can
be, in a particular environment. The expected result is a lack of cold, late-type stars in
lower-metallicity galaxies such as the Magellanic Clouds.
Despite this, Levesque et al. (2007) found that observations of Magellanic Cloud RSGs
in November 2004 revealed several stars whose spectral subtypes appeared unusually late
with respect to the average type for their host. Additional observations in December 2005
revealed large discrepancies in the spectral subtypes assigned to several of the stars over this
∼1 year timescale. While determining spectral types has always involved a small degree of
subjectivity, there is no comparable disagreement seen between, for example, the Massey &
Olsen (2003) spectral types and Levesque et al. (2006) spectral types for the same sample
of Magellanic Cloud RSGs. In fact, spectral variability of a type or more is unheard of
in the general RSG population. The differences in spectral type were verified by directly
comparing the 2004 and 2005 spectra of these RSGs; substantial changes are apparent in the
strengths of the broad temperature-dependent TiO absorption features in the RSG spectra.
The most dramatic example of this variation is the RSG HV 11423 in the SMC, described
by Massey et al. (2007b). Originally observed in November 2004, the star was assigned a
spectral type of K0-1 I and a Teff of 4300 K. However, observations from December 2005
146
revealed that the star’s spectrum had changed significantly, with a much later spectral
type of M4 I and a much cooler Teff of 3500 K (see Figure 6.3). A third spectrum in the
blue was observed in September 2006. This showed that the spectrum had changed yet
again and now appeared to be in excellent agreement with the K0-1 I spectrum from 2004.
The December 2005 spectral type of M4 I is by far the latest type assigned to an RSG in
the SMC, and substantially later than the average spectral type of K5-M0 I (Massey &
Olsen 2003, Levesque et al. 2006). In addition to these extreme and rapid variations in
spectral type, HV 11423 displays abnormally high variability in V , well in excess of the ∼1
mag variations typical of RSGs (Josselin et al. 2000, Levesque et al. 2007), and also shows
considerable variations in Mbol and AV , appearing brighter, dustier, and more luminous in
its warm early-type state.
Intriguingly, Levesque et al. (2007) found that three more RSGs in the Magellanic Clouds
- two in the SMC and one in the LMC - fit into precisely the same behavioral template. All
of these stars exhibit unusual variability in their optical spectrum, V magnitude, Mbol, and
AV on the timescales of months, and the stars are brighter, dustier, and more luminous when
they display their earliest spectral types. These variations in extinction are characteristic
of the effects of circumstellar dust, and could be connected with sporadic dust production
from these stars, a phenomenon that has been previously described by Danchi et al. (1994)
based on studies of circumstellar dust envelopes around RSGs. Finally, while Teffs of RSGs
determined using the MARCS models are consistent with the evolutionary tracks in the
Milky Way, Magellanic Clouds, and M31 (including the dust-enshrouded RSGs VY CMa
and WOH G64), no such agreement is seen for these variables. In their coolest states, the
Teff determined for each of these stars from the MARCS models still remains at odds with
the predictions of the evolutionary tracks, lying to the right of the Hayashi limit on the
H-R diagram.
Variability of this magnitude and on this surprisingly short timescale has never been
previously confirmed in RSGs, and the current belief is that these unusual properties are
indicative of an unstable, and likely short-lived, evolutionary phase not previously associated
147

Figure 6.3 The changing spectrum of HV 11423, adapted from Massey et al. (2007b).The 2004 spectrum of HV 11423 (light gray) is shown to have a cool Teff of only 4300K and a spectral type of K0-1 I. By comparison the 2005 spectrum (dark gray) has a muchcooler Teff of 3500 K, corresponding to a spectral type of M4 I, and shows a drasticallydifferent spectrum, with strong TiO band. No adjustments in flux have been made forthese observations, showing that HV 11423 was significantly brighter in 2004. The strongfeature at 7600A is the telluric A band.
148

with massive stars. This unusual behavior appears to be due in part to the warmer
limits of hydrostatic equilibrium imposed by these stars’ lower-metallicity environments.
However, it is still not clear whether these variations represent physical changes in the
stars’ atmospheres or apparent changes imposed by sporadic dust production episodes and
consequential effects on the stars’ optical depths and apparent spectra (Meynet, private
communication). Rigorous and continuous follow-up observations of these stars’ optical
spectra, as well as infrared observations of their dust properties, are necessary in order to
form a detailed picture of this variable behavior and its phenomenological origin.
6.3 Low-Metallicity RSGs in the Local Group
We need to improve our overall understanding of RSGs and their evolution at low
metallicities, comparing the physical properties and behaviors of these stars with the
predictions of massive stellar evolutionary models. In the case of the unusual variables
discussed in 6.2.4, a search for RSGs in other low-metallicity galaxies that also display
this same behavior could be beneficial. For these reasons, we have recently extended our
studies to RSG populations observed in the low-metallicity Local Group galaxies NGC 6822
and Wolf-Lundmark-Melotte (WLM). Here we present our sample selection, preliminary
observations, and analysis techniques for examining these extragalactic RSG populations,
and discuss how this work informs our future research on these important stars.
6.3.1 The Local Group Galaxies NGC 6822 and WLM
WLM
WLM (Figure 6.4, left) was originally discovered by Max Wolf (1923), and later
independently discovered by Knut Lundmark and Philibert Jacques Melotte (Melotte 1926).
It is classified as an Ir IV-V (van den Bergh 1966a) and has a SFR of 0.001 M yr−1
(Hodge & Miller 1995, Hunter & Elmegreen 2004). Urbaneja et al. (2008) determine a
distance modulus to WLM of 24.99 ± 0.10 mag; Gieren et al. (2008) find a very similar
149

distance modulus of 24.92 ± 0.04 based on multiwavelength Cepheid photometry. Massey
et al. (2007a) obtained broad-band photometry for 7,656 stars in WLM as part of the Local
Group Galaxy Survey (LGGS), and determined a total E(B − V ) = 0.07 ± 0.05 for this
galaxy (foreground E(B − V ) = 0.03 from Schlegel et al. 1998).
Lee et al. (2005) give a nebular abundance for WLM of log(O/H) + 12 = 7.83 ± 0.06.
From an examination of blue supergiants in WLM, Bresolin et al. (2006) find an identical
abundance of log(O/H) + 12 = 7.83 ± 0.12. Venn et al. (2003) study two blue supergiants
in WLM, and find that one of these stars has an extremely high oxygen abundance, with
log(O/H) + 12 ∼ 8.45; Urbaneja et al. (2008) find similar results for this unusual star. Venn
et al. (2003) speculate that this may be due to spatial chemical inhomogeneities in WLM;
however, Lee et al. (2005) find no support for this based on their spectroscopic survey of HII
regions in WLM. Finally, Urbaneja et al. (2008) also found comparable abundances to the
Lee et al. (2005) nebular metallicity in their study of B and A supergiants in WLM. Venn
et al. (2003), Lee et al. (2005), and Bresolin et al. (2006) also determined specific elemental
abundances for Fe, Mg, N, and Si. Mg appears to be enhanced in this galaxy relative to the
nebula; Bresolin et al. (2006) find enhanced N abundances in their blue supergiant spectra,
but speculate that this is a consequence of enhanced rotational mixing effects, an effect
which would be expected in this low-metallicity environment.
NGC 6822
NGC 6822 (Figure 6.4, right), originally discovered by Hubble (1925), is a barred dwarf
irregular galaxy, also classified as an Ir IV-V (van den Bergh 2000; Melotte 1926 notes the
morphological similarities between NGC 6822 and WLM). This galaxy has a SFR of 0.01
M yr−1 (Hunter & Elmegreen 2004). van den Bergh (2000) give a distance modulus to
this galaxy of (m −M)0 = 23.45 ± 0.08 mag (0.50 Mpc); Pietrzynski et al. (2004) find a
slightly lower distance modulus of 23.34 ± 0.09. Massey et al. (2007a) obtained broad-band
photometry for 51,877 stars in NGC 6822 and calculate a total E(B−V ) = 0.25 ± 0.02 for
150

Figure 6.4 From Massey et al. 2007a; imaging of the Local Group galaxies WLM (left) andNGC 6822 (right), taken as part of LGGS using the Mosaic camera on the CTIO Blanco4-m telescopes at Cerro Tololo Inter-American Observatory. The FOV for both images is35’ × 35’.
151

this galaxy, a value which is dominated by the foreground E(B−V ) = 0.22 (Schlegel et al.
1998).
Pagel et al. (1980) originally determined a nebular metallicity of log(O/H) + 12 = 8.25
± 0.07 for NGC 6822 based on observations of seven different HII regions. More recently,
Lee et al. (2006) determine direct oxygen abundances from 5 HII regions and calculate a
lower log(O/H) + 12 = 8.11 ± 0.1; however, this abundance is restricted to HII regions
with detections of the auroral [OIII] λ4363 line, suggesting that the survey may be biased
towards lower-metallicity HII regions. Lee et al. (2006) also find no clear evidence for any
abundance gradient in the galaxy. Abundance studies of individual supergiants in this host
are limited. Muschielok et al. (1999) find an overall [Fe/H] = −0.5±0.2 dex based on spectra
of three NGC 6822 B supergiants. Venn et al. (2001) determined a metallicity of log(O/H)
+ 12 = 8.37 ± 0.21 based on high-resolution spectroscopic studies of two A supergiants
in NGC 6822, and find [Fe/H] = −0.49 ± 0.22, in agreement with the Muschielok et al.
(1999) iron abundance and giving a metallicity for NGC 6822 that is slightly higher than
that of the SMC. However, most recent work in NGC 6822 has focused on the red giant and
asymptotic giant branch stellar populations (e.g. Cioni & Habing 2005, Kang et al. 2006,
Groenewegen et al. 2009); Cioni & Habing (2005) note that it is difficult to separate red
supergiants from the lower-mass giants in such work.
6.3.2 Sample Selection
Identifying extra-galactic RSG populations presents a significant challenge, due to the
hazards of contamination from red foreground stars. This difficulty is noted by Humphreys
& Sandage (1980), who conducted a detailed photometric survey of M33 and identified
the brightest red stars in the sample. The distribution of these stars as compared to the
brightest blue stars were not the same, a finding at odds with the expectations that both
red and blue massive stars in M33 would be clustered together in the same OB associations.
Humphreys & Sandage (1980) acknowledged that contamination by foreground dwarfs could
be a possible contributor to this phenomenon. The disagreement could not be explained by
152

differences in the ages of blue and red supergiants, as this would amount to no more than a
few million years - at a drift speed of 30 km s−1 this would amount to a drift of only ∼1.5
arcminutes in M33, not enough to explain the apparent disagreement.
The discrepancy was eventually resolved by Massey (1998), which found that ∼50% of
the red stars included in the Humphreys & Sandage (1980) sample were in fact foreground
red dwarfs. Massey (1998) established a means of discriminating between the low-gravity
background RSGs and high-gravity foreground dwarf contaminants. Placing the full sample
of red stars on a (B−V ) vs. (V −R) color-color diagram reveals a clear separation in (B−V )
between the M33 RSGs and the foreground Milky Way red dwarfs. This is a consequence of
enhanced line blanketing effects at lower surface gravities, which are particularly influential
in the B band as a result of the number of weak metal lines in that wavelength regime.
The RSGs in our samples were selected using photometry from LGGS, which has
acquired UBVRI, Hα, [SII], and [OIII] photometry for a sample of ∼ 106 stars in seven
star-forming Local Group galaxies as well as Sextans A and Sextans B (Massey et al. 2006,
Massey et al. 2007a, Massey et al. 2007c). For both of these hosts, Massey et al. (2007a)
originally plotted color-magnitude diagrams (B − V vs. V ) and statistically “cleaned” the
initial data to eliminate stars in the foreground field. Strong RSG populations were visible
for both galaxies in this initial analysis.
From this data, we began by selecting stars with V −R > 0.6 and V ≤ 20.5, restricting
the sample to red stars bright enough to be observable with the Baade 6.5-m telescope in
exposure times of ∼ 2 hours. With these criteria in place, the initial selection was done
using the two-color method described by Massey (1998). A straight cutoff line of
B − V = 1.25× (V −R) + 0.45 (6.1)
was used to distinguish the RSG population from the foreground dwarfs. For WLM this
yielded an initial list of 25 potential RSG targets. Upon closer examination, five of these
targets were found to be galaxies in BV R images, and three more were removed due to
153

crowding issues, yielding a final list of 17 RSGs to be observed in WLM. For NGC 6822,
the V , V − R, and B − V criteria produced an initial list of 182 potential RSG targets.
After removing 46 stars due to crowding issues, we were left with a final list of 136 RSGs
to observe in NGC 6822.
The inclusion of red giants in the halo of the Milky Way can also potentially contaminate
samples of extragalactic RSGs. Levesque et al. (2007) carefully consider this issue for the
case of halo red giants in the direction of the Large Magellanic Cloud (LMC). They find
the likelihood of halo giant contamination in the direction of the LMC to be less than 1%
and confirm the membership of their RSG sample based on the kinematic analysis of the
LMC by Olsen & Massey (2007). Massey et al. (2009) again address this issue for the RSG
population of M31, performing a careful analysis of radial velocities for the RSG candidate
spectra in their sample and confirming that all stars in the sample have velocities consistent
with their locations in M31, as determined from Rubin & Ford (1970). For NGC 6822 and
WLM, we use the Besancon models of the Milky Way (Robin et al. 2003)6 to generate a
list of Galactic stars in the square degree of sky centered on each galaxy. After applying
the magnitude and color cuts used to select our RSG sample, we find only one remaining
contaminant star in each foreground sample. Neither contaminant corresponds to a target
observed in this work, and we therefore conclude that all of the stars selected here are RSG
members of NGC 6822 or WLM.
6.3.3 Observations
The RSGs were observed using IMACS (Bigelow et al. 1998) on the Magellan Baade 6.5-
meter telescope at Las Campanas Observatory on 07-08 August 2008. Conditions were clear
on the first night, with sporadic high cirrus present on the second night; seeing on both
nights was 0.5-0.6”. The observations were obtained using five multi-object slitlet masks,
three for WLM and two for NGC 6822 (a third NGC 6822 mask was created but not used
in our observations), permitting us to observe all 17 WLM RSGs and 67 of the NGC 6822
6available at http://model.obs-besancon.fr/
154
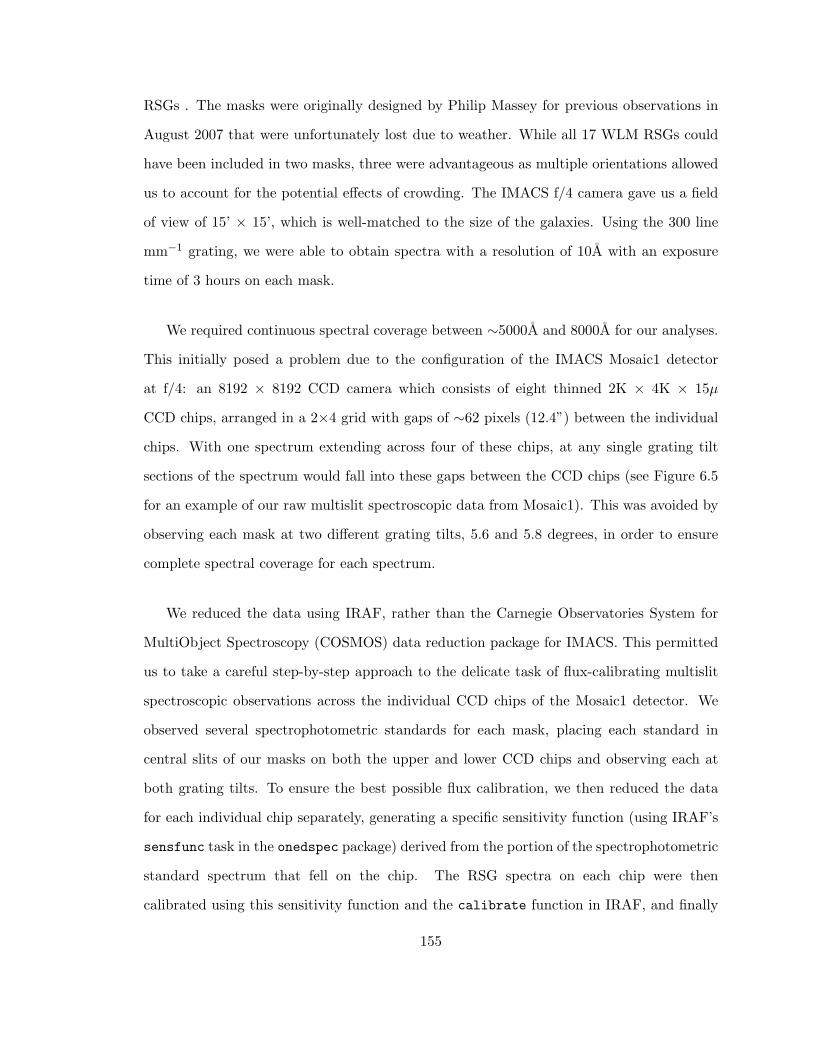
RSGs . The masks were originally designed by Philip Massey for previous observations in
August 2007 that were unfortunately lost due to weather. While all 17 WLM RSGs could
have been included in two masks, three were advantageous as multiple orientations allowed
us to account for the potential effects of crowding. The IMACS f/4 camera gave us a field
of view of 15’ × 15’, which is well-matched to the size of the galaxies. Using the 300 line
mm−1 grating, we were able to obtain spectra with a resolution of 10A with an exposure
time of 3 hours on each mask.
We required continuous spectral coverage between ∼5000A and 8000A for our analyses.
This initially posed a problem due to the configuration of the IMACS Mosaic1 detector
at f/4: an 8192 × 8192 CCD camera which consists of eight thinned 2K × 4K × 15µ
CCD chips, arranged in a 2×4 grid with gaps of ∼62 pixels (12.4”) between the individual
chips. With one spectrum extending across four of these chips, at any single grating tilt
sections of the spectrum would fall into these gaps between the CCD chips (see Figure 6.5
for an example of our raw multislit spectroscopic data from Mosaic1). This was avoided by
observing each mask at two different grating tilts, 5.6 and 5.8 degrees, in order to ensure
complete spectral coverage for each spectrum.
We reduced the data using IRAF, rather than the Carnegie Observatories System for
MultiObject Spectroscopy (COSMOS) data reduction package for IMACS. This permitted
us to take a careful step-by-step approach to the delicate task of flux-calibrating multislit
spectroscopic observations across the individual CCD chips of the Mosaic1 detector. We
observed several spectrophotometric standards for each mask, placing each standard in
central slits of our masks on both the upper and lower CCD chips and observing each at
both grating tilts. To ensure the best possible flux calibration, we then reduced the data
for each individual chip separately, generating a specific sensitivity function (using IRAF’s
sensfunc task in the onedspec package) derived from the portion of the spectrophotometric
standard spectrum that fell on the chip. The RSG spectra on each chip were then
calibrated using this sensitivity function and the calibrate function in IRAF, and finally
155
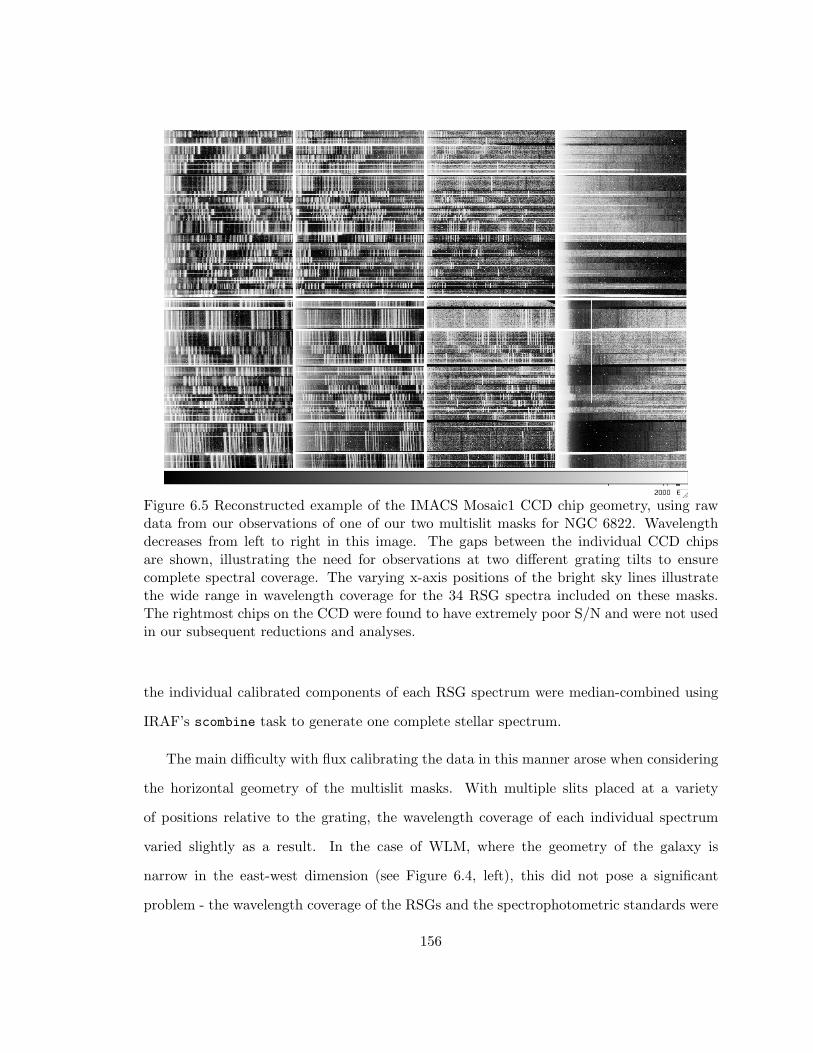
Figure 6.5 Reconstructed example of the IMACS Mosaic1 CCD chip geometry, using rawdata from our observations of one of our two multislit masks for NGC 6822. Wavelengthdecreases from left to right in this image. The gaps between the individual CCD chipsare shown, illustrating the need for observations at two different grating tilts to ensurecomplete spectral coverage. The varying x-axis positions of the bright sky lines illustratethe wide range in wavelength coverage for the 34 RSG spectra included on these masks.The rightmost chips on the CCD were found to have extremely poor S/N and were not usedin our subsequent reductions and analyses.
the individual calibrated components of each RSG spectrum were median-combined using
IRAF’s scombine task to generate one complete stellar spectrum.
The main difficulty with flux calibrating the data in this manner arose when considering
the horizontal geometry of the multislit masks. With multiple slits placed at a variety
of positions relative to the grating, the wavelength coverage of each individual spectrum
varied slightly as a result. In the case of WLM, where the geometry of the galaxy is
narrow in the east-west dimension (see Figure 6.4, left), this did not pose a significant
problem - the wavelength coverage of the RSGs and the spectrophotometric standards were
156

comparable as a whole and allowed us to flux-calibrate the key 5000A-8000A region in all
of the spectra. However, for the more extended east-west geometry of NGC 6822 (Figure
6.4, right) this effect was considerable, and the spectral coverage of the spectrophotometric
standards relative to the RSGs was insufficient. In Figure 6.5 we present the raw data from
Mosaic1 for one of our NGC 6822 multislit masks; the bright sky lines illustrate the wide
range in wavelength coverage spanned by the 34 spectra observed with this mask. As a
result, we were able to flux calibrate the WLM RSGs, but not the NGC 6822 sample, which
we leave in normalized relative flux units for the remainder of our analyses. For the WLM
RSGs, 6 of the stars had poor S/N and/or poor wavelength coverage; however, we were able
to successfully flux calibrate the remaining 11 spectra.
One the flux calibration for our WLM RSGs was complete, we calculated the V
band magnitudes of the spectra from their 5556A fluxes, and compared these to the V
magnitudes determined from the LGGS data (Massey et al. 2007b). We found that all of
our calibrations for a particular mask were consistently bright by a uniform amount, with
standard deviations of 0.1 mag. This suggested that the disparity we were seeing was simply
a grey shift in the spectrum. To confirm this we had to match the fluxes we determined for
our flux-calibrated spectrophotometric standards, across a full range of bandwidths ranging
from 5000A to 8000A. Comparing our measured fluxes to the standard star files in IRAF’s
onedstds directory, we found that our flux-calibrated spectra agreed excellently with the
measured values, differing by small uniform amounts with standard devations of several
hundredths of a magnitude. Based on this, we can confidently claim that the disagreement
between the V fluxes in our spectra and the V fluxes in the LGGS data are the result of an
incorrect greyshift, rather than a problem with the flux calibration as a whole. We correct
for this by manually greyshifting the observations to agree with the fluxes from LGGS.
As a result, these data cannot be used to determine photometric data for these stars,
and the spectral coverage and flux precision is insufficient for stellar atmosphere model
fitting. However, the overall continuum shape of the stars has been properly determined
157

and preserved, and can be used in comparisons with other RSG spectra to determine spectral
types.
6.3.4 Spectral Types
We have determined spectral types for our reduced NGC 6822 and WLM RSG spectra. The
stellar spectra were visually compared to observations of spectral standards from Morgan &
Keenan (1973) by Levesque et al. (2005). Since this work originally found that several of the
spectral “standards” had to be reclassified, we also supplement our comparison spectra with
additional RSGs from Levesque et al. (2005, 2006), to ensure consistency in our spectral
types.
For stars with late K or M spectral types, we can base our classification on the strengths
of the temperature-sensitive TiO bands, which grow stronger with later spectral type (and
cooler temperature). Specifically, the types are primarily based on the 6158A, 6658A,
and 7054A bands following Jaschek & Jaschek (1990), with TiO bands further in the blue
(5167A, 5448A, 5847A) serving as secondary confirmations of the quality of the fit.
For early-K type stars, this classification is considerably more challenging. Typically,
we base these spectral types on the strength of the G band and the Ca I λ4226, since at
this wavelength coverage and spectral resolution (∼10A) the spectrum of a K-type star is
nearly featureless. However, these features are not included in our more limited spectral
coverage for these RSGs, and we must therefore base our early-K spectral types entirely on
the overall goodness of the spectral continuum fit.
For the NGC 6822 RSGs, we normalized our comparison star spectra for use with the
non-flux-calibrated data. This allowed us to determine a best fit for stars with good S/N
and evidence of TiO bands in their spectra; however, this also imposes a limitation on
determining conclusive spectral types for NGC 6822 RSGs with early- and mid-K spectral
types, as we cannot base our fits on the overall SED shape. We must also exclude a number
of RSGs with poor or noisy spectra where emerging TiO features cannot be confidently
distinguished. As a result, we have limited our NGC 6822 spectral types to stars where
158
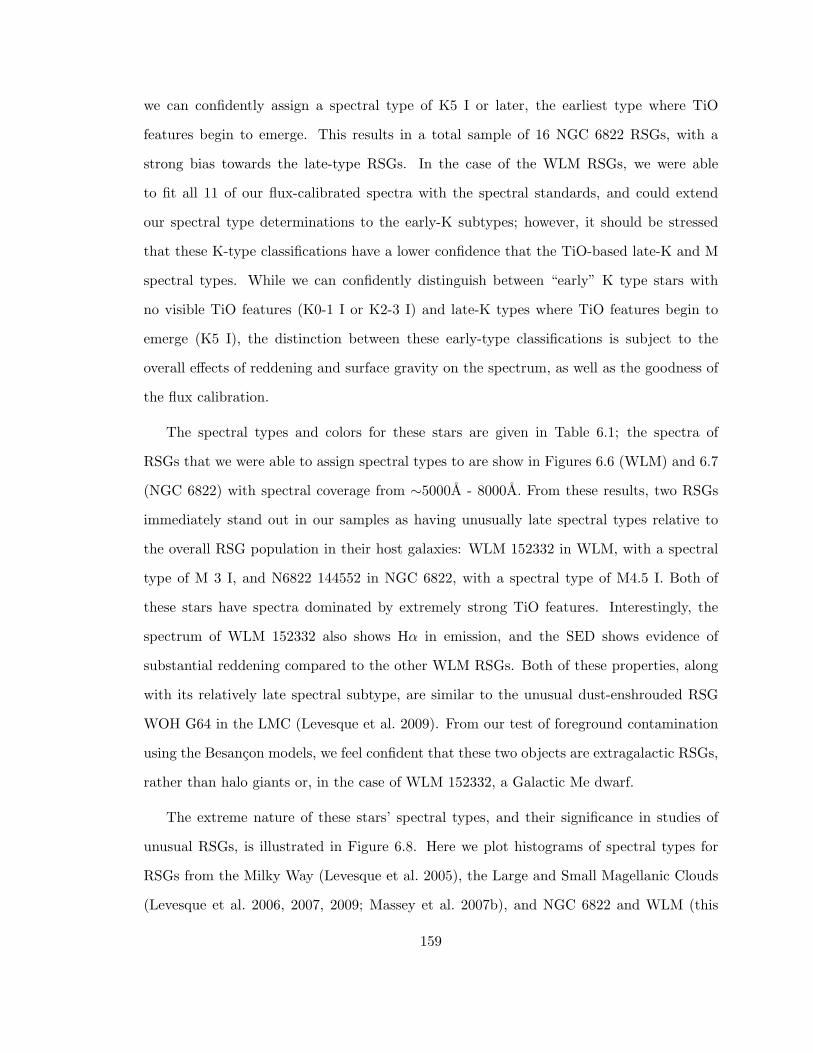
we can confidently assign a spectral type of K5 I or later, the earliest type where TiO
features begin to emerge. This results in a total sample of 16 NGC 6822 RSGs, with a
strong bias towards the late-type RSGs. In the case of the WLM RSGs, we were able
to fit all 11 of our flux-calibrated spectra with the spectral standards, and could extend
our spectral type determinations to the early-K subtypes; however, it should be stressed
that these K-type classifications have a lower confidence that the TiO-based late-K and M
spectral types. While we can confidently distinguish between “early” K type stars with
no visible TiO features (K0-1 I or K2-3 I) and late-K types where TiO features begin to
emerge (K5 I), the distinction between these early-type classifications is subject to the
overall effects of reddening and surface gravity on the spectrum, as well as the goodness of
the flux calibration.
The spectral types and colors for these stars are given in Table 6.1; the spectra of
RSGs that we were able to assign spectral types to are show in Figures 6.6 (WLM) and 6.7
(NGC 6822) with spectral coverage from ∼5000A - 8000A. From these results, two RSGs
immediately stand out in our samples as having unusually late spectral types relative to
the overall RSG population in their host galaxies: WLM 152332 in WLM, with a spectral
type of M 3 I, and N6822 144552 in NGC 6822, with a spectral type of M4.5 I. Both of
these stars have spectra dominated by extremely strong TiO features. Interestingly, the
spectrum of WLM 152332 also shows Hα in emission, and the SED shows evidence of
substantial reddening compared to the other WLM RSGs. Both of these properties, along
with its relatively late spectral subtype, are similar to the unusual dust-enshrouded RSG
WOH G64 in the LMC (Levesque et al. 2009). From our test of foreground contamination
using the Besancon models, we feel confident that these two objects are extragalactic RSGs,
rather than halo giants or, in the case of WLM 152332, a Galactic Me dwarf.
The extreme nature of these stars’ spectral types, and their significance in studies of
unusual RSGs, is illustrated in Figure 6.8. Here we plot histograms of spectral types for
RSGs from the Milky Way (Levesque et al. 2005), the Large and Small Magellanic Clouds
(Levesque et al. 2006, 2007, 2009; Massey et al. 2007b), and NGC 6822 and WLM (this
159

Table 6.1. WLM and NGC 6822 Red Supergiants
Name Type V a B − V a V −Ra V −Ksa,bThis Work LGGSa
WLMWLM 152813 J000153.17-152813.4 K0-1 19.34 1.66 1.55 4.07WLM 152839 J000156.77-152839.6 K2-3 17.61 1.94 1.68 3.81WLM 153122 J000156.87-153122.3 K0-1 18.76 1.64 1.45 3.19WLM 152954 J000157.01-152954.0 K0-1 18.70 1.64 1.31 3.43WLM 152915 J000157.55-152915.8 K0-1 19.27 1.64 1.51 3.55WLM 152803 J000157.96-152803.1 K0-1 19.80 1.53 1.32 · · ·WLM 152332 J000158.14-152332.2 M3 19.61 1.72 0.99 · · ·WLM 152245 J000158.74-152245.5 K0-1 18.46 1.68 1.08 3.12WLM 153059 J000159.61-153059.9 K2-3 18.98 1.78 1.55 3.69WLM 153115 J000200.81-153115.7 K0-1 18.69 1.78 0.77 3.95WLM 153033 J000203.04-153033.7 K5 18.68 1.98 1.76 4.41NGC 6822N6822 145221 J194445.76-145221.2 M1 17.71 2.22 1.21 4.87N6822 145215 J194447.56-145215.4 K5 19.13 2.05 1.12 4.80N6822 145052 J194447.81-145052.5 M1 18.51 2.23 1.29 5.26N6822 144333 J194449.96-144333.5 K5 18.07 2.21 1.29 5.24N6822 144637 J194450.12-144637.9 K5 19.84 1.71 0.90 · · ·N6822 144410 J194450.44-144410.0 M2 18.46 2.00 1.05 4.29N6822 144540 J194453.46-144540.1 K5 19.14 1.74 0.97 4.27N6822 144552 J194453.46-144552.6 M4.5 18.43 1.93 1.05 4.35N6822 144424 J194453.96-144424.3 K5 18.19 2.01 1.04 4.46N6822 144806 J194454.46-144806.2 M1 18.56 2.00 1.21 5.35N6822 145127 J194454.54-145127.1 M0 17.05 2.25 1.19 4.71N6822 145155 J194455.70-145155.4 M0 16.91 2.20 1.17 4.55N6822 144719 J194455.93-144719.6 K5 19.56 1.87 1.04 4.46N6822 144920 J194457.31-144920.2 M1 17.41 2.28 1.21 4.93N6822 144515 J194459.86-144515.4 M1 16.93 2.00 1.00 4.27N6822 144337 J194503.58-144337.6 M0 19.23 1.91 1.01 4.27
aFrom Massey et al. (2007a).
bKs magnitudes are taken from 2MASS where available.
160
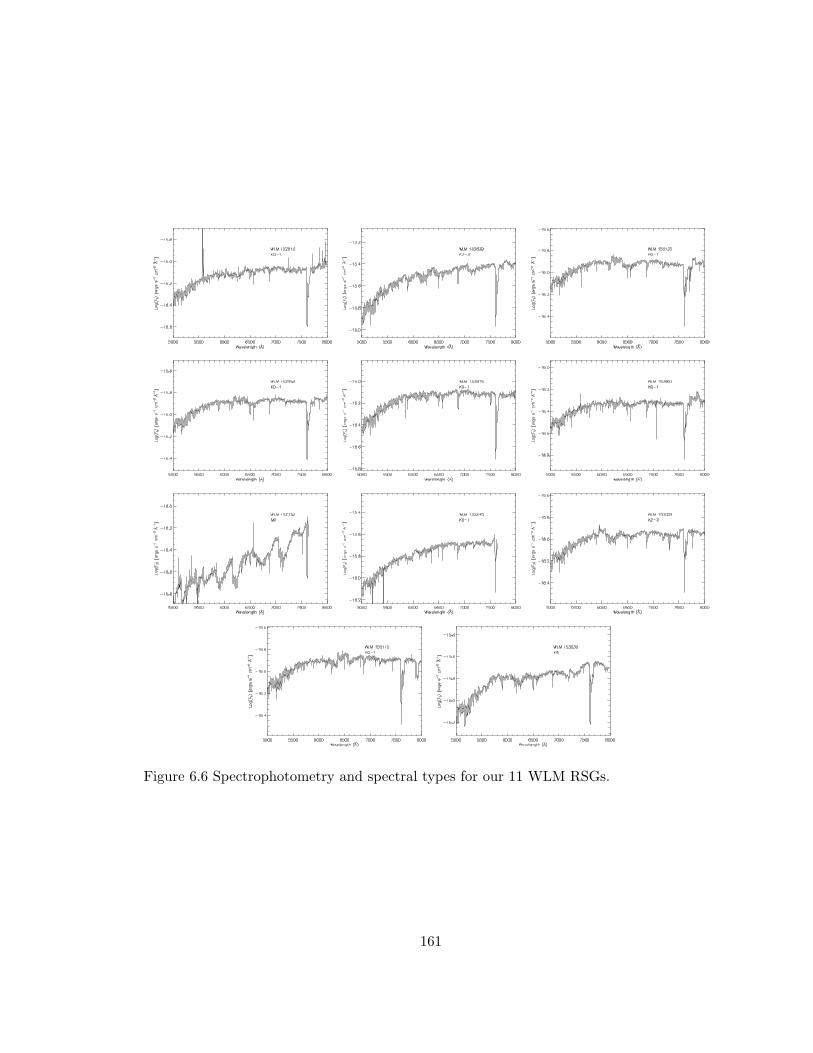
Figure 6.6 Spectrophotometry and spectral types for our 11 WLM RSGs.
161

Figure 6.7 Normalized spectroscopy and spectral types for our 16 NGC 6822 RSGs.
162

work). While more RSGs in WLM and NGC 6822 are required to improve the completeness
of this plot (particularly for early-K supergiants in NGC 6822), we can clearly see that
these samples follow the trend originally described by Elias et al. (1985) and Massey &
Olsen (2003), with the average spectral subtype for RSGs shifting to earlier types at lower
metallicities (see discussion in 6.2.2) as a result of metallicity effects on TiO band strengths
and the temperature of the Hayashi limit. Despite this overall trend, and the expected
accompanying effects of the Hayashi limit, late-M supergiants are still present in all of the
low-metallicity samples. WLM 152332 and N6822 144552 are both marked as clear outliers
when compared to the other RSGs in their host galaxies. Also labeled are the variable
late-type outliers in the Magellanic Clouds (LMC 170452, SMC 046662, SMC 055188, and
SMC 050028) and the unusual dust-enshrouded star WOH G64 in the LMC. From this
histogram, it is clear that both WLM 152332 and N6822 144552 are excellent candidates
for follow-up studies searching for variable or dust-enshrouded RSGs in these low-metallicity
host galaxies.
Finally, we must also note that the trend towards earlier spectral subtypes does pose
a potential problem for sampling the evolved supergiant populations in lower-metallicity
hosts such as NGC 6822, WLM, and the SMC. As described in 6.2.2, any such survey must
make an effort to include yellow supergiants, due to the metallicity-dependent evolutionary
effects on the Hayashi limit and the resulting skew towards an evolved supergiant population
with slightly bluer colors at lower metallicities as a whole. However, removing foreground
contaminants in yellow supergiant samples is challenging and requires detailed kinematic
treatments (e.g. Drout et al. 2009, Neugent et al. 2010).
6.3.5 Future Work: Physical Parameters for Low-Metallicity RSGs
To determine physical properties for the general RSG populations of NGC 6822 and WLM,
we will first require additional spectrophotometric observations, particularly in the case
of NGC 6822. From this initial pilot study, we are now able to refine our procedure for
future observations by tailoring our multislit spectrophotometric standard observations to
163

Figure 6.8 Histograms of RSG spectral types found in five different Local Group galaxies,plotted from top to bottom in order of decreasing metallicity. Data for the Milky Way RSGsare taken from Levesque et al. (2005); for the Magellanic Clouds spectral type data comesfrom Levesque et al. (2006, 2007) and Massey et al. (2007b). Spectral types for NGC 6822and WLM RSGs are from this work. In this comparison we can observe the progression ofthe dominant spectral type towards earlier types at lower metallicities that was previouslydiscussed by Elias et al. (1985) and Massey & Olsen (2003).164

the wavelength ranges required for observations of additional NGC 6822 RSGs from our
original list. In addition, we can acquire individual longslit observations for the sample
of 27 stars with known spectral types included here, allowing us to obtain higher-quality
spectrophotometry and determine physical properties for these stars. Observations following
this new procedure were originally planned for 16-17 July 2009, but unfortunately could
not be performed due to hazardous wind conditions. However, we hope to continue this
project with new spectrophotometric observations scheduled for 14-15 August 2010.
With this improved data for the RSGs in hand, we will be able to fit our data with stellar
atmosphere models that include tailored elemental abundances for these two galaxies. We
have acquired MARCS stellar atmosphere models (Gustafsson et al. 1975, Plez et al. 1992,
Plez 2003, Gustafsson et al. 2003, Gustafsson et al. 2008) for this work that scale solar
abundances down relative to [Fe/H] = −0.9 for WLM and [Fe/H] = −0.5 for NGC 6822 (B.
Plez, private communication). This abundance scaling is a sufficient approximation even
for low-metallicity galaxies (see, for example, Pritzl et al. 2005). By applying these models
to spectrophotometric data for our RSGs, we will be able to determine physical properties
such as Teff , surface gravity, and AV (following the Cardelli et al. 1989 reddening law).
From past work, we currently employ two different methods for determine Teff using the
stellar atmosphere models:
Direct Fitting: By using the same temperature-sensitive TiO bands that are employed
for spectral typing RSGs, we can determine direct best fits between the stellar atmosphere
models and our RSG spectrophotometry. This method generally yields an accuracy of ±25
K for late-K and M-type RSGs; this degrades to ±100 K for the higher-temperature early-
and mid-K RSGs, reflective of the same difficulties faced in assigning spectral types to
these spectra described in 6.3.4. In this model fitting, surface gravity and AV are mildly
degenerate, but through iterative fitting we can determine a single solution for all three
parameters.
With values for Teff , we can also determine Mbol for these stars and place them on
the HR diagram. Josselin et al. (2000) show that K magnitudes are the best choice for
165
deriving the temperature-sensitive Mbol of RSGs. The K-band bolometric correction is
relatively constant with respect to Teff and surface gravity, K magnitudes are less sensitive
to reddening effects, and RSGs are much less variable in the K band than the previously-
used V band (see discussion in Massey et al. 2009). We can determine MK for our stars
by taking the Ks magnitudes from 2MASS, converting them following the K = Ks + 0.04
relation from Carpenter (2001), and correcting for AK (where AK = AV ×0.12 from Schlegel
et al. 1998) and the host galaxy distance modulus. This can then be converted to Mbol
using the Teff -dependent bolometric correction at K (BCK). Using the MARCS models,
we have derived equations that calculate BCK for RSGs in NGC 6822, where:
BCK = 5.403− 0.712Teff
1000K(6.2)
and RSGs in WLM, where:
BCK = 5.359− 0.699Teff
1000K. (6.3)
As a result, once Teff , surface gravity, and AV are determined from fitting new
spectrophotometry, we will have all the tools in hand for comparing RSGs in NGC 6822
and WLM to the predictions of stellar evolutionary tracks on the H-R diagram.
(V − K)0 colors: In addition to determining Teff from spectral fitting, we have also
adopted an alternative means of calculating Teff that is less dependent on direct model
fitting and the depths of the TiO bands. The (V − K)0 colors of RSGs are also quite
temperature-dependent. Using the MARCS models for these galaxies, we have determined
a polynomial relation between (V −K)0 and Teff for NGC 6822:
Teff = 8280.543− 2132.566(V −K)0 + 318.9754(V −K)20 − 16.95448(V −K)3
0 (6.4)
166

and WLM:
Teff = 8087.971− 1968.476(V −K)0 + 282.8315(V −K)20 − 14.95289(V −K)3
0. (6.5)
We already have V −K colors in hand for most of the RSGs in our sample. However,
converting this to (V − K)0, where (V − K)0 = V − K − (0.88 × AV ) following Schlegel
et al. (1998), requires a determination of AV for each star. At present we can only give
conservative lower limits of AV = 0.09 for WLM RSGs and AV = 0.68 for NGC 6822 RSGs
based on foreground extinction (Massey et al. 2007a). It is well-known that RSGs display
substantial amounts of excess reddening due to circumstellar dust (see Section 6.2.3), and
both Lee et al. (2005) and Urbaneja et al. (2008) have noted evidence of variations in
reddening throughout WLM in particular; Urbaneja et al. (2008) find AV s ranging from
0.09 to 0.90 in their B and A supergiant sample. With the uncertain reddening for each
RSG in our sample, we are therefore not currently equipped to estimate Teff for our RSG
samples.
Finally, spectral data for these stars taken two years apart (in 2008 and 2010) will allow
us to probe the possibly variable nature of the late-type RSGs WLM 152332 and N6822
144552. Additional multislit observations will also allow us to search for additional variable
candidates. Understanding the physical properties of these unusual stars will contribute
to a more complete picture of the mass loss mechanisms and late-stage evolutionary
behaviors of these low-metallicity massive stars. Accommodating these unique objects,
as well as the general low-metallicity RSG population, in current stellar evolutionary tracks
is critical. With sufficient data we will be able to improve overall models of the lifetimes and
metallicity-dependent evolution of the massive star populations at these low metallicities, a
key component in understanding the evolutionary processes that affect LGRB progenitors
and their host galaxies’ stellar populations.
167

Chapter 7
Conclusions, Progress, and Future Work
This thesis has focused on understanding the connection between LGRBs and the physical
properties of their host environments. Previous work has postulated that LGRBs could be
potentially powerful and unbiased tracers of star formation in the high-redshift universe (e.g.
Fynbo et al. 2007, Chary et al. 2007, Savaglio et al. 2009). However, recent evidence also
suggested that LGRBs may occur preferentially in galaxies that are not representative of
the general star-forming population, with a possible bias towards lower host metallicities or
younger stellar populations (e.g., Stanek et al. 2006, Kewley et al. 2007, Modjaz et al. 2008).
To address these paradoxical claims, we have conducted the first dedicated observational
survey of LGRB host galaxies and developed a new grid of stellar population synthesis and
photoionizaton models tailored to modeling low-metallicity star-forming galaxies. We have
also examined the massive star population of the low-metallicity Local Group galaxies NGC
6822 and WLM, laying the groundwork for future studies that can improve current models
of massive stellar evolution at low metallicities.
With this work, we have taken important strides towards answering the three key
questions presented in Chapter 1. At the same time, we have uncovered many new mysteries
about the complex relationship between LGRBs and their host environments. Here we
summarize the primary conclusions of this work, and discuss the impact that our results
could have on future GRB studies.
168

1. What kinds of galaxy environments are hosting LGRBs? How do these
compare to the general galaxy population?
We have compared the ISM properties of the 16 LGRB host galaxies in our survey sample
to the general star-forming galaxy population. From the L-Z and M-Z relations, it is clear
that, on average, LGRBs do occur prefentially in galaxies with low metallicities relative to
their luminosities and stellar masses. This trend cannot be attributed to the young stellar
population ages of these host galaxies, and is found to extend out to z ∼ 1. LGRB host
galaxies at z ≤ 1 have an average metallicity of log(O/H) + 12 = 8.4 ± 0.3 when adopting
the R23 metallicity diagnostic calibration of Kobulnicky & Kewley (2004). We also find that
the stellar masses and metallicities of LGRB host galaxies have a strong and statistically
significant positive correlation (Pearson’s r = 0.80, p = 0.001).
However, this work has also highlighted the unclear role that metallicity plays in LGRB
production. Contrary to previous predictions (Wolf & Podsialowski 2007, Modjaz et al.
2008, Kocevski et al. 2009), we find no evidence of any strict metallicity cut-off imposed on
the environments that can generate an LGRB progenitor. On the contrary, we detect
two host galaxies, the hosts of GRB 020819 and GRB 050826, with metallicities that
are much higher than the LGRB host average and in agreement, to within the errors,
with the general star-forming galaxy population. One of these events, GRB 020819, is
a “dark” GRB with no detected optical afterglow; the connection between “dark” GRBs
and their host metallicities remains unclear (see Graham et al. 2009). The high-metallicity
environment of the unusual relativistic supernova SN 2009bb presents further evidence
that low-metallicity environments are not required to produce the powerful central-engine-
driven stellar explosions associated with LGRBs. We also find no correlation between
host metallicity and gamma-ray energy release for LGRBs. This contradicts theoretical
predictions that metallicity is a primary and influential factor in determining the key
properties of LGRB progenitors and their explosion properties (e.g. MacFadyen & Woosley
2002, Ramirez-Ruiz et al. 2002, Stanek et al. 2006). Finally, the unusual GRB 090426
has demonstrated that a proper understanding of the relationship between GRBs and their
169

host environments could prove vital to phenomenologically classifying these events as our
ever-growing sample of GRBs becomes increasingly diverse.
With these results in mind, several new questions have been raised about LGRBs and
their connection with metallicity:
• What effect, if any, does metallicity have on the production and explosive properties
of LGRBs?
• What LGRB progenitor model best accommodates these new results?
• Can host galaxy environments be used as a potential future means of classifying GRBs
according to their progenitor phenomena?
In addition to the work included here on the gamma-ray energy release of LGRBs,
other prompt emission properties of interest include X-ray luminosities, which can be
determined from high-energy space-based observations, and blastwave velocities, which can
be determined through ground-based radio observations. With the cutting-edge Swift and
Fermi gamma-ray telescopes currently in operation, we are gathering an unprecedented
amount of high-energy prompt emission data for GRBs. New ground-based resources,
such as the extremely wideband (3000A - 25000A) X-Shooter spectrograph at the Very
Large Telescope (D’Odorico et al. 2006) and the increased sensitivity of the Expanded
Very Large Array (Perley et al. 2004), vastly expand the scope of ground-based follow-
up observations. Finally, new deep all-sky surveys such as Pan-STARRS (Kaiser et al.
2002) and the Large Synoptic Survey Telescope (Ivezic et al. 2008) will offer a wealth of
data for host galaxy identifications and follow-up studies. Looking to the future, the next
generation of large ground-based telescopes, including the Thirty Meter Telescope and the
Giant Magellan Telescope, will revolutionize our understanding of these events’ progenitors
and host environments.
In addition to studying the events and afterglows, LGRB progenitor models need to be
refined in light of recent results on these events’ host environments and energetic properties.
LGRBs have been convincingly linked with the core-collapse of massive stars, but the
170

mass-loss and production mechanisms that enable these stars to explode as GRBs remain
extremely unclear. New progenitor models of LGRBs must take into consideration our
results on the relationship between LGRBs and host galaxy metallicity. In turn, these
models will require more detailed treatments of mass loss and metallicity effects on massive
stellar evolution. Improving these models is dependent upon a better understanding of
low-metallicity massive star populations as a whole.
Finally, an immediate goal of GRB studies is to improve our current classification
scheme for GRBs, with the goal of confidently differentiating between events according
to production mechanisms rather than a simple duration-based criterion. For this reason,
continuing our current survey of LGRB host galaxies is vital, for understanding the potential
environmental effects on LGRB progenitors as well as exploring the possibility of using host
galaxy properties as a potential means of classification. An accompanying survey of SGRB
host galaxy environments is also required (see Berger 2009).
2. Can current stellar population synthesis and photoionization codes produce
satisfactory models of LGRB host galaxies?
We have generated a new grid of stellar population synthesis and photoionization models
using the latest generations of the Starburst99 and Mappings III codes. From a comparison
of these models to the general star-forming galaxy population, we can conclude that
our models show an improvement over previous work. Models in our grid that adopt
a continuous SFH, or a zero-age instantaneous burst SFH with an enhanced mass loss
treatment in the evolution tracks, show the greatest agreement with the general galaxy
population. The general approximation of a single luminosity-weighted HII region that we
adopt in our models is also comparable to other models, such as those of Dopita et al. (2006),
that integrate multiple synthetic spectra of HII regions to produce models of star-forming
galaxies. The metallicities and ionization parameters adopted in our model grid are also in
agreement with both LGRB hosts and the general galaxy population.
171

However, several critical shortcomings still remain to be addressed. Most notably, we
find that our models still appear to produce an insufficiently hard FUV ionizing spectrum
that cannot reproduce some of the line fluxes observed in LGRB hosts and star-forming
galaxies, such as [SII]. We draw the same conclusions from our comparison with the LGRB
host galaxy sample. We have also found that higher-resolution stellar population synthesis
models are required in future grids if we wish to use our models to study the SFHs and older
stellar populations of LGRB hosts and other galaxies. Such work also requires improved
continuum spectra of the most nearby LGRB hosts. Based on this work, we can present
goals meant to direct future work in this area:
• Future generations of these models should include the newest stellar evolutionary
tracks, which adopt more detailed mass-loss treatments accommodating the effects of
rotation and metallicity.
• Detailed observations of the most nearby GRB host galaxies and new high-resolution
stellar population synthesis models are required to begin modeling the old stellar
populations present in these hosts.
Vazquez et al. (2007) have already presented preliminary results of the new Geneva
evolutionary tracks, which include the effects of rotation on the stellar population. From
our limited comparison at solar metallicity, these tracks already appear to produce a harder
FUV ionizing spectrum in the current Starburst99 code. A complete set of evolutionary
tracks with rotation is in the final stages of preparation by the Geneva group - with these
tracks we should be able to extend our comparison to lower metallicities, running new
models with the Starburst99 and Mappings III codes and reevaluating their [SII] fluxes in
particular to search for improvements over the current model grid.
There are several nearby LGRB host galaxies that are large and bright enough to
permit detailed high S/N spectra focused on LGRB explosions sites and other host regions.
Combined with improved stellar population synthesis and photoionization models, we would
be able to form a more detailed picture of the star formation histories and underlying stellar
172

populations present in LGRB hosts. Christensen et al. (2008) have acquired emission-line
spectra of a number of regions throughout the bright z = 0.009 host of GRB 980425;
it would be beneficial to conduct a similar study of this host with deeper spectra that
include high-S/N observations in the continuum. The z = 0.034 dwarf host of GRB 060218
(Wiersema et al. 2007) and the morphologically complex host galaxy of GRB 100316D at
z = 0.059 (Chornock et al. 2010) are also good candidates for such observations. New
spectra and additional modeling of these host galaxies will offer important insights into the
stellar populations that dominate LGRB host environments.
3. How do massive stars evolve in and contribute to LGRB host environments?
What can this tell us about progenitor evolution and stellar population modeling
in these galaxies?
Reviewing the two questions presented above, the conclusions of this thesis have highlighted
the critical importance of understanding massive stellar evolution and, in particular, the
effects of metallicity on the physical properties and mass loss rates of evolved massive star
populations. Improving our understanding of the complex connection between LGRBs and
host galaxy metallicity is dependent on unraveling the many varied effects that metallicity
can have on their massive stellar progenitors. Future galaxy model grids also require
improvements to the stellar evolutionary tracks, which in turn depend on comparisons
with observations of massive stars across a wide range of metallicities.
Here we have extended our previous work on RSGs, a key mass-loss phase in the
evolution of moderate massive stars, down to the low-metallicity Local Group galaxies
NGC 6822 and WLM. From our preliminary results, we find evidence that the unusual late-
type variable stars previously observed in the Magellanic Clouds may also be present in the
low-metallicity RSG samples studied here. We have also laid the groundwork for a more
dedicated study of the RSG populations in these host galaxies. It is clear, from our previous
results, that studying the physical properties, mass loss rates, and other evolutionary
behaviors of massive stars is a vital endeavor if we wish to improve our understanding
173

of LGRBs and their host galaxy populations. Considering this fact, our future work in this
area will be focused on these key objectives:
• The current study of RSGs in NGC 6822 and WLM should be completed, and the
samples compared to the new low-metallicity Geneva tracks with rotation.
• Studies of evolved massive stars in Local Group galaxies should be ultimately extended
to include a more complete sample of post-main-sequence stars, including yellow
supergiants and Wolf-Rayet stars.
With the improved observational techniques and stellar atmosphere models discussed in
Chapter 6, we will be able to determine the physical properties for a large sample of RSGs
in NGC 6822 and WLM. These in turn can be compared to the newest generation of the
Geneva tracks - specifically, the tracks discussed above which adopt a treatment of rotation
effects - to evaluate their ability to reproduce the physical properties of low-metallicity
massive stellar populations. These tracks are currently in the final stages of preparation,
but have had no previous comparison with data from evolved massive stars at these lower
metallicities, particularly in the case of the WLM sample (Meynet, private communication).
Extending these studies of evolved massive stars to include the yellow supergiant and
Wolf-Rayet populations will be challenging. Studies of the yellow supergiant populations
in Local Group galaxies are already underway, addressing the difficulties of removing
foreground contaminants and highlighting the challenges that yellow supergiants pose to
current predictions of the evolutionary tracks (Drout et al. 2009, Neugent et al. 2010). A
number of past studies have detected Wolf-Rayet stars in Local Group galaxies, including
the Magellanic Clouds and NGC 6822 (see Massey & Johnson 1998, Massey 2003, and
Massey et al. 2007 for an overview); however, these observations have revealed that Wolf-
Rayet stars become increasingly rare at low metallicities (Massey 2003), making studies of
such stars a challenge. The exception to this appears to be the Local Group galaxy IC 10, a
luminous dwarf galaxy thought to be undergoing a starburst phase (Massey & Armandroff
1995). Despite its low metallicity (log(O/H) + 12 = 8.2), IC 10 contains at least 26 Wolf-
174

Rayet stars (Crowther et al. 2003), a number that is expected to rise (Massey & Holmes
2002, Massey et al. 2007). Dedicated spectroscopic studies of the unique and opportune
sample of low-metallicity Wolf-Rayet stars in IC 10 could prove invaluable to understanding
the physical properties and evolution of LGRB progenitors.
The study of GRB host galaxies is an extremely young endeavor in the field of astronomy.
It is only in the last decade that we have even begun to consider the relevance that these
host environments might have to our larger understanding of LGRB production, stellar
evolution, and our study of the high-redshift universe. From this work we now have a
clearer picture of the complex role that metallicity plays in LGRB production. We have
scrutinized current stellar population synthesis and photoionization codes, presenting a new
grid of models and outlining the steps that must be taken to facilitate future improvements.
Finally, we have demonstrated the importance of understanding massive stellar evolution
and the effects of metallicity, an area which is critical to future progress in the study of
LGRBs. By pursuing the questions and goals presented here during the years to come, we
will continue to develop new insights into the origins of these enigmatic events.
175

Appendix A
LGRB Host Galaxy Properties
A.1 GRB 980425
Christensen et al. (2008) publish emission line fluxes for the very low-redshift (z = 0.009)
host galaxy of GRB 980425 that have been corrected for a Galactic extinction of E(B− V )
= 0.059 from Schlegel et al. (1998). We find an E(B − V ) = 0.34 based on their published
fluxes, which we use to correct for extinction from the host galaxy. While Christensen et al.
(2008) do not measure a flux for the [OIII]λ4959 line, we adopt a flux for this line that is
1/3 the flux of the [OIII]λ5007 line, and thus determine an R23 metallicity of log(O/H) +
12 ∼ 8.4, at the turnover point of the double-valued R23 diagnostic. Adopting the Pettini
& Pagel (2004) O3N2 metallicity diagnostic we determine a metallicity of log(O/H) + 12
= 8.28. We adopt the Christensen et al. (2008) young stellar population age of 5.0Myr.
We measure SFR = 0.57 M/yr for the host galaxy using the Kennicutt (1998) relation
and our dereddened Hα line flux, slightly higher than Christensen et al. (2008)’s value of
0.23 M/yr. Using photometry from Savaglio et al. (2009) and the Le Phare code we find
a stellar mass for the host galaxy of log(M?/M) = 9.22 ± 0.52.
A.2 GRB 980703
The host galaxy of GRB 980703 is at an intermediate redshift of z = 0.966 (Figure A1). The
Hγ/Hβ ratio in this galaxy gives us an E(B−V ) = 0, and thus no correction for extinction
176
is applied. We can apply the Kobulnicky & Kewley (2004) R23 metallicity diagnostic to
this galaxy, but without a detection of the Hα and [NII]λ6584 features we cannot determine
whether it lies on the lower or upper branches of the diagnostic. Calculating metallicities
for both branches, we find log(O/H) + 12 = 8.31 (lower; log q = 7.51) and log(O/H) + 12
= 8.65 (upper; log q = 7.66). We also determine a young stellar population age for this
host galaxy of 4.7 ± 0.1 Myr for the lower-branch metallicity and 4.4 ± 0.2 Myr for the
upper-branch metallicity. Using the flux of the [OII]λ3727 line and the Kewley et al. (2004)
metallicity-dependent relation, we determine SFRs of 9.9 M yr−1 for the lower-branch
metallicity and 13.6 M yr−1 for the upper-branch metallicity. These SFRs agree with the
lower limit of >7 M yr−1 determined by Djorgovski et al. (1998) and the 8-13 M yr−1
range found by Holland et al. (2001). Finally, with photometry from Savaglio et al. (2009)
and the Le Phare code we find a stellar mass for the host galaxy of log(M?/M) = 9.83 ±
0.13.
A.3 GRB 990712
Kupcu Yoldas et al. (2006) publish emission fluxes for the z = 0.434 host galaxy of GRB
990712 that have been corrected for a foreground extinction of E(B-V) = 0.03 based on
Schlegel et al. (1998). We find an E(B − V ) = 0.57 based on the ratio of the Hγ and
Hβ line fluxes from their July 2005 spectrum, and use this to correct the published fluxes.
Using fluxes uncorrected for the host extinction, Kupcu Yoldas et al. (2006) calculate a
metallicity of log(O/H) + 12 = ∼8.3 based on the Kobulnicky & Kewley (2004) R23 lower
branch diagnostic. With our corrected fluxes, we determine a metallicity of log(O/H) + 12
∼ 8.4, at the turnover point of the diagnostic. Finally, we can calculate SFR based on both
the [OII] flux and the Hβ flux. Assuming a Balmer decrement of 2.87 (Osterbrock 1989)
to calculate an Hα flux from the Hβ emission line, we find 14.23 M/yr from Kennicutt
(1998). Using the metallicity-dependent relation for [OII] from Kewley et al. (2004), we find
10.7 M/yr, in agreement with the extinction-corrected SFR of 10+15−6 M/yr from Kupcu
177

Yoldas et al. (2006). With no reported WHβ we do not determine an age for the young
stellar population in this galaxy. Adopting photometry from Savaglio et al. (2009) and the
Le Phare code, we find a stellar mass for the host galaxy of log(M?/M) = 9.15 ± 0.04.
A.4 GRB 991208
The host galaxy of GRB 991208 is at an intermediate redshift of z = 0.706 (Figure A2).
We calculate an E(B − V ) = 0.58 based on the Hγ/Hβ ratio and correct the fluxes of our
observed emission lines accordingly. We apply the R23 metallicity diagnostic to this galaxy,
and use our NIRSPEC observations of the Hα emission feature and the [NII]λ6584 upper
limit to place this host galaxy on the lower branch of the diagnostic. This yields a host
galaxy metallicity of log(O/H) + 12 = 8.02 (log q = 7.38) We determine a young stellar
population age of 4.2 ± 0.2 Myr for this host. Using the flux of the [OII] 3727A line and the
metallicity-dependent Kewley et al. (2004) relation we measure 3.47 M/yr for this host;
calculating an Hα emission flux based on the Hβ line and a Balmer decrement of 2.87, we
find an SFR of 4.23 M/yr from Kennicutt (1998). We find that the Hβ line in the GRB
991208 host spectrum is asymmetric toward the red, suggesting the possible presence of an
inflow in the galaxy. Using photometry from Savaglio et al. (2009) and the Le Phare code,
we find a stellar mass for this host galaxy of log(M?/M) = 8.85 ± 0.17.
A.5 GRB 010921
The host galaxy of GRB 010921 is at an intermediate redshift of z = 0.451 (Figure A3). The
Hγ/Hβ ratio in this galaxy gives us an E(B−V ) = 0, and thus no correction for extinction
is applied. Based on the [NII]λ6584/Hα ratio, we place GRB 010921 on the lower branch
of the Kobulnicky & Kewley (2004) R23 metallicity diagnostic, calculating a metallicity of
log(O/H) + 12 = 8.24 and an ionization parameter of log q = 7.44. We also determine a
young stellar population age of 8.0 ± 0.2 Myr. Using the flux of the [OII] 3727A line and
the Kewley et al. (2004) relation we measure a SFR of 0.70M/yr; we also determine an
178

Hα emission flux based on the Hβ line and a Balmer decrement of 2.87, finding an SFR of
0.52 from Kennicutt (1998). Adopting photometry from Savaglio et al. (2009) and using
the Le Phare code, we also determine a stellar mass for the host galaxy of log(M?/M) =
9.56+0.09−0.11.
A.6 GRB 020405
The host galaxy of GRB 020405 is at an intermediate redshift of z = 0.691 (Figure A4). The
Hδ/Hβ ratio in this galaxy gives us an E(B−V ) = 0, and thus no correction for extinction
is applied. We are able to apply the R23 metallicity diagnostic to this galaxy, but once
again lack the redshifted Hα and [NII] emission line fluxes necessary to distinguish between
the upper and lower branch metallicities. We calculate metallicities for both branches and
find log(O/H) + 12 = 8.33 (lower; log q = 7.65) and log(O/H) + 12 = 8.59 (upper; log q =
7.78). We determine a young stellar population age of 6.2 ± 0.2 Myr for the lower branch
metallicity, and 5.4 ± 0.3 Myr for the upper branch metallicity. Finally, using the flux of
the [OII] 3727A line and the Kewley et al. (2004) relation we measure 1.61 M/yr for the
lower branch metallicity and 2.05 M/yr for the upper branch metallicity; calculating an
Hα emission flux based on the Hβ line and a Balmer decrement of 2.87, we find an SFR of
1.22 from Kennicutt (1998).
A.7 GRB 020819
For a detailed discussion of the unusual host galaxy of GRB 020819, see 4.1; for this work we
adopt the ISM properties derived for the nucleus of the host galaxy. We adopt photometry
from Savaglio et al. (2009) and use the Le Phare code to determine a stellar mass for the
host galaxy of log(M?/M) = 10.65 ± 0.19.
179

A.8 GRB 020903
The host galaxy of GRB 020903 is a low-redshift galaxy in our sample at z = 0.251 (Figure
A5). The Hα/Hβ ratio in this galaxy gives us an E(B− V ) = 0, and thus no correction for
extinction is applied. We apply the R23 metallicity diagnostic and use the [NII]/Hα ratio
to place this galaxy on the lower branch; this gives us log(O/H) + 12 = 8.07 (log q = 8.15).
We also calculate a Pettini & Pagel (2004) metallicity of log(O/H) + 12 = 7.98 based on
the O3N2 diagnostic. We determine a young stellar population age of 5.4 ± 0.2 Myr. From
the flux of the Hα line we measure a SFR of 1.7 M/yr based on Kennicutt (1998). Using
the photometry from Savaglio et al. (2009) and the Le Phare code, we find a stellar mass
for this host of log(M?/M) = 8.79+0.19−0.24.
A.9 GRB 031203
The host galaxy of GRB 031203 is a low-redshift galaxy in our sample at z = 0.105 (Figure
A6, top). Based on the Kewley et al. (2006) emission line ratio diagnostics for classifying
AGN and star-forming galaxies, this host is classified as either a composite or Seyfert
galaxy rather than a star-forming galaxy. The presence of AGN activity could potentially
contaminate our derived metallicities and other ISM properties. However, applying the
diagnostics employed for the star-forming LGRB hosts in our sample, we determine E(B−V )
= 1.17 based on the Hα/Hβ ratio, which we adopt when correcting for extinction. This
high amount of extinction is consistent with the findings of Margutti et al. (2007), who
determine a Galactic E(B − V ) = 0.72 and an instrinsic E(B − V ) = 0.38; Cobb et al.
(2004) also show that GRB 031203’s location is very close to the Galactic plane, suggesting
that we would expect an increased amount of extinction towards the host galaxy. We apply
the R23 metallicity diagnostic and detection of the auroral [OIII]λ4363 line (Figure A6,
bottom) to place this galaxy on the lower branch, giving a metallicity of log(O/H) + 12 =
8.27 (log q = 8.37). We also calculate a Pettini & Pagel (2004) metallicity of 8.10 based
on the O3N2 diagnostic and log(O/H) + 12 = 7.96 based on Te. We determine a young
180

stellar population age of 4.7 ± 0.1 Myr. From the flux of the Hα line we measure a SFR
of 4.8 M/yr based on Kennicutt (1998). Adopting photometry from Savaglio et al. (2009)
and using the Le Phare code, we find a stellar mass for the host galaxy of log(M?/M) =
8.26 ± 0.45.
A.10 GRB 030329
The host galaxy of GRB 030329 is a low-redshift galaxy at z = 0.168 (Figure A7, top). We
determine E(B−V ) = 0.13 based on the Hα/Hβ ratio, which we adopt when correction for
extinction. We apply the R23 metallicity diangostic and use the [NII]/[OII] and [NII]/Hα
ratio along with detection of the [OIII] λ4363 (Figure A7, bottom) line to place this galaxy
on the lower branch, giving us log(O/H) + 12 = 8.13 (log q = 7.80). We also calculate a
Pettini & Pagel (2004) metallicity of log(O/H) + 12 = 8.00 based on the O3N2 diagnostic
and a Te metallicity of log(O/H) + 12 = 7.72. We determine a young stellar population age
of 4.9 ± 0.1 Myr. Using the flux of the Hα line we measure a SFR of 1.2 M/yr based on
Kennicutt (1998). With photometry from Savaglio et al. (2009) and the Le Phare code we
find a stellar mass for the host galaxy of log(M?/M) = 7.91+0.12−0.44. We find that the neutral
hydrogen lines are double-peaked, indicating two components.
A.11 GRB 030528
Rau et al. (2005) publish emission-line fluxes, uncorrected for extinction, for the [OII]λ3727,
Hβ, [OIII]λ4959, and [OIII]λ5007 features in the z = 0.782 host galaxy of GRB 030528.
They also include upper limits on the [NeIII]λ3869, Hδ, and Hγ emission features. Rau et
al. (2005) propose a total line-of-sight AV < 2.5 for this host, corresponding to a Galactic
E(B−V ) < 0.62 from Schlegel et al. (1998) and an addition host extinction of E(B−V ) <
0.19. However, Dutra et al. (2003) suggest a lower line-of-sight E(B − V ) = 0.46, following
a rescaling of the Schlegel et al. (1998) extinction. We consider both of these proposed
E(B − V ) values in our analysis, and find that in both cases the R23 value places the
181

host metallicity on the log(O/H) + 12 ∼ 8.4 turnover of the Kobulnicky & Kewley (2004)
diagnostic. We also find a lower limit of SFR > 12.1M yr−1 based on the metallicity-
dependent [OII] relation of Kewley et al. (2004). Using photometry from Savaglio et al.
(2009) and the Le Phare code, we find a stellar mass for the host galaxy of log(M?/M) =
9.11+0.23−0.26.
A.12 GRB 050824
Sollerman et al. (2007) publish fluxes for the [OII]λ3727, [NeIII]λ3869, Hβ, [OIII]λ4959,
and [OIII]λ5007 emission features in the z = 0.828 host galaxy of GRB 050824. These
fluxes are uncorrected for Galactic extinction (E(B− V ) = 0.035 from Schlegel et al. 1998)
or host extinction; however, they estimate a host extinction of E(B − V ) < 0.16, which we
adopt here. Sollerman et al. (2007) find log(R23) ∼ 1, which corresponds to the turnover
of the Kobulnicky & Kewley (2004) R23 metallicity diagnostic; we find the same result,
and determine a metallicity for the host galaxy of log(O/H) + 12 ∼ 8.4, which remains
unchanged across the full range of E(B − V ). We also measure SFR < 0.941M yr−1
for the host using the metallicity-dependent relation for [OII] from Kewley et al. (2004),
slightly lower than the Sollerman et al. (2007) value of 1.8M yr−1 using the Kennicutt
(1998) [OII] and Hα relations.
A.13 GRB 050826
The host of GRB 050826 is a low-redshift galaxy in our sample at z = 0.296 (Figure A4).
Based on the Hα and Hβ line fluxes we observe for this host, we determine a total line-
of-sight E(B − V ) = 0.60, which we adopt when correcting for extinction. We use the
[NII]/Hα ratio to place this galaxy on the upper branch of the Kobulnicky & Kewley (2004)
R23 metallicity diagnostic; this gives us a surprisingly high log(O/H) + 12 = 8.83 (log q =
7.51). We determine a young stellar population age for this host of 5.9 ± 0.7 Myr. We use
the Hα flux and the Kennicutt (1998) relation to determine SFR = 2.94 M yr−1. Using
182
the photometry of Savaglio et al. (2009) and the Le Phare code, we determine a stellar mass
for the host galaxy of log(M∗/M) = 10.10+0.22−0.26.
A.14 GRB 051022
The host galaxy of GRB 051022 is at an intermediate redshift of z = 0.807 (Figure
A9). Based on the Hγ/Hβ ratio we calculate an E(B − V ) = 0.50, which we use to
correct the emission line fluxes for extinction. We apply the R23 metallicity diagnostic
and determine [NII]/Hα ratio using equivalent widths from the NIRSPEC near-IR host
spectrum of Graham et al. (2009a,b). Based on [NII]/Hα we place this galaxy on the upper
branch of the R23 diagnostic; this gives us log(O/H) + 12 = 8.62 (log q = 7.54), a value
comparable to the log(O/H) + 12 = 8.77 measured by Graham et al. (2009a) based on the
R23 diagnostic. Our Pettini & Pagel (2004) metallicity based on the O3N2 diagnostic gives
a metallicity of log(O/H) + 12 = 8.37. We determine a young stellar population age of 5.2
± 0.3 Myr. Adopting photometry from Savaglio et al. (2009) and the Le Phare code we
find a stellar mass for the host galaxy of log(M?/M) = 10.42 ± 0.05.
Finally, using the extinction-corrected flux of the [OII] line we measure a surprisingly
high SFR of 271 M/yr based on Kewley et al. (2004). We also determine SFR by using
the Hβ emission line flux and the Balmer decrement of 2.87 to estimate the Hα flux for
this host galaxy. With this estimated flux and the Kennicutt (1998) relation, we determine
a comparable SFR of 328 M/yr. This high star formation rate is in agreement with the
findings of Berger et al. (2003), who propose that ∼20% of GRB host galaxies have very
high SFRs on the order of 500 M/yr based on sub-millimeter and radio observations of
GRB host galaxies. There is speculation that this host galaxy may be in the midst of a
merger, and that this could be a contributing factor to this extremely high SFR (Graham
et al. 2009, Graham et al. in prep).
183

A.15 GRB 060218
The host galaxy of GRB 060218 is a low-redshift galaxy in our sample at z = 0.034 (Figure
A10). We determine a very low E(B − V ) = 0.01 based on the Hα/Hβ ratio, which we
adopt when correcting for extinction. We apply the R23 metallicity diagnostic and use the
[NII]/Hα ratio along with detection of the [OIII] λ4363 line to place this galaxy on the
lower branch; this gives us log(O/H) + 12 = 8.21 (log q = 7.71). We also calculate a Pettini
& Pagel (2004) metallicity of 8.07 based on the O3N2 diagnostic and a metallicity of 7.62
based on Te. We determine a young stellar population age of 5.6 ± 0.2 Myr. Finally, using
the flux of the Hα line we measure a SFR of 0.03 M/yr based on Kennicutt (1998). We
find that the Hα line is slightly asymmetric towards the red, indicating the possible presence
of an inflow in the host galaxy. Adopting photometry from Savaglio et al. (2009) and the
Le Phare code we find a stellar mass for the host galaxy of log(M?/M) = 8.37 ± 0.14.
A.16 GRB 070612A
The host galaxy of GRB 070612A is at an intermediate redshift of z = 0.671 (Figure
A11). Based on the Hβ and Hγ line fluxes observed in this host, we determine a total
line-of-sight E(B − V ) = 0.64, which we adopt when correcting our observed line fluxes for
extinction. Using the Kobulnicky & Kewley (2004) R23 metallicity diagnostic along with
the Hα detection and [NII]λ6584 upper limit determined from our NIRSPEC observations
of the host (Figure A11, bottom), we place this galaxy on the lower branch of the diagnostic,
with log(O/H) + 12 = 8.29 (log q = 7.28). We also determine a young stellar population
age of 5.8 ± 0.2 Myr for the host, and a SFR = 81 M yr−1 based on the [OII] flux and
the metallicity-dependent relation of Kewley et al. (2004).
184

Figure A.1 Our spectrum of the z = 0.966 host galaxy of GRB 980703, observed with LRISat Keck I on 18 November 2009.
185

Figure A.2 Our spectra of the z = 0.706 host galaxy of GRB 991208, observed with LRISat Keck on 31 May 2008 (top) and with NIRSPEC at Keck II on 2 May 2010 (bottom).
186

Figure A.3 Our spectra of the z = 0.451 host galaxy of GRB 010921. The blue side wasobserved with LRIS at Keck on 2 November 2008 (top), and the Hα feature and [NII] λ6584upper limit were observed with LRIS at Keck on 19 November 2009 (bottom).
187
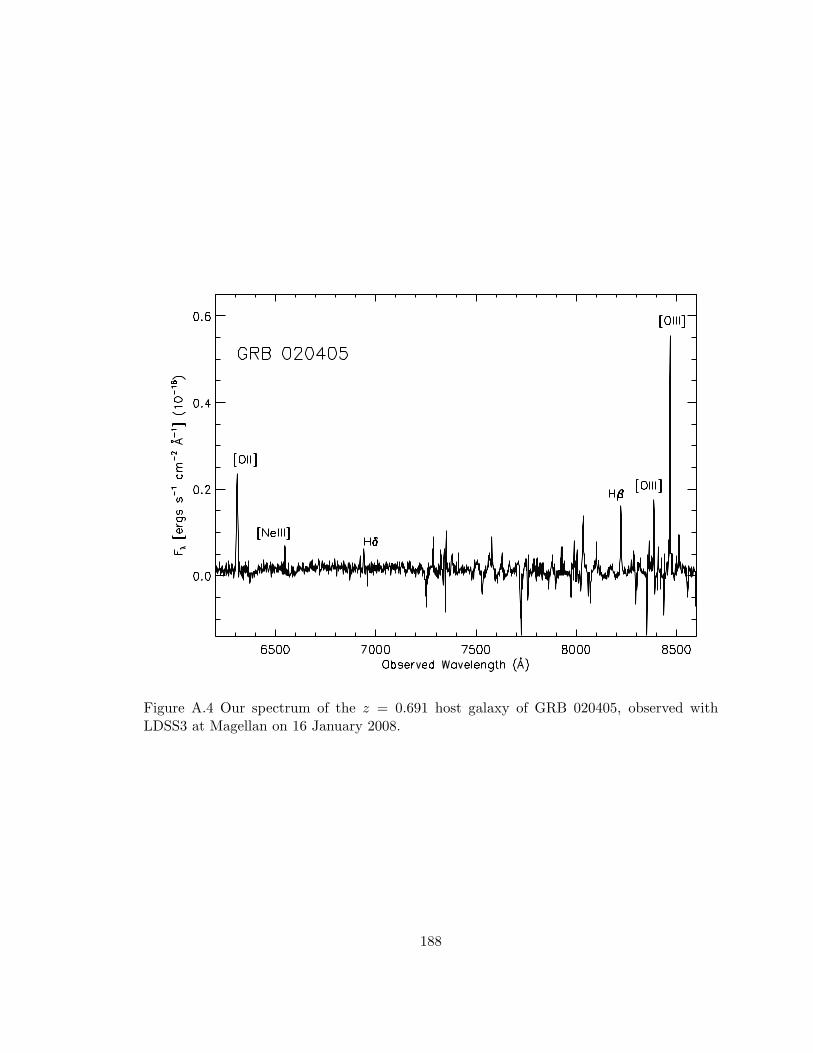
Figure A.4 Our spectrum of the z = 0.691 host galaxy of GRB 020405, observed withLDSS3 at Magellan on 16 January 2008.
188

Figure A.5 Our spectrum of the z = 0.251 host galaxy of GRB 020903, observed with LRISat Keck 7 October 2003
189

Figure A.6 Our spectrum of the z = 0.105 host galaxy of GRB 031203 observed with LRISat Keck on 19 December 2003; we plot the entire spectrum (top), with the blue region ofthe spectrum enhanced to illustrate detection of the [OIII]λ4363 line (bottom).
190

Figure A.7 Our spectrum of the z = 0.168 host galaxy of GRB 030329 observed with LRISat Keck on 25 April 2009; we plot the entire spectrum (top), with the blue region of thespectrum enhanced to illustrate detection of the [OIII]λ4363 line (bottom).
191

Figure A.8 Our spectra of the z = 0.296 host galaxy of GRB 050826, observed with LDSS3at Magellan on 14 January 2008 (top) and 6 January 2006 (bottom). The 2008 spectrumcovers the full range of spectral features; the 2006 spectrum shows detections of the Hα,[NII] λ6584, and [SII] λλ6717,6731 emission features.
192
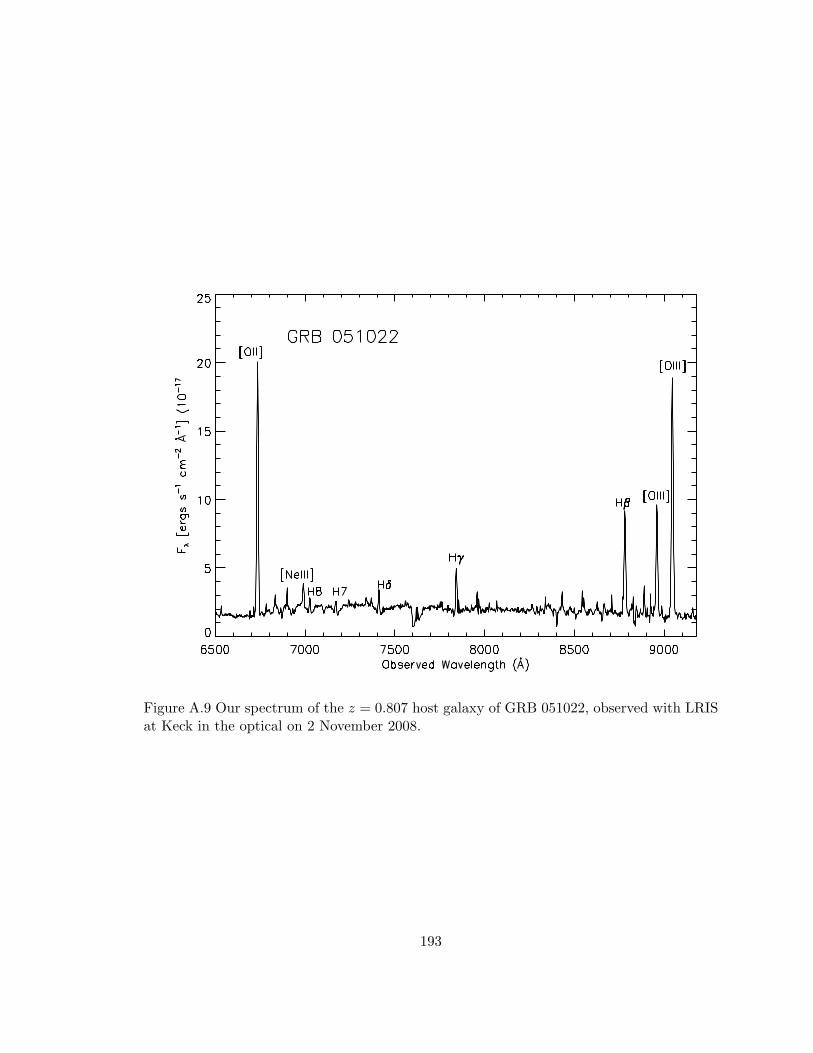
Figure A.9 Our spectrum of the z = 0.807 host galaxy of GRB 051022, observed with LRISat Keck in the optical on 2 November 2008.
193

Figure A.10 Our spectrum of the z = 0.034 host galaxy of GRB 060218, observed withLRIS at Keck on 7 September 2007.
194

Figure A.11 Our spectra of the z = 0.671 host galaxy of GRB 070612A, obseved with LRISat Keck I on 18 November 2009 (top) and with NIRSPEC at Keck II on 3 November 2009(bottom).
195

REFERENCES
Abbott, D. C. 1982, ApJ, 259, 282
Abbott, B. et al. 2008, ApJ, 681, 1419
Abraham, R. G., et al. 2004, AJ, 127, 2455
Adelman-McCarthy, J. K. et al. 2006, ApJS, 162, 38
Alloin, D., Collin-Souffrin, S., Joly, M., & Vigroux, L. 1979, A&A, 78, 200
Amati, L. 2006, MNRAS, 372, 233
Amati, L., Guidorzi, C., Frontera, F., Della Valle, M., Finelli, F., Landi, R., & Montanari,
E. 2008, MNRAS, 391, 577
Anders, E. & Grevesse, N. 1989, Geochim. Cosmochim. Acta, 53, 197
Antonelli, L. A., et al. 2009, A&A, 507, 45
Asplund, M., Grevesse, N., & Sauval, A. J. 2005, in Astronomical Society of the Pacific
Conference Series, Vol. 336, Cosmic Abundances as Records of Stellar Evolution and
Nucleosynthesis, ed. T. G. Barnes, III & F. N. Bash, 25
Atteia et al. 2003, GRB Coordinates Network, 2256, 1
Atwood, W. B., et al. 2009, ApJ, 697, 1071
Baldwin, J. A., Phillips, M. M., & Terlevich, R. 1981, Pub. A. S. P., 93, 5
Barton Gillespie, E., Geller, M. J., & Kenyon, S. J. 2003, ApJ, 582, 668
Bell, E. F. & de Jong, R. S. 2000, MNRAS, 312, 497
Bennett, P. D., Levesque, E. M., Massey, P., & Brown, A. 2010, in prep
Berger, E. 2007, ApJ, 670, 1254
Berger, E. 2009, ApJ, 690, 231
Berger, E., et al. 2003, Nature, 426, 154
196

Berger, E., Fox, D. B., Kulkarni, S. R., Frail, D. A., & Djorgovski, S. G. 2007, ApJ, 660,
504
Berger, E., et al. 2007, ApJ, 664, 1000
Bicker, J. & Fritze-v. Alvensleben, U. 2005, A&A, 443, L19
Bigelow, B. C., Dressler, A. M., Shectman, S. A., & Epps, H. W. 1998, SPIE, 3355, 225
Binette, L., Dopita, M. A., & Tuohy, I. R. 1985, ApJ, 297, 476
Bloom, J. S., Frail, D. A., & Kulkarni, S. R. 2003, ApJ, 594, 674
Bloom, J. S., Kulkarni, S. R., & Djorgovski, S. G. 2002, ApJ, 121, 1111
Bloom, J. S., et al. 2007, ApJ, 654, 878
Boella, G., Butler, R. C., Perola, G. C., Piro, L., Scarsi, L., & Bleeker, J. A. M. 1997,
A&AS, 122, 299
Boselli, A., Gavazzi, G., Donas, J., & Scodeggio, M. 2001, AH, 121, 753
Bresolin, F., Pietrzynski, G., Urbaneja, M. A., Gieren, W., Kudritzki, R. P., & Venn, K.
A. 2006, ApJ, 648, 1007
Brown, W., Kewley, L. J., & Geller, M. J. 2008, AJ, 135, 92
Bruzual, A. G. & Charlot, S. 1993, ApJ, 405, 538
Bruzual, G. & Charlot, S. 2003, MNRAS, 344, 1000
Burrows, D. N., et al. 2005, Space Sci. Rev., 120, 165
Butler, N. R., Kocevski, D., Bloom, J. S., & Curtis, J. L. 2007, ApJ, 671, 656
Calzetti, D. 1997, in The Ultraviolet Universe at Low and High Redshift: Probing the
Progress of Galaxy Evolution, eds. W. H. Waller, M. N. Fanelli, J. E. Hollis, & A.
C. Danks, AIP Conf. Proc. 408 (Woodbury: AIP), 403
Calzetti, D., Armus, L., Bohlin, R. C., Kinney, A. L., Koornneef, J., & Storchi-Bergmann,
T. 2000, ApJ, 533, 682
Cardelli, J. A., Clayton, G. C., & Mathis, J. S. 1989, ApJ, 345, 245
197

Carpenter, J. M. 2001, AJ, 121, 2851
Castro Ceron, J. M., Micha lowski, M. J., Hjorth, J., Watson, D., Fynbo, J. P. U., &
Gorosabel, J. 2006, ApJ, 653, 85
Castro Ceron, J. M., Micha lowski, M. J., Hjorth, J., Malesani, D., Gorosabel, J., Watson,
D., & Fynbo, J. P. U. 2008 (arXiv:0803.2235)
Castro-Tirado, A. J. et al. 2007, A&A, 475, 101
Cenko, S. B. et al. 2008, ApJ, 677, 441
Chabrier, G. 2003, PASP, 115, 763
Chapman, R., Priddey, R. S., & Tanvir, N. R. 2009, MNRAS, 395, 1515
Charbonnel, C., Meynet, G., Maeder, A., Schaller, G., Schaerer, D. 1993, A&AS, 101, 415
Charlot, S. & Bruzual. G. A. 1991, ApJ, 367, 126
Charlot, S. & Longhetti, M. 2001, MNRAS, 323, 887
Chary, R., Berger, E., & Cowie, L. 2007, ApJ 671, 272
Chen, H-W., Prochaska, J. X., & Gnedin, N. Y. 2007, ApJ, 667, L125
Chen, H-W., et al. 2009, ApJ, 691, 152
Chiappini, C., Matteucci, F., Ballerro, S. K. 2005, A&A, 437, 429
Chiappini, C., Hirschi, R., Meynet, G., Maeder, A., & Matteucci, F. 2006, A&A, 449, 27
Chornock, R., et al. 2010, ApJL, submitted (arXiv:1004.2262)
Christensen, L., Hjorth, J., Gorosabel, J. 2004, A&A, 425, 913
Christensen, L., Vreeswijk, P. M., Sollerman, J., Thone, C. C., Le Floc’h, E., & Wiersema,
K. 2008, A&A, 490, 45
Cid Fernandes, R., Gonzalez Delgado, R. M., Schmitt, H., Storchi-Bergmann, T., Martins,
L. P., Perez, E., Heckman, T., Leitherer, C., & Schaerer, D. 2004, ApJ, 605, 105
Cid Fernandes, R., Heckman, T., Schmitt, H., Gonzalez Delgado, R. M., & Storchi-
Bergmann, T. 2001, ApJ, 558, 81
198
Cioni, M.-R. L. & Habing, H. L. 2005, A&A, 429, 837
Cobb, B. E., Bloom, J. S., Perley, D. A., Morgan, A. N., Cenko, S. B., & Filippenko, A. V.
2010, ApJL, submitted (arXiv:1005.4961)
Considere, S., Coziol, R., Contini, T., & Davoust, E. 2000, A&A, 356, 89
Conti, P. S. 1976, Memoires of the Societe Royale des Sciences de Liege, 9, 193
Conti, P. S. 1988. In O-Stars and WR Stars, NASA SP-497, ed. PS Conti, AB Underhill,
pp. 81-269. Washington, DC: NASA
Copetti, M. V. F., Pastoriza, M. G., & Dottori, H. A. 1986, A&A, 156, 111
Cowie, L. L. & Songaila, A. 1986, ARA&A, 24, 499
Crowther, P. A., Dessart, K., Hillier, D. J., Abbott, D. B., & Fullerton, A. W. 2002, A&A,
392, 653
Crowther, P. A., Drissen, L., Abbott, J. B., Royer, P., & Smartt, S. J. 2003, A&A, 404, 483
Cummings, J. R. et al. 2009, GRB Coordinates Network, 9254, 1
D’Avanzo, P., Palazzi, E., Thoene, C. C., Maiorano, E., Chincarini, G., Antonelli, L. A., &
Piranomonte, S. 2009, GRB Coordinates Network, 9256, 1
Dave, R. & Oppenheimer, B. D. 2007, MNRAS, 374, 427
Danchi, W. C., Bester, M., Degiacomi, C. G., Greenhill, L. J., & Townes, C. H. 1994, AJ,
107, 1469
de Jager, C., Nieuwenhuijzen, H., van der Hucht, K. A. 1988, A&AS, 72, 259
Della Valle, M. et al. 2006, ApJ, 642, L103
De Pasquale, M. et al. 2003, ApJ, 592, 1018
Dessart, L., Burrows, A., Livne, E., & Ott, C. D. 2008, ApJ, 673, 43
D’Odorico, S., et al. 2006, SPIE, 6269, 98
Dopita, M. A., Kewley, L. J., Heisler, C. A., & Sutherland, R. S. 2000, ApJ, 542, 224
199

Dopita, M. A. et al. 2006, ApJS, 167, 177
Drout, M. R., Massey, P., Meynet, G., Tokarz, S., & Caldwell, N. 2009, ApJ, 703, 441
Dyck, H. M., Benson, J. A., van Belle, G. T., & Ridgway, S. T. 1996, AH, 111, 1705
Eichler, D., Livio, M., Piran, T., & Schramm, D. N. 1989, Nature, 340, 126
Elias, J. H., Frogel, J. A., & Humphreys, R. M. 1985, ApJS, 57, 91
Elıasdottir, A., et al. 2009, ApJ, 697, 1725
Eldridge, J. J. & Vink, J. S. 2006, A&A, 452, 295
Erb, D. K., Shapley, A. E., Pettini, M., Steidel, C. C., Reddy, N. A., & Adelberger, K. L.
2006, ApJ, 644, 813
Ferland, G. J. 1996, HAZY, a brief introduction to Cloudy, University of Kentucky,
Department of Physics and Astronomy Internal Report
Ferland, G. J., Korista, K. T., Verner, D. A., Ferguson, J. W., Kingdon, J. B., Verner, E.
M. 1998, PASP, 110, 761
Fernandes, R. C., Leao, J. R. S., Lacerda, R. R. 2003, MNRAS, 340, 29
Filippenko, A. V. 1982, PASP, 84, 715
Filippenko, A. V. 1997, ARA&A, 35, 309
Fioc, M. & Rocca-Volmerange, B. 1997, A&A, 326, 950
Fishman, G. J., et al. 1989, in Proc. of the GRO Science Workshop, ed. W. N. Johnson
(NASA/GSFC), 39
Foley, R. J., et al. 2009, AJ, 138, 376
Frail, D. A., et al. 2001, ApJ, 562, 55
Frail, D. A., & Berger, E. 2003, GCN Circ. 1842
Frail, D. A., Soderberg, A. M., Kulkarni, S. R., Berger, E, Yost, S., Fox, D. W., & Harrison,
F. A. 2005, ApJ, 619, 994
200
Freytag, G., Steffen, M., & Dorch, B. 2002, Astron. Nach., 323, 213
Fruchter, A. S. et al. 2006, Nature, 441, 463
Fryer, C. L. & Heger, A. 2005, ApJ, 623, 302
Fryer, C. L., Woosley, S. E., & Hartmann,D.H. 1999, ApJ, 526, 152
Fynbo, J. P. U., et al. 2005, ApJ, 633, 317
Fynbo, J. P. U., et al. 2006, Nature, 444, 1047
Fynbo, J. P. U., Hjorth, J., Malesani, D., Sollerman, J., Watson, D., Jakobsson, P.,
Gorosabel, J., & Jaunsen, A. O. 2007, arXiv:astro-ph/0703458v2
Galama, T. J. et al. 1998, Nature, 395, 670
Gallagher, J. S., Hunter, D. A., & Bushouse, H. 1989, AJ, 97, 700
Gal-Yam, A., et al. 2004, ApJ, 609, L59
Garnett, D. R. 1992, AJ, 103, 1330
Garnett, D. R. 2002, ApJ, 581, 1019
Garnett, D. R., Kennicutt, R. C., & Bresolin, F. 2004, ApJ, 607, L21
Gavilan, M., Buell, J. F., Molla, M. 2005, A&A, 432, 861
Gehrels, N., et al. 2004, ApJ, 611, 1005
Gehrels, N., et al. 2005, Nature, 437, 851
Gehrels, N., et al. 2006, Nature, 444, 1044
Ghirlanda, G., Ghisellini, G., & Lazzati, D. 2004, ApJ, 616, 331
Giavalisco, M. et al. 2004, ApJ, 600, 93
Gieren, W., et al. 2008, ApJ, 683, 611
Gonzalez, Delgado, R. M., Cid Fernandes, R., Perez, E., Martins, L. P., Storchi-Bergmann,
T., Schmitt, H., Heckman, T., & Leitherer, C. 2004, ApJ, 605, 127
Gonzalez Delgado, R. M., Heckman, T., & Leitherer, C. 2001, ApJ, 546, 845
201

Gonzalez Delgado, R. M., Leitherer, C., & Heckman, T. 1999, ApJS, 125, 489
Gordon, D. & Gottesman, T. S. 1981, AJ, 86 161
Gorosabel, J. et al. 2005, A&A, 444, 711
Graham, J. F. et al. 2009, in Gamma-Ray Burst: Sixth Huntsville Symposium, American
Institute of Physics Conference Proceedings 1133, p. 269
Greiner, J., et al. 2009, ApJ, 693, 1610
Groenewegen, M. A. T., Lancon, A., & Marescaux, M. 2009, A&A, 504, 1031
Groves, B., Dopita, M., & Sutherland, R. 2004, ApJS, 153, 9
Guetta, D. & Della Valle, M. 2007, ApJ, 657, L73
Gustafsson, B., Bell, R. A., Eriksson, K., & Nordlund, A. 1975, A&A, 42, 407
Gustafsson, B., Edvardsson, B., Eriksson, K., Mizuno-Wiedner, M., Jorgensen, U. G., &
Plez, B. 2003, in ASP Conf. Ser. 288, Stellar Atmosphere Modeling, ed. I. Hubeny,
D. Mihalas, & K. Werner (San Francisco: ASP), 331
Gustafsson, B., Edvardsson, B., Eriksson, K., Jorgensen, U. G., Nordlund, A., & Plez, B.
2008, A&A, 486, 951
Hagen, W. 1978, ApJS, 38, 1
Hagen, W., Stencel, R. E., & Dickinson, D. F. 1983, ApJ, 274, 286
Hammer, F., Flores, H., Schaerer, D., Dessauges-Zavadsky, M., Le Floc’h, E., & Puech, M.
2006, A&A, 454, 103
Hamuy, M., Walker, A. R., Suntzeff, N. B., Gigoux, P., Heathcote, S. R., & Phillips, M. M.
1992, PASP, 104, 533
Hamuy, M., Suntzeff, N. B., Heathcote, S. R., Walker, A. R. , Gigoux, P., & Phillips, M.
M. 1994, PASP, 106, 566
Han, X. H., Hammer, F., Liang, Y. C., Flores, H., Rodrigues, M., Hou, J. L., & Wei, J. Y.
2010, A&A, in press (arXiv:1001.2476)
202

Hayashi, C. & Hoshi, R. 1961, PASJ, 13, 552
Heise, J., in’t Zand, J., Kippen, R. M., & Woods, P. M. 2001, in Gamma-ray Bursts in
the Afterglow Era: Proceedings of the International Workshop, ed. E. Costa, F.
Frontera, & J. Hjorth (Berlin: Springer), 16
Henry, R. B. C. & Worthey, G. 1999, PASP, 111, 919
Hillier, D. J., & Miller, D. L. 1998, ApJ, 496, 407
Hirschi, R., Meynet, G., & Maeder, A. 2005, A&A, 443, 581
Hirschi, R., Chiappini, C., Meynet, G., Maeder, A., & Ekstrom, S. 2008, in IAU Symp.
250, Massive Stars as Cosmic Engines, ed. F. Bresolin, P. A. Crowther, & J. Puls
(Cambridge: Cambridge Univ. Press), 217
Hjorth, J. et al. 2003, Nature, 423, 847
Hodge, P. W. & Miller, B. W. 1995, ApJ, 451, 176
Hubble, E. 1925, ApJ, 62, 409
Huchra, J. P., Davis, M., Latham, D., & Tonry, J. 1983, ApJS, 52, 89
Humphreys, R. M. 1978, ApJS, 38, 309
Humphreys, R. M. 1979a, ApJS, 39, 389
Humphreys, R. M. 1979b, ApJ, 231, 384
Humphreys, R. M. & Davidson, K. 1979, pJ, 232, 409
Humphreys, R. M. & McElroy, D. B. 1984, ApJ, 284, 565
Humphreys, R. M. & Sandage, A. 1980, ApJS, 44, 319
Hunter, D. A. & Elmegreen, B. G. 2004, AJ, 128, 2170
Hunter, D. A. & Gallagher, J. S., III. 1986, PASP, 98, 5
Hurley, K., 2008, Chinese J. Astron. Astrophys. Suppl., 8, 202
Hurley, K. & Cline, T. 1999, GRB Coordinates Network, 450, 1
203

Hurley et al. 2002, GRB Coordinates Network, 1507, 1
Hurley et al. 2005, GRB Coordinates Network, 4139, 1
Hyland, A. R., Becklin, E. E., Neugebauer, G., & Wallerstein, G. 1969, 158, 619
Ilbert, O., et al. 2009, ApJ, 690, 1236
Ivezic, Z., et al. 2006, preprint (arXiv:0805.2366)
Izotov, Y. I., Stasinska, G., Meynet, G., Guseva, N. G., & Thuan, T. X. 2006, A&A, 448,
955
Izotov, Y. I., & Thuan, T. X. 2004, ApJ, 616, 768
Jakobsson, P. & Fynbo, J. P. U. 2007, preprint (arXiv:0704.1421)
Jakobsson, P., Hjorth, J., Fynbo, J. P. U., Watson, D., Pedersen, K., Bjornsson, G., &
Gorosabel, J. 2004, ApJ, 617, L21
Jakobsson, P. et al. 2005, ApJ, 629, 45
Jansen, R. A., Fabricant, D., Franx, M., & Caldwell, N. 2000a, ApJS, 126, 331
Jansen, R. A., Franx, M., Fabricant, D., & Caldwell, N. 2000b, ApJS, 126, 271
Jaschek, C. & Jaschek, M. 1990, The Classification of Stars (Cambridge: Cambridge Univ.
Press)
Johnson, H. L. 1964, Bol. Obs. Tonantzintla Tacubaya 3, 305
Johnson, H. L. 1966, ARA&A, 4, 193
Johnson, H. L. 1968, ApJ, 154, 125
Josselin, E. Blommaert, J. A. D. L., Groenewegen, M. A. T., Omont, A., & Li, F. L. 2000,
A&A, 357, 225
Kaiser, N., et al. 2002, Proc. SPIE, 4836, 154
Kang, A., et al. 2006, A&A, 454, 717
Kauffmann, G. et al. 2003a, MNRAS, 346, 1055
204

Kauffmann, G., et al. 2003b, MNRAS, 341, 33
Kauffmann, G., et al. 2003c, MNRAS, 341, 54
Kelly, P. L., Kirshner, R. P., & Pahre, M. 2008, ApJ, 687, 1201
Kelson, D. D. 2003, PASP, 115, 688
Kennicutt, R. C. 1998, ARA&A, 36, 189
Kennicutt, R. C., Bresolin, F., & Garnett, D. R. 2003, ApJ, 591, 801
Kervella, R., Verhoelst, T., Ridgway, S. T., Perrin, G., Lacour, S., Cami, J., & Haubois, X.
2009, A&A; eprint arXiv:0907.1843
Kewley, L. J., Brown, W. R., Geller, M. J., Kenyon, S. J., & Kurtz, M. J. 2007, AJ, 133,
882
Kewley, L. J. & Dopita, M. A. 2002, ApJS, 142, 35
Kewley, L. J., Dopita, M. A., Sutherland, R. S., Heisler, C. A., & Trevena, J. 2001, ApJ,
556, 121
Kewley, L. J., Ellison, S. L. 2008, ApJ, 681, 1183
Kewley, L. J., Geller, M. J., & Jansen, R. A. 2004, AJ, 127, 2002
Kewley, L. J., Groves, B., Kauffman, G., & Heckman, T. 2006, MNRAS, 372, 961
Kewley, L. J., Heisler, C. A., Dopita, M. A., Sutherland, R., Norris, R. P., Reynolds, J., &
Lumsden, S. 2000, ApJ, 530 704
Kewley, L. J., Jansen, R. A., & Geller, M. K. 2005, PASP, 117, 227
Kinney, A. L. et al. 1993, ApJS, 86, 5
Klebesadel, R. W., Strong, I. B., & Olson, R. A. 1973, ApJ, 182, L85
Klose, S. et al. 2003, ApJ, 592, 1025
Kobulnicky, H. A. & Kewley, L. J. 2004, ApJ, 617, 24
Kocevski, D., West, A. A., & Modjaz, M. 2009, ApJ, 702, 377
205

Kouveliotou, C., Meegan, C. A., Fishman, G. J., Bhat, N. P., Briggs, M. S., Koshut, T. M.,
Paciesas, W. S., & Pendleton, G. N. 1993, ApJ, 413, L101
Kong, X. & Cheng, F. Z. 2002, A&A, 389, 845
Kong, X., Cheng, F. Z., Weiss, A., Charlot, S. 2002, A&A, 396, 503
Kudritzki, R. P. 2002, ApJ, 557, 389
Kudritzki, R. P., Pauldrach, A., Puls, J., & Abbott, D. C. 1989, A&A, 219, 205
Kudritzki, R. P. & Puls, J. 2000, ARA&A, 38, 613
Kudritzki, R. P. & Reimers, D. 1978, A&A, 70, 227
Kulkarni, S. R., et al. 1998, Nature, 395, 663
Kupcu Yoldas, A., Greiner, J., & Perna, R. 2006, A&A, 457, 115
Kurucz, R. L. 1991, in Stellar Atmospheres: Beyond Classical Limits, ed. L. Crivellari, I.
Hubeny, & D. G. Hummer (Dordrecht: Kluwer), 441
Kurucz, R. L. 1992, in IAU Symp. 149, The Stellar Populations of Galaxies, ed. B. Barbuy
& A. Renzini (Dordrecht: Kluwer), 225
Langer, N. 1989, A&A, 220, 135
Langer, N. & Norman, C. A. 2006, ApJ, 638, L63
Lauberts, A. & Valentijn, R. A. 1989, Messenger, 56, 31
Law, N. M., et al. 2009, PASP¡ 121, 1395
Lee, J. C., Kennicutt, R. C., Jose G. Funes, S. J., Sakai, S., & Akiyama, S. 2009, ApJ, 692,
1305
Lee, T. A. 1970, ApJ, 162, 217
Lee, H., Skillman, E. D., Cannon, J. M., Jackson, D. C., Gehrz, R. D., Polomski, E. F., &
Woodward, C. E. 2006, ApJ, 647, 970
Lee, H., Skillman, E. D., & Venn, K. A. 2005, ApJ, 620, 223
206

Lee, H., Skillman, E. D., & Venn, K. A. 2006, ApJ, 642, 813
Lee, W. H. & Ramirez-Ruiz, E. 2007, New J. Phys., 9, 17
Leitherer, C. 2008, IAU Symp. 255, Low-Metallicity Star Formation: From the First Stars
to Dwarf Galaxies, ed. L. K. Hunt, S. Madden, & R. Schneider (Cambridge: CUP),
305
Leitherer, C., Schaerer, D., Holdader, J. D., Delgado, R. M.G., Robert, C., Kune, D. F., de
Mello, D. F., Devost, D., & Heckman, T. M., et al. 1999, ApJS, 123, 3
Leitherer, C, Carmelle, R., & Drissen, L. 1992, ApJ, 401, 596
Lejeune, Th., Cuisinier, F., & Buser, R. 1997, A&AS, 125, 229
Lejeune, Th., Cuisinier, F., & Buser, R. 1998, A&AS, 130, 65
Lequeux, J., Peimbert, M., Rayo, J. F., Serrano, A., & Torres-Peimbert, S. 1979, A&A, 80,
155
Levan, A., et al. 2002, GCN Circ. 1844
Levesque, E. M. & Kewley, L. J. 2007, ApJ, 667, L121
Levesque, E. M., Massey, P., Olsen, K. A. G., & Plez, B. 2007, ApJ, 667, 202
Levesque, E. M., Massey, P., Olsen, K. A. G., Plez, B., Josselin, E., Maeder, A., & Meynet,
G. 2005, ApJ, 628, 973
Levesque, E. M., Massey, P., Olsen, K. A. G., Plez, B., Meynet, G., & Maeder, A., 2006,
ApJ, 645, 1102
Li, Z.-Y. & Chevalier, R. A. 1999, ApJ, 526, 716
Liang, Y. C., Hammer, F., Yin, S. Y., Flores, H., Rodrigues, M., & Yang, Y. B. 2007, A&A,
473, 411
Liu, X., Shapley, A. E., Coil, A. L., Brinchmann, J., Ma, C.-P. 2008, ApJ, 678, 758
207

Lu, Y., Huang, Y.-F., & Zhang, S. N. 2008, in Huang, Y.-F., Dai, Z.-G., Zhang, B., eds,
AIP Conf. Ser. Vol. 1065, The Origin of the Gamma-Ray Burst of GRB 060614,
Am. Inst. Phys., New York, p. 285
MacFadyen, A. I., Woosley, S. E., & Heger, A. 2001, ApJ, 550, 410
MacFadyen, A. I. & Woosley, S. E. 1999, ApJ, 524, 262
Maeder, A. 2002, A&A, 392, 575
Maeder, A. & Conti, P.S. 1994, ARA&A, 32, 227
Maeder, A., Lequeux, H., & Azzopardi, M. 1980, A&A, 90, L17
Maeder, A. & Meynet, G. 2001, A&A, 373, 555
Magris, C. G., Binette, L., & Bruzual, A. G. 2003, ApJS, 149, 313
Malesani, D., et al. 2004, ApJ, 609, L5
Mallery, R. P. et al. 2007, ApJS, 173, 482
Margutti, R. et al. 2007, A&A, 474, 815
Marshall, J. L., et al. 2008, Proc. SPIE, 7014, 169
Martın-Manjon, M. L., Molla, M., Dıaz, A. I., Terlevich, R. 2008, MNRAS, 385, 854
Martın-Manjon, M. L., Molla, M., Dıaz, A. I., Terlevich, R. 2009, arXiv: 0901.1186
Martins, L. Gonzalez Delgado, R. M., Leitherer, C., Cervino, M., & Hauschildt, P. H. 2005,
MNRAS, 358, 49
Massey, P. 1998, ApJ, 501, 153
Massey, P. 2002, ApJS, 141, 81
Massey, P. 2003, ARA&A, 41, 15
Massey, P. & Armandroff, T. E. 1995, AJ, 109, 2470
Massey, P. & Holmes, S. 2002, ApJ, 580, L35
Massey, P. & Johnson, O. 1998, ApJ, 505, 793
208

Massey, P., Levesque, E. M., Olsen, K. A. G., & Plez, B. et al. 2007b, ApJ, 660, 301
Massey, P., McNeill, R. T., Olsen, K. A. G., Hodge, P. W., Blaha, C., Jacoby, G. H., Smith,
R. C., & Strong, Shay B. 2007c, AJ, 134, 2474
Massey, P. & Olsen, K. A. G. 2003, AJ, 126, 2867
Massey, P., Olsen, K. A. G., Hodge, P. W., Strong, S. B., & Jacoby, G. H. 2006, AJ, 131,
2478
Massey, P., Olsen, K. A. G., Hodge, P. W., Jacoby, G. H., McNeill, R. T., Smith, R. C., &
Strong, S. B. 2007a, AJ, 133, 2393
Massey, P., Plez, B., Levesque, E. M., Olsen, K. A. G., Clayton, G. C., & Josselin, E. 2005,
ApJ, 634, 1286
Massey, P., Silva, D. R., Levesque, E. M., Plez, B., & Clayton, G. C. 2009, ApJ, 703, 420
Matheson, T., et al. 2003, ApJ, 599, 394
Matteucci, F. 1986, MNRAS, 221, 911
Matteucci, F. & Tosi, M. 1985, MNRAS, 217, 391
Mauch, T. & Sadler, E. M. 2007, MNRAS, 375, 931
McGaugh, S. S. & de Blok, W. J. G. 1997, ApJ, 481, 689
McLean, I. S., et al. 1998, SPIE, 3354, 566
Melotte, P. J. 1926, MNRAS, 86, 636
Mereghetti, S. & Gotz, D. 2003, GRB Coordinates Network, 2460, 1
Meynet, G. 1993, in The Feedback of Chemical Evolution on The Stellar Content of
Galaxies, eds. D. Alloin, G. Stasinska, Publ. de l’Observatoire de Paris, p. 40
Meynet, G. & Maeder, A. 2000, A&A, 361, 101
Meynet, G. & Maeder, A. 2003, A&A, 404, 975
Meynet, G. & Maeder, A. 2005, A&A, 429, 581
209

Meynet, G., Maeder, A., Schaller, G., Schaerer, D., & Charbonnel, C. 1994, A&AS, 103, 97
Mirabal, N., Halpern, J. P., An, D., Thorstensen, J. R., & Terndrup, D. M. 2006, ApJ, 643,
L99
Mirabal, N., Halpern, J. P., & O’Brien, P. T. 2007, ApJ, 661, 127
Modjaz, M. et al. 2006, ApJ, 645, L21
Modjaz, M., et al. 2008, AJ, 135, 1136
Morgan, W. W. & Keenan, P. C. 1973, ARA&A, 11, 29
Moustakas, J., Kennicutt, R. C., & Tremoni, C. A. 2006, ApJ, 642, 775
Moy, E., Rocca-Volmerange, B., & Fioc, M. 2001, A&A, 365, 347
Muschielok, B., et al. 1999, A&A, 352, 40
Nakagawa, Y. E., et al. 2006, PASJ, 58, 35
Narayan, R., Paczynski, B., & Piran, T. 1992, ApJ, 395, L83
Neugent, K. F., Massey, P., Skiff, B., Drout, M., Meynet, G., & Olsen, K. A. G. 2010, ApJ,
in press (arXiv:1006.5742)
Noeske, K. G. et al. 2007a, ApJL, 660, 47
Noeske, K. G. et al. 2007b, ApJL, 660, 43
Ohnaka, K. et al. 2009, A&A; eprint arXiv:0906.4792
Oke, J. B. 1990, AJ, 99, 1621
Oke, J. B. et al. 1995, PASP, 107, 375
Olsen, K. A. G. & Massey, P. 2007, ApJ, 656, L61
Osterbrock, D.1989, Astrophysics of gaseous nebulae and active galactic nuclei (University
Science Books)
Paczynski, B. 1991, Acta Astron., 41, 257
Pagel, B. E. J., et al. 1979, MNRAS, 189, 95
210

Pagel, B. E. J., Edmunds, M. G., & Smith, G. 1980, MNRAS, 193, 219
Panuzzo, R., Bressan, A., Granato, G. L., Silva, L., & Danese, L. 2003, A&A, 409, 99
Patat, F., et al. 2001, ApJ, 555, 900
Pauldrach, A. W. A., Hoffman, T. L., & Lennon, M. 2001, A&A, 375, 161
Peimbert, M. 1967, ApJ, 150, 925
Perley, D. A., et al. 2008, ApJ, 688, 470
Perley, R. A., Napier, P. J., & Butler, B. J. 2004, SPIE, 5489, 784
Pettini, M. & Pagel, B. E. J. 2004, MNRAS, 348, 59
Pian, E. et al. 2006, Nature, 442, 1011
Pietrzynski, G., Gieren, W., Udalski, A., Bresolin, F., Kudritzki, R. P., Soszynski, I.,
Szymanski, M., & Kubiak, M. 2004, AJ, 128, 2815
Pignata, G. et al. 2009, CBET, 1731, 1
Pilyugin, L. S. 2000, A&A, 362, 325
Plez, B., Brett, J. M., & Nordlund, A. 1992, A&A, 256, 551
Plez, B. 2003, in ASP Conf. Ser. 298, GAIA Spectroscopy: Science and Technology, ed. U.
Munari (San Francisco: ASP), 189
Piran, T. 1999, Phys. Rep., 314, 575
Podsiadlowski, P., Ivanova, N., Justham, S., & Rappaport, S. 2010, MNRAS, in press
(arXiv:1004.0249)
Podsiadlowski, P., Mazzali, P. A., Nomoto, K., Lazzati, D., & Cappellaro, E. 2004, ApJ,
607, L17
Prieto, J. L., Stanek, K. Z., & Beacom, J. F. 2008, ApJ, 673, 999
Pritzl, B. J., Venn, K. A., & Irwin, M. 2005, AJ, 130, 2140
Prochaska, J. X. 2006, ApJ, 650, 272
211

Prochaska, J. X., Dessauges-Zavadsky, M., Ramirez-Ruiz, E., & Chen, H.-W., 2008, ApJ,
685, 344
Prochaska, J. X. et al. 2004, ApJ, 611, 200
Prochaska, J. X., et al. 2006, ApJ, 642, 989
Prochaska, J. X., et al. 2009, ApJ, 691, L27
Racusin, J. L., et al. 2009, ApJ, 698, 43
Ramirez-Ruiz, E., Lazzati, D., & Blain, A. W. 2002, ApJ, 565, L9
Rau, A., et al. 2004, A&A, 427, 815
Rau, A., Salvato, M., & Greiner, J. 2005, A&A, 444, 425
Rauch, T. 1997, A&A, 320, 237
Richer, M. G. & McCall, M. L. 1995, ApJ, 445, 642
Ricker, G. R. 1997, in All-Sky X-Ray Observations in the Next Decade, ed. M. Matsuoka
& N. Kawai (Japan: RIKEN), 366
Ricker et al. 2002, GRB Coordinates Network, 1530, 1
Rigby, J. R. & Rieke, G. H. 2004, ApJ, 606, 237
Robin, A. C., Reyle, C., Derriere, S., & Picaud, S. 2003, A&A, 409, 523
Rol, E., Wijers, R. A. M. J., Kouveliotou, C., Kaper, L., & Kaneko, Y. 2005, ApJ, 624, 868
Roming, P. W. A., et al. 2005, Space Sci. Rev., 120, 95
Rosa-Gonzalez, D., Terlevich, E., & Terlevich, R. 2002, MNRAS, 332, 283
Rubin, V. C. & Ford, W. K. K. 1970, ApJ, 159, 379
Sakamoto, T., et al. 2010, GRB Coordinates Network, 10511, 1
Salasnich, B., Bressan, A., Chiosi, C. 1999, A&A, 342, 131
Salpeter, E. E. 1955, ApJ, 121, 161
Salvaterra, R., et al. 2009, preprint (arXiv:0906.1578)
212
Sanders, D. B., Mazzarella, J. M., Kim, D.-C., Surace, J. A., & Soifer, B. T. 2003, AJ, 126,
1607
Sari, R., Piran, T., & Halpern, J. P. 1999, ApJ, 519, L17
Savaglio, S., Glazebrook, K., & Le Borgne, D. 2006, in American Institute of Physics
Conference Series, ed. S. S. Holt, N. Gehrels, & J. A. Nousek, 540
Savaglio, S., Glazebrook, K., & Le Borgne, D. 2009, ApJ, 1091, 182
Schaerer, D. 1996a, A&A, 309, 129
Schaerer, D. 1996b, in From Stars to Galaxies: The Impact of Stellar Physics on Galaxy
Evolution, ASP Conf. Series 98, eds. C. Leitherer, U. Fritze - von Alvensleben, J.
Huchra, p. 174
Schaerer, D., Charbonnel, C., Meynet, G., Maeder, A., & Schaller, G. 1993a, A&AS, 102,
339
Schaerer, D. & de Koter, A. 1997, A&A, 322, 598
Schaerer, D., Meynet, G., Maeder, A., & Schaller, G. 1993b, A&AS, 98, 523
Schaerer, D. & Vacca, W .D. 1998, ApJ, 497, 618
Schaerer, D. & Vacca, W .D. 1998, ApJ, 497, 618
Schaller, G., Schaerer, D., Meynet, G., Maeder, A. 1992, A&AS, 96, 269
Schlegel, D. J., Finkbeiner, D. P., & Davis, M. 1998, ApJ, 500, 525
Schmutz, W., Leitherer, C., & Gruenwald, R. 1992, PASP, 104, 1164
Shapley, A. E., Erb, D. K., Pettini, M., Steidel, C. C., & Adelberger, K. L. 2004, ApJ, 612,
108
Shi, F., Kong, X., & Cheng, F. Z. 2006, A&A, 453, 487
Silva, L., Granato, G. L., Bressan, A., & Danese, L. 1998, ApJ, 509, 103
Skillman, E. D., Kennicutt, R. C., & Hodge, P. W. 1989, ApJ, 347, 875
Smith, L. J., Norris, R. P. F., & Crowther, P. A. 2002, MNRAS, 337, 1309
213

Snijders, L., Kewley, L. J., & van der Werf, P. P. 2007, ApJ, 669, 269
Snow, T. P., Jr., Buss, R. H. Jr., Gilra, D. P., & Swings, J. P. 1987, ApJ, 321, 921
Soderberg, A. M. et al. 2004a, ApJ, 606, 994
Soderberg, A. M., et al. 2004b, Nature, 430, 648
Soderberg, A. M. 2006, AIPC, 836, 380
Soderberg, A. M. et al. 2006a, ApJ, 636, 391
Soderberg, A. M. et al. 2006b, ApJ, 650, 261
Soderberg, A. M. et al. 2010, Nature, 463, 513
Soderberg, A. M., et al. 2010, ApJ, in prep
Sollerman, J., et al. 2007, A&A, 466, 839
Stanek, K. Z. et al. 2003, ApJ, 591, L17
Stanek, K. Z., et al. 2006, Acta Astron., 56, 333
Starling, R. L. C., et al. 2010, MNRAS, submitted (arXiv:1004.2919)
Stasinska, G. 1980, A&A, 84, 320
Stasinska, G. & Leitherer, C. 1996, ApJS, 107, 661
Stasinska, G., Cid Fernandes, R., Mateus, A., Sodre, L., & Asari, N. V. 2006, MNRAS,
371, 972
Stencel, R. E., Pesce, J. E., & Bauer, W. H. 1988, AJ, 95, 141
Stencel, R. E., Pesce, J. E., & Bauer, W. H. 1989, AJ, 97, 1120
Stothers, R. B. & Chin, C.-W. 1996, ApJ, 468, 842
Stone, R. P. S., 1996, ApJS, 107, 423
Stritzinger, M., Philips, M. M., Morrell, N., Salgado, F., & Folatelli, G. 2009, CBET, 1751,
1
Sutherland, R. S. & Dopita, M. A. 1993, ApJS, 88, 253
214

Tanvir, N. R., et al. 2009, preprint (arXiv:0906.1577)
Tatebe, K., Chandler, A. A., Wishnow, E. H., Hale, D. D. S., & Townes, C. H. 2007, ApJ,
670, 21
Thone, C. C., et al. 2008, ApJ, 676, 1151
Thone, C. C., et al. 2010, submitted
Thuan, T. X. et al. 1999, A&AS, 139, 1
Thuan, T. X. & Martin, G. E. 1981, ApJ, 247, 923
Tremonti, C. A. et al. 2004, ApJ, 613, 898
Troja, E., King, A. R., O’Brien, P. T., Lyons, N., & Cusamano, G. 2008, MNRAS, 385, L10
Urbaneja, M. A., Kudritzki, R. P., Bresolin, F., Przybilla, N., Gieren, W., & Pietrzynski,
G. 2008, ApJ, 684, 118
van den Berg, S. 1966, AJ, 71, 922
van den Bergh, S. 1968, JRAS Canada, 62, No. 4
van den Bergh, S. 1973, ApJ, 183, L123
van den Berg, S. 2000, The Galaxies of the Local Group (Cambridge: Cambridge Univ.
Press)
van den Heuvel, E. P. J. & Yoon, S.-C. 2007, Ap&SS, 311, 177
Vanderspek, R., et al. 2002, GCN Circ. 1508
van Zee, L., Salzer, J. J., Haynes, M. P., O’Donoghue, A. A., & Balonek, T. J. 1998, AJ,
116, 2805
Vazquez, G. A. & Leitherer, C. 2005, ApJ, 621, 695
Vazquez, G. A., Leitherer, C., Schaerer, D., Meynet, G., & Maeder, A. 2007, ApJ, 663, 995
Veilleux, S. & Osterbrock, D. E. 1987, ApJS, 63, 295
Venn, K. A., et al. 2003, AJ, 126, 1326
215

Venn, K. A., et al. 2001, ApJ, 547, 765
Vink, J. S., de Koter, A., & Lamers, H. J. G. L. M. 2001, A&A, 369, 574
Vink, J. S. & de Koter, A. 2005, A&A, 442, 587
Wainwright, C., Berger, E., Penprase, B. E. 2007, ApJ, 657, 367
Watson, D., et al. 2006, ApJ, 652, 1011
Wiersema, K. et al. 2007, A&A, 464, 529
Wirth, G. D. et al. 2004, AJ, 127, 3121
Wolf, C. & Podsiadlowski, P. 2007, MNRAS, 375, 1049
Wolf, M. 1923, Astron. Nachr., 217, 476
Woosley, S. E. 1993, ApJ, 405, 273
Woosley, S. E. & Bloom, J. S. 2006, ARA&A, 44, 507
Woosley, S. E. & Heger, A. 2006, ApJ, 637, 914
Woosley, S. E., Heger, A., & Weaver, T. A. 2002, RMP, 74, 1015
Xin, L. P., Zheng, W. K., Qiu, Y. L., Wei, J. Y., Wang, J., Deng, J. S., Urata, Y., & Hu,
J. Y. 2009, GRB Coordinates Network, 9255, 1
Xu, D. et al. 2009, ApJ, 696, 971
Yin, S. Y., Liang, Y. C., & Zhang, B. 2007, ASPC, 373, 686
Yoon, S.-C., Langer, N., & Norman, C. 2006, Astron. Ap. 460, 199
Young, J. S. et al. 2000, MNRAS, 315, 635
Yun, M. S. & Carilli, C. L. 2002, ApJ, 568, 88
Zahid, H. J., Kewley, L. J., & Bresolin, F. 2010, ApJ, submitted
Zaritsky, D., Kennicutt, R. C., & Huchra, J. P. 1994, ApJ, 420, 87
Zeh, A., Klose, S., & Hartmann, D. H. 2004, ApJ, 609, 952
Zhang, B., et al. 2009, ApJ, 703, 1696
216


![RESound: Interactive Sound Rendering for Dynamic Virtual ...gamma-web.iacs.umd.edu/Sound/RESound/RESound.pdf · worlds [10, 27]. In addition to immersive environments, au-ditory display](https://img.dokumen.tips/doc/110x75/5f4e810ad5a8656e6f10645b/resound-interactive-sound-rendering-for-dynamic-virtual-gamma-webiacsumdedusoundresound.jpg)