Embed Size (px)
Citation preview

EXPLORING THE CONCEPT AND APPLICATION OF CRISIS-INDUCED UNCERTAINTY
IN ORGANIZATIONAL CRISES
by
ZIYUAN ZHOU
EYUN-JUNG KI, COMMITTEE CHAIR
KENON A. BROWN
SHUHUA ZHOU
JOSHUA PEDERSON
YOUN-JENG CHOI
A DISSERTATION
Submitted in partial fulfillment of the requirements
for the degree of Doctor of Philosophy
in the College of Communication and Information Sciences
in the Graduate School of
The University of Alabama
TUSCALOOSA, ALABAMA
2019

Copyright Ziyuan Zhou 2019
ALL RIGHTS RESERVED

ii
ABSTRACT
This dissertation was designed to investigate stakeholders’ feelings of uncertainty during
an organizational crisis and how such feelings influence stakeholders’ relationship with the
organization and change their information-seeking behaviors. Through reviewing current
theories about uncertainty in risk communication and interpersonal communication, this
dissertation created a term, crisis-induced uncertainty, and conceptualized the construct. The
researcher designed two studies to measure and test the construct separately.
Study 1 aimed to develop a multidimensional scale to capture crisis-induced uncertainty.
Two samples were collected to validate the scale (n1 = 341; n2 = 294). Through the
comprehensive assessment of content validity, construct validity, discriminant validity,
convergent validity, and reliability, this study yielded a three-dimension scale with 11
measurement items. Crisis-induced uncertainty contained three dimensions: protection
uncertainty, process uncertainty, and relationship uncertainty.
Using a survey (n3 = 324), Study 2 attempted to discover the relationship between crisis-
induced uncertainty and organization-public relationships, and the relationship between crisis-
induced uncertainty and information-seeking behaviors. The survey revealed that crisis-induced
uncertainty significantly predicts satisfaction, trust, and commitment. It also indicated that crisis-
induced uncertainty does not change people’s information-seeking behaviors during a crisis. This
dissertation greatly contributes to the understanding of uncertainty during a crisis and paves the
way for future uncertainty research in the crisis context.

iii
DEDICATION
To my two late grandmas who always encouraged me to receive education and work
hard, I wish you could be here to see my achievement.

iv
LIST OF ABBREVIATIONS AND SYMBOLS
α Cronbach’s alpha
β Standardized multiple regression coefficient
df Degree of freedom
M Mean
n Sample size
p Probability value
R2 Coefficient of determination
SD Standard deviation
SE Standard error
χ2 Chi-square
AMOS A software program used to fit structural equation modeling
AVE Average variance extracted
BP British Petroleum
CFA Confirmatory factor analysis

v
CFI Comparative fit index
CR Composite reliability
CRV Content validity ratio
EFA Exploratory factor analysis
ICM Integrated crisis mapping
IRB Institutional review board
IRT Image repair theory
KMO Kaiser-Meyer-Olkin test
MSA Individual Measures of Sampling Adequacy
MTurk Amazon Mechanical Turk
OPR Organization-public relationships
PIT Problematic integration theory
RMSEA The root mean square error of approximation
SCCT Situational crisis communication theory
SEM Structural equation modeling
SMCC Social-mediated crisis communication model
SPSS Statistical Package for Social Sciences
SRMR Standardized root mean square residual

vi
UMT Uncertainty management theory
URT Uncertainty reduction theory

vii
ACKNOWLEDGEMENTS
It is not an easy job for a first-generation college student to go this far. Fortunately,
through the years, I am not all by myself. It is because of my family, friends, mentors,
professors, and all elegant souls that I wasn’t drowned by all the hurdles. This dissertation could
not have been possible without your invaluable help, considerable encouragement, and
wholehearted support. Thank you for making me who I am.
First, I want to thank my great mom, Hong Cao, and dad, Ping Zhou, for everything you
did for me. You always believe in the power of me and education. I know you don’t always
understand what is going on in my life and what I am complaining about, but the simple fact that
you are there and patiently listen to me makes me feel at ease. I truly feel proud of having such
encouraging parents like you.
The most profound gratitude in my academic career goes to my dissertation chair,
mentor, coauthor, sponsor, Dr. Eyun-Jung Ki. Thanks for always spotting talent in me as a
researcher. I can still remember how clumsy I was in research when I first talked to you. It is the
time and energy you invest in me that make me a better scholar. Thank you for the great
guidance that helps me think critically and write clearly. I enjoyed working with you for the past
four years, and I am forever indebted to you.
My special thanks also go to other committee members. To Dr. Kenon Brown, it was a
great pleasure to meet you in my first year of doctoral study and work with you on several
projects. To Dr. Shuhua Zhou, thanks for all the suggestions you made on this study, and,

viii
personally, forming a small Chinese community in Tuscaloosa where I feel belonged. To Dr.
Joshua Pederson, this dissertation originated from your relational communication class. Before
that, I knew nothing about interpersonal communication research. It is your class that opened a
window for me and made me establish my own research area. To Dr. Youn-Jeng Choi, I would
have been stuck in the method section if I did not take your psychometrics theory class. You
equipped me with all the weapons to tackle statistical problems in this dissertation and my future
research.
Finally, I would like to express my appreciation to everyone who helped me along this
journey. If I list all your names, the dedication part would be as long as this dissertation. Thank
you for all the pain and joy we shared together.

ix
CONTENTS
ABSTRACT .................................................................................................................................... ii
DEDICATION ............................................................................................................................... iii
LIST OF ABBREVIATIONS AND SYMBOLS .......................................................................... iv
ACKNOWLEDGEMENTS .......................................................................................................... vii
LIST OF TABLES ....................................................................................................................... xiii
LIST OF FIGURES .......................................................................................................................xv
CHAPTER 1: INTRODUCTION ....................................................................................................1
Significance of the Dissertation and Expected Contributions ......................................................5
CHAPTER 2: LITERATURE REVIEW .........................................................................................7
Crisis and Crisis Communication .................................................................................................7
Crisis Communication Theories ...................................................................................................9
Corporate apologia ...............................................................................................................9
Image repair theory ............................................................................................................10
Situational crisis communication theory ............................................................................12
Integrated crisis mapping ...................................................................................................16
The Concept of Uncertainty .......................................................................................................19

x
Crisis and risk communication...........................................................................................19
Uncertainty reduction theory .............................................................................................22
Problematic integration theory ...........................................................................................26
Uncertainty management theory ........................................................................................28
The Synthesis of Crisis-Induced Uncertainty.............................................................................30
Scale Development Procedure ...................................................................................................36
Organization-Public Relationships .............................................................................................38
Control mutuality ...............................................................................................................40
Satisfaction .........................................................................................................................41
Trust ...................................................................................................................................41
Commitment ......................................................................................................................41
Information-Seeking Behaviors .................................................................................................43
CHAPTER 3: METHOD ...............................................................................................................46
Study 1 ........................................................................................................................................46
Face and content validity ...................................................................................................46
Procedure ...........................................................................................................................47
Use of Amazon Mechanical Turk data ..............................................................................49
Sample 1.............................................................................................................................49
Sample 2.............................................................................................................................51
Statistical analysis ..............................................................................................................51

xi
Study 2 ........................................................................................................................................52
Procedure ...........................................................................................................................54
Sample................................................................................................................................54
Measurement ......................................................................................................................55
Statistical analysis ..............................................................................................................59
CHAPTER 4: RESULTS ...............................................................................................................60
Study 1 ........................................................................................................................................60
Content and face validity ...................................................................................................60
Assessing the correlation matrix ........................................................................................62
Exploratory factor analysis ................................................................................................62
Confirmatory factor analysis..............................................................................................67
Convergent and discriminant validity ................................................................................70
Reliability ...........................................................................................................................71
Study 2 ........................................................................................................................................72
Model 1 ..............................................................................................................................72
Model 2 ..............................................................................................................................74
CHAPTER 5: DISCUSSIONS ......................................................................................................77
Summary of Results ...................................................................................................................77
Theoretical and Practical Implications .......................................................................................81
Enrichment to ethical communication ...............................................................................82

xii
Application of the new scale ..............................................................................................83
Rethinking OPR management during crises ......................................................................85
Practical implications .........................................................................................................86
Limitations and Future Research ................................................................................................88
Conclusion ..................................................................................................................................89
REFERENCES ..............................................................................................................................91
APPENDIX A: CONTENT VALIDITY RATIO FORM ...........................................................107
APPENDIX B: THE TWO REAL CRISIS SCENARIOS ..........................................................109
APPENDIX C: THE FICTITIOUS CRISIS SCENARIO ..........................................................110
APPENDIX D: IRB CERTIFICATE...........................................................................................111

xiii
LIST OF TABLES
Table 1: Image Repair Strategies ...................................................................................................11
Table 2: Crisis Type Definitions ....................................................................................................14
Table 3: Uncertainty Reduction Theory Axioms ...........................................................................23
Table 4: Clatterbuck Uncertainty Evaluation Scale .......................................................................33
Table 5: Parks and Adelman’s Uncertainty Scale ..........................................................................33
Table 6: Knobloch and Solomon’s Uncertainty Scale ...................................................................34
Table 7: Initial Measurement Items for Crisis-Induced Uncertainty .............................................35
Table 8: Organization-Public Relationships Scale ........................................................................57
Table 9: Information-Seeking Behavior Scale ...............................................................................59
Table 10: Measurement Items for Crisis-Induced Uncertainty after Expert Evaluation ...............61
Table 11: Parallel Analysis Results ...............................................................................................64
Table 12: Principal Axis Factoring with Promax Rotation Factor Loadings .................................65
Table 13: Final EFA Loadings Using the Combined Dataset........................................................67
Table 14: AVE and Shared Variance Estimates ............................................................................71
Table 15: Descriptive Statistics, Cronbach’s Alpha, and Composite Reliability ..........................72
Table 16: The Final Scale ..............................................................................................................72

xiv
Table 17: Fit Statistics of The Measurement Model 1 ...................................................................73
Table 18: Fit Statistics of The Measurement Model 2 ...................................................................75

xv
LIST OF FIGURES
Figure 1: Research Model 1 ...........................................................................................................53
Figure 2: Research Model 2 ...........................................................................................................53
Figure 3: CFA Model Based on The Combined Dataset ...............................................................69
Figure 4: CFA Model Based on The Facebook Dataset ................................................................70
Figure 5: The Standardized Coefficients for Model 1 ...................................................................73
Figure 6: The Standardized Coefficients for Model 2 ...................................................................76

1
CHAPTER 1: INTRODUCTION
Organizational crises frequently occur in our daily life that one does not have to search
his/her memory to raise examples of notorious crises that impact societies around the world.
From the Volkswagen emissions scandal to the Facebook’s breach of user data, and from the
Samsung Galaxy battery explosion to the BP gulf coast oil spill, each of these crises influenced
millions or even billions of people. Once a crisis occurs, it quickly grabs media attention. There
is no shortage of news articles, TV breaking news, social media postings, user-generated videos
that cover organizational crises. For the public, these crises disrupt their normal life as a
Facebook user, a driver of a Beetle, or an ordinary person who sends text messages every day.
For the companies involved, the crises disorder their normal operations. Although not all minor
incidents finally turn into a severe crisis automatically, reports suggest the conversion rate is
increasing. The average number of headlines signaling corporate reputation risk has doubled
from 570 between 2000-2009 to 1030 between 2010-2016 (Kalavar & Mysore, 2017).
Crises are costly from an organization’s perspective. Every organization spends
substantial financial and human resources fixing wrongdoings. More seriously, crises further
discourage consumers from using its products or services. Samsung lost nearly 17 billion dollars
in sales after recalling its problematic cellphones (Lee, 2016). By September 2017, Volkswagen
emissions scandal had cost the car manufacturer 30 billion dollars to buy back cars and pay fines
(Riley, 2017). BP had paid 61.6 billion dollars in total by 2016 to rectify its misconduct in 2010
(Bomey, 2016). Beyond the direct cost to restore to normal operation, probably the more
pressing issue is how to heal the wound on the public’s mind. Organizations have realized the

2
importance of a good reputation, and scholars have widely studied the significant outcomes of a
positive reputation. For example, a favorable reputation can bring benefits to marketing (Lewis
& Booms, 1983), recruitment (Turban & Cable, 2003), and customer behavioral intentions (Keh
& Xie, 2009). A crisis usually threatens how the public sees an organization and its reputation.
Thus, it becomes imperative to explore effective strategies an organization could take to
maintain, protect, and repair its public image. Crisis communication features this line of
research.
The discussion of crisis communication and management started in the 1980s when
management journals published several landmark studies (e.g., Mitroff, 1988; Mitroff,
Shrivastava, & Udwadia, 1987; Weick, 1988). Since then, crisis communication and
management became one of the most heavily researched areas in public relations (Sallot, Lyon,
Acosta-Alzuru, & Jones, 2003). Public relations scholars have established various theories and
frameworks, such as corporate apologia (Ware & Linkugel, 1973), image repair theory (IRT)
(Benoit, 1997), situational crisis communication theory (SCCT) (Coombs, 2007), integrated
crisis mapping model (ICM) (Jin, Pang, & Cameron, 2007), and social-mediated crisis
communication model (SMCC) (Austin, Liu, & Jin, 2012), just to name a few, to explain crises.
Each theory has unique features and concentrates on a specific area in crisis communication. For
example, IRT analyzes available crisis response strategies people and organizations utilize to
respond to a crisis. SCCT seeks to understand people’s attribution of crisis responsibility and
how to use crisis response strategies to shift the attribution and protect reputation. ICM examines
how people emotionally respond to a crisis. SMCC discusses how messages and channels
influence people’s perceptions of a crisis.

3
Although being heavily researched, crisis does not have a universal definition. It has been
defined from various perspectives. Heath and Miller (2004) reviewed more than 20 definitions of
crisis in the literature and found each highlights different characteristics. For example, some
emphasize the suddenness of a crisis (Fink, 1986; Paschall, 1992). Others focus on the negative
impact a crisis brings to an organization (Fearn-Banks, 1996; Lerbinger, 1997). Among these
definitions, Ulmer, Seeger, and Sellnow (2011) defined crisis as “a specific, unexpected, and
nonroutine event or series of events that create high levels of uncertainty and simultaneously
present an organization with both opportunities for and threats to its high-priority goals” (p. 7).
This definition is unique in two ways. First, a crisis is not always detrimental but could
potentially bring opportunities for growth to an organization. Second, crisis is defined in terms of
uncertainty. A crisis could disrupt the normal operation of an organization and pose a vast
amount of uncertainty to both organizations and stakeholders. However, they did not provide a
theoretical definition to uncertainty. Liu, Bartz, and Duke (2016) reinforced the importance of
uncertainty in crisis communication research, pointing out there is a lack of accurate definitions
and advocating for more empirical research on this concept. As crisis communication theories
progress, an increasing number of studies advocate ethical communication during a crisis
(Coombs, 2007, 2015; Millar & Heath, 2003; Ulmer, Seeger, & Sellnow, 2011). Stakeholders
should be the priority of any crisis communication plans. The study of uncertainty management
could help stakeholders alleviate their negative feelings and help post-crisis image repair.
Although stakeholders’ uncertainty appears in the crisis scholarship ordinarily (e.g.,
Holladay, 2009; Ray, 1999; Reynolds & Seeger, 2006; Seeger, 2006; Stephen, Malone, &
Bailey, 2005), it has never been explicated in crisis communication research. Crisis
communication theories have moved from organization-oriented research to audience-oriented

4
research (Coombs, 2010), and SCCT and ICM feature audience-oriented research by
investigating people’s attribution of responsibility and emotional responses respectively.
Stakeholders are continually observing a crisis as it evolves, and they are making judgments at
the same time. Uncertainty, as a rarely researched concept in crisis communication, is an
essential characteristic of stakeholders that deserves further investigation. It could potentially add
a new perspective to audience-oriented frameworks. Many questions remain unclear about this
variable, such as “What does uncertainty mean?”, “When stakeholders feel uncertain, what are
they uncertain about?”, “How does uncertainty influence people’s perceptions and behaviors
during a crisis?”
This dissertation aims to explore the concept and application of stakeholders’ uncertainty
within the organizational crisis context. Specifically, drawing from risk communication and
interpersonal communication, the current study attempts to define crisis-induced uncertainty and
propose dimensions under the construct. As mentioned previously, though uncertainty frequently
appears in the crisis literature, it is not extensively discussed and examined, not to mention an
accurate definition. Multiple disciplines have created unique definitions for uncertainty that fits
specific contexts so there should be no exception in the crisis context. Through a thorough
review of the literature, this dissertation seeks to delineate the layers of uncertainty and different
aspects an organization should consider in the face of a crisis. The new definition and
dimensions could bring researchers to the same page when they discuss crisis-induced
uncertainty.
Second, adapting from previous measurements in risk and interpersonal communication,
this study will propose a multidimensional scale to measure crisis-induced uncertainty. Research
cannot progress without proper measurements. However, methodologists have not reached a

5
consensus on the standard procedure of scale development. Different textbooks have provided
diverse recommendations on the best practices. This study will primarily follow Churchill’s
(1979) eight-step procedure in scale development while realizing the theoretical and
methodological contributions by later studies (DeVellis, 2012; Netemeyer, Bearden, & Sharma,
2003).
Third, employing the newly created scale, the dissertation attempts to establish links
between uncertainty and organization-public relationships (OPR), and between uncertainty and
information-seeking behaviors. It is generally accepted that the goal of crisis communication is
to improve the image or reputation of an organization (Benoit, 1995; Coombs, 2007; Sturges,
1994). Establishing the relationship between crisis-induced uncertainty and OPR is a significant
step to show evidence to scholars and practitioners that they should seriously treat stakeholders’
uncertainty. In the field of public relations, cultivating a long-term relationship is more important
than building a short-term image. Stakeholders’ feelings of uncertainty are an evolving concept
that changes as a crisis progresses. Therefore, this dissertation aims to investigate if crisis-
induced uncertainty influences OPR. Besides, this study will establish the relationship between
uncertainty and information-seeking behaviors in the organizational crisis context.
Understanding how people seek information during a crisis helps organizations better prepare
targeted messages.
Significance of the Dissertation and Expected Contribution
This study is expected to contribute to the crisis communication literature in three ways.
First, to the best of the author’s knowledge, this dissertation will be the first study to articulate
uncertainty in the organizational crisis context. As mentioned previously, crises create a unique
situation that poses tremendous uncertainty to both organizations and stakeholders (Ulmer,

6
Seeger, & Sellnow, 2011). Although scholars generally discuss uncertainty, it bears different
connotations for organizations and stakeholders. For organizations, they worry more about a
feasible solution and how to protect their reputation. For the public, they feel uncertain how an
incident will evolve and if that will seriously impact their life. It is critical to distinguish the
meaning of uncertainty in different situations. Without an accurate definition, the discussion of
uncertainty is ambivalent, and it hinders the further exploration of the concept. Therefore, this
study aims to open a door for a scholarly discussion regarding uncertainty.
Second, a developed uncertainty scale enables quantitative testing on uncertainty. Due to
a lack of common understanding, uncertainty has long been briefly explained but never gone
through robust testing. Any arguments made in the previous studies have not been empirically
supported. With the new scale, scholars could provide evidence to these arguments. Additionally,
the connotation of uncertainty can be different in different crisis situations. Scholars could use
the dimensions proposed in this study as a starting point to map out potential layers of
uncertainty across situations.
Third, as an underexplored variable, uncertainty has the potential to become the next
battleground for crisis communication research as the importance of the construct has been
frequently stressed in scholarships. Shoemaker, Tankard, and Lasorsa (2004) demonstrated that
theory building could start with a hypothesis. They argued, “a creative thinker begins the idea
generation process by forcing a relationship between two or more ideas that would normally not
be related” (Shoemaker et al., 2004, p. 75). This study tentatively tests the relationship between
uncertainty and OPR, and the relationship between uncertainty and information seeking. If such
relationships are established, more discussions on the construct will ensue, which might put
uncertainty to the frontline of thoery building in crisis communication.

7
CHAPTER 2: LITERATURE REVIEW
Crisis and Crisis Communication
The word “crisis” appears commonly in our daily conversation. If someone is in trouble
and has no idea how to deal with it, we can describe the situation as a crisis, such as a midlife
crisis. In organizational settings, a company might regard a sudden transition of the management
team, an economic downturn, or a voluntary product recall as a major crisis. Indeed, crisis can
refer to many different objects across situations and this inconsistency influences how scholars
understand an organizational crisis.
Scholars have defined the term, crisis, in various ways. In an early attempt, Allen and
Caillouet (1994) described that “crises occurred when an event or series of events threaten a
corporate actor’s legitimacy and therefore, ultimately, its survival” (p. 46). Lerbinger (1997)
defined crisis as “an event that brings, or has the potential for bringing, an organization into
disrepute and imperils its future profitability” (p. 4). The first two definitions emphasized the
negative impacts crises bring to organizations. Coombs (2007), in his article introducing SCCT,
explained crisis from a stakeholder’s perspectives, arguing crisis is “the perception of an
unpredictable event that threatens important expectancies of stakeholders and can seriously
impact an organization’s performance and generate negative outcomes” (p. 2-3). He stressed that
whether an event is a crisis should be determined by stakeholders. Ulmer, Seeger, and Sellnow
(2011) denoted crisis by “a specific, unexpected, and nonroutine event or series of events that
create high levels of uncertainty and simultaneously present an organization with both

8
opportunities for and threats to its high-priority goals” (p. 7). This definition showcased that
crises are not inherently negative.
Although a universally accepted definition does not exist, some common elements
emerge in the discussion. First, a crisis is an adverse event or some events that occur(s) suddenly.
While it is difficult to predict when exactly a crisis will occur, it is not impossible to expect one.
Coombs (2010) compared a crisis with an earthquake in California. People know an earthquake
will occur in Southern California in the future, but they do not know when and where it will
occur. Due to its suddenness, a crisis disrupts the normal operation of an organization and
requires much effort to fix it. Second, a crisis almost always brings negative outcomes to an
organization as well as its stakeholders. For stakeholders, their life might be threatened by
environmental damage, unsafe products, and offensive words or opinions. For organizations,
they will face a loss of consumers, a high cost to fix the problem, and long-term reputation
damage. Third, a crisis is a perception, and it does not need to be physical damage. Benoit (1997)
argued perceptions are more important than reality in crisis communication. If the stakeholders
of an organization believe there is a crisis, the organization must respond to it (Seeger, 2006).
Crisis communication is a broad term that describes an organization’s activities in the
face of a crisis. Sturges (1994) described crisis communication as the communication practices
of an organization during an organizational crisis. Fearn-Banks (2002) depicted crisis
communication as the interaction between an organization and its stakeholders using verbal,
visual, and written tools before, during, and after a crisis. When compared with risk
communication, Reynold and Seeger (2005) argued crisis communication is primarily a public
relations practice. It derives from the need to strategically defend an organization’s position
when being exposed to criticism, attack, threat, and uncertainty caused by a crisis. Coombs

9
(2010) defined crisis communication as the collection, processing, and dissemination of
information and regarded it as the essence of crisis management. Overall, crisis communication
aims to explain the event through designing and disseminating specific messages. Ultimately, it
helps protect stakeholders and an organization’s reputation.
Crisis Communication Theories
Crisis communication research could be dated back to 1986 when Steve Fink published
the seminal book, Crisis Management: Planning for the Inevitable (Coombs, 2010). Early
landmark crisis studies more often appeared in management journals rather than communication
journals (Mitroff, 1994; Smith, 1990; Weick, 1988). However, as crisis research progresses,
researchers gradually realized the role of communication in crisis management. Coombs (2010)
contended that communication plays a vital role in every phase of a crisis from pre-crisis to post-
crisis. An increasing number of studies that investigate organizational crises appeared in
communication journals. Along with this trend, a growing number of theories and frameworks
emerged in communication journals.
Corporate apologia
The theory of corporate apologia originated from rhetorical studies. It aimed to use
communication for self-defense when one’s characters are attacked; therefore, it was initially
worded as the speech of self-defense (Ware & Linkugel, 1973). Ware and Linkugel (1973)
introduced four strategies when critics attack: denial, bolstering, differentiation, and
transcendence. Denial attempts to deny any alleged facts and refute the validity of the attack.
Bolstering associates the speaker with something people feel positive about. Differentiation
prevents the audience from making judgments instantly until more evidence is shown.
Transcendence psychologically pushes the audience to look at more abstract and general

10
characters of the speaker rather than focusing on the current attack (Ware & Linkugel, 1973).
Coombs, Frandsen, Holladay, and Johansen (2010) demonstrated that corporate apologia is a
perfect fit to crisis communication though it was designed to explain the individual-level
communication. Similar to a person’s traits, an organization also has its traits (reputation). In the
face of an attack, the organization needs to defend its character (reputation) (Coombs et al.,
2010).
Corporate apologia was widely applied to early crisis communication research. Each of
the four strategies were scrutinized in different case studies, such as the General Motors
incendiary device crisis (Hearit, 1996), the Johnson Control’s fetal protection policy crisis
(Hearit, 1997), the Intel Pentium processor crisis (Hearit, 1999), the Audi 5000 crisis (Hearit &
Courtright, 2003), and the Merrill Lynch fraud crisis (Hearit & Brown, 2004). As an early
rhetorical theory applied to crisis communication, it helps researchers identify and categorize
available crisis response strategies by organizations. It also lays the foundation of future
empirical testing of crisis response strategies.
Image repair theory
Image repair theory (IRT) is a comprehensive framework to understand the goal of crisis
communication as well as available strategies one can employ to respond to a crisis. It was
initially framed as Image Restoration Theory (Benoit, 1997). Receiving critiques from Burns and
Bruners (2000) that an image can hardly be fully restored but can only be repaired, Benoit and
Pang (2008) started to use image repair theory, and the term became the formal name of the
theory thereafter. The basic idea of IRT is that a person or an organization sometimes faces
accusations from another person or organization for wrongdoings. When attacked, the accused
party uses communication strategies to repair its image.

11
There are two underlying assumptions of IRT (Benoit, 2014). First, communication is a
goal-oriented activity. Second, maintaining a positive image is a crucial goal of communication.
Besides communication, IRT also considers the nature of accusations. Benoit (2014) argued that
communication is only necessary when an incident is undesirable, and the accused party is
responsible for the incident. When the two conditions are met concurrently, an organization must
respond to the accusation. Benoit (1997, 2014) provided five primary communication strategies
for consideration: denial, evasion of responsibility, reducing offensiveness, corrective action, and
mortification. The five general strategies can be further divided into 14 specific types. Table 1
provides the 14 image repair strategies.
Table 1: Image Repair Strategies (Benoit, 2014)
Denial Simple denial Deny the wrongful action
Shift blame Blame someone for the wrongful action
Evade responsibility Provocation The wrongful action is in response to another
wrongful action
Defeasibility Claim a lack of control over the situation
Accident Make an excuse based on accidents
Good intentions Intend to something good
Reduce offensiveness Bolstering Remind of the past good actions
Minimization Minimize the amount of negative effects
Differentiation Differentiate the action from a more negative one
Transcendence Placing the action in a different context
Attack accuser Reduce the credibility of the accuser
Compensation Offer to remunerate the victim
Corrective action Fix the problem
Mortification Apologize to who is offended
Since its inception, IRT has been applied to case studies in the corporate field (e.g.,
Benoit, 1995; Blaney, Benoit, & Brazeal, 2002; Brinson & Benoit, 1994, 1999; Muralidharan,
Dillistone, & Shin, 2011), the political field (e.g., Benoit, 2006; Benoit & Henson, 2009; Blaney
& Benoit, 2001; Kennedy & Benoit, 1997), and the sports and entertainment field (e.g., Benoit &

12
Hanczor, 1994; Brazeal, 2008; Bruce & Tini, 2008). These studies focused on an individual
crisis and analyzed what strategies the accused parties employed in that specific situation.
Besides case studies, researchers further used the experiment method to test the effectiveness of
the proposed strategies (Brown, 2016; Brown, Billings, Mastro, and Brown-Devlin, 2015; Dardis
& Haigh, 2008).
Along with corporate apologia, IRT is an organization-oriented theory that considers how
to respond to accusations. It primarily discusses the communication strategies used by
organizations without considering the reactions of stakeholders. However, stakeholders are a
primary component of crisis communication because a goal of crisis communication is to make
stakeholders form a better image of an organization. As stated by Benoit, “Persuasion is all about
trying to change the audience’s attitudes; in image repair, the goal of persuasive messages is to
change the audience’s attitudes concerning accusations or suspicions about the target of attack”
(Benoit, 2014, p.31). Therefore, crisis communication theories should not only present available
strategies to organizations, but they should also help organizations understand how people
perceive a crisis and crisis response strategies.
Situational crisis communication theory
Through the years of theory development, crisis communication mainly went through two
stages (Lee, 2004). In the first stage, researchers analyzed crisis response strategies in each crisis.
In the second stage, researchers gradually paid more attention to the audience. They attempted to
understand how the audience understands crises and their reactions to different response
strategies. Arguably, the second stage has become the dominant trend in crisis communication,
and situational crisis communication theory (SCCT) represents this line of research (Avery,
Lariscy, Kim, & Hocke, 2010).
13
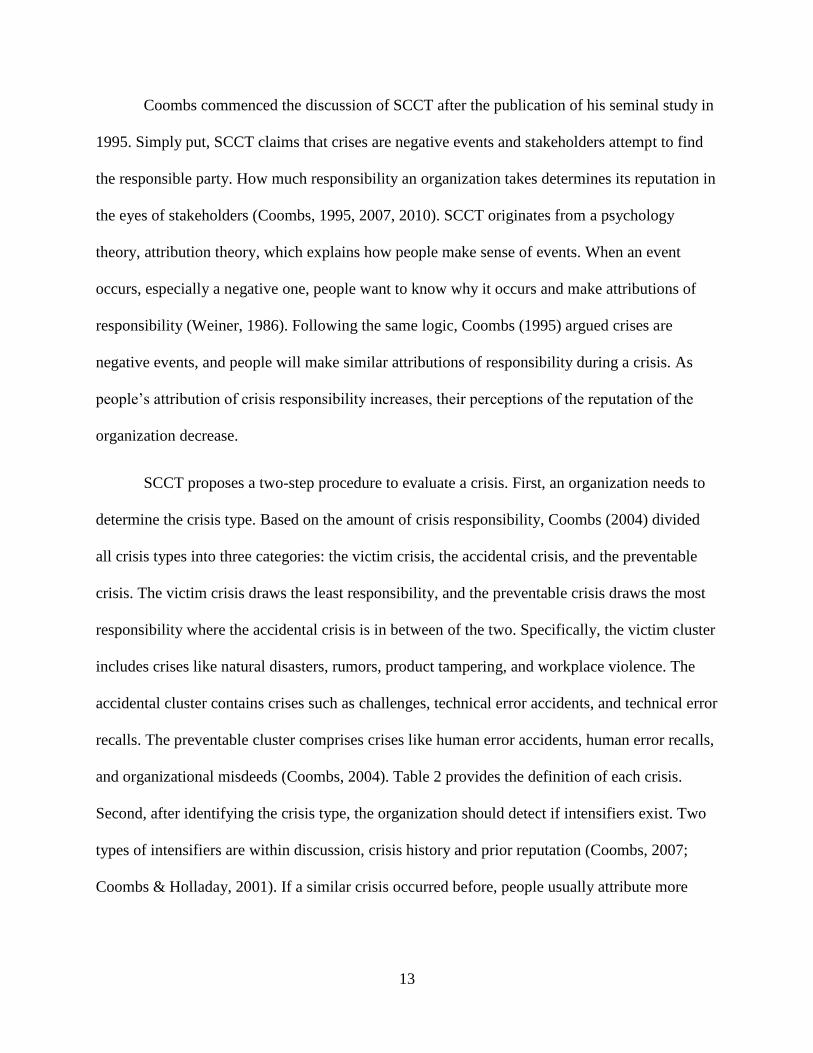
Coombs commenced the discussion of SCCT after the publication of his seminal study in
1995. Simply put, SCCT claims that crises are negative events and stakeholders attempt to find
the responsible party. How much responsibility an organization takes determines its reputation in
the eyes of stakeholders (Coombs, 1995, 2007, 2010). SCCT originates from a psychology
theory, attribution theory, which explains how people make sense of events. When an event
occurs, especially a negative one, people want to know why it occurs and make attributions of
responsibility (Weiner, 1986). Following the same logic, Coombs (1995) argued crises are
negative events, and people will make similar attributions of responsibility during a crisis. As
people’s attribution of crisis responsibility increases, their perceptions of the reputation of the
organization decrease.
SCCT proposes a two-step procedure to evaluate a crisis. First, an organization needs to
determine the crisis type. Based on the amount of crisis responsibility, Coombs (2004) divided
all crisis types into three categories: the victim crisis, the accidental crisis, and the preventable
crisis. The victim crisis draws the least responsibility, and the preventable crisis draws the most
responsibility where the accidental crisis is in between of the two. Specifically, the victim cluster
includes crises like natural disasters, rumors, product tampering, and workplace violence. The
accidental cluster contains crises such as challenges, technical error accidents, and technical error
recalls. The preventable cluster comprises crises like human error accidents, human error recalls,
and organizational misdeeds (Coombs, 2004). Table 2 provides the definition of each crisis.
Second, after identifying the crisis type, the organization should detect if intensifiers exist. Two
types of intensifiers are within discussion, crisis history and prior reputation (Coombs, 2007;
Coombs & Holladay, 2001). If a similar crisis occurred before, people usually attribute more

14
responsibility to the organization. If the organization has a bad reputation, people again attribute
more responsibility to the organization.
Table 2: Crisis Type Definitions (Coombs, 2007)
Victim
Natural disaster: Acts of nature that damage an organization such as an
earthquake. Some environmental/weather event impacts the organization.
Rumors: False and damaging information about an organization is being
circulated. Evidence that the information is false.
Workplace violence: Current or former employee attacks current employees
onsite. An employee or former employee injures or attempts to injure current
employees.
Product tampering/malevolence: External agent causes damage to an
organization. Some actor outside of the organization has altered the product to
make it dangerous.
Accidental
Challenges: Stakeholders claim an organization is operating in an inappropriate
manner. There is a public challenge based on moral or ethical, not legal,
grounds.
Technical error accidents: A technology or equipment failure causes an
industrial accident. The cause of the accident is equipment/technology related.
Technical error recalls: A technology or equipment failure causes a product to
be recalled. A product is deemed harmful to stakeholders. The cause of the recall
is equipment or technology related.
Preventable
Human error accidents: Human error causes an industrial accident. The cause
of the accident is a person or people not performing job properly.
Human error recalls: Human error causes a product to be recalled. A product is
deemed harmful to stakeholders. The cause of the recall is a person or people not
performing job properly.
Organizational misdeed: Laws or regulations are violated by management or
stakeholders are placed at risk by management. Members of management
knowingly violate laws/regulations or offer a product or service they know could
injure stakeholders.
After fully understanding the situation, the organization, like the argument in IRT, should
use appropriate communication strategies to respond to the crisis. Coombs (1998) initially
synthesized Benoit’s (1995) strategies and Allen and Caillouet’s (1994) strategies into seven
categories: attack the accuser, denial, excuse, justification, ingratiation, corrective action, and
full apology. Later he collapsed all response strategies into three primary strategies: deny,

15
diminish, and deal/rebuild (Coombs, 2006, 2007). The deny cluster contains attack the accuser,
denial, and scapegoat. The diminish cluster contains excuse and justification. The deal/rebuild
cluster contains compensation and apology (Coombs, 2006). Coombs (2007, 2015)
recommended that organizations should use more accommodative strategies such as apology if
they take more responsibility for a crisis. In contrast, when organizations bear no responsibility,
they can use strategies like denial or attack the accuser. For example, in a rumor or challenge
crisis, the denial strategy is appropriate. The diminish strategy is ideal for an accidental crisis
when an organization bears little responsibility. For a preventable crisis, the best strategy to take
is the rebuild strategy. Besides traditional crisis response strategies, Coombs (2007, 2015) also
emphasized two types of information: adjusting and instructing information. Adjusting
information refers to messages that psychologically alleviate stakeholders’ stress. Instructing
information denotes messages that tell stakeholders what they should do to protect themselves
(Coombs, 2007, 2015). Based on ethical consideration, the goal of the types of information is to
protect stakeholders rather than image repair.
Ever since the introduction of SCCT, it quickly became a mainstream theory in crisis
communication research. Different from corporate apologia and IRT, SCCT enables quantitative
research. Researchers could use the experiment method to test which strategy works the best in
certain situations and provide empirical evidence to support or refute suggestions provided by
the theory. Scholars have tested different crisis response strategies across different crisis types
(e.g. Brown & White, 2010; Claeys, Cauberghe, & Vyncke, 2010; Dutta & Pulling, 2011; Ki &
Brown, 2013; Sisco, 2012; van Zoonen & van der Meer, 2015). Interestingly, these studies
revealed inconsistent best practices and most of them did not comply with Coombs’
recommendations. Ma and Zhan’s (2016) meta-analysis indicated that matched crisis response
16
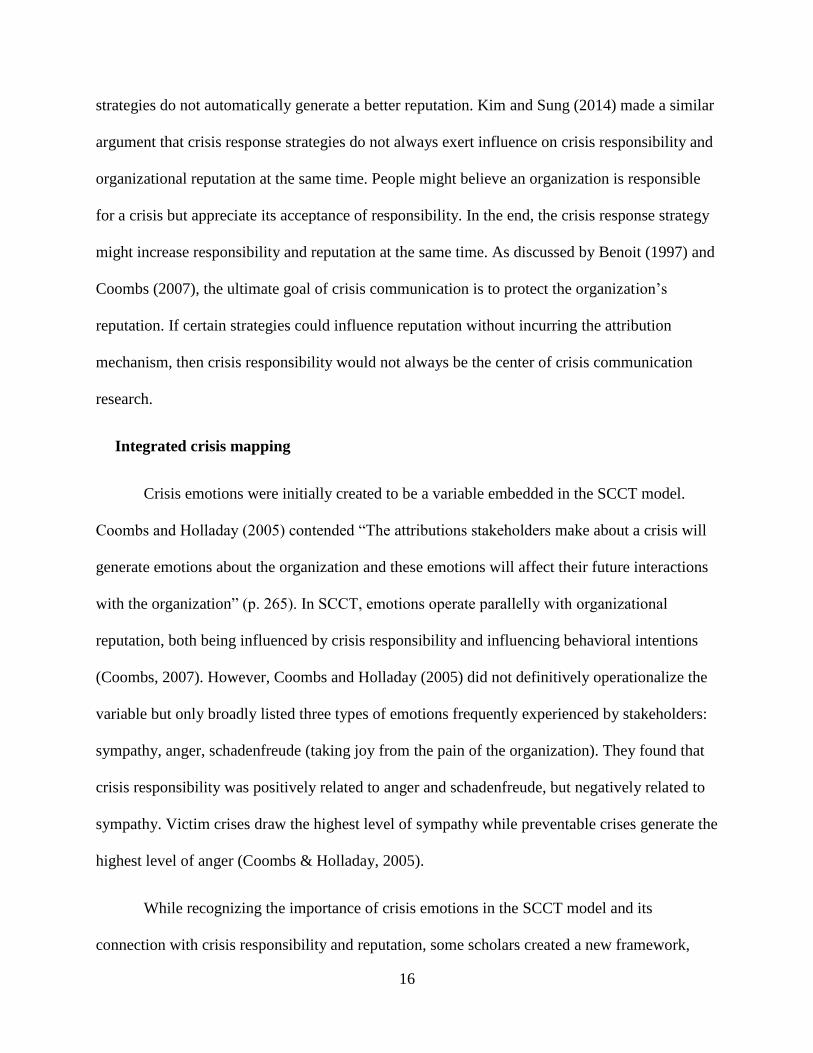
strategies do not automatically generate a better reputation. Kim and Sung (2014) made a similar
argument that crisis response strategies do not always exert influence on crisis responsibility and
organizational reputation at the same time. People might believe an organization is responsible
for a crisis but appreciate its acceptance of responsibility. In the end, the crisis response strategy
might increase responsibility and reputation at the same time. As discussed by Benoit (1997) and
Coombs (2007), the ultimate goal of crisis communication is to protect the organization’s
reputation. If certain strategies could influence reputation without incurring the attribution
mechanism, then crisis responsibility would not always be the center of crisis communication
research.
Integrated crisis mapping
Crisis emotions were initially created to be a variable embedded in the SCCT model.
Coombs and Holladay (2005) contended “The attributions stakeholders make about a crisis will
generate emotions about the organization and these emotions will affect their future interactions
with the organization” (p. 265). In SCCT, emotions operate parallelly with organizational
reputation, both being influenced by crisis responsibility and influencing behavioral intentions
(Coombs, 2007). However, Coombs and Holladay (2005) did not definitively operationalize the
variable but only broadly listed three types of emotions frequently experienced by stakeholders:
sympathy, anger, schadenfreude (taking joy from the pain of the organization). They found that
crisis responsibility was positively related to anger and schadenfreude, but negatively related to
sympathy. Victim crises draw the highest level of sympathy while preventable crises generate the
highest level of anger (Coombs & Holladay, 2005).
While recognizing the importance of crisis emotions in the SCCT model and its
connection with crisis responsibility and reputation, some scholars created a new framework,

17
integrated crisis mapping (ICM), and regarded crisis emotions as the center of crisis
communication (Jin, et al., 2007, 2012). Jin, et al. (2007) argued that crisis managers could draft
crisis response strategies from an emotional perspective. Different from the view of SCCT that
crisis response strategies should influence crisis responsibility, ICM focuses on how response
strategies relieve stakeholders’ emotions.
In ICM, emotions are defined as “organized cognitive-motivational-relational
configurations whose status changes with changes in the person-environment relationship as this
is perceived and evaluated (appraisal)” (Lazarus, 1991, p. 38). It reflects stakeholders’
interpretations of the change and evolvement of a crisis. ICM primarily concerns about the
primary audience who are directly affected by a crisis, such as victims, employees, and news
media. Drawing from Lazarus’ study (1991), four current crisis emotions are raised: anger,
fright, anxiety, and sadness. To categorize the emotions, Jin, et al. (2007, 2012) introduced two
dimensions: the public’s coping strategy and the level of organizational engagement. Coping
strategies refer to the choice of the public to deal with a crisis, which ranges from cognitive
coping to conative coping. Cognitive coping represents how the public thinks about and makes
sense of a crisis while conative coping stands for the actions the public takes to sustain a positive
relationship with an organization in crisis. The level of organization engagement is
operationalized as “a combination of the relevance between what had happened in the crisis and
the organizational goal in operational and reputational success” (Jin, et al., 2012, p. 272). A crisis
with a high organizational engagement is usually intense, asking for more resources from the
organization to deal with it, such as natural disasters and economic downturns. On the contrary, a
low organizational engagement requires less effort from the organization to resolve the issue,
such as human resource problems. Based on the two dimensions, Jin, et al. (2007) formed four

18
crisis situation quadrants: (1) high engagement/conative coping, (2) high engagement/cognitive
coping, (3) low engagement/cognitive coping, and (4) low engagement/conative coping.
However, empirical evidence does not fully support this argument. Conative coping is somewhat
dominant during a crisis. Regardless of quadrants, cognitive coping never surpasses conative
copying (Jin, et al., 2012).
Besides the landmark exploration by Jin, Pang, and Cameron (2007, 2012), a series of
studies have been conducted to test and extend the scope of ICM. Jin (2010) examined the
influence of crisis predictability and crisis control on crisis emotions, coping strategies of
stakeholders, and the effectiveness of crisis response strategies. A crisis with high predictability
and control is likely to generate more anger and sadness. To the contrary, a crisis with low
predictability and control generates more fright of the public. Jin (2014) investigated two
emotions, sympathy and anger, at different levels of intensity. More intense sympathetic feelings
lead to conative coping and less intense sympathetic feelings lead to cognitive coping. Jin,
Fraustino, and Liu (2016) posited that anger and anxiety significantly predict the information-
seeking behaviors of stakeholders after a crisis. Jin, Liu, Anagondahalli, and Austin (2014)
developed a scale to measure common emotions experienced during a crisis. They categorized
various emotions appeared in previous studies into three clusters: the attribution-independent
crisis emotions (anxiety, fear, apprehension, and sympathy), the internal-attribution-dependent
crisis emotions (guilt, embarrassment, and shame), and the external-attribution-dependent crisis
emotions (disgust, contempt, anger, and sadness) (Jin, et al., 2014).
Like SCCT, ICM is another audience-oriented theory that explains how people perceive
and understand a crisis and adds a new perspective to analyze stakeholders. To the best of the
author’s knowledge, SCCT and ICM are the only two theories in crisis communication that focus

19
on the public. As stated by Benoit (1995), perceptions are more important than facts in crisis
communication. Defined as “groups without whose support the organization would cease to
exist” (Freeman & Reed, 1983), stakeholders, including consumers, media, community, and
employees, should be the center of crisis communication research. During a crisis, stakeholders
continuously make judgments about a crisis and their stances change when they receive different
information. Different factors can influence the judgment-making process, such as the way they
attribute responsibility and negative emotions incurred in a crisis. The feeling of uncertainty is
also a personal characteristic that might change people’s attitude. Many scholars advocate the
consideration of stakeholders’ uncertainty in crisis communication research (Liu et al., 2016).
Therefore, as a potential characteristic of stakeholders that might influence their perceptions
about a crisis, uncertainty needs a full specification. Further, public relations scholars emphasize
ethical communication (Coombs, 2007, 2015; Kent & Taylor, 2002). The research on
stakeholders’ uncertainty management could tell organizations what to do to protect them. But
before that, researchers need to investigate the meaning of uncertainty during a crisis.
The Concepts of Uncertainty
Crisis and risk communication
Some crisis communication scholars have introduced the concept of uncertainty, but the
concept has never been thoroughly defined and empirically investigated. Ray (1999) argued that
the higher the uncertainty about solving a crisis, the more severe the crisis is. Stephen, Malone,
and Bailey (2005) proposed that the management of uncertainty is the key element of using crisis
response strategies. Reynolds and Seeger (2005) postulated that timely communication is
necessary to help the audience who are directly affected by a crisis as well as the public. For
people who are directly influenced, such as victims, potential victims, and family members of the

20
victims, the primary purpose is to contain harm. For the public, immediate communication aims
to reduce uncertainty, inform the public about what just happened, and tell them how to react
appropriately. Seeger (2006) claimed that a crisis itself is a high-uncertainty event, in which it is
hard to get immediate information. Organizations should acknowledge uncertainty and try to
avoid over-assuring messages. In explaining adjusting and instructing information in SCCT,
Holladay (2009) maintained that the aim of offering the two strategies is to reduce uncertainty
and reassure stakeholders. Ulmer, Seeger, and Sellnow (2011) even defined crisis as “a specific,
unexpected, and nonroutine event or series of events that create high levels of uncertainty and
simultaneously present an organization with both opportunities for and threats to its high-priority
goals” (p. 7). Liu et al. (2016) emphasized that terrorist attacks and emergency vaccinations are
two areas in crisis communication that involve a high level of uncertainty. They also mentioned
that uncertainty is closely associated with trust, fear, and information seeking.
Despite the frequent appearance of uncertainty in studies defining crises, describing crisis
response strategies, and proposing best practices, uncertainty has never become the center of
crisis communication research. As Liu et al. (2016) put, “Uncertainty is central in crisis
definitions, but it is not central in existing crisis communication research and theory
development” (p. 484). Until now, there is no widely accepted definition of uncertainty in the
crisis context. Only one study briefly defined uncertainty as “an inherently uncomfortable state”
(Lachlan, Spence, & Nelson, 2010). Crisis communication researchers advocate effective
uncertainty management but never explicitly explain how organizations could use crisis response
strategies to deal with it, not to mention providing empirical evidence to support the arguments.
Another major unanswered question is what stakeholders feel uncertain about when uncertainty

21
arises. To follow this line of research, an accurate definition of uncertainty is necessary as well
as a comprehensive framework to conceptualize uncertainty in crisis communication.
Although the concept of uncertainty does not generate enough explanation in crisis
communication, its meaning is frequently discussed in risk communication, a similar but
independent field to crisis communication. Heath and Gay (1997) argued that risk is entwined
with uncertainty. The discussion of risk is related to probabilistic predictions of positive, neutral,
and negative outcomes, and the likelihood that the outcomes are tolerable or not. Risk
communication does not create its definition of uncertainty; instead, it borrows the concept from
other disciplines. In organizational communication, uncertainty is believed to be the gap between
the total information needed for a task and the information that already possessed. Driskill and
Goldstein (1986) defined uncertainty as “the perceived lack of information, knowledge, beliefs,
and feelings, whatever is necessary for accomplishing the organizational task” (p. 45). They
argued that uncertainty means one does not have enough knowledge, but simply rendering
information cannot solve the issue. If the information could not change one’s attitude or belief,
uncertainty will remain (Driskill & Goldstein, 1986). Heath, Seshadri, and Lee (1998) claimed
“uncertainty is a measure of confidence regarding (a) the ability to estimate risk and its
consequences and (b) to communication knowledgeably” (p. 43). Heath (1990) also associated
uncertainty with information, urging risk managers to see information-seeking behaviors of the
public as a cause of the desire to reduce uncertainty.
Generally, risk communication regards uncertainty as a void of knowledge, information,
and beliefs. The void further impacts one’s confidence to accurately predict a future event. Risk
communication commonly discusses people’s uncertainty about new and unfamiliar technology.
Melber, Nealey, Hammersla, Rankin (1977) found that people fear nuclear plants because they

22
are uncertain about the potential harm it brings to residents. Besides risk communication,
uncertainty is an equally important concept in interpersonal communication theories, such as
uncertainty reduction theory, problematic integration theory, and uncertainty management
theory.
Uncertainty reduction theory
Berger and Calabrese (1975) first proposed uncertainty reduction to explain interpersonal
communication process. Before uncertainty reduction theory (URT), most interpersonal
communication theories borrowed from social psychology theories. Feeling unsatisfied with the
current theories that focus on psychological factors, Berger and Calabrese (1975) created an
interpersonal theory that emphasizes the communication process. URT focuses on the interaction
between two individuals, especially two strangers. The primary assumption of URT is that it is
human nature to reduce uncertainty or increase predictability about the behavior of themselves
and others when strangers meet (Berger, 1979, 1987; Berger & Bradec, 1982; Berger &
Calabrese, 1975). Uncertainty was initially defined as the number of possible alternative
predictions. As the number of alternative explanations goes up, the level of uncertainty increases
accordingly (Berger & Bradec, 1982; Berger & Calabrese, 1975). Knobloch and Solomon (1999)
defined uncertainty as “a lack of confidence about how an interpersonal encounter will proceed;
it involves the inability to describe, explain, and predict within interaction” (p. 262). Baxter and
Montgomery (1996) stated uncertainty exists when situations are unpredictable and
incomprehensible. As such, uncertainty is believed to be a cognitive process in which people
analyze possibilities and increase predictability.
To state the theory, Berger and Calabrese (1975) utilized seven axioms and 21 theorems.
Axiom 1 presents as verbal communication increases, the uncertainty level of both interactants

23
decreases. The lowered uncertainty further boosts the verbal communication. Verbal
communication means the number of words exchanged between two interactants. Axiom 2
claims as nonverbal affiliative expressiveness increases, the uncertainty level of both interactants
decreases. The lowered uncertainty encourages nonverbal affiliative expressiveness. Nonverbal
affiliative expressiveness refers to a specific nonverbal communication that people show positive
feelings toward the other. Axiom 3 contends a high level of uncertainty drives information-
seeking behaviors. Axiom 4 states increased uncertainty decreases the intimacy of
communication contents. The intimacy of communication contents represents how likely one is
willing to reveal personal information such as feelings, attitudes, and opinions. Axiom 5 posits a
higher level of uncertainty causes a higher rate of reciprocity. The rate of reciprocity means an
equal sharing of information between people. Axiom 6 shows the similarities between two
people decrease uncertainty while dissimilarities increase uncertainty. Axiom 7 posits the
increase in uncertainty causes a decrease in liking. Based on Park and Adelman’s (1983) study,
Berger and Gudykunst (1991) added an eighth axiom that a shared communication network
decreases uncertainty. A shared communication network indicates interactants have common
friends or family members. Table 3 provides the eight axioms.
Table 3: Uncertainty Reduction Theory Axioms (Berger & Bradac, 1982; Berger & Gudykunst,
1991)
Axiom 1: As verbal communication increases, the level of uncertainty of both parties
decreases.
Axiom 2: As nonverbal affiliative expressiveness increases, the level of uncertainty of both
parties decreases.
Axiom 3: As the level of uncertainty increases, information-seeking behaviors increases.
Axiom 4: High levels of uncertainty decreases the intimacy level of communication content.
Axiom 5: High levels of uncertainty increases reciprocity.

24
Axiom 6: Similarities between the two parties decrease uncertainty while dissimilarities
increase uncertainty.
Axiom 7: As the level of uncertainty increases, the liking between two parties decreases.
Axiom 8: A shared communication network decreases uncertainty.
The scope of URT was narrow when it was first proposed because it only aimed to
explain the initial interactions between strangers. Since its inception, researchers explored the
applicability of the theory to more relationships such as romantic relationships (Parks &
Adelman, 1983), ongoing relationships (Planalp & Honeycutt, 1985; Knobloch & Solomon,
2002), cross-cultural communication (Gudykunst, 1983; Gudykunst, 1985; Gudykunst, Yang, &
Nishida, 1985), organizational communication (Kramer, 1999), and health communication
(Brashers, 2007).
Berger and Bradec (1982) deemed that uncertainty comes from three sources: partner
uncertainty, self uncertainty, and relationship uncertainty. Partner uncertainty refers to the
inability to predict the feelings, attitudes, and behaviors of a person. For example, if a student is
in the first class of a new semester and never met the professor before, the student might feel
uncertain about the professor. What will be the professor’s style? Is the professor a tough grader?
Is the professor more formal or laid-back? Partner uncertainty primarily concerns the uncertainty
related to the person an individual is going to interact with (Berger & Bradec, 1982; Berger &
Calabrese, 1975).
Self uncertainty represents a person’s inability to describe, explain, and predict how
he/she should behave in a context (Berger & Bradec, 1982; Berger & Calabrese, 1975). For
example, as a Christian, an individual is invited to visit a Muslim family. However, the
individual knows very little about the Muslim culture. In this situation, he/she may feel uncertain

25
about how to behave and what to say at the Muslim family and want to know if there are any
taboos he/she should not discuss.
Relational uncertainty is the third source of uncertainty. It mainly concerns with a lack of
confidence to predict and explain issues about a given relationship (Berger & Bradec, 1982;
Berger & Calabrese, 1975). One who feels relationally uncertain does not know where the
relationship is going. In a romantic relationship, if an individual’s boyfriend or girlfriend fails to
answer his/her call multiple times. The individual may want to know what happened and feel
uncertain where the relationship is going.
Redmond (2015) concluded four guiding principles of URT. First, people’s willingness to
reduce uncertainty depends on the likelihood of future interactions. An employee wants to
increase the predictability of his/her boss’s thoughts and behaviors because he/she needs to
interact with the boss regularly. However, the employee is less willing to take effort to reduce
uncertainty toward a passenger next to him/her on a flight because no further interaction will
happen in the future. Second, in an initial interaction, uncertainty increases if one party violates
social norms. For example, when someone talks to a new friend, he/she will be more likely to
talk about the weather, sports, job, etc. It is not a social norm to reveal more personal
information such as family issues and romantic relationship problems. However, if someone
keeps talking about these issues, the interactant might feel weird and wonder about the
personality of this new friend. Third, uncertainty increases when people violate the expectations
we have formed about him/her. For example, an individual’s friend is always an optimistic and
forward-looking person but one day he/she keeps talking about everything is doomed. The
individual will feel there is something wrong with the friend and uncertainty increases
accordingly. Last, uncertainty can be reduced through information acquisition. If an individual

26
does not understand what his/her interactant means, simply asking the meaning of the words or
behaviors could remove uncertainty (Redmond, 2015).
Problematic integration theory
Realizing the limitations in URT, Babrow (1992, 1995, 2001, 2007) developed
problematic integration theory (PIT) to explain people’s reactions in the face of uncertain
situations and how communication affects uncertainty. The fundamental argument of PIT is that
human beings form two orientations: probabilistic orientation and evaluative orientation
(Babrow, 2007). Probabilistic orientations denote “an expectation that associates some object of
thought with another object of thought” (Babrow, 2007, p.183). Afifi and Matsunaga (2008)
explained the term as one’s belief about what the world is or will be. One might ask the question
“How likely it will rain tomorrow?” “What is my chance of passing the exam?” “What seems to
have caused this?” These questions originate from people’s probabilistic orientations. Besides
probabilistic orientations, PIT posits that human beings also form evaluative orientations to the
world and it is human nature to evaluate whether an issue is good or bad (Babrow, 2007).
Evaluative orientations answer the question: “Is this event or outcome good or bad?” Afifi and
Matsunaga (2008) compared probabilistic orientations to the hot component of the theory,
whereas evaluative orientations to the cold component. Babrow (1992, 1995, 2001, 2007) has
argued that both probabilistic orientations and evaluative orientations derive from human nature
and arise at the same time. However, they are not merely separate phenomena.
The second proposition of PIT is that probabilistic and evaluative orientations are
integrated into human experience. Moreover, the two orientations are interdependent and
integrated in a sophisticated way. Probabilistic orientations significantly influence evaluative
orientations and vice versa (Babrow, 2007). The third primary claim of PIT is that the integration

27
process is not smooth but often causes problems. Babrow (1992), in his pioneering study,
discussed four types of problem integrations: divergence, ambiguity, ambivalence, and
impossibility. Divergence indicates the situations that probabilities and values diverge. For
example, sometimes a negative event (evaluative orientations) is likely to happen (probabilistic
orientations) to you while a good event is less likely to happen to you, both of which are negative
to an individual. When these situations occur, people usually experience negative emotions such
as anger, frustration, and disappointment (Babrow, 1992). The second type is ambiguity, which
refers to the situation that the probability of something to happen is vague (Babrow, 1992).
Ambivalence concerns with the complexity of evaluative orientations. In certain situations,
people don’t know how to evaluate an event because it involves both potential positive and
negative outcomes (Babrow, 1992). The last form of problematic integration is impossibility,
which means something is certainly not going to happen. However, the fact of certainty is hard to
consume because the entity is valued (Babrow, 1992).
In the later applications, Babrow (2007) noticed the limitations of the four types when
explaining uncertainty related to health and illness. He argued uncertainty comes in more
different forms than initially conceptualized. Uncertainty is not only about quantitative
probability. Sometimes, a probability can be predicted. For example, there is a way to compute
the chance of rain tomorrow. However, in many situations, one hopes to know the probability of
an event, but there is no way to predict the probability. For example, a high school student wants
to know the probability of being accepted by his/her dream college, but there is no way to get an
accurate prediction. Moreover, uncertainty, sometimes, cannot be described in the sense of
quantitative probability judgment.

28
Later studies indicated uncertainty has both ontological and epistemological meanings
(Babrow, 2001; Babrow, Kasch, & Ford, 1998; Babrow, Hines, & Kasch, 2000). Ontological
uncertainty discusses uncertainty related to the nature of the world. Perceived indeterminacy is a
representation of ontological uncertainty, which refers to a relationship that the cause of an event
cannot be resolved (Babrow, 2001). In contrast, epistemological uncertainty comes with different
forms. Babrow (2001) deliberated four variants of epistemological uncertainty: qualities and uses
of information, the nature of the association, information processing, and the nature of knowing.
Clearly, philosophers have different opinions about the definition of uncertainty and individual
differences also exist. Despite the difficulty to find an accurate definition of uncertainty, PIT
challenged URT in a variety of ways. First, by listing many different connotations of uncertainty,
PIT claims that uncertainty does not have a single and homogeneous meaning. It is not merely an
accumulation of probability. Second, unlike URT, PIT holds that uncertainty is not inherently a
positive or negative concept. Third, uncertainty is a state which is not caused by a lack of
information. Instead, it originates from the problematic integration process. Fourth, since the
cause of uncertainty is not a lack of information, the main response to deal with uncertainty is
not information seeking. Fifth, since uncertainty is not inherently good or bad, the aim of dealing
with it is not to reduce it. Sixth, certainty is not possible; instead, uncertainty is embedded in
human nature (Babrow, 2007).
Uncertainty management theory
The idea of uncertainty management emerges from PIT, and the connotation of
uncertainty in uncertainty management theory (UMT) is similar to that of PIT. UMT also
suggests that uncertainty is a complex concept that does not possess a universal definition.
Brashers (2001) argued, “uncertainty is a self-perception about one’s own cognitions or ability to

29
derive meanings” (p. 478). The argument refutes the traditional wisdom that uncertainty and
communication are inseparable. A person is uncertain as long as he believes him to be uncertain
even if he has enough information available. Suppose a person has enough information at hand
but the information contradicts one another. The more information he/she gets, the more
uncertain he/she feels (Brashers, 2001).
UMT is new and unique in the following three ways: First, UMT focuses on the meaning
and experience of uncertainty. Second, UMT emphasizes how people emotionally appraise and
respond to uncertainty. Third, UMT discusses various communicative and psychological
strategies to manage uncertainty (Afifi & Matsunaga, 2008). Since Brashers centers the theory
on the experience of HIV patients, UMT significantly contributes to health communication
research.
Following the idea of PIT, the fundamental argument of UMT is that uncertainty by itself
could be either good or bad. It does not automatically cause anxiety; rather, people will first
appraise an uncertain situation. Brashers (2001, 2007) argued that the appraisals of uncertainty
mainly focus on three issues: relevancy, congruency, and coping skills. People will first ask the
question “Is the event relevant to me?” If the answer is yes, they will continue to ask, “Is the
event congruent or incongruent with my goal?” If the answer is still positive, they will keep
asking, “What resources are available for coping with the event?” If a person believes the event
is relevant and congruent to his/her goal, he/she might form a positive appraisal of uncertainty. If
a person thinks the event is relevant and incongruent to his goal, he/she might hold a negative
appraisal of uncertainty (Brashers, 2001, 2007). Different appraisals of uncertainty cause
different emotions. If a person holds a negative appraisal, negative emotions will occur like
anxiety or fear. If a person holds a positive appraisal, positive emotions will occur like hope and

30
optimism. It is also possible that people show neutral emotions in the face of uncertainty. For
example, if a person believes the occurrence of an event is irrelevant to them, they will show
neutral emotions, such as indifference (Brashers, 2001, 2007).
When facing different types of uncertainty and emotions, people use different tactics to
deal with the feelings. If a person experiences uncertainty in a negative way and feels anxiety, he
will take actions to reduce it, which is in line with URT. Information seeking now will be a
typical behavior (Brashers, 2007). In the situation where uncertainty is evaluated positively,
people want to maintain it. For example, you want to hold some uncertainty about the girl you
are dating with if your friends tell you something negative about her. It is common that you may
want to intentionally avoid such information (Brashers, 2007). There is another situation that you
want to increase uncertainty. Suppose that you have some preliminary symptoms of HIV and you
are afraid it is true. You do not like the feeling of certainty that you do have HIV, so you engage
in information-seeking behaviors to reduce certainty. In other words, you want to hold some
uncertainty to give yourself hope (Brashers, 2007).
The Synthesis of Crisis-Induced Uncertainty
As discussed previous, uncertainty bears different meanings in different theories and
disciplines. As such, it is difficult to form a universally accepted definition. Just like crisis
communication theories that discuss both organizational strategies and audience, organizational
crises normally involve two parties: an organization and its audience. Both parties will generate
tremendous amounts of uncertainty during a crisis. An organization might feel uncertain about its
stakeholders’ reactions and available solving strategies. The stakeholders might feel uncertain
about the overall situation and their own safety. This dissertation focuses on uncertainty
experienced by an audience, while the discussion of uncertainty associated within organizations

31
is out of the scope. This study proposes a concept “crisis-induced uncertainty” to refer to
uncertainty experienced by stakeholders during a crisis. Drawing from definitions in risk and
interpersonal communication, crisis-induced uncertainty in this study is defined as stakeholders’
lack of confidence that their personal well-being and interactions with the organization will be
positive in both a short and long term.
In URT, Berger & Bradac (1982) proposed three types of uncertainty: self uncertainty,
partner uncertainty, and relationship uncertainty. This dissertation brings this categorization into
the crisis context. Self uncertainty here refers to stakeholders’ lack of confidence of how to
protect themselves from the harm inflicted by the crisis. No matter the crisis is about food
poisoning or data breach, the first reaction of stakeholders is to protect themselves. They are not
confident about what they should do to protect themselves from potential harms. This study
names this dimension as protection uncertainty. This study denotes partner uncertainty as
stakeholders’ lack of confidence that the organization is able to properly handle the crisis.
During a large-scale crisis like the BP oil spill, stakeholders concern about how the organization
involved will address the problem, how long it will take to solve the problem, and to what degree
the organization will actively communicate with stakeholders, etc. Generally, stakeholders
observe how the crisis evolves and what the organization will do. This study names this
dimension as process uncertainty. Relational uncertainty represents stakeholders’ lack of
confidence that their interaction with the organization can continue. Freeman’s (1984)
stakeholder theory explained the role of stakeholders in an organization’s operation. A
stakeholder is an important component of public relations practices (Grunig and Repper, 1992).
During a crisis, stakeholders might cast doubt on their relationship with the organization,
question the ability of the organization to deliver quality services or products, continue making

32
profits, be a responsible corporate citizen, etc. This study names this dimension as relationship
uncertainty in crisis communication.
In this definition of crisis-induced uncertainty, there are two features that contradict with
traditional wisdom. First, following the discussion of uncertainty in PIT and UMT, this definition
does not regard uncertainty as an inherently negative state. This assumption is against the
argument in risk communication. As argued by Brashers (2001), uncertainty is a state of human
being that cannot be avoided. Therefore, it is unnecessary to reduce uncertainty in every
situation. In the crisis context, organizations are required to bring stakeholders’ uncertainty back
to its pre-crisis level. In most circumstances, this process involves uncertainty reduction because
a crisis usually increases uncertainty among stakeholders. Second, simply rendering more
information does not guarantee the sound management of uncertainty. This argument complies
with Babrow’s (2007) idea in PIT. In a complex crisis which is described by technological terms
that ordinary people don’t understand (e.g. the Boeing 737 Max crisis), more information will
only confuse stakeholders even more, especially when the messages are not highly consistent
with each other.
This dissertation consulted uncertainty measurement in URT to propose the initial pool of
items. The earliest measurement of uncertainty for URT was Uncertainty Evaluation Scale
developed by Clatterbuck (1979) which contains seven items. Clatterbuck (1979) defined
uncertainty as people’s lack of confidence in predicting a partner’s attitudes and behaviors. Table
4 provides the scale. Parks and Adelman (1983) proposed an alternative scale to measure
uncertainty in romantic relationships but did not change the definition of uncertainty. Table 5
provides the scale.

33
Table 4: Clatterbuck (1979) Uncertainty Evaluation Scale
How confident are you of your general ability to predict how he/she will behave?
How certain are you that he/she likes you?
How accurate are you at predicting the values he/she holds?
How accurate are you at predicting his/her attitudes?
How well can you predict his/her feelings and emotions?
How much can you emphasize with the way he/she feels about himself/herself?
How well do you know him/her?
Table 5: Parks and Adelman’s (1983) Uncertainty Scale
I do not know my dating partner very well.
I am confident of my ability to accurately predict my dating partner’s behavior.
My dating partner often does or says things which surprise me.
I have a very good idea of what my dating partner’s values and preferences are
I often have trouble understanding why my dating partner does what he/she does
I can accurately predict what my dating partner’s attitudes are.
I can usually tell what my dating partner is feeling inside.
I can accurately predict how my dating partner will respond to me in most situations.
Knobloch and Solomon (1999) criticized that the previous scales are mainly measuring
partner uncertainty while generally neglecting self uncertainty and relational uncertainty
dimensions. They developed a comprehensive scale measuring all three dimensions. Self and
partner uncertainty each have three components: desire subscale, evaluation subscale, and goals
subscale. The two subscales are the same except that the wording is changed to indicate how
uncertain you think that your partner feels. Relational uncertainty is further divided into four
categories: behavioral norms subscale, mutuality subscale, definition subscale, and future
subscale. Table 6 provides the dimensions and items. In testing URT in an online environment,
Antheunis, Valkenburg, & Peter (2010) synthesized Clatterbuck’s (1979) scale and Kellerman
and Reynolds’ (1990) scale, proposing a five-item measurement: (1) I can predict very well how
this person will behave. (2) I can predict very well the things this person finds important. (3) I

34
can predict very well this person’s attitudes. (4) I can predict very well this person’s feelings and
emotions. (5) I understand this person well.
Table 6: Knobloch and Solomon’s Uncertainty Scale
Self-Uncertainty/Partner Uncertainty Scale
• Desire subscale
o How certain are you about how committed you are to the relationship?
o How certain are you about your feelings for your partner?
o How certain are you about how much you like your partner?
o How certain are you about how much you want this relationship right now?
o How certain are you about the relationship?
o How certain are you about how much you want to pursue this relationship?
o How certain are you about whether or not you are ready to commit to your
partner?
o How certain are you about whether you want a romantic relationship with your
partner or to be just friends?
• Evaluation Subscale
o How certain are you about how important this relationship is to you?
o How much are you romantically interested in your partner?
o How certain are you about how ready you are to get involved with your
partner?
o How certain are you about whether or not you want to maintain your
relationship?
o How certain are you about your view of this relationship?
• Goals Subscale
o How certain are you about whether or not you want this relationship to work
out in the long run?
o How certain are you about whether or not you want this relationship to last?
o How certain are you about whether or not you will want to be with your partner
in the long run?
o How certain are you about your goals for the future of the relationship?
o How certain are you about whether or not you want to stay in a relationship
with your partner?
o How certain are you about where you want this relationship to go?
Relational Uncertainty Scale
• Behavioral Norms Subscale
o How certain are you about what you can or cannot say to each other in this
relationship?
o How certain are you about the boundaries for appropriate and/or inappropriate
behavior in this relationship?
o How certain are you about the norms for this relationship?
o How certain are you about how you can or cannot behave around your partner?
• Mutuality Subscale
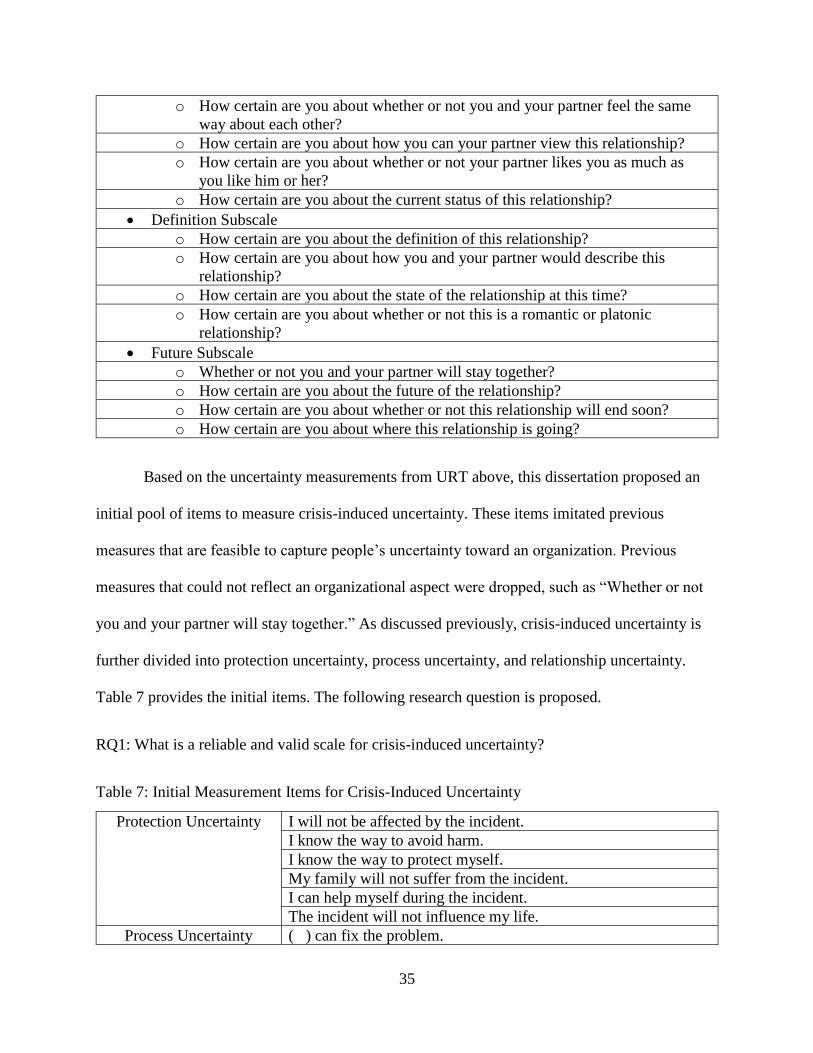
35
o How certain are you about whether or not you and your partner feel the same
way about each other?
o How certain are you about how you can your partner view this relationship?
o How certain are you about whether or not your partner likes you as much as
you like him or her?
o How certain are you about the current status of this relationship?
• Definition Subscale
o How certain are you about the definition of this relationship?
o How certain are you about how you and your partner would describe this
relationship?
o How certain are you about the state of the relationship at this time?
o How certain are you about whether or not this is a romantic or platonic
relationship?
• Future Subscale
o Whether or not you and your partner will stay together?
o How certain are you about the future of the relationship?
o How certain are you about whether or not this relationship will end soon?
o How certain are you about where this relationship is going?
Based on the uncertainty measurements from URT above, this dissertation proposed an
initial pool of items to measure crisis-induced uncertainty. These items imitated previous
measures that are feasible to capture people’s uncertainty toward an organization. Previous
measures that could not reflect an organizational aspect were dropped, such as “Whether or not
you and your partner will stay together.” As discussed previously, crisis-induced uncertainty is
further divided into protection uncertainty, process uncertainty, and relationship uncertainty.
Table 7 provides the initial items. The following research question is proposed.
RQ1: What is a reliable and valid scale for crisis-induced uncertainty?
Table 7: Initial Measurement Items for Crisis-Induced Uncertainty
Protection Uncertainty I will not be affected by the incident.
I know the way to avoid harm.
I know the way to protect myself.
My family will not suffer from the incident.
I can help myself during the incident.
The incident will not influence my life.
Process Uncertainty ( ) can fix the problem.
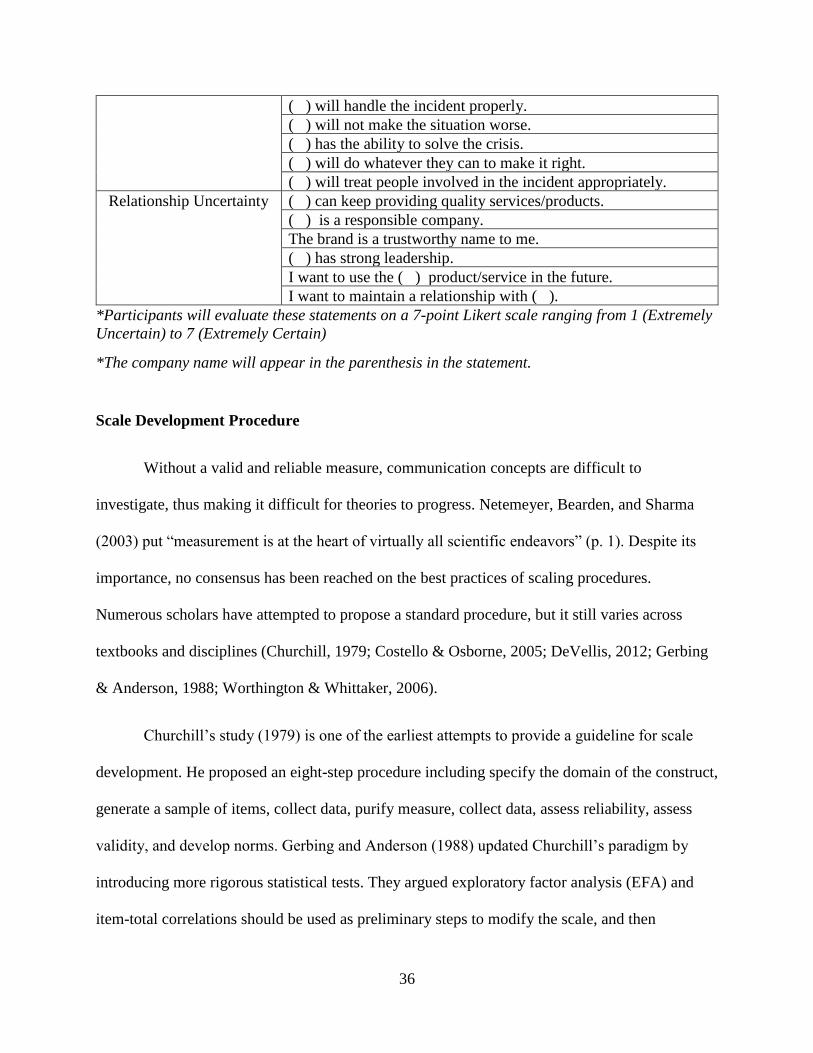
36
( ) will handle the incident properly.
( ) will not make the situation worse.
( ) has the ability to solve the crisis.
( ) will do whatever they can to make it right.
( ) will treat people involved in the incident appropriately.
Relationship Uncertainty ( ) can keep providing quality services/products.
( ) is a responsible company.
The brand is a trustworthy name to me.
( ) has strong leadership.
I want to use the ( ) product/service in the future.
I want to maintain a relationship with ( ).
*Participants will evaluate these statements on a 7-point Likert scale ranging from 1 (Extremely
Uncertain) to 7 (Extremely Certain)
*The company name will appear in the parenthesis in the statement.
Scale Development Procedure
Without a valid and reliable measure, communication concepts are difficult to
investigate, thus making it difficult for theories to progress. Netemeyer, Bearden, and Sharma
(2003) put “measurement is at the heart of virtually all scientific endeavors” (p. 1). Despite its
importance, no consensus has been reached on the best practices of scaling procedures.
Numerous scholars have attempted to propose a standard procedure, but it still varies across
textbooks and disciplines (Churchill, 1979; Costello & Osborne, 2005; DeVellis, 2012; Gerbing
& Anderson, 1988; Worthington & Whittaker, 2006).
Churchill’s study (1979) is one of the earliest attempts to provide a guideline for scale
development. He proposed an eight-step procedure including specify the domain of the construct,
generate a sample of items, collect data, purify measure, collect data, assess reliability, assess
validity, and develop norms. Gerbing and Anderson (1988) updated Churchill’s paradigm by
introducing more rigorous statistical tests. They argued exploratory factor analysis (EFA) and
item-total correlations should be used as preliminary steps to modify the scale, and then

37
confirmatory factor analysis (CFA) must be applied after to assess unidimensionality. Reliability
test is the last step to confirm the scale (Gerbing & Anderson, 1988). Netemeyer, Bearden, and
Sharma (2003) provided an alternative solution which condenses the process into four steps.
First, it is necessary to thoroughly review the literature and come up with a definition of a
construct. The second step involves generating measurement items and giving them an initial
assessment to confirm face and content validity. The third step asks researchers to test the
psychometric properties of a scale, including pilot testing and initial item analyses via EFA and
internal consistency. The last step is to finalize the scale through multiple samples. This step also
requires empirical tests including EFA, CFA, and internal consistency estimates. DeVellis (2012)
introduced a similar eight-step procedure: determine the concept, generate an item pool,
determine the format for measurement, let experts revise the item pool, include validation items,
administer items to a sample, evaluate the items, and optimize scale length.
This study primarily followed Churchill’s (1979) guide while adopting additional
recommendations from other best practices articles. The Churchill’s guideline was selected
because it has been widely cited by landmark scale development studies in public relations (e.g.
Huang, 2001; Meng & Berger, 2013). First, a theoretical definition of crisis-induced uncertainty
will be proposed based on a thorough review of the literature. Second, the study will generate a
pool of items which are adapted from previous studies. The items will be reviewed by experts
twice to ensure face and content validity. Third, the study will implement the first round of data
collection. Fourth, exploratory factor analysis (EFA) will be applied in this step to purify
measures. Fifth, the second round of data will be collected. Sixth, the study will use confirmatory
factor analysis (CFA) to check the internal structure of the scale. Reliability will be also
examined in this step. Seventh, the study will use the second dataset to evaluate discriminant and
38
convergent validity. Eighth, the study will have a full discussion of the new scale and provide its
implication for future research.
Organization-Public Relationships
The idea that relationship management should be the center of public relations practices
and research was first raised by Ferguson (1984). Since then, organization-public relationships
(OPR) became a focal concept in public relations literature and gradually formed a theory.
Several trend analyses documented that the number of studies focusing on OPR is constantly
increasing (Heath, 2001; Ki & Shin, 2006; Pasadeos, Berger, & Renfro, 2010). Sallot et al.
(2003) found OPR is the second most examined theory, after excellence theory, in public
relations research. The creation of OPR changed how people understand the field because public
relations practices were traditionally regarded as communication activities. In the framework of
OPR, communication becomes a strategic tool to reach the goal of relationship management
(Ledingham & Bruning, 1998).
Despite its popularity, Ki and Shin (2015) acknowledged the lack of a universally
accepted definition in research. Scholars broadly discuss and test OPR but there is no consensus
on its definition. Huang (1997) defined OPR as “the degree that the organization and its publics
trust one another, agree on one has rightful power to influence, experience satisfaction with each
other, and commit oneself to one another” (p. 61). Ledingham and Bruning (1998) tentatively
defined OPR as “the state which exists between an organization and its key publics in which the
actions of either entity impact the economic, social, political and/or cultural well-being of the
other entity” (p. 62). Ki and Shin (2015) demonstrated that OPR had been studied from different
perspectives such as antecedents, dimensions, and outcomes. When studied as antecedents,
scholars attempt to prove that OPR influences consumer-related concepts such as consumer

39
satisfaction (Bruning & Ledingham, 1998), brand attitude (Kim & Chan-Olmsted, 2005), donor
support (O’Neil, 2007), organizational reputation (Yang, 2005), and attitude and behavioral
intentions (Ki & Hon, 2007a).
Exploring the dimensions of OPR is another major line of research. Since OPR does not
have a commonly accepted definition, its measurements vary according to scholars’ perspectives.
Ledingham and Bruning (1998) proposed five dimensions including trust, openness,
involvement, investment, and commitment. Hon and Grunig (1999) displayed six dimensions:
control mutuality, trust, satisfaction, commitment, exchange relationship, and communal
relationship. Drawing from eastern culture, Huang (2001) enriched the list and presented five
dimensions: control mutuality, trust, relational satisfaction, relational commitment, and favor and
face. Ki and Hon (2007b) developed a scale containing four dimensions: control mutuality,
satisfaction, trust, and commitment. Besides the measurement for general OPR, scholars have
applied the measurements to specific contexts such as manufacturer-retailer relationships (Jo,
2006) and university relationships (Jo, Hon, & Brunner, 2005). Last, OPR has been studied as an
outcome. Scholars raised and tested communication strategies to cultivate OPR (Grunig &
Huang, 2000; Hon & Grunig, 1999; Ki & Hon, 2008; Seltzer & Zhang, 2010).
Crisis communication has been studied using an OPR perspective (Brown & White,
2010; Haigh & Dardis, 2012; Huang, 2008; Ki & Brown, 2013). From an organization’s aspect,
OPR aims to build and cultivate a favorable relationship with its key publics and hopes such
relationship will further change publics’ attitudes and behaviors (Ki & Hon, 2007a). A crisis, as a
negative event, hurts such relationship and changes the public’s views of the organization. When
explaining SCCT, Coombs and Holladay (2001) mentioned that relationship history influences
how publics see an organization during a crisis. This dissertation attempts to establish the

40
relationship between crisis-induced uncertainty and OPR based on two beliefs. First, OPR has a
strong connection with interpersonal communication (Ledingham, 2003; Ledingham & Bruning,
1998; Toth, 2000). Crisis-induced uncertainty, as just conceptualized above, originates from
interpersonal communication. Second, as found in URT research, reduced uncertainty usually
draws more intimate communication content (Berger & Calabrese, 1975). In romantic
relationships, people who experienced less uncertainty about their partners received more
support from the relationship and communicated more often with their partners. These positive
relational outcomes in interpersonal communication can be compared with OPR at an
organizational level.
The concept of OPR overall has been examined in the crisis literature. In testing SCCT,
Brown and White (2010) found that crisis responsibility has a negative relationship with post-
crisis OPR. Further, people with a positive relationship with an organization attribute less crisis
responsibility to the organization compared to people having a negative relationship with the
organization. To test OPR, this study considers the dimension proposed by Ki and Hon (2007b):
control mutuality, satisfaction, trust, and commitment.
Control mutuality
Control mutuality refers to “the degree to which parties agree on who has the rightful
power to influence one another” (Ki & Hon, 2007b, p. 422). Ki and Brown (2013) revealed that
control mutuality is positively related with crisis responsibility. In other words, the more people
blame an organization, the more they believe the organization and themselves could influence
each other. The finding failed to support the hypothesis and was counterintuitive. The authors
explained that the finding is caused by the setting of the experiment. The crisis scenario was a
university crisis and participants are college students. College students may blame a single

41
university crisis but are more likely to have a positive relationship with the school (Ki & Brown,
2013).
Satisfaction
Satisfaction denotes “the extent to which each party feels favorably toward the other
because positive expectations about the relationship are reinforced” (Ki & Hon, 2007b, p. 422).
Relational satisfaction has been studied both as an antecedent and an outcome of crisis
communication. Kim (2014) evidenced that a prior satisfactory relationship causes a less
negative violation valence. Ki and Brown (2013) indicated that increased crisis responsibility
causes higher satisfaction during a crisis. In an attempt to articulate the self-mocking strategy in
crisis communication, Kim, Zhang, and Zhang (2016) discovered that the self-mocking strategy
significantly increases customers’ satisfaction in an Alibaba crisis.
Trust
Trust is conceptualized as “one party’s level of confidence in and willingness to open
oneself to the other party” (Ki & Hon, 2007b, p. 422). Huang (2008) investigated the influence
of crisis communicative strategies (CCS) and the form of CCS on people’s perceptions of trust.
The results showed that individual CCS does not influence people’s feelings; rather, the form of
communication, such as timeliness and consistent tones, significantly predicts trust. Scholars
explored how the five image repair strategies in IRT impacts people’s perception of OPR. They
found that the reduce offensiveness strategy is more effective than the denial strategy in
maintaining people’s trust (Haigh & Brubaker, 2010; Haigh & Dardis, 2012). Ki and Brown
(2013) demonstrated that there is a positive relationship between crisis responsibility and trust.
Commitment

42
Commitment means “the extent to which each party believes and feels that the
relationship is worth spending energy to maintain and promote” (Ki & Hon, 2007b, p. 423).
Huang (2008) observed that the form of communication is more effective in maintaining
people’s commitment than crisis response strategies. Haigh and Brubaker (2010) found that
people who read the reduce offensiveness statement show higher commitment compared to those
who read the evade responsibility statement. The same finding was evidenced by Haigh and
Dardis (2012). Ki and Brown (2013) discovered the positive relationship between crisis
responsibility and commitment.
As mentioned previously, since uncertainty changes relationships in interpersonal
communication research, it makes sense to hypothesize such relationship exists at an
organizational level, which was hinted in one study. In routine business settings, Ni and Wang
(2011) showed that increased employee uncertainty decreases the degree of control mutuality but
does not influence satisfaction. To the best of the researcher’s knowledge, no study has yet
investigated how uncertainty alters the relationship between an organization and its publics
during a crisis. Although the interpersonal communication literature indicates a negative
relationship between uncertainty and relational outcomes, it is premature to conclude such
relationship is applicable to crisis communication. Therefore, the following research questions
are proposed.
RQ2: What is the association, if any, between stakeholders’ crisis-induced uncertainty and
control mutuality during an organizational crisis?
RQ3: What is the association, if any, between stakeholders’ crisis-induced uncertainty and
satisfaction during an organizational crisis?

43
RQ4: What is the association, if any, between stakeholders’ crisis-induced uncertainty and trust
during an organizational crisis?
RQ5: What is the association, if any, between stakeholders’ crisis-induced uncertainty and
commitment during an organizational crisis?
Information-Seeking Behaviors
Information seeking is a common human practice due to a lack of information. It begins
when someone feels his/her current knowledge is unable to solve a current problem and ends
when he/she no longer feels this way (Krikelas, 1983). Myers and Knox (2001) defined
information seeking as “the process by which individuals proactively acquire feedback through
the use of overt and monitoring strategies to understand, predict, and control their environments;
increase task mastery; and reduce role ambiguity” (p. 343). Krikelas (1983) proposed a four-step
model to understand the procedure of information seeking: (1) perceive a need, (2) search for
information, (3) find the information, and (4) use the information. Early information seeking
research explored the behaviors among scholars, and it did not start to investigate common
people until the 1980s (Weiler, 2004).
In the interpersonal communication domain, information-seeking behaviors have been
studied as an uncertainty reduction strategy. URT presents that increased uncertainty drives
information-seeking behaviors. It proposes three types of information-seeking strategies: passive
strategies, active strategies, and interactive strategies (Berger & Bradac, 1982; Berger &
Kellermann, 1994). Passive strategies refer to observing the interactant from a distance. Active
strategies represent that an individual actively obtains information without directly interacting
with the target person. One example might be an individual asks the target person’s friend for
44
information. Interactive strategies mean that an individual directly talks with the target person to
acquire more information. Health communication visits information seeking as well. Rutten,
Squiers, and Hesse (2006) maintain that information-seeking behaviors are critical to cope with
cancer disease, reduce stress, and build social support. Brasher, Goldsmith, and Hsieh (2002)
demonstrated that information seeking and avoiding can be used to increase or decrease health-
related uncertainty.
In crisis communication, information seeking is studied as a behavior after the outbreak
of a crisis (Avery, 2010; Kim, 2016; Kim & Niederdeppe, 2013). In line with Krikelas’ (1983)
argument that information-seeking behaviors arise when knowledge is not enough to solve a
problem, a crisis creates a unique situation that stakeholders have a difficult time to interpret the
incident. Therefore, stakeholders actively seek information to understand the situation. Austin, et
al. (2012) found that social media use increases after a crisis, and people tend to seek more
information online when they heard about the crisis online. Similar to URT, crisis
communication also connects information-seeking behaviors with uncertainty. Spence, Lachlan,
and Burke (2007) proposed that individuals feel a high level of uncertainty after a crisis and the
feeling further motivates them to seek information. People attempt to update their knowledge to
understand the situation. Kim (2016) contended that communicative behaviors (information
seeking and sharing) via social media help people reduce uncertainty, maintain support, and
achieve expressive communication goals during a crisis. In a personal interview study, Vigsø and
Odén (2016) concluded that people usually ask a question after a crisis: Is this or is this not
dangerous? Uncertainty about the potential danger drives their motivation for information
seeking. Although various arguments about the relationship between uncertainty and information
seeking exist in the crisis literature, there is no empirical evidence so far to facilitate these

45
opinions. This study, specifically, looks at people’s willingness to seek information about a
crisis. In order to empirically investigate the relationship between uncertainty and information
seeking, the following hypothesis is proposed.
H1: During a crisis, as stakeholders’ crisis-induced uncertainty increases, their information-
seeking behaviors increase accordingly.

46
CHAPTER 3: METHOD
Study 1
Study 1 answered the first research question which explores a valid and reliable
measurement for crisis-induced uncertainty. The scale development process generally followed
Churchill’s (1979) guideline while adding new statistical tests suggested by later statistics
papers. Since the construct had already been defined and the initial items had been proposed, the
following steps were followed: item evaluations, EFA, CFA, and validity and reliability
assessment. As shown in Table 7, the initial crisis-induced uncertainty contained three
dimensions and 18 items. Research participants were asked to evaluate the items based on a 7-
point Likert scale ranging from 1 (Extremely Uncertain) to 7 (Extremely Certain).
Face and content validity
After the first step of proposing items, the next step was to evaluate wording clarity,
wording redundancy, choice of response format, as well as face and content validity. Netemeyer,
et al. (2003) argued that the achievement of good face and content validity not only relies on how
accurately a construct is defined, but also how much experts agree on the dimensions and
measurement items. They further listed several threats to content validity: (a) items representing
dimensions that are not discussed in the construct, (b) items reflecting dimensions outside the
construct, and (c) the items are difficult for the target audience. Churchill (1979) stated that
organizing a focus group is a tool to evaluate initial items. Using a specific situation or case,
researchers could discuss the items with a group of people. Netemeyer et al. (2003)

47
recommended asking five or more experts to thoroughly evaluate whether items represent the
construct.
In study 1, the researcher decided to adopt a two-step procedure to assess the initial
dimensions and items. First, a focus group was conducted among five doctoral students with
expertise in mass communication. The main purpose was to assess the readability and clarity of
the items. Items that did not reflect the dimensions that they were intended to capture were
removed, and items that had clarity issues were reworded. Second, the scale was sent to 10 crisis
communication scholars and researchers who are familiar with the concept of uncertainty. Using
Lawshe’s (1975) content validity ratio (CVR) method, experts were first asked to evaluate the
necessity of the three dimensions and if the three proposed dimensions reflect the meaning of
crisis-induced uncertainty based on three standards, essential, useful but not essential, and not
necessary. The ratio was computed by the following formula. n represents the number of experts
indicating that an item (dimension) is essential. N stands for the number of experts in the panel
(Lawshe, 1975). Since 10 experts were invited, the ratio must pass the cutoff of .62 (Lawshe,
1975). Some items did not pass the cutoff and more detailed information will be provided in the
result section. The scale was further revised based on the focus group discussion and expert
evaluation. Appendix 1 provides the CRV questionnaire.
𝐶𝑉𝑅 =𝑛 −
𝑁2
𝑁2
Procedure
After reaching ideal face and content validity, the study continued to collect data and
apply more rigorous statistical analyses to evaluate validity. Two crisis scenarios were adopted to

48
stimulate research participants: the Facebook data breach in 2018 and the United Airlines
passenger removal incident in 2017. The two crises were well-known to the public.
In 2018, it was revealed that Cambridge Analytica, a British political consulting
company, had harvested 87 million Facebook profiles around the world. Facebook noticed the
company’s misconduct back in 2015 but failed to warn its users. Among the 87 million breached
data, 70 million users were from the US. Cambridge Analytica used the data to build a program
to predict and influence voters. In 2017, several passengers on a United Airlines flight recorded
an incident and posted on social media. In the video, a man was dragged down the aisle by
security officers and removed from the flight. Later, it was found that United asked passengers to
voluntarily give up their seats for compensation in order to make room for four crew members.
They randomly removed four passengers when no one volunteered. Three passengers left the
flight while one passenger refused to do so, making him forcibly dragged out of the plane.
An online survey was set up via Qualtrics and distributed through Amazon Mechanical
Turk (MTurk) after IRB approval. It took participants around 10-15 minutes to finish the survey.
Once getting their informed consent, the first question was displayed to the participants, “Which
of the following incident are you more familiar with?” Two options were available to them, the
Facebook data breach and the United Airlines passenger removal incident. They were directed to
a short paragraph describing the Facebook case if they chose the first option. When they chose
the second option, the United Airlines story was shown to them. Appendix 2 provides the two
statements.
The purpose of setting up two scenarios has two folds. First, participants’ familiarity with
the crisis should be controlled. A participant who was familiar to the Facebook case might show
a different feeling of uncertainty compared to a participant who knew nothing about the crisis.

49
The researcher asked participants to select the case they knew better in order to make people in
that group have relatively similar familiarity. Second, the scale couldn’t be generalizable if it was
only applied to one scenario. The researcher hoped to validate the scale in two different types of
crises and companies. After reading the scenario, all participants were asked to evaluate how
uncertain they feel about crisis-induced uncertainty items based on a 7-point Likert scale,
ranging from 1 (Strongly Uncertain) to 7 (Strongly Certain).
Use of Amazon Mechanical Turk data
This study used MTurk for data collection in order to get more representative samples
because it is believed that MTurk data could be regarded as a representation of US Internet users
(Mason & Suri, 2012). Although the use of MTurk data has received some critiques (Goodman,
Cryder, & Cheema, 2013), Buhrmester, Kwang, and Gosling (2011) revealed that Mtruk
participants are slightly more diverse than other Internet samples and significantly more diverse
than student samples. Thus, MTurk can be used to gather high-quality data. In the
communication domain, Kees, Berry, Burton, and Sheehan (2017) compared MTurk data with
professional panel samples and student samples in an advertising experiment. They found the
quality of MTurk data is better than the two sets of professional panel data and as reliable as the
two sets of student data (Kees et al., 2017). With all the studies supporting the use of MTurk, the
dissertation regards MTurk as a reliable source of high-quality data.
Sample 1
The study implemented data collections twice on MTurk and produced two datasets. For
the first rounds of data collection, the study used the scale with 18 items. The researcher applied
50
EFA to the first sample. The second rounds of data collection repeated the same procedure of the
first data collection except that several items were removed in EFA.
Following Kee et al.’s (2017) suggestion, the collection of sample 1 was finished in three
days to diversify participants. Each participant was rewarded 50 cents for their work. A total
number of 367 participants finished the questionnaire. An attention check question, “In order to
prove you are paying attention, please select number 16,” was asked at the end of the
questionnaire. Nineteen participants failed to pass the attention check question and seven
participants did not finish the questionnaire. Therefore, the final sample size was 341 after the
removal of the 26 invalid responses. Since the initial scale contained 18 items, the first dataset
had a sample-to-item ratio of 18.9. In the sample, the majority of the participants selected the
Facebook case (n = 265) while 76 participants were more familiar with the United Airlines case.
Gender were balanced with male occupying 50.4% (n = 172) while 48.4% were female (n =
165). The dataset contained 4 missing values and another one participant prefer not to answer the
question. The mean age was 31.89 ranging from 18 to 71.
In terms of racial makeup, the majority of participants were Caucasian (42.2%, n = 144)
and Asian/Pacific Islander (41.6%, n = 142), followed by African American (7.6%, n = 26),
Hispanic/Latino (6.5%, n = 22), Native American (1.8%, n = 6), and Others (2.6%, n = 9). In
terms of education, more than half of the participants held a bachelor’s degree (59.4%, n = 203),
followed by a high school diploma (18.7%, n = 64), a master’s degree (18.4%, n = 63), others
(1.2%, n = 4), a doctorate (.9%, n = 3), and less than a high school diploma (.3%, n = 1).
Regarding income level, 23.7% had an annual household income less than $25,000 (n = 81),
followed by $25,000-$34,999 (19%, n = 65), $35,000-$49,999 (18.7%, n = 64), $50,000-$74,999

51
(17.3%, n = 59), $75,000-$99,999 (12.3%, n = 42), $100,000-$149,999 (5.6%, n = 19), and
$150,000 and more (2.3%, n = 8).
Sample 2
The second data collection was also finished in three days as well. A total number of 303
participants completed the questionnaire. Six participants failed to pass the attention check
question and three more participants did not finish the questionnaire. Therefore, the total valid
sample size was 294, and it had a sample-to-item ratio of 24.5. In this sample, 246 participants
selected the Facebook case, while only 48 participants selected the United Airlines case. Male
occupied 57.5% (n = 169) of the sample, while 42.4% were female (n = 124). One participant did
not reveal the gender information. The mean age was 31.38 years old, ranging from 18 to 70.
The majority of participants were Asian/Pacific Islander (46.3%, n = 138), followed by
Caucasian (38.1%, n = 112), African American (7.8%, n = 23), Latino/Hispanic (5.4%, n = 16),
Native American (3.7%, n = 11), and Others (5.1%, n = 15).
Regarding education, 67% participants held a bachelor’s degree (n = 197), followed by a
master’s degree (15%, n = 44), a high school diploma (15%, n = 44), others (1.7%, n = 5),
doctorate (1%, n = 3), and less than a high school diploma (.3%, n = 1). In terms of income level,
26.5% had an annual household between $50,000 and $74,999 (n = 78), followed by $25,000-
$34,999 (19.7%, n = 58), less than $25,000 (19%, n = 56), $35,000-$49,999 (16.3%, n = 48),
$75,000-$99,999 (11.2%, n = 33), $100,000-$149,999 (5.4%, n = 16), and $150,000 and more
(1.7%, n = 5).
Statistical analysis

52
To validate the proposed scale, the researcher performed several statistical analyses,
including descriptive statistics, reliability analysis, EFA, and CFA. CFA was executed using
AMOS 24, and all other analyses were performed on SPSS 21.
Study 2
The second data collection was performed using a survey to answer RQ2, RQ3, RQ4,
RQ5 and test H1 as iterated below. These research questions and hypothesis were analyzed
through two research models. Figure 1 and 2 visualize the proposed models.
RQ2: What is the association, if any, between stakeholders’ crisis-induced uncertainty and
control mutuality during an organizational crisis?
RQ3: What is the association, if any, between stakeholders’ crisis-induced uncertainty and
satisfaction during an organizational crisis?
RQ4: What is the association, if any, between stakeholders’ crisis-induced uncertainty and trust
during an organizational crisis?
RQ5: What is the association, if any, between stakeholders’ crisis-induced uncertainty and
commitment during an organizational crisis?
H1: During a crisis, as stakeholders’ crisis-induced uncertainty increases, their information-
seeking behaviors increase accordingly.
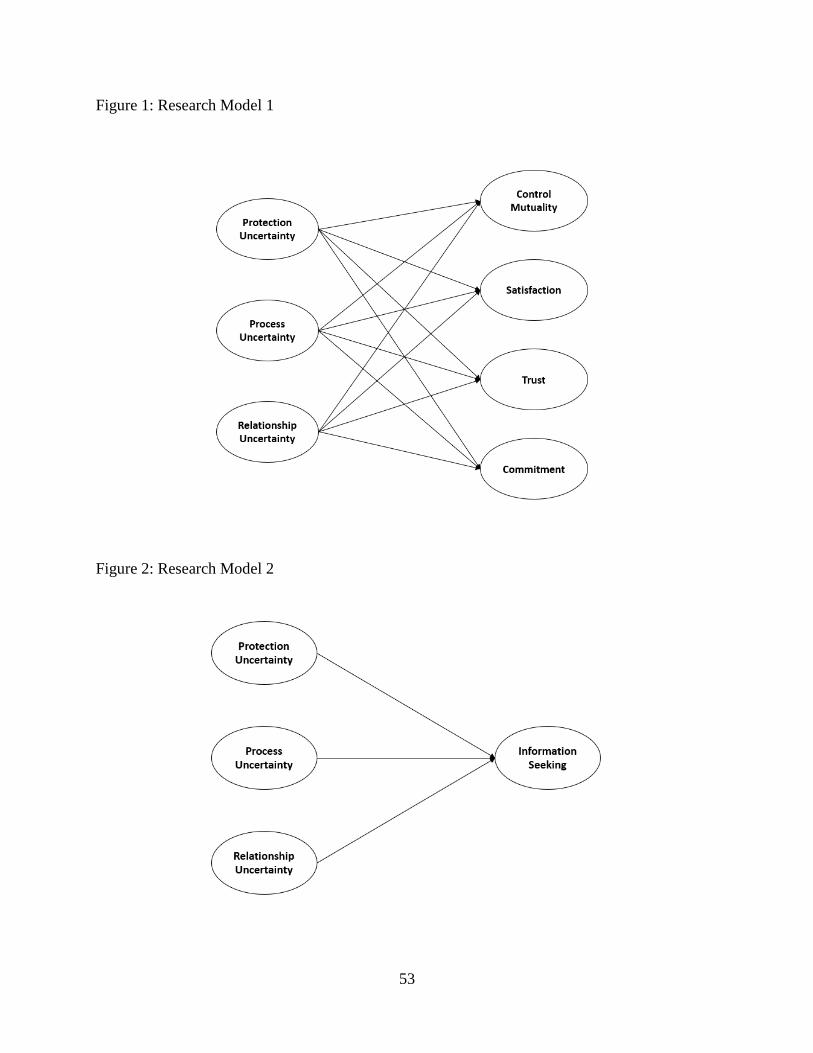
53
Figure 1: Research Model 1
Figure 2: Research Model 2

54
Procedure
The researcher wrote a news article describing a food poisoning crisis in Georgia. Fifteen
people who dined at a local Nothing But Beef restaurant were infected with E. coli virus. All
victims were hospitalized and in stable condition. The CDC reported that it is still unclear what
caused the E. coli outbreak. Nothing But Beef stated that it is cooperating with the local public
health officials to identify the source. Appendix 3 provides the news article. All information
appeared in the news article were fictitious, including the crisis, the restaurant, the spokesman’s
name, and the CEO’s name.
The study selected a fictitious crisis and company to exclude subjects’ prior knowledge
and perceptions about the business. Participants would hold a certain attitude if the study used a
real company and crisis. In that situation, the relationship found between crisis-induced
uncertainty and organization-public relationships (OPR) would be contaminated by a pre-
existing attitude. Right after getting participants’ informed consent, they were asked to read the
news article. After reading the article, the participants were asked to evaluate their crisis-induced
uncertainty based on a 7-point Likert scale, ranging from 1 (Strongly Uncertain) to 7 (Strongly
Certain), and OPR and information-seeking behaviors also based on a 7-point Likert scale,
ranging from 1 (Strongly Disagree) to 7 (Strongly Agree).
Sample
Study 2 recruited a total number of 352 participants from MTurk. Four participants’
responses were removed because they failed to pass the attention check question. An additional
24 responses were deleted because their answers were not complete. A number of 324 responses
were left for further analysis. In the sample, there were 188 males (58%) and 131 females

55
(40.4%). Another three participants did not disclose their gender information. The mean age was
37.06 years old, ranging from 18 to 73. Caucasian was the dominant ethnicity (71.9%, n = 233),
followed by African American (9.6%, n = 31), Hispanic/Latino (9.3%, n = 30), Asian/Pacific
Islander (6.2%, n = 20), Native American (4.6%, n = 15) and others (.9%, n = 3).
About half of the participants had a bachelor’s degree (48.8%, n = 158), followed by a
high school diploma (18.2%, n = 59), an associate degree (13.9%, n = 45), a master’s degree
(13.6%, n = 44), a doctoral degree (4.3%, n = 14), and others (.9%, n = 3). One participant did
not reveal his/her education information. Regarding the annual household income, about one
quarter participants received $35,000-$49,000 (23.5%, n = 76), followed by $50,000-$74,999
(21.6%, n = 70), $25,000-$34,999 (14.8%, n = 48), $75,000-$99,999 (14.5%, n = 47), less than
$25,000 (13.9%, n = 45), $100,000-$149,999 (7.7%, n = 25), $150,000 or more (3.7%, n = 12).
Measurement
Crisis-induced uncertainty
Crisis-induced uncertainty was measured by the newly developed scale. Crisis-induced
uncertainty was operationalized as people’s feeling of uncertainty about the current situation and
future relationship with the company. The scale included items, such as “I will not be affected by
the incident,” and “I want to maintain a relationship with Nothing But Beef.” All items were
reversely coded after the data collection. A higher score on an item indicated a higher level of
uncertainty. EFA and reliability analysis were applied to evaluate the validity and reliability of
the scale. For the protection uncertainty subscale, the principal axis factoring extraction method
with no rotation was used. Three items loaded on a single factor with factor loadings of .87, .93,
and .84, indicating good construct validity. The subscale also reached ideal reliability (M = 5.16,

56
SD = 1.51, α = .91). For the process uncertainty subscale, the above steps were repeated. Five
items loaded on a single factor with factor loadings of .80, .84, .88, .79, and .67, showing good
construct validity. The reliability test also proved a good measure (M = 4.85, SD = 1.24, α
= .90). For the relationship uncertainty subscale, three items loaded on one factor with factor
loadings of .73, .93, and .94. The subscale also showed good reliability (M = 3.63, SD = 1.59, α
= .90).
OPR
The measurement of the four dimensions of OPR was adapted from the scale created by
Ki and Hon (2007b). Control mutuality, satisfaction, trust, and commitment were operationalized
as people’s agreement on the OPR scale. The control mutuality scale contained seven items, such
as “The company believes the opinions of members are legitimate.” The satisfaction scale
contained seven items, such as “Both the company and member benefit from their relationship.”
The trust scale contained seven items, such as “The company treats members fairly and justly.”
The commitment scale contained five items, such as “The company is trying to maintain a long-
term commitment to members.” Table 8 provides the OPR scale. All items were measured on a
7-point Likert scale ranging from “strongly disagree” to “strongly agree.”
EFA and reliability analysis were applied to each subscale. For control mutuality, the
seven items loaded on two factors. In detail, Item 2, 3, 5 loaded on one factor while the rest four
items loaded on the other factor. The researcher conducted EFA on two groups of items and they
loaded on only one factor separately. A further examination of factor loadings illustrated that the
group with three items had higher factors loadings compared to the other group (.82, .80, .87).
Therefore, the researcher decided to remove the four items in the other group. A further
reliability analysis showed ideal outcomes (M = 4.32, SD = 1.37, α = .87).

57
For the satisfaction dimension, eight items again loaded on two factors. Four items
loaded on one factor and four items loaded on the other factor. Two EFA were applied to the two
groups of items and the group with item 1, 3, 5, 7 showed better factor loadings
(.70, .83, .81, .81), therefore, item 2, 4, 6, 8 were deleted. The 4-item subscale demonstrated
good reliability (M = 4.39, SD = 1.21, α = .87).
For the trust subscale, seven items loaded on one factor and only one item loaded on the
other factor. Reliability analysis indicated Cronbach’s alpha greatly increased if the one item was
removed. Therefore, the item was deleted. EFA results showed good factor loadings
(.77, .75, .84, .79, .78, .80). The subscale also showed ideal reliability (M = 4.56, SD = 1.13, α
= .91).
For the last dimension of OPR, the five items loaded on two factors. Two items loaded on
the first factor while the rest three loaded on the second factor. For the purpose of reliability, the
researcher decided to keep the three-item scale. EFA was applied and factor loadings were ideal
(.74, .87, .84). Reliability result was also acceptable (M = 4.34, SD = 1.24, α = .85).
Nearly half of the OPR items were deleted to increase validity and reliability. One
possible reason was that a lot of items were reversely asked so that participants got confused.
After measure purification, the OPR scale had a total number of 16 items (control mutuality: 3;
satisfaction: 4; trust: 6; commitment: 3).
Table 8: Organization-Public Relationship Scale
Control Mutuality
( ) believes the opinions of members are legitimate.
( ) neglects members. I
When dealing with members, ( ) has a tendency to throw its weight
around. I
( ) really listens to what members have to say.

58
( ) seems to ignore members’ opinions in the decisions that affect
members. I
When members interact with ( ), member feel that they have some sense
of control.
( ) cooperates with members.
Satisfaction
Both ( ) and member benefit from their relationship.
Members are dissatisfied with their interaction with ( ). I
Members are happy with ( ).
Generally speaking, members are unhappy with the relationship ( ) has
established with them.
Members enjoy dealing with ( ).
( ) fails to satisfy members’ needs. I
Members feel they are important to the company.
In general, nothing of value has been accomplished by ( ) for members. I
Trust
( ) treats members fairly and justly.
Whenever the company makes an important decision, members know ( )
will consider the decision’s impact on members.
( ) can be relied on to keep its promises to members.
( ) takes the opinions of members into account when making decisions.
Members feel very confident about ( ) abilities.
Sound principles guide ( ) behaviors.
( ) misleads members. I
Commitment
( ) is trying to maintain a long-term commitment to members.
( ) wants to maintain a positive relationship with members.
Compared to other companies, members value their relationship with ( )
the most.
Members would rather work with ( ) than without it.
Members feel a sense of loyalty to ( ).
*The parentheses are replaced with the company name in the statement.
Information-seeking behaviors
Information-seeking behaviors scale was adapted from information seeking scale
proposed by Kim (2016). The variable was operationalized as people’s willingness to find
information through different channels. A sample item was displayed here “I am willing to talk
to people to see how to protect myself.” Table 9 provides the five adapted items. All items were
measured based on a 7-point Likert scale ranging from “strongly disagree” to “strongly agree.”
To ensure validity and reliability of the measure, EFA and reliability analysis were employed.

59
The five items loaded on a single factor with factor loadings of .65, .82, .85, .76, and .76.
Although the first item had a slightly small loading compared to the standard of .70, it was close
to the standard. Therefore, the researcher decided to keep the item. The five-item scale also
demonstrated good reliability (M = 4.95, SD = 1.24, α = .88).
Table 9: Information Seeking-Behavior Scale
I am willing to talk to people to see how to protect myself.
I am willing to visit websites relevant to this crisis.
I am willing to check to see if there is any new information about this crisis on the Internet.
I would request information about this crisis.
I actively search for information on this topic.
Statistical analysis
Using AMOS 24, the study employed Structural Equation Modeling (SEM) to test the
proposed models. This study followed Anderson and Gerbing’s (1988) two-step modeling for
model identification. The first step was to respecify the research model as a CFA measurement
model. This step aimed to find an adequate measurement model. After achieving an acceptable
measurement model, the second step was to test the structural model and compare the model
with alternative models. This step would confirm the final model.

60
CHAPTER 4: RESULTS
Study 1
Face and content validity
A focus group was conducted among five doctoral students and lasted around 30 minutes.
Items that did not reflect the dimensions were removed, and items that had clarity issues were
reworded. For example, the fourth item of process uncertainty “( ) puts my interest first” was
replaced by “( ) has the ability to solve the crisis.” The fifth item of relationship uncertainty “I
want to buy the ( )’s products/services in the future” was reworded as “I want to use ( )’s
products/services in the future.”
The researcher sent the revised scale to 10 crisis communication scholars. All scholars
indicated that the three proposed dimensions were essential to crisis-induced uncertainty so that
the ratio equaled one. Therefore, the three dimensions were confirmed by scholars. Then, experts
were further asked to assess if the items under each dimension reflected the dimension that they
were intended to measure. In the protection uncertainty dimension, three items did not pass the
cutoff, “I know the way to avoid harm,” “I know the way to protect myself,” “I can help myself
during the incident.” One of the experts mentioned that “I know” and “I can do” are two different
things. Another expert recommended adding statements about how an organization could help
protect stakeholders. Therefore, the three statements were reworded as “( ) will provide
information to help me avoid harm,” “( ) will help me protect myself,” and “( ) will tell me
what to do.” For the process uncertainty dimension, the statement “( ) will not make the

61
situation worse” did not pass the cutoff. Several experts pointed out this statement is double
negative. Therefore, the statement was reworded as “( ) can make the situation better.”
The dimension, relationship uncertainty, reached the least agreement. Four items did not
pass the cutoff. Most of the experts questioned if the items really measure relationships.
Therefore, the statement “( ) can keep providing quality services/products” was replaced by “I
expect the ( ) to keep providing quality services/products.” “( ) is a responsible company” was
reworded as “( ) is a responsible company that I can trust.” “The brand is a trustworthy name to
me” was substituted by “( ) is a trustworthy brand to build a relationship with.” “( ) has strong
leadership” was changed to “I still value my relationship with ( ).” Table 10 provides the scale
items after the face and content validity assessment.
Table 10: Measurement Items for Crisis-Induced Uncertainty after Expert Evaluation
Protection Uncertainty I will not be affected by the incident.
( ) will provide information to help me avoid harm.
( ) will help me protect myself.
My family will not suffer from the incident.
( ) will tell me what to do.
The incident will not influence my life.
Process Uncertainty ( ) can fix the problem.
( ) will handle the incident properly.
( ) will make the situation better.
( ) has the ability to solve the crisis.
( ) will do whatever they can to make it right.
( ) will treat people involved in the incident appropriately.
Relationship Uncertainty I expect ( ) to keep providing quality services/products.
( ) is a responsible company that I can trust.
( ) is a trustworthy brand to build a relationship with.
I still value my relationship with ( ).
I want to use the ( ) products/services in the future.
I want to maintain a relationship with ( ).
*Participants will evaluate these statements on a 7-point Likert scale ranging from 1 (Extremely
Uncertain) to 7 (Extremely Certain)
*The company name will appear in the parenthesis in the statement.

62
Assessing the correlation matrix
Before running EFA, the factorability of the correlation matrix was first assessed via
three tests: (1) Bartlett’s Test of Sphericity, (2) Kaiser-Meyer-Olkin (KMO) Test, and (3)
Individual Measures of Sampling Adequacy (MSA). EFA would ensue if the Facebook, the
United Airlines, and the combined datasets passed the tests.
Bartlett’s Test of Sphericity tests the null hypothesis that the correlation matrix is an
identity matrix. A larger value indicates a bigger chance that the matrix is not an identity matrix,
which rejects the null hypothesis (Bartlett, 1950). For the Facebook case, Bartlett’s Test of
Sphericity was 4593.96 with a p-value of .00. For the United Airlines case, Bartlett’s Test of
Sphericity was 1495.87 with a p-value of .00. When the two datasets were combined, the overall
Bartlett’s Test of Sphericity was 6077.31 with a p-value of .00. Therefore, the scale passed the
first test.
KMO test evaluates if a dataset can be used for factor analysis. A value above .8 can be
regarded as meritorious and a value above .90 is marvelous (Kaiser, 1974). The Facebook case
had a KMO value of .95 and the United Airlines case was .90, indicating a good factorability.
When the two datasets were combined, KMO was .96.
MSA represents how strongly an individual item is correlated with other items in a
matrix. A value above .70 normally indicates a good factorability (Dziuban & Shirkey, 1974).
The MSA ranged from .90 to .97 in the Facebook case, and from .84 to .93 in the United Airlines
case. The MSA ranged from .90 to .97 when the two datasets were combined. Therefore, the two
cases were ideal for further factor analysis.
Exploratory factor analysis

63
The first step in conducting EFA is to determine the factor extraction method. Principal
component analysis (PCA) and common factor analysis are two popular factor extraction
methods. Kline (1994) categorized three sources of variance among items: common variance,
specific variance, and error variance during EFA. PCA considers all three variances and assumes
all components are orthogonal which means they are not correlated with each other. Common
factor analysis differentiates common variance from specific and error variance and assumes
factors are correlated with each other (Kline, 1994). This study assumed three types of
uncertainty are correlated with each other, thus, this study selected the Principal Axis Factoring
(PAF) extraction method, a type of common factor analysis.
The second step is to determine the number of factors to retain. This study considered the
following standards to make the decision: (1) eigenvalues larger than 1, (2) scree plot, and (3)
scree plot with a parallel analysis (Netemeyer, et al., 2003). For the Facebook dataset, two
factors were extracted based on the rule of eigenvalues larger than 1. The first factor accounted
for 61.97% of total variance. The second factor accounted for 5.68% of total variance. For the
United Airlines dataset, three factors were extracted. The first factor accounted for 61.94% of
total variance, the second accounted for 9.15%, and the third accounted for 6.06%. The
combined dataset indicated a two-factor solution based on this standard. The first factor
accounted for 63.09% of total variance and the second accounted for 8.62%. Nevertheless, this
standard received some critiques for its accuracy. Kaiser (1960) suggested this rule applies to
PCA, and strictly, not to common factor analysis. Cliff (1988) showed the rule of eigenvalues
larger than 1 should be best used as a guide rather than an absolute criterion. Therefore, the scree
plots were examined. For the Facebook case, two factors should be retained based on the scree
plot. For the United Airlines case, three factors should be retained. The combined dataset

64
illuminated a two-factor solution as well. However, the interpretation of the scree plots deserves
further consideration. The scree plot method is particularly designed for PCA. For common
factor analysis, two or more factors near the elbow should be further investigated (Netemeyer, et
al., 2003). Thus, the third criterion, scree plot with a parallel analysis were applied. The
Facebook data suggested three factors should be retained because the raw data eigenvalues of the
first three factors were larger than the random data eigenvalues (O’Conners, 2000). The United
Airlines data suggested two factors should be retained. The combined data suggested a four-
factor solution based on a parallel analysis. Based on the previous results, the author decided to
retain three factors for further interpretation. Table 11 provides the parallel analysis results.
Table 11: Parallel Analysis Results
Facebook United Airlines Combined
Raw Random Raw Random Raw Random
Factor 1 11.17 .68 10.90 1.41 11.10 .57
Factor 2 .99 .54 1.41 1.18 1.14 .46
Factor 3 .50 .44 .89 .98 .49 .38
Factor 4 .35 .38 .58 .83 .41 .32
The third step in EFA is to decide the factor rotation method. In order to make factors
more interpretable and each item has a major loading on only one factor, factors are often rotated
after extraction (Netemeyer et al., 2003). Two types of rotation methods are frequently applied:
orthogonal and oblique. While orthogonal rotations assume no correlation among factors,
oblique rotations assume there is some correlation among two or more factors being rotated. In
this study, the three dimensions of uncertainty were related, thus, the oblique rotation method,
specifically, Promax, was applied. Regarding item deletion and retention criteria, many scholars
recommend different cutoffs (Costello & Osborne, 2005; Hair, Black, Babin, & Anderson, 2010;
Netemeyer et al., 2003). However, these criteria are based more on experience than theory. For

65
example, Netemeyer et al. (2003) advocated keeping items that have loadings greater than .40
but less than .90. Hair et al. (2010) regarded item loadings less than .30 as weak loadings. To
encourage parsimony, this study decided to retain items based on three criteria: (1) The item
must have a loading of .40 or above on the primary factor. (2) The item must have a loading less
than .40 on the secondary factor. (3) the difference in the loadings between the primary factor
and the secondary factor must be at least .40. Items that loaded on multiple factors or had small
loadings were removed from the scale.
Three rounds of EFA were performed using the Facebook data, the United Airlines data,
and the combined data. Item 2, 3, 5 under protection uncertainty dimension produced mixed
loadings that are hard to interpret. Item 1, 2, 3 under relationship uncertainty dimension seriously
loaded on multiple factors. Therefore, the six items were deleted. Table 12 provides the factor
loadings across the three datasets.
Table 12: Principal Axis Factoring with Promax Rotation Factor Loadings
Facebook United Airlines Combined
1 2 3 1 2 3 1 2 3
I will not be affected by the incident.
.02 -.12 .70 .01 -.02 .90 .04 -.09 .72
( ) will provide information to help
me avoid harm.
.43 .17 .33 .09 .80 .06 .56 .15 .23
( ) will help me protect myself.
.45 .20 .31 -.01 .97 -.05 .61 .17 .23
My family will not suffer from the
incident.
-.08 .09 .84 .02 .06 .71 -.00 .06 .80
( ) will tell me what to do.
.49 .11 .27 -.10 .82 -.02 .63 .05 .14
The incident will not influence my
life.
.00 .02 .72 -.08 -.03 .97 -.02 .05 .78
( ) can fix the problem.
.93 -.17 .11 .29 .39 .10 .93 -.16 .06
( ) will handle the incident
properly.
.85 -.02 .06 .11 .80 .02 .91 -.03 .00
( ) will make the situation better. .74 .13 .07 .30 .65 -.01 .82 .10 .01

66
( ) has the ability to solve the crisis.
.72 -.02 -.03 .51 .09 -.07 .61 -.01 .04
( ) will do whatever they can to
make it right.
.82 .13 -.09 .68 .19 .05 .76 .20 -.09
( ) will treat people involved in the
incident appropriately.
.83 .16 -.12 .70 .19 -.01 .73 .26 -.11
I expect ( ) to keep providing
quality services/products.
.52 .47 -.15 .87 -.12 .07 .44 .47 -.07
( ) is a responsible company that I
can trust.
.51 .46 -.05 .92 -.03 .08 .47 .49 -.03
( ) is a trustworthy brand to build a
relationship with.
.43 .51 -.02 .87 .05 .03 .40 .55 -.02
I still value my relationship with
( ).
.23 .66 -.00 .73 .16 .09 .24 .64 .06
I want to use the ( )
products/services in the future.
-.09 .97 -.01 .99 -.07 -.08 -.09 .98 .00
I want to maintain a relationship
with ( ).
-.09 .91 .07 .91 .00 -.12 .07 .95 .03
The researcher conducted EFA one more time using the combined dataset after excluding
the six items. The factor structure greatly improved this time. All items had a high loading on
only one factor except item 4 in relationship uncertainty, “I still value my relationship with ( ).”
Although the loading met the first two item retention standards, the loading on the primary factor
larger than .40 and on the secondary factor smaller than .40, it failed to meet the third standard
which indicates the difference between the two must be larger than .40. Pett, Lackey, and
Sullivan (2003) suggested researchers should not only consider factor loadings when they decide
which item to delete. Problematic items should be closely examined to see their relevance to the
overall construct. If researchers feel the problematic items significantly contribute to the measure
of the construct, these items could be retained for further analysis (Pett, et al., 2003). Despite a
potential cross-loading issue, the researcher decided to keep this item. If CFA indicated a similar

67
problem, this item would be further analyzed. The 12-item scale was used for the second round
of data collection. Table 13 provides the final factor loadings for the 12-item scale.
Table 13: Final EFA Loadings Using the Combined Dataset
1 2 3
I will not be affected by the incident. .04 -.09 .72
My family will not suffer from the incident. .01 .05 .78
The incident will not influence my life. -.02 .06 .80
( ) can fix the problem. .91 -.18 .11
( ) will handle the incident properly. .81 .05 .04
( ) will make the situation better. .80 .10 .04
( ) has the ability to solve the crisis. .66 .01 -.01
( ) will do whatever they can to make it right. .79 .15 -.06
( ) will treat people involved in the incident appropriately. .75 .21 -.08
I still value my relationship with ( ). .35 .53 .07
I want to use the ( ) products/services in the future. .01 .93 -.02
I want to maintain a relationship with ( ). .00 .92 .01
Confirmatory factor analysis
The factor structure yielded from EFA further went through more rigorous CFA. The
second dataset with 294 participants was employed to complete CFA. Unlike EFA, the
researcher decided to conduct CFA only based on the combined dataset and the Facebook dataset
because the sample size of the United Airlines dataset was too small (n = 48) to perform CFA.
Many different fit indices were reported in previous scale development studies in crisis
communication research, including chi-square, RMSEA, SRMR, GFI, IFI, CFI, NNFI, AIC, and
BIC (Brown & Ki, 2013; Jin, et al., 2014; Zhou, Ki, & Brown, 2019). The model fit depends on
the evaluation of multiple indices rather than only one or two fit statistics. Kline (2015)
suggested that researchers should report at least four statistics: (a) Chi-square with its degrees of
freedom and p-value, (b) RMSEA and its 90% confidence interval, (c) CFI, and (d) SRMR.
Scholars proposed different standards for the goodness of fit. Hu and Bentler (1999)

68
recommended that the values of TLI, CFI, and NFI should be approximately .95. SRMR should
be lower than .08, and RMSEA should be lower than .06. MacCallum, Browne, and Sugawara
(1996) used .01, .05, and .08 RMSEA to represent an excellent, good, and mediocre fit. Model
chi-square is sensitive to sample size. A larger sample size normally induces a sample p-value.
Thus, Wheaton, Muthen, Alwin, & Summers (1977) proposed reporting chi-square/df rather than
only chi-square. This study reported Chi-square with degrees of freedom and p-value, Chi-
square/df, RMSEA with 90% confidence interval, CFI, and SRMR. The goodness of fit followed
these standards: Chi-square/df lower than 5, RMSEA lower than .06, SRMR lower than .08, and
CFI greater than .95.
The first round of CFA was conducted on the combined dataset. The initial three-factor
correlated model did not show an ideal model, χ2 = 119.251, df = 51, p < .05, χ2/ df = 2.338;
RMSEA = .068 [90%CI = .052, .083]; SRMR = .040; CFI = .970. A further investigation of the
modification indices (< 10) and standardized residual covariances (< 2.58) revealed a large
covariance among the error terms related to the fifth item under process uncertainty (Byrne,
2001). Modification indices also suggested a covariance between the error terms of two items
under relationship uncertainty. Therefore, the researcher decided to remove the second item
under process uncertainty and let the two error terms covary. Although the use of modification
indices and standardized residual covariances are questioned by some researchers, they are
frequently used in the crisis communication scholarship to increase fit statistics (e.g. Brown &
Ki, 2013; Jin et al., 2010). Bentler (2010) maintained that modification indices are useful, if not
necessary, to indicate in which way the model can be improved. The model was re-estimated
after a revision. The re-estimated model reached a better and ideal fit, χ2 = 75.356, df = 40, p
< .05, χ2/ df = 1.884; RMSEA = .055 [90%CI = .035, .074]; SRMR = .034; CFI = .982. Although

69
the upper bound of RMSEA was still slightly larger than the cutoff, considering other fit
statistics, this model fitted the data. The first round of CFA produced a three-factor model with
11 measurement items. Figure 3 provides the CFA model based on the combined dataset.
Figure 3: CFA Model Based on The Combined Dataset
The researcher continued to run CFA based on the Facebook dataset. The preliminary
three-factor model showed acceptable fit statistics, χ2 = 79.764, df = 51, p < .05, χ2/ df = 1.564;
RMSEA = .048 [90%CI = .026, .068]; SRMR = .036; CFI = .987. There were no surprising large
modification indices and standard residual covariances did not show any large values as well.
Thus, the second round of CFA produced a 12-item scale. Figure 4 provides the CFA model
based on the Facebook dataset.

70
Figure 4: CFA Model Based on The Facebook Dataset
After CFA, parameter estimates were evaluated to further confirm the structure.
Parameters that did not load significantly on their intended factors should be removed. Bagozzi
and Yi (1998) proposed that there should be no loadings too small (< .5) or too large (> .95). An
extremely high loading usually indicates item wording redundancy. The loadings of both models
ranged from .70 to .90. To encourage parsimony, the researcher selected the model achieved
based on the combined dataset with 11-items.
Convergent and discriminant validity

71
This study continued to assess the convergent and discriminant validity based on the
combined dataset after achieving the ideal factor structure. To achieve good convergent validity,
Fornell and Larcker (1981) suggested the average variance extracted (AVE) should be .50 or
above. Through calculation, the scores of AVE passed the cutoff, indicating good convergent
validity. To assess discriminant validity, Fornell and Larcker (1981) recommended that the AVE
of each dimension should be larger than the squared inter-dimension correlations. The results
showed the AVE of each dimension was larger than the squared inter-dimension correlation,
demonstrating ideal discriminant validity. Table 14 provides the comparison.
Table 14: AVE and Shared Variance Estimates
Protection Uncertainty Process Uncertainty Relationship Uncertainty
Protection Uncertainty .62 .42 .30
Process Uncertainty .65 .63 .56
Relationship Uncertainty .54 .75 .67
Note: Correlations are below the diagonal, squared correlations are above the diagonal, and
AVEs are on the diagonal.
Reliability
The study calculated Cronbach’s alpha and composite reliability to evaluate the reliability
of the scale. To achieve good reliability, Fornell and Larcker (1981) suggested the composite
reliability should be at least .70. Nunnally (1978) recommended the Cronbach’s alpha should
also be at least .70. The results showed the scale passed both tests, indicating good reliability.
Table 15 provides descriptive statistics, Cronbach’s alpha, and composite reliability. Therefore,
through rigorous testing, this study confirmed a three-dimension scale with 11 items to measure
crisis-induced uncertainty. Table 16 provides the final scale.

72
Table 15: Descriptive Statistics, Cronbach’s Alpha, and Composite Reliability
M SD α CR
Protection Uncertainty 4.67 1.37 .83 .83
Process Uncertainty 4.57 1.38 .90 .89
Relationship Uncertainty 4.59 1.43 .85 .86
Table 16: The Final Scale
Protection Uncertainty
I will not be affected by the incident.
My family will not suffer from the incident.
The incident will not influence my life.
Process Uncertainty
( ) can fix the problem.
( ) will handle the incident properly.
( ) will make the situation better.
( ) has the ability to solve the crisis.
( ) will treat people involved in the incident appropriately.
Relationship Uncertainty
I still value my relationship with ( ).
I want to use the ( ) products/services in the future.
I want to maintain a relationship with ( ).
Study 2
Model 1
The study employed SEM to test the two proposed models. Before testing the structural
model, the study first evaluated the fit of the measurement model. CFA was first conducted
based on a seven-factor model (Uncertainty: three factors; OPR: four factors) with all 27 items.
The fit of this model was a little problematic (RMSEA > .06; CFI < .95). A further examination
of modification indices and standardized residual covariances indicated that the error covariance
between item 1 and item 4 and between item 1 and item 5 under process uncertainty should be
allowed. The researcher also allowed item 2 and item 4 under trust to covary. The first item
under satisfaction caused large modification indices (< 10) so that this item was removed. CFA

73
was conducted on the revised model, which showed a slight improvement and generally could be
regarded as a good measurement model.
Table 17: Fit Statistics of The Measurement Model 1
Model χ2 df p χ2/ df RMSEA SRMR CFI
Seven Factor 710.396 303 .000 2.345 .065 .054 .937
Seven Factor (R) 591.123 275 .000 2.150 .060 .049 .949
A SEM analysis was applied to evaluate the structural model. The results reached ideal fit
indices, χ2 = 591.123, df = 275, p < .05, χ2/ df = 2.150; RMSEA = .060 [90%CI = .053, .066];
SRMR = .049; CFI = .949. Figure 5 provides the estimated standardized effects from the three
uncertainty factors to the four OPR factors. RQ2 to RQ5 questioned if crisis-induced uncertainty
influences the four dimensions of OPR. The structural model indicated that there was a
significant negative relationship between protection uncertainty and satisfaction (b = -.10; SE
= .04; CR = -2.25; p < .05), and between protection uncertainty and trust (b = -.13; SE = .03; CR
= -3.97; p < .001). Protection did not significantly influence control mutuality and commitment.
Process uncertainty had a significant negative influence on every dimension of OPR (Control
Mutuality: b = -.31; SE = .08; CR = -3.91; p < .001; Satisfaction: b = -.27; SE = .06; CR = -4.31;
p < .001; Trust: b = -.39; SE = .05; CR = -7.74; p < .001; Commitment: b = -.30; SE = .06; CR =
-5.18, p < .001). Relationship uncertainty had a significant negative impact on satisfaction (b =
-.66; SE = .07; CR = -9.45, p < .001), trust (b = -.35; SE = .05; CR = -7.39, p < .001), and
commitment (b = -.51; SE = .06; CR = -8.13, p < .001). Interestingly, relationship uncertainty
produced a significant positive effect on control mutuality (b = .54; SE = .08; CR = 6.75, p
< .001). The square multiple correlations demonstrated crisis-induced uncertainty explained 20%
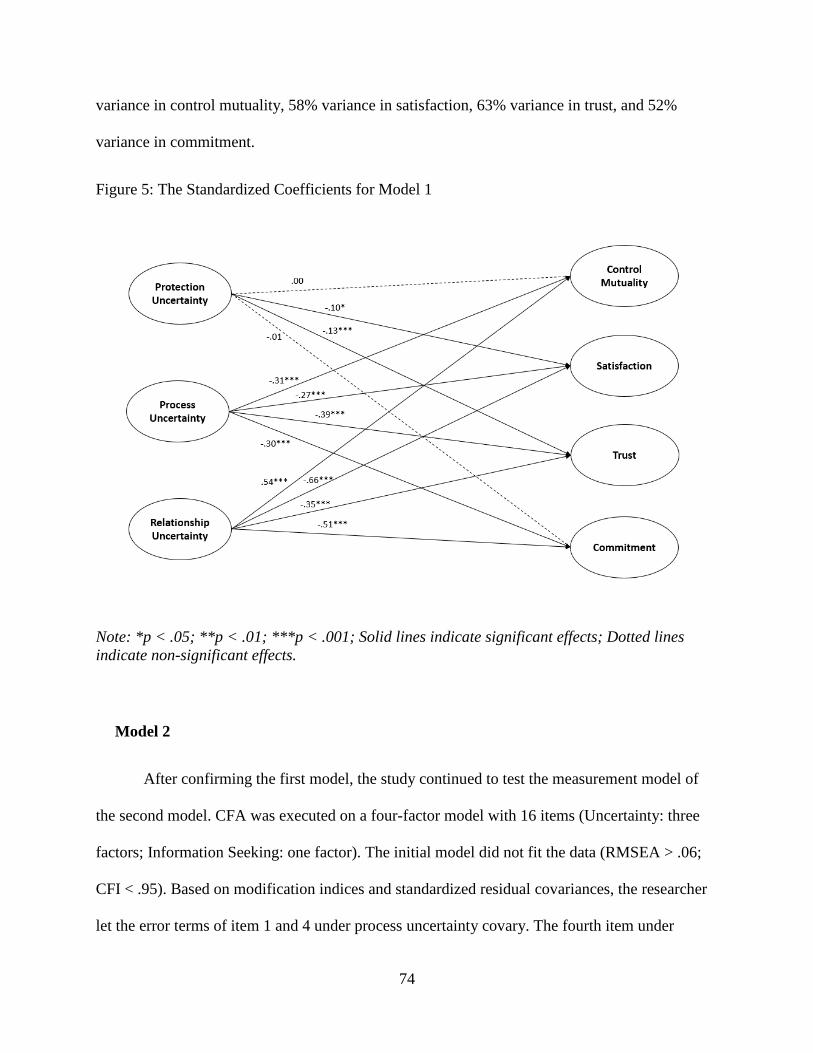
74
variance in control mutuality, 58% variance in satisfaction, 63% variance in trust, and 52%
variance in commitment.
Figure 5: The Standardized Coefficients for Model 1
Note: *p < .05; **p < .01; ***p < .001; Solid lines indicate significant effects; Dotted lines
indicate non-significant effects.
Model 2
After confirming the first model, the study continued to test the measurement model of
the second model. CFA was executed on a four-factor model with 16 items (Uncertainty: three
factors; Information Seeking: one factor). The initial model did not fit the data (RMSEA > .06;
CFI < .95). Based on modification indices and standardized residual covariances, the researcher
let the error terms of item 1 and 4 under process uncertainty covary. The fourth item under

75
information-seeking behaviors caused surprisingly large residual covariances (< 2.58), thus, the
item was removed. CFA was applied to the new measurement model, and the model showed
better fit statistics. Although RMSEA was still slightly larger than the cutoff, considering other
reported parameters, the measurement model was generally acceptable.
Table 18: Fit Statistics of The Measurement Model 2
Model χ2 df p χ2/ df RMSEA SRMR CFI
Four Factors 330.745 98 .000 3.375 .086 .061 .931
Four Factors (R) 221.696 83 .000 2.671 .072 .055 .955
After achieving an adequate measurement model, an SEM analysis was conducted based
on the structural model. The fit statistics indicated the model was acceptable, χ2 = 221.696, df =
83, p < .05, χ2/ df = 2.671; RMSEA = .072 [90%CI = .061, .072]; SRMR = .055; CFI = .955.
Though RMSEA was a little large again, considering overall fit statistics, the structural model
was acceptable. Figure 6 provides the estimated standardized effects from the three uncertainty
factors to information-seeking behaviors. H1 predicted that crisis-induced uncertainty influences
people’s information-seeking behaviors. In this analysis, only process uncertainty exerted a
significant influence on information-seeking behaviors (b = -.17; SE = .08; CR = -2.01, p < .05).
The other two dimensions of crisis-induced uncertainty did not influence information-seeking
behaviors during the crisis. Therefore, H1 was not supported. The multiple squared correlations
illustrated that crisis-induced uncertainty explained 3% of the variance in information-seeking
behaviors.

76
Figure 6: The Standardized Coefficients for Model 2
Note: *p < .05; **p < .01; ***p < .001; Solid lines indicate significant effects; Dotted lines
indicate non-significant effects.
77
CHAPTER 5: DISCUSSION
The dissertation fulfilled three general purposes. First, it conceptualized crisis-induced
uncertainty. Second, based on the definition, it created a valid and reliable instrument to measure
the construct. Third, using the new construct, it tested the relationship between crisis-induced
uncertainty and organization-public relationships (OPR), and between crisis-induced uncertainty
and information-seeking behaviors. The dissertation was meaningful because it is the first study
to define uncertainty and operationalize the construct in the crisis context. Although uncertainty
was a frequently discussed variable in the crisis communication literature, its empirical
examination was scarce. The dissertation found a link between crisis-induced uncertainty and
OPR, demonstrating the value of uncertainty in crisis communication.
The discussion chapter is divided into four parts. The first part will discuss the results
yielded from Study 1 and Study 2. The second part includes the discussion about theoretical and
practical implications. In the third section, some limitations will be pointed out along with future
research directions. This chapter ends with a short conclusion that iterates the importance of this
study.
Summary of Results
RQ1 inquired what a valid and reliable scale was to measure crisis-induced uncertainty.
Following Churchill’s (1979) scale development steps, the study proposed three dimensions:
78
protection uncertainty, process uncertainty, and relationship uncertainty. The scale was first
reviewed and discussed by a group of doctoral students in the field of communication and then
reviewed by some crisis communication experts to check face and content validity. The initial
scale was revised at this stage. The polished scale was further validated quantitatively using EFA
and CFA and achieved ideal construct validity. In the end, convergent validity, discriminant
validity, and reliability were assessed to confirm the final scale. The validation procedure yielded
a three-dimensional scale with 11 items.
The researcher proposed three dimensions to measure crisis-induced uncertainty. The
multiple steps of analyses confirmed the three underlying dimensions—protection uncertainty,
process uncertainty, relationship uncertainty—as a reliable and valid measure of crisis-induced
uncertainty as proposed. With three measurement items, the first dimension, protection
uncertainty, deals with stakeholders’ lack of confidence that they can protect themselves from
the crisis. Measured with five items, the second dimension, process uncertainty, explains
stakeholders’ lack of confidence that the organization can properly handle the crisis. The last
dimensions, relationship uncertainty, denotes stakeholders’ lack of confidence that they still hope
to maintain a relationship with the organization and was measured by three items. The three
dimensions imitated Knobloch and Solomon’s (1999) scale to measure uncertainty in URT and
clarified the question “when people feel uncertain, what do they feel uncertain about?”
RQ2 investigated if crisis-induced uncertainty affects control mutuality during a crisis.
Control mutuality is the most interesting OPR variable because protection uncertainty did not
influence control mutuality while relationship uncertainty had a positive impact on control
mutuality. In other words, as people feel more uncertain about their relationship with an
organization, they believe both parties have more rightful power to influence each other. This is
79
clearly inconsistent with other OPR dimensions and it is common to witness such inconsistency.
For example, when exploring how a crisis changes OPR, Ki and Brown (2013) demonstrated that
there is a significant difference in every dimension of OPR before and after a crisis except
control mutuality. That is, control mutuality seems to be more stable during the time of crisis
compared to the other three relationship dimensions, satisfaction, trust, and commitment. One
possible explanation is that the four OPR dimensions are not on the same level and simply
parallel. It is possible that control mutuality mediates or moderates the relationship between
crisis-induced uncertainty and other three OPR dimensions. Ki and Hon (2007a) discussed and
tested the hierarchy among the four dimensions of OPR. They argued the four dimensions are not
solely parallel and some factors might be the antecedents of other factors. Thus, control
mutuality deserves further examination by OPR researchers to see if it truly fits in the
framework.
RQ3 examined the influence of crisis-induced uncertainty on satisfaction. All three
dimensions of crisis-induced uncertainty exerted a significant negative influence on satisfaction.
In detail, as people feel more uncertain about their self-protection, the organization’s ability to
handle the crisis, and whether they want to maintain a relationship with the organization, they
feel less satisfaction toward an organization. The three dimensions of crisis-induced uncertainty
together explained 58% variance in satisfaction. This finding is lined with the ones at an
interpersonal level. For example, Neuliep & Grohskopf (2000) revealed that uncertainty
significantly and negatively influences communication satisfaction. In the context of friendship,
Forsythe and Ledbetter (2015) discovered that relationship uncertainty significantly reduces
communication satisfaction between friends. This study recommended that organizations should
use uncertainty reduction strategies to maintain stakeholders’ satisfaction during a crisis.

80
RQ4 scrutinized if crisis-induced uncertainty impacts on trust. Similar to the relationship
between crisis-induced uncertainty and satisfaction, all dimensions of crisis-induced uncertainty
had a significant negative influence on trust. Precisely, when people feel uncertain about
protecting themselves, an organization’s ability to solve the crisis, and maintaining the
relationship with the organization, they are less willing to open themselves to the organization.
The three factors together explained 63% variance in trust. This finding resembles what has been
uncovered in interpersonal communication. Dainton and Aylor (2001) explored the role of
uncertainty in long-distance relationships and found that relational uncertainty is negatively
correlated with trust. Liu et al. (2016) argued uncertainty and trust intertwine in two ways. One is
that publics’ trust in the communicator influences publics’ acceptance of uncertainty. The other
lies in the communicator’s acceptance of uncertainty influences publics’ trust in the
communicator. Either way, uncertainty and trust have a strong association.
RQ5 analyzed the influence of crisis-induced uncertainty on the last dimension of OPR,
commitment. While no relationship was found between protection uncertainty and commitment,
the other two dimension of crisis-induced uncertainty, process uncertainty and relationship
uncertainty, significantly predicted commitment. In detail, as people feel more uncertain about
an organization’s ability to solve the problem and maintaining a relationship with the
organization, they are less likely to sustain a long-term the relationship with the organization.
This finding is also consistent with the tenets in URT. In exploring on-again/off-again (on-off)
relationships, Dailey, Hampel, and Roberts (2010) found that uncertainty between partners in a
romantic relationship had a significant negative effect on commitment. A similar finding was
reported in a later study that commitment mediates the relationship between relational

81
uncertainty and relationship quality in a romantic relationship (Weigel, Brown, & O’Riordan,
2011).
H1 predicted that crisis-induced uncertainty positively influences information-seeking
behaviors. This hypothesis was not supported because protection uncertainty and relationship
uncertainty did not significantly affect information-seeking behaviors. Although the influence of
process uncertainty on information-seeking behaviors was significant, process uncertainty,
counterintuitively, negatively affected information seeking. That is, as people feel more
uncertain about an organization’s ability to solve the problem, their information seeking
decreases. The finding refutes what has been revealed in the interpersonal communication
literature. One possible explanation is that participants’ involvement moderates the relationship
between crisis-induced uncertainty and information-seeking behaviors. Crisis scholars have
emphasized the importance of involvement in crisis management. Claeys and Cauberghe (2014)
noted that participants’ involvement could change the effectiveness of crisis response strategies.
It moderated the relationship between crisis response strategies and post-crisis attitude toward
the company. McDonald, Sparks, and Glendon (2010) pointed out that crisis involvement is a
strong predictor of people’s emotions such as anger, fear, and sympathy. The non-significant
effect of uncertainty could be caused by involvement. This study used a fictitious restaurant and
a fictitious crisis to stimulate participants, and it might make them feel this crisis is irrelevant and
show indifference. A different pattern might be uncovered if a real crisis that significantly
impacts them was used. Another possible explanation is that the two concepts were measured at
different levels. Information seeking explains an individual’s behaviors while crisis-induced
uncertainty concerns the interaction between stakeholders and an organization.
Theoretical and Practical Implications

82
Enrichment to ethical communication
This study corresponds to the advocacy of ethical communication in public relations.
Ethics has long been regarded as an important issue, if not the most important issue, in public
relations education. Through surveying more than 200 public relations professors, Erzikova
(2010) stressed ethics education is an essential part to prepare future public relations
practitioners. Most teachers regard developing socially responsible professionals as the highest
goal of ethics education. In research, public relations theorists also add the ethical element to
current theories. For example, Kent and Taylor (2002) argued that dialogue is one of the most
ethical forms of communication so that practitioners should engage the public in dialogue in
practice. Grunig (2000) claimed that ethics and social responsibility are two critical components
of public relations practices.
As one of the most heavily researched areas in public relations, crisis communication also
maintains a high ethical standard and requires practitioners to ethically communicate. Despite its
importance, current crisis communication theories do not reflect this important component. Early
theories such as corporate apologia and IRT only consider crisis response strategies without
discussing ethical issues. Although SCCT states that response messages should be provided
based on ethical consideration, claiming adjusting and instructing information should be
provided at the beginning of crisis communication, it does not explicate how the two types of
information are ethical. More importantly, the entire theory builds on attribution theory so it does
not center around the protection of stakeholders. The core of the theory lies in responsibility
avoidance and reputation maintenance, which does not echo ethical communication. Practitioners
who consult the theory still don’t know how to integrate ethics into crisis communication and
what messages could be regarded as ethical information.

83
This study provides a direction for researchers and practitioners in ethical
communication. It focuses on stakeholders’ feeling of uncertainty during a crisis and advocates
that crisis managers must address uncertainty to psychologically protect their audience. If a
message has the function of sustaining good reputation but fails to resolve any of stakeholders’
uncertainty, the message or the strategic communication plan could not be regarded as ethical
communication. This study provides a new angle to look at crisis communication research by
shifting attention from responsibility to uncertainty and from an organization orientation to a
stakeholder orientation. The goal of crisis communication could be broader than simply avoiding
responsibility and maintaining reputation. This study claims that the goal of crisis
communication is to build a long-term relationship with stakeholders. Stakeholder protection and
reputation maintenance are two instruments to evaluate the goal achievement. Therefore,
stakeholder protection is as important as reputation protection. An effective crisis
communication plan must meet the two goals at the same time to cultivate a long-term
relationship.
Application of the new scale
To the best of the researcher’s knowledge, this study is the first one to propose and test a
multidimensional scale to measure uncertainty in the crisis context. It advances our
understanding and measurement of crisis-induced uncertainty. As argued by many crisis
communication researchers, uncertainty is an essential construct to consider in crisis
management (Liu, et al., 2016; Seeger, 2006). By providing the measurement, this study paves
the way for researchers who want to follow up this line of research. This study also provides
evidence on the relationship between crisis-induced uncertainty and OPR. While more questions
remain unanswered, a newly developed scale can facilitate scholars to test the relationship

84
between crisis-induced uncertainty and other important variables in crisis communication. For
example, though this study examined the impact of crisis-induced uncertainty on OPR, it did not
navigate the sources of uncertainty. In other words, the study failed to identify factors that
influence uncertainty. Liu et al. (2016) discussed the influence of information channels on
people’s uncertainty during health-related crises. They argued that the outlets of information
impact people’s trust and further change their uncertainty but failed not provide empirical
evidence on how channels function. Applying this scale, future research could look at how
disseminating the same message from different media outlets changes crisis-induced uncertainty.
Another important factor that might influence uncertainty is media frames. Framing
theory states that how news is presented influences how people make sense of an event and
process information (Entman, 1993). Framing theory has already been applied to crisis
communication research. For example, Cho and Gower (2006) revealed that the human-interest
frame significantly influences people’s emotions and attribution of crisis responsibility. Kim and
Cameron (2011) concluded that emotional news frames affect people’s emotions and further alter
their evaluations of the company. Since previous studies have provided evidence on the effect of
news frame in crisis communication, future research could look at if different news frames
change people’s feeling of uncertainty during a crisis.
Perceived crisis severity, an important concept of SCCT, could also contribute to crisis-
induced uncertainty. In discussing ambiguous product-harm crises, Laufer, Gillespie, McBride,
and Gonzalez (2005) predicted that organizations could not benefit from doubts when consumers
perceive a crisis to be more severe. In reverse, they will benefit from doubts if people believe the
crisis is less severe. Unfortunately, they did not provide empirical evidence on the influence of

85
severity. Future research could investigate if and how perceived crisis severity impacts
uncertainty.
With the reconceptualization of uncertainty and the new scale, crisis-induced uncertainty
could generate more discussion and become a new battleground for crisis communication
research. Generally, researchers could regard crisis-induced uncertainty as an antecedent or an
outcome, identifying what contributes to the feeling of uncertainty and exploring what could be
changed when people feel uncertain during a crisis.
Rethinking OPR management during crises
OPR has become a mainstream theory in public relations research for more than 20 years.
According to Ki and Shin (2015), OPR research has generated more than a hundred empirical
journal articles, some of which discussed OPR in the crisis context. However, most of
investigation was carried out within the framework of SCCT. Some studies focused on testing
what crisis response strategies are effective to maintain OPR (Haigh & Brubaker, 2010; Haigh &
Dardis, 2012; Kim, Zhang, & Zhang, 2016). Other studies examined the relationship between
crisis responsibility and OPR (Ki & Brown, 2013). One major missing link in the literature is
neglecting the enduring effect of relationships. Organizations need to spend resources building
and maintaining a relationship with their stakeholders. It is unlikely that organizations could
nurture satisfaction or trust in one or two public relations programs. In the same vein, it is also
unlikely that a well-established relationship could be destroyed by only one or two messages.
When researching OPR during crises, it is more important to look at how psychological factors
of stakeholders change their relationship with an organization rather than the influence of one or
two pieces of information.
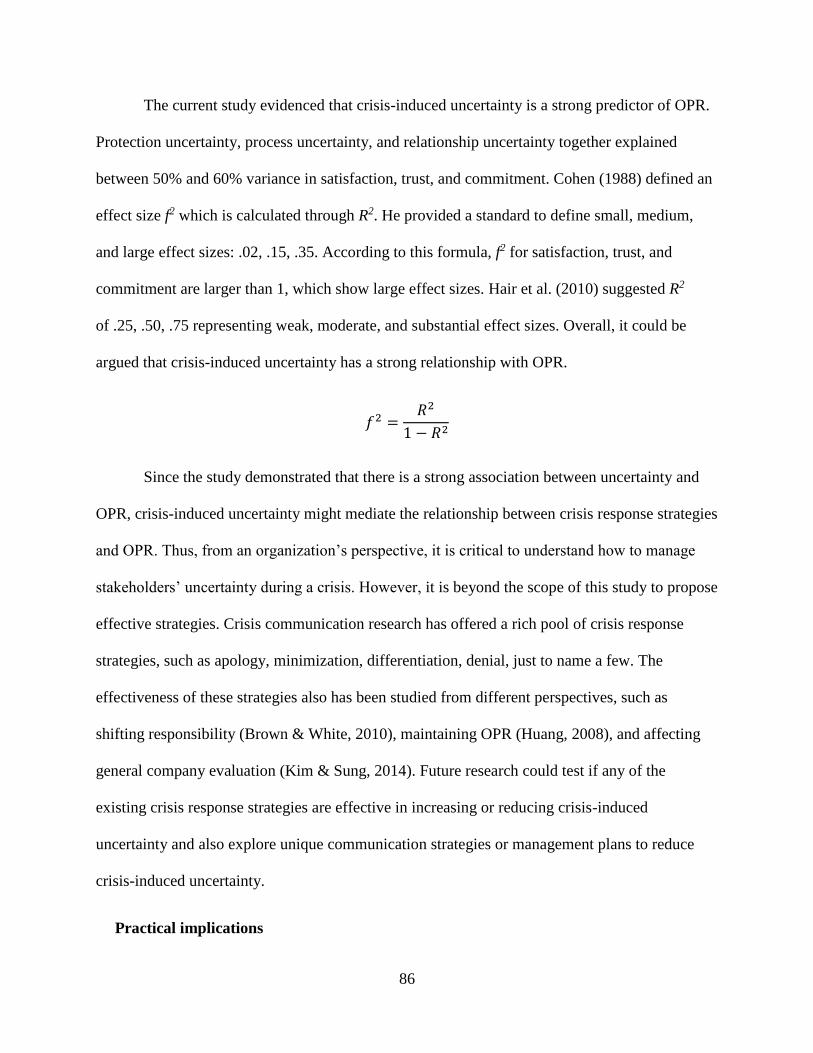
86
The current study evidenced that crisis-induced uncertainty is a strong predictor of OPR.
Protection uncertainty, process uncertainty, and relationship uncertainty together explained
between 50% and 60% variance in satisfaction, trust, and commitment. Cohen (1988) defined an
effect size f2 which is calculated through R2. He provided a standard to define small, medium,
and large effect sizes: .02, .15, .35. According to this formula, f2 for satisfaction, trust, and
commitment are larger than 1, which show large effect sizes. Hair et al. (2010) suggested R2
of .25, .50, .75 representing weak, moderate, and substantial effect sizes. Overall, it could be
argued that crisis-induced uncertainty has a strong relationship with OPR.
𝑓2 =𝑅2
1 − 𝑅2
Since the study demonstrated that there is a strong association between uncertainty and
OPR, crisis-induced uncertainty might mediate the relationship between crisis response strategies
and OPR. Thus, from an organization’s perspective, it is critical to understand how to manage
stakeholders’ uncertainty during a crisis. However, it is beyond the scope of this study to propose
effective strategies. Crisis communication research has offered a rich pool of crisis response
strategies, such as apology, minimization, differentiation, denial, just to name a few. The
effectiveness of these strategies also has been studied from different perspectives, such as
shifting responsibility (Brown & White, 2010), maintaining OPR (Huang, 2008), and affecting
general company evaluation (Kim & Sung, 2014). Future research could test if any of the
existing crisis response strategies are effective in increasing or reducing crisis-induced
uncertainty and also explore unique communication strategies or management plans to reduce
crisis-induced uncertainty.
Practical implications

87
Besides opening up a new window for crisis communication researchers, this study also
provides some practical recommendations for practitioners when managing a crisis. According to
Claeys and Opgenhaffen (2016), practitioners tend to ignore theories and rely on gut feelings
when managing a crisis. They have a general crisis communication plan and customize the plan
in each situation. This study recommends that practitioners should think about how much
uncertainty a crisis has imposed on stakeholders when crafting messages. Even if they cannot
conduct a large scale of survey to measure people’s uncertainty level, practitioners should
examine a small number of publics’ level of uncertainty regarding the situation the organization
is facing. In addition, before they issue a position statement or post messages on social media
regarding a crisis, practitioners should ask the following questions, “Does this message raise or
lower people’s level of uncertainty?” “After reading the message, do people know what to do to
protect themselves?” “Is the message showing that we are in control and we have the ability to
solve the problem?” “After reading the message, do people feel we value the relationship with
them?” If the crisis response message could answer the previous questions, it is able to resolve
crisis-induced uncertainty.
The other practical implication lies in stakeholders’ information-seeking behaviors.
Although this study did not discover the relationship between crisis-induced uncertainty and
information-seeking behaviors, it does not prove there is no such relationship. As discussed
previously, the relationship might be moderated by crisis involvement. Highly involved people in
the crisis are more likely to engage in information seeking than those with low involvement.
From an organization’s perspective, practitioners should think about what information must be
provided when stakeholders start to do so. For example, in late 2018, Marriott International
revealed that the information of more than 500 million customers on their database was accessed
88
by hackers. The information included the customers’ names, addresses, phone numbers, passport
numbers, etc. Right after the crisis, Marriott designed an independent website to release details
about the crisis. On the website, they left a large frequently asked questions (FAQ) section to tell
whoever visit the website the current situation and what they could do to avoid harm. The current
study suggests that crisis managers should follow this method to keep stakeholders posted. When
people start engaging in information seeking, organizations should ensure the information is
accurate and provided by themselves.
Limitations and Future Research
Although this study greatly contributes to the understanding of people’s feeling of
uncertainty during organizational crises, it bears several limitations. First, Study 1 only used two
crisis scenarios, the Facebook case and the United Airlines case, to validate the scale and
improve generalizability. Although the researcher attempted to diversify the crisis situations to
make the scale generalizable, it is far from enough to conclude that the scale could be applied to
every crisis. Therefore, future researchers are encouraged to use the newly developed crisis-
induced uncertainty scale across different crises.
Second, the study selected two real crises which have died down. Participants’ reported
uncertainty may not be the same as their feeling during the crises or at the early stage of the
crises because many details have been released and participants already knew how the two
organizations handled the crises respectively. In addition, since the real scenarios were used,
participants’ uncertainty may be contaminated by other preexisting factors such as prior
reputation.

89
Third, this study aims to define and measure stakeholders’ uncertainty. However, it is
worth noting that an organization normally has multiple stakeholders including media,
consumers, employees, investors, suppliers, just to name a few (Rawlins, 2006). During a crisis,
each stakeholder is likely to feel uncertain about different issues. What an employee feels
uncertain about will be different from those of the public. Therefore, the proposed three
dimensions of crisis-induced uncertainty may not be able to capture all stakeholders’ uncertainty.
Despite the limitations, this study sheds light on this significant yet rarely explored area
in crisis communication. More importantly, it paves the way for uncertainty study in crisis
communication research. The first job that future research should consider is to solidify the scale,
that is, apply the new scale to diverse crisis situations. If the current scale is proved to be reliable
in different situations, the three dimensions could be further confirmed. Researchers in the future
could also consider applying the concept to different stakeholders. As discussed previously,
employees might experience different types of uncertainty compared to customers. Researchers
could explore and compare the uncertainty experienced by different stakeholders. Another
interesting research area lies in the antecedents of uncertainty. Besides the crisis itself, what are
some factors that influence people’s feeling of uncertainty?
Conclusion
Crisis communication has been a major topic in public relations for more than 20 years.
However, there is still a big gap between practices and research. We need more perspectives to
understand crisis dynamics and more criteria to evaluate the effectiveness of crisis response
strategies. Uncertainty, a major underdeveloped research line, has the potential to become a new
battleground for crisis communication research. Although this study showed some evidence to
support the argument, it is only exploratory in nature. This study opens a new door for crisis

90
communication by shifting its focus onto uncertainty and stakeholders. Hopefully, more scholars
will join to move this research forward.

91
REFERENCES
Afifi, W. A., & Matsunaga, M. (2008). Uncertainty management theories: Three approaches to a
multifarious process. In L. A. Baxter & D. O. Braitwaite (Eds.), Engaging theories in
interpersonal communication (pp. 117–132). Thousand Oaks, CA: Sage Publications.
Allen, M. W., & Caillouet, R. H. (1994). Legitimation endeavors: Impression management
strategies used by an organization in crisis. Communications Monographs, 61(1), 44-62.
Anderson, J. C., & Gerbing, D. W. (1988). Structural equation modeling in practice: A review
and recommended two-step approach. Psychological Bulletin, 103(3), 411-423.
Antheunis, M. L., Valkenburg, P. M., & Peter, J. (2010). Getting acquainted through social
network sites: Testing a model of online uncertainty reduction and social attraction.
Computers in Human Behavior, 26(1), 100-109.
Austin, L., Liu, B. F, & Jin, Y. (2012). How audiences seek out crisis information: Exploring the
social-mediated crisis communication model. Journal of Applied Communication
Research, 40(2), 188–207.
Avery, E. (2010). Contextual and audience moderators of channel selection and message
reception of public health information in routine and crisis situations. Journal of Public
Relations Research, 22(4), 378-403.
Avery, E. J., Lariscy, R. W., Kim, S., & Hocke, T. (2010). A quantitative review of crisis
communication research in public relations from 1991 to 2009. Public Relations Review,
36(2), 190-192.
Babrow, A. S. (1992). Communication and problematic integration: Understanding diverging
probability and value, ambiguity, ambivalence, and impossibility. Communication
Theory, 2(2), 95-130.
Babrow, A. S. (1995). Communication and problematic integration: Milan Kundera’s “Lost
Letters” in The Book of Laughter and Forgetting. Communication Monographs, 62, 283-
300.
Babrow, A. S. (2001). Uncertainty, value, communication and problematic integration. Journal
of Communication, 51, 553-573.

92
Babrow, A. S. (2007). Problematic integration theory. In B. B. Whaley & W. Samter (Eds.),
Explaining communication: Contemporary theories and exemplars (pp. 181-200).
Hillsdale, NJ: Lawrence Erlbaum.
Babrow, A.S., Hines, S.C., & Kasch, C.R. (2000). Illness and uncertainty: Problematic
integration and strategies for communicating about medical uncertainty and ambiguity. In
B.B. Whaley (Ed.), Explaining illness: Messages, strategies and contexts (pp. 41-67).
Hillsdale, NJ: Lawrence Erlbaum.
Babrow, A. S., Kasch, C. R., & Ford, L. A. (1998). The many meanings of uncertainty in illness:
Toward a systematic accounting. Health Communication, 10(1), 1-23.
Bagozzi, R. P., & Yi, Y. (1988). On the evaluation of structural equation models. Journal of the
Academy of Marketing Science, 16(1), 74-94.
Bartlett, M. S. (1950). Tests of significance in factor analysis. British Journal of Statistical
Psychology, 3(2), 77-85.
Baxter, L. A., & Montgomery, B. M. (1996). Relating: Dialogues & dialectics. New York, NY:
Guilford.
Benoit, W. L. (1995). Sears’ repair of its auto service image: Image restoration discourse in the
corporate sector. Communication Studies, 46(1-2), 89-105.
Benoit, W. L. (1997). Image repair discourse and crisis communication. Public Relations
Review, 23(2), 177–186.
Benoit, W. L. (2006). Image repair in President Bush's April 2004 news conference. Public
Relations Review, 32(2), 137-143.
Benoit, W. L. (2014). Accounts, excuses, apologies: Image repair theory and research, 2nd
edition. Albany, NY: State University of New York Press.
Benoit, W. L., & Brinson, S. L. (1994). AT&T: Apologies are not enough. Communication
Quarterly, 42(1), 75-88.
Benoit, W. L., & Hanczor, R. S. (1994). The Tonya Harding controversy: An analysis of image
restoration strategies. Communication Quarterly, 42(4), 416-433.
Benoit, W. L., & Henson, J. R. (2009). President Bush's image repair discourse on Hurricane
Katrina. Public Relations Review, 35(1), 40-46.
Benoit, W. L., & Pang, A. (2008). Crisis communication and image repair discourse. In T. L.
Hansen-Horn & B. D. Neff (Eds.), Public relations: From theory to practice (pp. 243–
261). New York, NY: Pearson.
93
Bentler, P. M. (2010). SEM with simplicity and accuracy. Journal of Consumer Psychology,
20(2), 215-220.
Berger, C. R. (1979). Beyond initial interaction: Uncertainty, understanding, and the
development of interpersonal relationships. Language and Social Psychology, 122-144.
Berger, C. R. (1987). Communicating under uncertainty. In M. E. Roloff & G. R. Miller (Eds.),
Sage annual reviews of communication research, Vol. 14. Interpersonal processes: New
directions in communication research (pp. 39-62). Thousand Oaks, CA: Sage
Publications.
Berger, C. R., & Bradac, J. J. (1982). Language and social knowledge: Uncertainty in
interpersonal relationships. London, UK: Edward Arnold.
Berger, C. R., & Calabrese, R. J. (1975). Some explorations in initial interaction and beyond:
Toward a theory of interpersonal communication. Human Communication Research, 1,
99–112.
Berger, C.R., & Gudykunst, W.B. (1991). Uncertainty and communication. In B. Dervin & M.J.
Voight (Eds.), Progress in communication sciences (pp. 21-66). Norwood, NJ: Ablex.
Berger, C. R., & Kellermann, K. (1994). Acquiring social information. In J. A. Daly & J. M.
Wiemann (Eds.), Strategic interpersonal communication (pp. 1–30). Hillsdale, NJ:
Erlbaum.
Blaney, J. R., & Benoit, W. L. (2001). The Clinton scandals and the politics of image restoration.
Westport, CT: Praeger.
Blaney, J. R., Benoit, W. L., & Brazeal, L. M. (2002). Blowout!: Firestone’s image restoration
campaign. Public Relations Review, 28(4), 379-392.
Bomey, N. (2016, July 14). BP's Deepwater Horizon costs total $62B. US Today. Retrieved from https://www.usatoday.com/story/money/2016/07/14/bp-deepwater-horizon-
costs/87087056/
Brashers, D. E. (2001). Communication and uncertainty management. Journal of
Communication, 51(3), 477-497.
Brashers, D. E. (2007). A theory of communication and uncertainty management. In B. B.
Whaley & W. Samter (Eds.), Explaining communication: Contemporary theories and
exemplars (pp. 201–218). Mahwah, NJ: Erlbaum.
Brashers, D. E., Goldsmith, D. J., & Hsieh, E. (2002). Information seeking and avoiding in
health contexts. Human Communication Research, 28(2), 258-271.

94
Brazeal, L. M. (2008). The image repair strategies of Terrell Owens. Public Relations Review,
34(2), 145-150.
Brinson, S. L., & Benoit, W. L. (1999). The tarnished star: Restoring Texaco’s damaged public
image. Management Communication Quarterly, 12(4), 483-510.
Brown, K. A. (2016). Is apology the best policy? An experimental examination of the
effectiveness of image repair strategies during criminal and noncriminal athlete
transgressions. Communication & Sport, 4(1), 23-42.
Brown, K. A., & Ki, E.-J. (2013). Developing a valid and reliable measure of organizational
crisis responsibility. Journalism & Mass Communication Quarterly, 90(2), 363-384.
Brown, K. A., & White, C. L. (2010). Organization–public relationships and crisis response
strategies: Impact on attribution of responsibility. Journal of Public Relations Research,
23(1), 75-92.
Brown, K. A., Billings, A. C., Mastro, D., & Brown-Devlin, N. (2015). Changing the image
repair equation: Impact of race and gender on sport-related transgressions. Journalism &
Mass Communication Quarterly, 92(2), 487-506.
Bruce, T., & Tini, T. (2008). Unique crisis response strategies in sports public relations: Rugby
league and the case for diversion. Public Relations Review, 34(2), 108-115.
Buhrmester, M., Kwang, T., & Gosling, S. D. (2011). Amazon's Mechanical Turk: A new source
of inexpensive, yet high-quality, data?. Perspectives on Psychological Science, 6(1), 3-5.
Burns, J. P., & Bruner, M. S. (2000). Revisiting the theory of image restoration strategies.
Communication Quarterly, 48(1), 27-39.
Byrne, B. M. (2001). Structural equation modeling with AMOS: Basic concepts, applications
and programming. Mahwah, NJ: Lawrence Erlbaum Associates.
Cho, S. H., & Gower, K. K. (2006). Framing effect on the public's response to crisis: Human
interest frame and crisis type influencing responsibility and blame. Public Relations
Review, 32(4), 420-422.
Churchill, G. A. (1979). A paradigm for developing better measures of marketing constructs.
Journal of Marketing Research, 16(1), 64-73.
Claeys, A. S., & Cauberghe, V. (2014). What makes crisis response strategies work? The impact
of crisis involvement and message framing. Journal of Business Research, 67(2), 182-
189.
Claeys, A. S., Cauberghe, V., & Vyncke, P. (2010). Restoring reputations in times of crisis: An
experimental study of the Situational Crisis Communication Theory and the moderating
effects of locus of control. Public Relations Review, 36(3), 256-262.

95
Claeys, A. S., & Opgenhaffen, M. (2016). Why practitioners do (not) apply crisis communication
theory in practice. Journal of Public Relations Research, 28(5-6), 232-247.
Clatterbuck, G. W. (1979). Attributional confidence and uncertainty in initial interaction. Human
Communication Research, 5(2), 147-157.
Cliff, N. (1988). The eigenvalues-greater-than-one rule and the reliability of components.
Psychological Bulletin, 103(2), 276-279.
Cohen, J. (1992). A power primer. Psychological Bulletin, 112(1), 155-159.
Coombs, W. T. (1995). Choosing the right words: The development of guidelines for the
selection of the “appropriate” crisis-response strategies. Management Communication
Quarterly, 8(4), 447-476.
Coombs, W. T. (1998). An analytic framework for crisis situations: Better responses from a
better understanding of the situation. Journal of Public Relations Research, 10(3), 177-
191.
Coombs, W. T. (2004). Impact of past crises on current crisis communication: Insights from
situational crisis communication theory. The Journal of Business Communication, 41(3),
265-289.
Coombs, W. T. (2006). The protective powers of crisis response strategies: Managing
reputational assets during a crisis. Journal of Promotion Management, 12(3-4), 241-260.
Coombs, W. T. (2007). Protecting organization reputations during a crisis: The development and
application of situational crisis communication theory. Corporate Reputation Review,
10(3), 163–176.
Coombs, W. T. (2010). Parameters for crisis communication. In W. T. Coombs, & S. J. Holladay
(Eds.), The handbook of crisis communication (pp. 17–53). New York, NY: Wiley-
Blackwell.
Coombs, W. T. (2015). The value of communication during a crisis: Insights from strategic
communication research. Business Horizons, 58(2), 141-148.
Coombs, W. T., Frandsen, F., Holladay, S. J., & Johansen, W. (2010). Why a concern for
apologia and crisis communication?. Corporate Communications: An International
Journal, 15(4), 337-349.
Coombs, W. T., & Holladay, S. J. (2001). An extended examination of the crisis situations: A
fusion of the relational management and symbolic approaches. Journal of Public
Relations Research, 13(4), 321-340.

96
Coombs, W. T., & Holladay, S. J. (2005). Exploratory study of stakeholder emotions: Affect and
crisis. In N. M. Ashkanasy, W. J. Zerbe, & C. E. J. Hartel (Eds.), Research on emotion in
organizations: The effect of affect in organizational settings (pp. 271–288). New York,
NY: Elsevier.
Costello, A. B., & Osborne, J. W. (2005). Best practices in exploratory factor analysis: Four
recommendations for getting the most from your analysis. Practical Assessment,
Research & Evaluation, 10(7), 1-9.
Dailey, R. M., Hampel, A. D., & Roberts, J. B. (2010). Relational maintenance in on-again/off-
again relationships: An assessment of how relational maintenance, uncertainty, and
commitment vary by relationship type and status. Communication Monographs, 77(1),
75-101.
Dainton, M., & Aylor, B. (2001). A relational uncertainty analysis of jealousy, trust, and
maintenance in long‐distance versus geographically close relationships. Communication
Quarterly, 49(2), 172-188.
Dardis, F., & Haigh, M. M. (2008). Prescribing versus describing: Testing image restoration
strategies in a crisis situation. Corporate Communications: An International Journal,
14(1), 101-118.
DeVellis, R. F. (2012). Scale development: Theory and applications. Thousand Oaks, CA: Sage
Publications.
Driskill, L. P., & Goldstein, J. R. (1986). Uncertainty: Theory and practice in organizational
communication. The Journal of Business Communication, 23(3), 41-56.
Dutta, S., & Pullig, C. (2011). Effectiveness of corporate responses to brand crises: The role of
crisis type and response strategies. Journal of Business Research, 64(12), 1281–1287.
Dziuban, C. D., & Shirkey, E. C. (1974). When is a correlation matrix appropriate for factor
analysis? Some decision rules. Psychological Bulletin, 81(6), 358-361.
Entman, R. M. (1993). Framing: Toward clarification of a fractured paradigm. Journal of
Communication, 43(4), 51-58.
Erzikova, E. (2010). University teachers’ perceptions and evaluations of ethics instruction in the
public relations curriculum. Public Relations Review, 36(3), 316-318.
Fearn-Banks, K. (1996). Crisis communication. A casebook approach. Mahwah, NJ: Lawrence
Erlbaum Associates.
Ferguson, M. A. (1984, August). Building theory in public relations: Interorganizational
relationships as a public relations paradigm. Paper presented to the Association for
Education in Journalism and Mass Communication, Gainesville, FL.
97
Fink, S. (1986). Crisis management: Planning for the inevitable. New York, NY: Amocom.
Fornell, C., & Larcker, D. F. (1981). Evaluating structural equation models with unobservable
variables and measurement error. Journal of Marketing Research, 18(1), 39-50.
Forsythe, K. E., & Ledbetter, A. M. (2015). Relational uncertainty, self-other inclusion, and
communication satisfaction as predictors of friendship relational maintenance, and how
equity changes the story. Communication Studies, 66(3), 321-340.
Freeman, R. E. (1984). Strategic Management: A Stakeholder Perspective. Englewood Cliffs,
NJ: Prentice Hall.
Freeman, R. E., & Reed, D. L. (1983). Stockholders and stakeholders: A new perspective on
corporate governance. California Management Review, 25(3), 88-106.
Gerbing, D. W., & Anderson, J. C. (1988). An updated paradigm for scale development
incorporating unidimensionality and its assessment. Journal of Marketing Research,
103(3) 186-192.
Goodman, J. K., Cryder, C. E., & Cheema, A. (2013). Data collection in a flat world: The
strengths and weaknesses of mechanical Turk samples. Behavioral Decision Making,
26(3), 213–224.
Grunig, J. E. (2000). Collectivism, collaboration, and societal corporatism as core professional
values in public relations. Journal of Public Relations Research, 12(1), 23-48.
Grunig, J. E., & Huang, Y.-H. (2000). From organizational effectiveness to relationship
indicators: Antecedents of relationships, public relations strategies, and relationship
outcomes. In J. A. Ledingham & S. D. Bruning (Eds.), Public relations as relationship
management: A relational approach to public relations (pp. 23–53). Mahwah, NJ:
Lawrence Erlbaum Associates.
Grunig, J. E., & Repper, F. C. (1992). Strategic management, publics, and issues. In J. E. Grunig
(Ed.), Excellence in public relations and communication management: Contributions to
effective organizations (pp.117–157). Mahwah, NJ: Lawrence Erlbaum Associates.
Gudykunst, W. B. (1983). Uncertainty reduction and predictability of behavior in low‐and high‐
context cultures: An exploratory study. Communication Quarterly, 31(1), 49-55.
Gudykunst, W. B. (1985). A model of uncertainty reduction in intercultural encounters. Journal
of Language and Social Psychology, 4(2), 79-98.
Gudykunst, W. B., Yang, S. M., & Nishida, T. (1985). A cross-cultural test of uncertainty
reduction theory: Comparisons of acquaintances, friends, and dating relationships in
Japan, Korea, and the United States. Human Communication Research, 11(3), 407-455.
98
Haigh, M. M., & Brubaker, P. (2010). Examining how image restoration strategy impacts
perceptions of corporate social responsibility, organization-public relationships, and
source credibility. Corporate Communications: An International Journal, 15(4), 453-468.
Haigh, M. M., & Dardis, F. (2012). The impact of apology on organization–public relationships
and perceptions of corporate social responsibility. Public Relations Journal, 6(1), 1–16.
Hair, J., Black, W., Babin, B., & Anderson, R. (2010). Multivariate data analysis (7th ed.).
Upper Saddle River, NJ: Prentice-Hall.
Hearit, K. M. (1996). The use of counter-attack in apologetic public relations crises: The case of
General Motors vs. Dateline NBC. Public Relations Review, 22(3), 233-248.
Hearit, K. M. (1997). On the use of transcendence as an apologia strategy: The case of Johnson
Controls and its fetal protection policy. Public Relations Review, 23(3), 217-231.
Hearit, K. M. (1999). Newsgroups, activist publics, and corporate apologia: The case of Intel and
its Pentium chip. Public Relations Review, 25(3), 291-308.
Hearit, K. M., & Brown, J. (2004). Merrill Lynch: Corporate apologia and business fraud. Public
Relations Review, 30(4), 459-466.
Hearit, K. M., & Courtright, J. L. (2003). A social constructionist approach to crisis
management: Allegations of sudden acceleration in the Audi 5000. Communication
Studies, 54(1), 79-95.
Heath, R. L. (1990). Corporate issues management: Theoretical underpinnings and research
foundations. Journal of Public Relations Research, 2(1-4), 29-65.
Heath, R. L. (2001). Handbook of public relations. Thousand Oaks, CA: Sage Publications.
Heath, R. L., & Gay, C. D. (1997). Risk communication: Involvement, uncertainty, and control's
effect on information scanning and monitoring by expert stakeholders. Management
Communication Quarterly, 10(3), 342-372.
Heath, R. L., & Millar, D. P. (2003). A rhetorical approach to crisis communication:
Management, communication processes, and strategic responses. In D. P. Millar, & R. L.
Heath (Eds.), Responding to Crisis: A Rhetorical Approach to Crisis Communication (pp.
1-17). Mahwah, NJ: Lawrence Erlbaum Associates.
Heath, R. L., Seshadri, S., & Lee, J. (1998). Risk communication: A two-community analysis of
proximity, dread, trust, involvement, uncertainty, openness/accessibility, and knowledge
on support/opposition toward chemical companies. Journal of Public Relations Research,
10(1), 35-56.
Holladay, S. J. (2009). Crisis communication strategies in the media coverage of chemical
accidents. Journal of Public Relations Research, 21(2), 208-217.

99
Hon, L. C., & Grunig, J. E. (1999). Guidelines for Measuring relationships in public relations.
Institute for Public Relations. Retrieved March 28, February, from
http://painepublishing.com/wp-
content/uploads/2013/10/Guidelines_Measuring_Relationships.pdf
Hu, L. T., & Bentler, P. M. (1999). Cutoff criteria for fit indexes in covariance structure analysis:
Conventional criteria versus new alternatives. Structural Equation Modeling: A
Multidisciplinary Journal, 6(1), 1-55.
Huang, Y.-H. (1997). Public relations, organization-public relationships, and conflict
management. Unpublished doctoral dissertation, University of Maryland, College Park.
Huang, Y.-H. (2001). OPRA: A cross-cultural, multiple-item scale for measuring organization-
public relationships. Journal of Public Relations Research, 13(1), 61-90.
Huang, Y.-H. (2008). Trust and relational commitment in corporate crises: The effects of crisis
communicative strategy and form of crisis response. Journal of Public Relations
Research, 20(3), 297-327.
Jin, Y. (2010). Making sense sensibly in crisis communication: How publics’ crisis appraisals
influence their negative emotions, coping strategy preferences, and crisis response
acceptance. Communication Research, 37(4), 522-552.
Jin, Y. (2014). Examining publics' crisis responses according to different shades of anger and
sympathy. Journal of Public Relations Research, 26(1), 79-101.
Jin, Y., Fraustino, J. D., & Liu, B. F. (2016). The scared, the outraged, and the anxious: How
crisis emotions, involvement, and demographics predict publics’ conative coping.
International Journal of Strategic Communication, 10(4), 289-308.
Jin, Y., Liu, B. F., Anagondahalli, D., & Austin, L. (2014). Scale development for measuring
publics’ emotions in organizational crises. Public Relations Review, 40(3), 509-518.
Jin, Y., Pang, A., & Cameron, G. T. (2007). Integrated crisis mapping: Toward a publics-based,
emotion-driven conceptualization in crisis communication. Sphera Publica, 7, 81-95.
Jin, Y., Pang, A., & Cameron, G. T. (2012). Toward a publics-driven, emotion-based
conceptualization in crisis communication: Unearthing dominant emotions in multi-
staged testing of the Integrated Crisis Mapping (ICM) Model. Journal of Public Relations
Research, 24(3), 266-298.
Jo, S. (2006). Measurement of organization–public relationships: Validation of measurement
using a manufacturer–retailer relationship. Journal of Public Relations Research, 18(3),
225-248.

100
Jo, S., Hon, L., & Brunner, B. R. (2005). Organisation-public relationships: Measurement
validation in a university setting. Journal of Communication Management, 9(1), 14-27.
Kaiser, H. F. (1960). The application of electronic computers to factor analysis. Educational and
Psychological Measurement, 20(1), 141-151.
Kaiser, H. F. (1974). An index of factorial simplicity. Psychometrika, 39(1), 31-36.
Kalavar, S., & Mysore, M. (2017). Are you prepared for a corporate crisis? McKinsey Quarterly.
Retrieved from https://www.mckinsey.com/business-functions/risk/our-insights/are-you-
prepared-for-a-corporate-crisis.
Kees, J., Berry, C., Burton, S., & Sheehan, K. (2017). An analysis of data quality: Professional
panels, student subject pools, and Amazon's Mechanical Turk. Journal of Advertising,
46(1), 141-155.
Keh, H. T., & Xie, Y. (2009). Corporate reputation and customer behavioral intentions: The roles
of trust, identification and commitment. Industrial Marketing Management, 38(7), 732–
742.
Kellermann, K., & Reynolds, R. (1990). When ignorance is bliss: The role of motivation to
reduce uncertainty in uncertainty reduction theory. Human Communication Research,
17(1), 5-75.
Kennedy, K. A., & Benoit, W. L. (1997). The newt Gingrich book deal controversy: Self‐
defense rhetoric. Southern Journal of Communication, 62(3), 197-216.
Kent, M. L., & Taylor, M. (2002). Toward a dialogic theory of public relations. Public Relations
Review, 28(1), 21-37.
Ki, E.-J., & Brown, K. A. (2013). The effects of crisis response strategies on relationship quality
outcomes. The Journal of Business Communication, 50(4), 403-420.
Ki, E.-J., & Hon, L. C. (2007a). Testing the linkages among the organization–public relationship
and attitude and behavioral intentions. Journal of Public Relations Research, 19(1), 1-23.
Ki, E.-J., & Hon, L. C. (2007b). Reliability and validity of organization-public relationship
measurement and linkages among relationship indicators in a membership organization.
Journalism & Mass Communication Quarterly, 84(3), 419-438.
Ki, E.-J., & Hon, L. C. (2008). A measure of relationship cultivation strategies. Journal of Public
Relations Research, 21(1), 1-24.
Ki, E.-J., & Shin, J. H. (2006). Status of organization–public relationship research from an
analysis of published articles, 1985–2004. Public Relations Review, 32(2), 194-195.

101
Ki, E.-J., & Shin, J.-H. (2015). The status of organization-public relationship research from an
analysis of published articles between 1985–2013. In E.-J. Ki, J.-N. Kim, & J. A.
Ledingham (Eds.), Public relations as relationship management: A relational approach
to the study and practice of public relations (2nd ed., pp. 28–45). New York, NY: Taylor
& Francis.
Kim, H. J., & Cameron, G. T. (2011). Emotions matter in crisis: The role of anger and sadness in
the publics’ response to crisis news framing and corporate crisis response.
Communication Research, 38(6), 826-855.
Kim, H. K., & Niederdeppe, J. (2013). The role of emotional response during an H1N1 influenza
pandemic on a college campus. Journal of Public Relations Research, 25(1), 30-50.
Kim, J., & Chan‐Olmsted, S. M. (2005). Comparative effects of organization–public
relationships and product‐related attributes on brand attitude. Journal of Marketing
Communications, 11(3), 145-170.
Kim, S. (2014). The role of prior expectancies and relational satisfaction in crisis. Journalism &
Mass Communication Quarterly, 91(1), 139-158.
Kim, S., & Sung, K. H. (2014). Revisiting the effectiveness of base crisis response strategies in
comparison of reputation management crisis responses. Journal of Public Relations
Research, 26(1), 62-78.
Kim, S., Zhang, X. A., & Zhang, B. W. (2016). Self-mocking crisis strategy on social media:
Focusing on Alibaba chairman Jack Ma in China. Public Relations Review, 42(5), 903-
912.
Kim, Y. (2016). Understanding publics’ perception and behaviors in crisis communication:
Effects of crisis news framing and publics’ acquisition, selection, and transmission of
information in crisis situations. Journal of Public Relations Research, 28(1), 35-50.
Kline, P. (1994). An easy guide to factor analysis. Abingdon, UK: Routledge.
Kline, R. B. (2015). Principles and practice of structural equation modeling. New York, NY:
Guilford Publications.
Knobloch, L. K., & Solomon, D. H. (1999). Measuring the sources and content of relational
uncertainty. Communication Studies, 50(4), 261-278.
Knobloch, L. K., & Solomon, D. H. (2002). Information seeking beyond initial interaction:
Negotiating relational uncertainty within close relationships. Human Communication
Research, 28(2), 243-257.
Kramer, R. M. (1999). Trust and distrust in organizations: Emerging perspectives, enduring
questions. Annual Review of Psychology, 50(1), 569-598.

102
Krikelas, J. (1983). Information-seeking behavior: Patterns and concepts. Drexel Library
Quarterly, 19(2), 5-20.
Lachlan, K. A., Spence, P. R., & Nelson, L. D. (2010). Gender differences in negative
psychological responses to crisis news: The case of the I-35W collapse. Communication
Research Reports, 27(1), 38-48.
Laufer, D., Gillespie, K., McBride, B., & Gonzalez, S. (2005). The role of severity in consumer
attributions of blame: Defensive attributions in product-harm crises in Mexico. Journal of
International Consumer Marketing, 17(2-3), 33-50.
Lawshe, C. H. (1975). A quantitative approach to content validity. Personnel Psychology, 28(4),
563-575.
Lazarus, R. S. (1991). Progress on a cognitive-motivational-relational theory of emotion.
American Psychologist, 46(8), 819.
Ledingham, J. A. (2003). Explicating relationship management as a general theory of public
relations. Journal of Public Relations Research, 15(2), 181-198.
Ledingham, J. A., & Bruning, S. D. (1998). Relationship management in public relations:
Dimensions of an organization-public relationship. Public Relations Review, 24(1), 55-
65.
Lee, B. K. (2004). Audience-oriented approach to crisis communication: A study of Hong Kong
consumers’ evaluation of an organizational crisis. Communication Research, 31(5), 600-
618.
Lee, S. Y. (2016, October 11). Samsung's exploding phones fiasco could cost the company $17
billion. Reuters. Retrieved from https://www.reuters.com/article/us-samsung-elec-
smartphones-costs-idUSKCN12B0FX.
Lerbinger, O. (1997). The crisis manager: Facing risk and responsibility. Mahwah, NJ:
Lawrence Erlbaum Associates.
Lewis, R. and Booms B.H. (1983), The marketing aspect of service quality, in Berry, L.,
Shostack, G. and Upah, G. (Eds), Emerging Perspective of Services Marketing (pp. 99-
107), Chicago, IL: American Marketing Association.
Liu, B. F., Bartz, L., & Duke, N. (2016). Communicating crisis uncertainty: A review of the
knowledge gaps. Public Relations Review, 42(3), 479-487.
Ma, L., & Zhan, M. (2016). Effects of attributed responsibility and response strategies on
organizational reputation: A meta-analysis of situational crisis communication theory
research. Journal of Public Relations Research, 28(2), 102-119.

103
MacCallum, R. C., Browne, M. W., & Sugawara, H. M. (1996). Power analysis and
determination of sample size for covariance structure modeling. Psychological Methods,
1(2), 130-149.
Mason, W., & Suri, S. (2012). Conducting behavioral research on Amazon’s Mechanical Turk.
Behavior Research Methods, 44(1), 1-23.
McDonald, L. M., Sparks, B., & Glendon, A. I. (2010). Stakeholder reactions to company crisis
communication and causes. Public Relations Review, 36(3), 263-271.
Melber, B. D., Nealey, S. M., Hammersla, J. and Rankin, W. L. (1977). Nuclear Power and the
Public: Analysis of Collected Survey Research. Seattle, WA: Battelle Memorial Institute,
Human Affairs Research Centers.
Meng, J., & Berger, B. (2013). An integrated model of excellent leadership in public relations:
Dimensions, measurement, and validation. Journal of Public Relations Research, 25(2),
141-167.
Mitroff, I. I. (1988). Crisis management: Cutting through the confusion. MIT Sloan Management
Review, 29(2), 15-20.
Mitroff, I. I. (1994). Crisis management and environmentalism: A natural fit. California
Management Review, 36(2), 101-113.
Mitroff, I. I., Shrivastava, P., & Udwadia, F. E. (1987). Effective crisis management. Academy of
Management Perspectives, 1(4), 283-292.
Muralidharan, S., Dillistone, K., & Shin, J. H. (2011). The Gulf Coast oil spill: Extending the
theory of image restoration discourse to the realm of social media and beyond petroleum.
Public Relations Review, 37(3), 226-232.
Myers, S. A., & Knox, R. L. (2001). The relationship between college student information
seeking behaviors and perceived instructor verbal responses. Communication Education,
50(4), 343–356.
Netemeyer, R. G., Bearden, W. O., & Sharma, S. (2003). Scaling procedures: Issues and
applications. Thousand Oaks, CA: Sage Publications.
Neuliep, J. W., & Grohskopf, E. L. (2000). Uncertainty reduction and communication
satisfaction during initial interaction: An initial test and replication of a new axiom.
Communication Reports, 13(2), 67-77.
Ni, L., & Wang, Q. (2011). Anxiety and uncertainty management in an intercultural setting: The
impact on organization–public relationships. Journal of Public Relations Research, 23(3),
269-301.
Nunnally, J. C. (1978). Psychometric theory. (2nd ed.) New York, NY: McGraw-Hill.
104
O’Connor, B. P. (2000). SPSS and SAS programs for determining the number of components
using parallel analysis and Velicer’s MAP test. Behavior Research Methods,
Instrumentation, and Computers, 32, 396–402.
O’Neil, J. (2007). The link between strong public relationships and donor support. Public
Relations Review, 33(1), 99-102.
Parks, M. R., & Adelman, M. B. (1983). Communication networks and the development of
romantic relationships: An expansion of uncertainty reduction theory. Human
Communication Research, 10(1), 55-79.
Pasadeos, Y., Berger, B., & Renfro, R. B. (2010). Public relations as a maturing discipline: An
update on research networks. Journal of Public Relations Research, 22(2), 136-158.
Paschall, R. (1992). Critical incident management. Chicago, IL: University of Illinois at Chicago
Press.
Pett, M. A., Lackey, N. R., & Sullivan, J. J. (2003). Making sense of factor analysis: The use of
factor analysis for instrument development in health care research. London, UK: Sage
Publications.
Planalp, S. & Honeycutt, J. M. (1985). Events that increase uncertainty in personal relationships.
Human Communication Research, 11(4), 593-604.
Rawlins, B. (2006). Prioritizing Stakeholders for Public Relations. The Institute for Public
Relations. Retrieved February 26, 2019, from http://painepublishing.com/wp-
content/uploads/2014/03/prioritizing-stakeholders-Rawlins.pdf.
Ray, S. J. (1999). Strategic communication in crisis management: Lessons from the airline
industry. Westport, CT: Quorum Books.
Redmond, M. V. (2015). Uncertainty reduction theory. English Technical Reports and White
Papers, 1-44.
Reynolds, B., & Seeger, M. W. (2005). Crisis and emergency risk communication as an
integrative model. Journal of Health Communication, 10(1), 43-55.
Riley, C. (2017, September 29). Volkswagen's diesel scandal costs hit $30 billion. CNN Money.
Retrieved from https://money.cnn.com/2017/09/29/investing/volkswagen-diesel-cost-30-
billion/index.html.
Rutten, L. J. F., Squiers, L., & Hesse, B. (2006). Cancer-related information seeking: Hints from
the 2003 Health Information National Trends Survey (HINTS). Journal of Health
Communication, 11(1), 147-156.
105
Sallot, L. M., Lyon, L. J., Acosta-Alzuru, C., & Ogata Jones, K. (2003). From aardvark to zebra:
A new millennium analysis of theory development in public relations academic journals.
Journal of Public Relations Research, 15(1), 27-90.
Seeger, M. W. (2006). Best practices in crisis communication: An expert panel process. Journal
of Applied Communication Research, 34(3), 232-244.
Seltzer, T., & Zhang, W. (2010). Toward a model of political organization–public relationships:
Antecedent and cultivation strategy influence on citizens' relationships with political
parties. Journal of Public Relations Research, 23(1), 24-45.
Shoemaker, P. J., Tankard Jr, J. W., & Lasorsa, D. L. (2004). How to build social science
theories. Thousand Oaks, CA: Sage Publications.
Sisco, H. F. (2012). Nonprofit in crisis: An examination of the applicability of situational crisis
communication theory. Journal of Public Relations Research, 24(1), 1-17.
Smith, D. (1990). Beyond contingency planning: Towards a model of crisis management.
Industrial Crisis Quarterly, 4(4), 263-275.
Spence, P. R., Lachlan, K. A., & Burke, J. M. (2007). Adjusting to uncertainty: Coping strategies
among the displaced after Hurricane Katrina. Sociological Spectrum, 27(6), 653-678.
Stephens, K. K., Malone, P. C., & Bailey, C. M. (2005). Communication with stakeholders
during a crisis: Evaluating message strategies. Journal of Business Communication,
42(4), 390–419.
Sturges, D. L. (1994). Communicating through crisis: A strategy for organizational survival.
Management Communication Quarterly, 7(3), 297-316.
Toth, E. L. (2000). From personal influence to interpersonal influence: A model for relationship
management. In J. A. Ledingham & S. D. Bruning (Eds.), Public relations as relationship
management: A relational approach to the study and practice of public relations (pp.
205-219). Mahwah, NJ: Lawrence Erlbaum Associates.
Turban, D. B., & Cable, D. M. (2003). Firm reputation and applicant pool characteristics.
Journal of Organizational Behavior, 24(6), 733–751.
Ulmer, R. R., Sellnow, T. L., & Seeger, M. W. (2011). Effective crisis communication: Moving
from crisis to opportunity. Thousand Oaks, CA: Sage Publications.
van Zoonen, W., & van der Meer, T. (2015). The importance of source and credibility perception
in times of crisis: Crisis communication in a socially mediated era. Journal of Public
Relations Research, 27(5), 371-388.
Vigsø, O., & Odén, T. (2016). The dynamics of sensemaking and information seeking in a crisis
situation. Nordicom Review, 37(1), 71-84.
106
Ware, B. L., & Linkugel, W. A. (1973). They spoke in defense of themselves: On the generic
criticism of apologia. Quarterly Journal of Speech, 59(3), 273-283.
Weick, K. E. (1988). Enacted sensemaking in crisis situations. Journal of Management Studies,
25(4), 305-317.
Weigel, D. J., Brown, C., & O'Riordan, C. K. (2011). Everyday expressions of commitment and
relational uncertainty as predictors of relationship quality and stability over time.
Communication Reports, 24(1), 38-50.
Weiler, A. (2005). Information-seeking behavior in generation Y students: Motivation, critical
thinking, and learning theory. The Journal of Academic Librarianship, 31(1), 46-53.
Weiner, B. (1986). Attribution, emotion, and action. In R. M. Sorrentino & E. T. Higgins (Eds.),
Handbook of motivation and cognition: Foundations of social behavior (pp. 281-312).
New York, NY: Guilford Press.
Wheaton, B., Muthen, B., Alwin, D. F., & Summers, G. F. (1977). Assessing reliability and
stability in panel models. Sociological Methodology, 8, 84-136.
Worthington, R. L., & Whittaker, T. A. (2006). Scale development research: A content analysis
and recommendations for best practices. The Counseling Psychologist, 34(6), 806-838.
Yang, S.-U. (2005). The effect of organization-public relationships on reputation from the
perspective of publics. Unpublished doctoral dissertation, University of Maryland,
College Park.
Zhou, Z., Ki, E. J., & Brown, K. A. (2019). A measurement of perceived severity in
organizational crises: A multidimensional scale development and validation. Journal of
International Crisis and Risk Communication Research, 2(1), 39-61.

107
APPENDIX A: CONTENT VALIDITY RATIO FORM
Panel Survey
The purpose of this survey is to determine the content validity of the Crisis-Induced
Severity Scale quantitatively. Perceived crisis severity is defined as “stakeholders’ lack of
confidence that their personal well-being and interactions with the organization will be positive
in both a short and long term.” The construct contains three dimensions: protection uncertainty,
process uncertainty, and relationship uncertainty. They are defined separately below.
Protection uncertainty: stakeholders’ lack of confidence of how to protect themselves from the
harm inflicted by the crisis.
Process uncertainty: stakeholders’ lack of confidence that the organization can handle the crisis
properly.
Relationship uncertainty: stakeholders’ lack of confidence that their interaction with the
organization can continue.
Instruction: For each dimension, please indicate whether it is essential, useful but not essential,
or not necessary to measure crisis-induced uncertainty.
Essential Useful but not
Essential
Not Necessary
Protection Uncertainty
Process Uncertainty
Relationship Uncertainty
Instruction: For each item, please indicate whether it is essential, useful but not essential, or not
necessary to measure the proposed dimensions. The items will be evaluated by research
participants based on a 7-point scale ranging from 1 (Extremely Uncertain) to 7 (Extremely
Certain)
Essential Useful but not
Essential
Not Necessary
Protection Uncertainty
I will not be affected by the incident?
I know the way to avoid harm?
I know the way to protect myself?

108
My family will not suffer from the
incident?
I can help myself during the incident?
The incident will not influence my life?
Process Uncertainty
The organization can fix the problem.
The organization will handle the
incident properly.
The organization will not make the
situation worse.
The organization has the ability to
solve the crisis.
The organization will do whatever they
can to make it right.
The organization will treat people
involved in the incident appropriately.
Relationship Uncertainty
The organization can keep providing
quality service or product.
The organization is a responsible
organization.
The brand is a trustworthy name to me.
The organization has a strong
leadership.
I want to use the organization’s
product/service.
I want to maintain a relationship with
the organization.

109
APPENDIX B: THE TWO REAL CRISIS SCENARIOS
Facebook Data Breach Crisis
Cambridge Analytica, a British political consulting firm, began collecting Facebook user
data from 2014. So far, it is reported that 87 million (70.6 million in the US) Facebook users’
identifiable personal information has been stolen. The data was used to attempt to influence voter
opinions on behalf of politicians who hired Cambridge Analytica.
A few years ago, a researcher created a personality quiz on Facebook and asked
participants to download an app. When Facebook users downloaded the app, they gave the
researcher access to their friends’ data. Initially, 270,000 Facebook users agreed and later it
caused 87 million people’s information being scraped. The researcher later gave all the
information to Cambridge Analytica, and the company used the information to serve its clients in
political research.
Facebook published a post saying it has suspended Cambridge Analytica from its
platform on March 16, 2018. It insisted there was no data breach, but the data was used in an
unauthorized manner. The linked information includes people’s public profiles, age, gender,
friends, and where they live.
United Airlines Passenger Removal Crisis
A passenger was forcibly dragged out of a plane operated by United Airlines on April 9,
2017. Aviation security officers were called by flight attendants to remove the passenger. One of
the passengers on the plane video recorded the incident and posted the video on YouTube, which
soon went viral on social media.
Prior to the confrontation, the manager offered vouchers to passengers to voluntarily take
the next flight and make room for four United Airlines employees, however, none passengers
took the offer. United Airlines then randomly removed four passengers, and three passengers
involuntarily followed the order. David Dao, the fourth passenger, then was forcibly removed
from the plane.
United Airlines CEO Oscar Munoz issued a public statement next morning, justifying the
action of removing the passenger. He also sent an internal email to all United Airlines
employees, commending crew members action and criticizing the passenger. Criticized by media
and the public, Oscar Munoz issued a second statement two day after, apologizing and promising
such an incident would never happen again.

110
APPENDIX C: THE FICTITIOUS CRISIS SCENARIO
Fifteen cases of E. coli infection have been traced to a Nothing But Beef restaurant in
Georgia. According to Jonathan Modie, the Georgia Department of Public Health spokesman,
between Feb. 8-11, 15 people in Swansea, GA, reported gastrointestinal problems, including
nausea, diarrhea, and fever after dining at a local restaurant, Nothing But Beef. Swansea is a
typical college town in Georgia, and the business is located on campus. All 15 people are
students at Swansea Community College.
All victims have been hospitalized, and they are in stable condition. “Many people
affected with Shiga toxin E. coli have not sought medical care, so the number of people who are
showing symptoms may be higher,” Modie said in a statement. “Health officials want people
who have dined at Nothing But Beef restaurants nationwide in January and February, and
became ill, to see their health-care provider.” E. coli usually strikes around three or four days
after being ingested, but people can start showing symptoms from two to eight days after
ingestion. Usually, there’s light fever, gastrointestinal issues and diarrhea lasting five to seven
days.
It is not clear what caused the outbreak. “CDC (Centers for Disease Control and
Prevention) officials are working very hard to identify the source, but it’s still too early to
confirm what caused the outbreak. It normally takes about two weeks to finish the investigation”
said Modie. “The CDC is also advising that consumers not dine at the Nothing But Beef
restaurants in Swansea, GA.”
Nothing But Beef is a fast food chain that has over 200 restaurants in 32 states. Tony
Sanders, the company’s CEO, released a statement today: “Food safety is our priority. We are
closely monitoring this situation and cooperating with state and federal public health authorities
as they further investigate the illnesses.”

111
APPENDIX D: IRB CERTIFICATE