Embed Size (px)
Citation preview

1
A Brief on Reimagining State Support for Professional Learning
vu.edu/TNEdResearchAlliance | 615.322.5538 | [email protected] | @TNEdResAlliance
Exploring Teacher Improvement in Tennessee
IntroductionIt is widely recognized that boosting student educational outcomes requires improving the quality of classroom instruction. In Tennessee, a state which has recently been recognized for success in improving student achievement, many policy changes have been driven by the broad scholarly consensus that being taught by a highly effective teacher can improve long-term outcomes for students (e.g., Chetty et al., 2011; Chetty, Friedman, Rockoff, 2014; Rivkin, Hanushek, & Kain, 2005; Rockoff, 2004).
This focus on teacher effectiveness makes good sense. Yet, there is an enduring narrative in the broader policy (and research) world that teacher effectiveness is a fixed and portable characteristic of an individual teacher – in other words, that a teacher is either effective or not. Such a narrative implies that the best policy approach to improving teacher effectiveness would be to attract and retain “high-quality” teachers and remove “low-quality” teachers from the classroom.
In this brief, we show that in Tennessee, teacher effectiveness is not fixed: teachers continue to develop their effectiveness throughout their
careers. Such patterns suggest that investments in teacher development are likely more important than efforts to change the composition of the teaching workforce.
We leverage the Tennessee Education Research Alliance’s longitudinal data on teachers and students from across the state over the past decade to understand the patterns of instructional improvement that have helped to drive recent gains in student outcomes in Tennessee.
We find four key results about teacher improvement in Tennessee:
Teachers in Tennessee are improving over the course of their careers on average. This holds true across subjects and across measures of teacher effectiveness.
Teacher improvement varies substantially by district and school. In other words, in some places, teachers are improving (on average) at much greater rates than in others.
Teachers in Tennessee appear to improve at about the same rates in higher-poverty schools as in lower-poverty schools.
Teacher improvement appears to be steeper in more recent years.
1
2
3
4
John P. Papay and Mary E. Laski Brown University
April 2018

2
Throughout this brief, we present estimates in standard deviations (of student test scores or teacher evaluation scores). In the Tennessee context, one standard deviation in TCAP3 test scores translates to roughly 40 points on the test. The gap between economically disadvantaged students and those who do not qualify for free- or reduced-price lunch is about 20-25 TCAP points, or about 0.5-0.6 standard deviations. Estimates suggest that one year of learning in grades 4-8 improves test scores by about 0.3 to 0.35 standard deviations, on average.
We estimate, for example, that teachers improve their ability to improve mathematics test scores by about 0.20 standard deviations over the first 10 years of their careers. This translates to approximately 8 points on the TCAP test or approximately 5 months of learning. It also reflects the difference between a median teacher in the state and one at the 75th percentile.
For classroom observation ratings, one standard deviation relates to about 0.6 points on the TEAM rubric. In other words, it reflects a teacher moving from the state median (3.98) to the 85th percentile of teacher effectiveness (4.55).
Many of the policies that have captured national attention over the past decade tend to view teacher effectiveness narrowly as a fixed and portable characteristic of an individual teacher. Research in Tennessee and beyond highlights the limitations of this interpretation.
Several recent studies have shown that teacher effectiveness is not fixed. Instead, teachers improve their performance over the course of their careers, and policy efforts can promote more rapid improvement. However, while the American public school system invests a great deal in teacher professional development (PD) efforts, research suggests that formal PD, as widely implemented across the United States, has not proven to be particularly effective (e.g., Garet et al., 2008, 2016; Glazerman et al., 2010; Jacob & Lefgren, 2004; TNTP, 2015).
Improving educational outcomes at scale and reducing educational inequality requires policy efforts designed to promote teacher development. This is not to say that improved teacher recruitment and preparation or efforts to selectively retain the most effective teachers are not important. However, given the enormous scale of the teaching workforce (about 6% of college graduates in Tennessee are K-12 classroom teachers), efforts to improve the effectiveness of current teachers are essential to improve educational outcomes across the state.
For this analysis, we use data on teachers across the state of Tennessee over the past decade. We are particularly interested in what economists call the “within-teacher returns to teaching experience” – in other words, how much teachers improve their practice as they gain experience in the classroom. Here, we want to estimate how individual teachers improve over the course of their careers. We are not comparing the effectiveness of a novice teacher to a 10-year veteran; instead, we seek to estimate how the effectiveness of the 10-year veteran compares to her own effectiveness as a novice.1 When we use the term “teacher improvement” throughout this brief, we refer to these within-teacher returns to experience.
This analysis is limited to available measures of teacher effectiveness. We look at student test scores in mathematics, English language arts, science, and social studies. We also examine ratings of teachers’ practice from the teacher evaluation system, focusing on teachers’ classroom observation scores and teacher value-added ratings (TVAAS).2 While we recognize that these measures do not represent the full scope of competencies we expect a teacher to develop over her career, they can still provide a clear picture of growth over time. We also focus specifically on teachers in grades 4 through 8 in our test score analysis, but our research suggests similar patterns for high school teachers.
How do we measure teacher improvement over time? Standard deviations
BACKGROUND

3
In Figure 1, we show the estimated improvement trajectory for Tennessee teachers across the four tested subjects. Again, these illustrate how much we estimate an average teacher in the state improves her effectiveness throughout her career. There are four clear patterns that emerge.
• Teachers improve much more rapidly during the first few years of their careers. For example, about 56% of a teacher’s total improvement occurs during the first three years on the job. Figure 2 shows this improvement in math.
• The improvement in the first three years is substantial. Statewide, the average novice teacher is at the 36th percentile in the state teacher effectiveness distribution, considerably less effective than the average veteran teacher. However, over the first three years, a new teacher improves from the 36th percentile in the state to the 54th percentile, on average.
• Nonetheless, teachers appear to continue to improve throughout their careers. For example, we estimate that roughly 20 to 30% of a teacher’s overall improvement occurs between years 5 and 25. Figure 2 shows this improvement (23%) in math. Much of this improvement occurs between years 5 and 10, but we do see continued improvement beyond the 10th year of teaching.
• Teachers in general improve more over the course of their careers in mathematics and science than in reading and social studies.
While direct comparisons are difficult given differences in data and methodological approaches, teacher improvement in Tennessee appears to be greater than those in other states and school districts that have been studied, particularly in mathematics (see Atteberry, Loeb, & Wyckoff, 2015; Papay & Kraft, 2015).
KEY FINDINGS
TEACHERS IN TENNESSEE ARE IMPROVING OVER THE COURSE OF THEIR CAREERS ON AVERAGE1
FIGURE 1
TEACHER IMPROVEMENT ON STANDARDIZED TCAP SCORES
0
0.05
0.1
0.15
0.2
0.25
0 5 10 15 20 25 30
TCA
P SC
ORE
S (S
TD.)
YEARS OF EXPERIENCE
Math
Science
SocialStudies
Reading

4
In Figure 3, we show that the pattern of improvement is similar for teachers’ classroom observation ratings. We again see rapid improvement early in the career, although here we observe a more pronounced flattening of the trajectory. In other words, teachers do not appear to continue improving their classroom observation scores much beyond year 10. This could, of course, result from ceiling effects in the ratings themselves – teachers cannot score above a 5 on the observation scale. Interestingly, we also see more substantial improvement in the Instruction domain than in Environment or Planning. Novice teachers do not score noticeably lower in Instruction than in other domains. Thus, these greater improvements over time may imply that instructional skills are more malleable than skills in the other domains.
FIGURE 2
FIGURE 3
23%
56%
TEACHER IMPROVEMENT THROUGHOUT THE CAREER (MATHEMATICS)
0
0.05
0.1
0.15
0.2
0.25
0 5 10 15 20 25 30
TCA
P SC
ORE
S (S
TD.)
YEARS OF EXPERIENCE
Math
TEACHER IMPROVEMENT ON TEACHER OBSERVATION SCORES
YEARS OF EXPERIENCE
Overall AverageInstructionIndicator Average
Environment
Planning
OBS
ERV
ATI
ON
SC
ORE
S (S
TD.)
0.0
0.1
0.2
0.3
0.4
0.5
0.6
0.7
0.8
0.9
1.0
0 5 10 15 20 25 30

5
The figures above illustrate patterns on average in the state. However, past research has documented clearly that some teachers improve more than others, and that some schools promote more teacher development than others (see Kraft & Papay, 2014). We find this same pattern in Tennessee.
Teachers vary substantially in their rates of improvement, but 40% of this variation is explained by the school in which teachers teach. In other words, almost half of all variation in teacher improvement is explained not by the teacher herself but by the school in which she teaches. In some schools, then, teachers systematically improve at greater rates than in others. We document two examples of this.
First, in Figure 4, we see that elementary school teachers improve at greater rates than middle school teachers in all subjects except science.
TEACHER IMPROVEMENT VARIES SUBSTANTIALLY BY DISTRICT AND SCHOOL2
FIGURE 4
TEACHER IMPROVEMENT ON STANDARDIZED TCAP SCORES BY GRADE-LEVELSOLID = ELEMENTARY • DOTTED = MIDDLE
0
0.05
0.1
0.15
0.2
0.25
0 5 10 15 20 25 30
TCA
P SC
ORE
S (S
TD.)
YEARS OF EXPERIENCE
0
0.05
0.1
0.15
0.2
0.25
0 5 10 15 20 25 30
TCA
P SC
ORE
S (S
TD.)
YEARS OF EXPERIENCE
0
0.05
0.1
0.15
0.2
0.25
0 5 10 15 20 25 30
TCA
P SC
ORE
S (S
TD.)
YEARS OF EXPERIENCE
0
0.05
0.1
0.15
0.2
0.25
0 5 10 15 20 25 30
TCA
P SC
ORE
S (S
TD.)
YEARS OF EXPERIENCE
Math
Science Social Studies
Reading

6
We also examine improvement trajectories in different districts. In Figure 5, we present the trajectories for the four largest districts in the state (we do not identify specific districts). Here, we also illustrate that novice teachers in some districts are more effective than others. We see that in District A, for example, teachers begin their careers more effective and grow more rapidly than teachers in other districts. By contrast, in District D, performance does indeed appear to plateau. We see similar results when looking at teacher observation scores. Understanding the reasons why teachers in some districts tend to improve more rapidly than those in other districts is the focus of ongoing research at TERA.
FIGURE 5
TEACHER IMPROVEMENT ON STANDARDIZED TCAP MATH SCORES BY DISTRICT
YEARS OF EXPERIENCE
A
Rest of StateB
C
D
TCA
P SC
ORE
S (S
TD.)
-0.05
0
0.05
0.1
0.15
0.2
0.25
0.3
0 2 4 6 8 10 12 14 16 18 20

7
In Figure 6, we illustrate improvement trajectories for teachers in higher- and lower-poverty schools.4 While in all subjects the overall growth trajectories are similar between teachers in higher- and lower-poverty schools, we see slightly steeper improvements over time for teachers in higher-poverty schools, a pattern that is particularly pronounced in mathematics.
TEACHERS IN TENNESSEE APPEAR TO IMPROVE AT ABOUT THE SAME RATES IN HIGHER-POVERTY SCHOOLS AS IN LOWER-POVERTY SCHOOLS3
FIGURE 6
TEACHER IMPROVEMENT ON STANDARDIZED TCAP SCORES BY POVERTY LEVEL SOLID = HIGH-POVERTY • DOTTED = LOW-POVERTY
0
0.05
0.1
0.15
0.2
0.25
0 5 10 15 20 25 30
TCA
P SC
ORE
S (S
TD.)
YEARS OF EXPERIENCE
0
0.05
0.1
0.15
0.2
0.25
0 5 10 15 20 25 30
TCA
P SC
ORE
S (S
TD.)
YEARS OF EXPERIENCE
0
0.05
0.1
0.15
0.2
0.25
0 5 10 15 20 25 30
TCA
P SC
ORE
S (S
TD.)
YEARS OF EXPERIENCE
0
0.05
0.1
0.15
0.2
0.25
0 5 10 15 20 25 30
TCA
P SC
ORE
S (S
TD.)
YEARS OF EXPERIENCE
Math
Science Social Studies
Reading
8
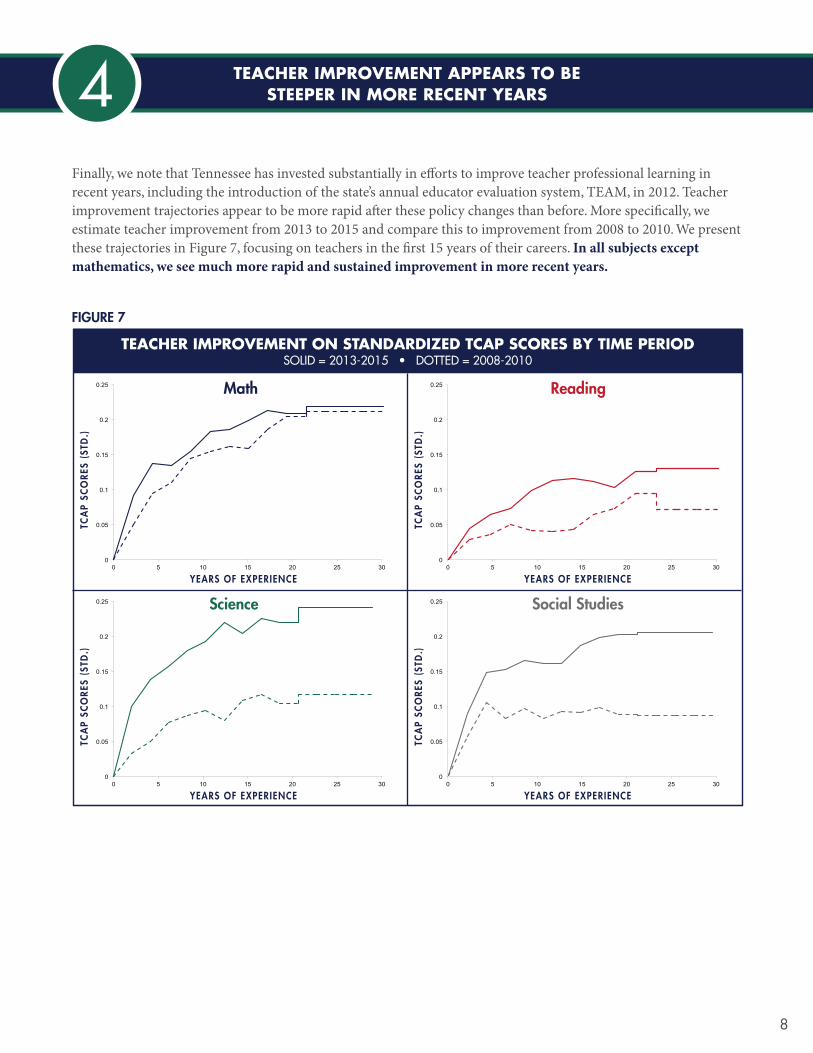
Finally, we note that Tennessee has invested substantially in efforts to improve teacher professional learning in recent years, including the introduction of the state’s annual educator evaluation system, TEAM, in 2012. Teacher improvement trajectories appear to be more rapid after these policy changes than before. More specifically, we estimate teacher improvement from 2013 to 2015 and compare this to improvement from 2008 to 2010. We present these trajectories in Figure 7, focusing on teachers in the first 15 years of their careers. In all subjects except mathematics, we see much more rapid and sustained improvement in more recent years.
TEACHER IMPROVEMENT APPEARS TO BE STEEPER IN MORE RECENT YEARS4
FIGURE 7
TEACHER IMPROVEMENT ON STANDARDIZED TCAP SCORES BY TIME PERIOD SOLID = 2013-2015 • DOTTED = 2008-2010
0
0.05
0.1
0.15
0.2
0.25
0 5 10 15 20 25 30
TCA
P SC
ORE
S (S
TD.)
YEARS OF EXPERIENCE
0
0.05
0.1
0.15
0.2
0.25
0 5 10 15 20 25 30
TCA
P SC
ORE
S (S
TD.)
YEARS OF EXPERIENCE
0
0.05
0.1
0.15
0.2
0.25
0 5 10 15 20 25 30
TCA
P SC
ORE
S (S
TD.)
YEARS OF EXPERIENCE
0
0.05
0.1
0.15
0.2
0.25
0 5 10 15 20 25 30
TCA
P SC
ORE
S (S
TD.)
YEARS OF EXPERIENCE
Math
Science Social Studies
Reading
9
We find that teachers in Tennessee are improving throughout their careers. This improvement is perhaps greater than we see in other states and more rapid in more recent years. However, there is substantial variation in improvement for teachers across the state. Teachers in some schools and districts improve at much greater rates than others. On the optimistic side, we see more rapid improvement (at least in mathematics) for teachers in higher-poverty schools at all stages of the career.
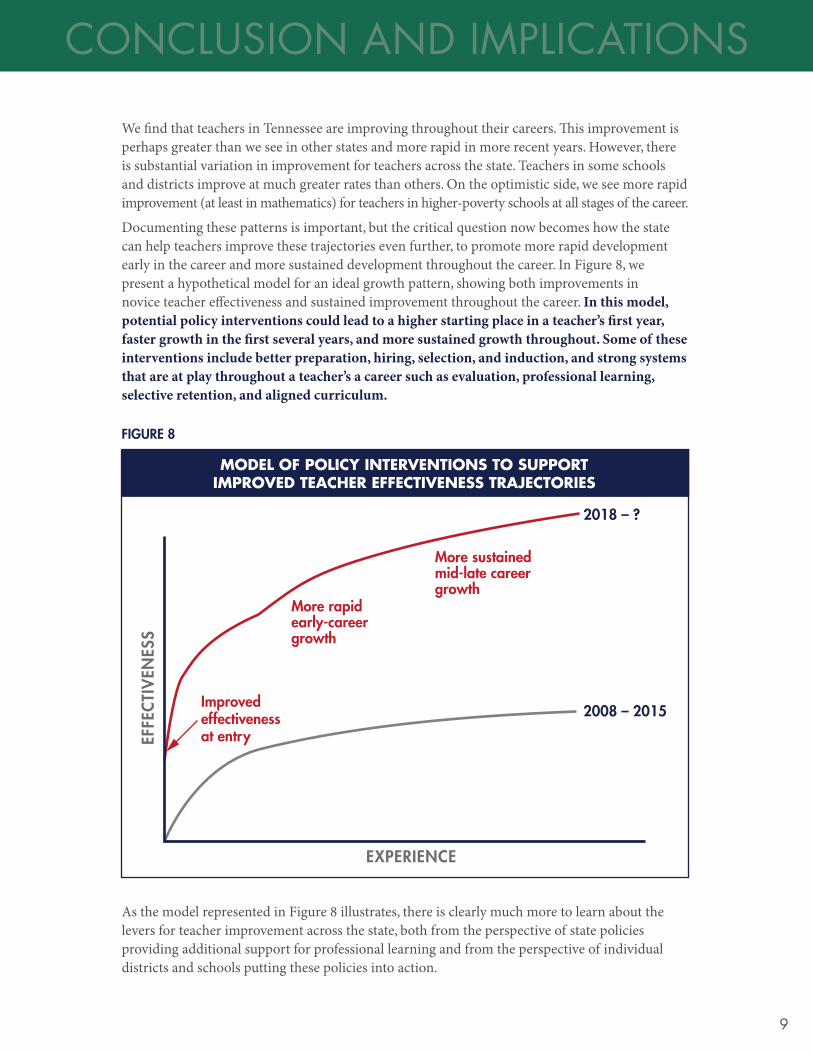
Documenting these patterns is important, but the critical question now becomes how the state can help teachers improve these trajectories even further, to promote more rapid development early in the career and more sustained development throughout the career. In Figure 8, we present a hypothetical model for an ideal growth pattern, showing both improvements in novice teacher effectiveness and sustained improvement throughout the career. In this model, potential policy interventions could lead to a higher starting place in a teacher’s first year, faster growth in the first several years, and more sustained growth throughout. Some of these interventions include better preparation, hiring, selection, and induction, and strong systems that are at play throughout a teacher’s a career such as evaluation, professional learning, selective retention, and aligned curriculum.
As the model represented in Figure 8 illustrates, there is clearly much more to learn about the levers for teacher improvement across the state, both from the perspective of state policies providing additional support for professional learning and from the perspective of individual districts and schools putting these policies into action.
CONCLUSION AND IMPLICATIONS
FIGURE 8
MODEL OF POLICY INTERVENTIONS TO SUPPORT IMPROVED TEACHER EFFECTIVENESS TRAJECTORIES
2018 – ?
2008 – 2015
EXPERIENCE
EFFE
CTI
VEN
ESS
More rapid early-career growth
Improved effectiveness at entry
More sustained mid-late career growth

10
We have some guidance here from the literature. We know from other contexts that teachers improve more when they:
• Work in schools with more effective colleagues (Jackson & Bruegmann, 2009; Sun, Loeb, & Grissom, 2017),
• Remain in their teaching assignment more consistently (Blazar, 2015; Ost, 2014),
• Work in more supportive professional environments with strong school leaders (Kraft & Papay, 2014),
• Work in schools that are more collaborative (Ronfeldt et al., 2014), and
• Participate in a rigorous teacher evaluation system (Taylor & Tyler, 2012).
In Tennessee, we also know that collaborative professional learning efforts, such as the Instructional Partnership Initiative, have been successful in raising teacher effectiveness (Papay, Taylor, Tyler, & Laski, 2016).
State, district, and school leaders should attend both to policies that support more robust professional learning and teacher development and to those that shift the entire distribution up (as seen in Figure 8) – including efforts to improve teacher preparation, support the effectiveness of all educators, and encourage the retention of the state’s most effective teachers.
In upcoming studies, TERA will look to gain insight into how to approach such improved growth in developmental trajectories, including examining some of the instructional improvement strategies identified in Figure 8 and in the literature as potential drivers of sustained growth. Teachers improve much more in certain contexts than others, but what explains these differences? What policies and practices lead to more rapid growth?
Shedding light on these questions is a challenge that TERA will take up over the next few years. This brief is a first step in a series of analyses that we hope can provide more detailed guidance about professional improvement. We seek to document the broad landscape of professional learning opportunities across the state more clearly than previous studies could. In particular, we hope to uncover differences in practices between schools and districts in which teachers are improving rapidly and those in which there is less growth in teacher effectiveness. We believe that these studies can surface more specific learnings and guidance about the development of Tennessee’s teachers over the next several years.
State, district, and school leaders should attend both to policies that support more robust professional learning and teacher development and to those that shift the entire distribution up.

11
Atteberry, A., Loeb, S., & Wyckoff, J. (2015). Do first impressions matter? Predicting early career teacher effectiveness. AERA Open, 1(4), 2332858415607834.
Blazar, D. (2015). Grade assignments and the teacher pipeline: A low-cost lever to improve student achievement? Educational Researcher, 44(4), 213-227.
Chetty, R., Friedman, J. N., Hilger, N., Saez, E., Schanzenbach, D. W., & Yagan, D. (2011). How does your kindergarten classroom affect your earnings? Evidence from Project STAR. The Quarterly Journal of Economics, 126(4), 1593-1660.
Chetty, R., Friedman, J. N., & Rockoff, J. E. (2014). Measuring the impacts of teachers II: Teacher value-added and student outcomes in adulthood. American Economic Review, 104(9), 2633-79.
Garet, M. S., Cronen, S., Eaton, M., Kurki, A., Ludwig, M., Jones, W., ... & Zhu, P. (2008). The impact of two professional development interventions on early reading instruction and achievement. Washington, DC: U.S. Department of Education, National Center for Education Statistics.
Garet, M., Heppen, J., Walters, K., Smith, T., & Yang, R. (2016). Does content-focused teacher professional development work? Findings from three Institute of Education Sciences studies. Retrieved from the Institute of Education Sciences.
Glazerman, S., Isenberg, E., Dolfin, S., Bleeker, M., Johnson, A., Grider, M., & Jacobus, M. (2010). Impacts of Comprehensive Teacher Induction: Final Results from a Randomized Controlled Study. NCEE 2010-4027. National Center for Education Evaluation and Regional Assistance.
Jackson, C. K., & Bruegmann, E. (2009). Teaching students and teaching each other: The importance of peer learning for teachers. American Economic Journal: Applied Economics, 1(4), 85–108.
Jacob, B. A., & Lefgren, L. (2004). The impact of teacher training on student achievement quasi-experimental evidence from school reform efforts in Chicago. Journal of Human Resources, 39(1), 50-79.
Jacob, B. A., & Walsh, E. (2011). What’s in a rating? Economics of Education Review, 30(3), 434-448.
Kraft, M. A., & Papay, J. P. (2014). Can professional environments in schools promote teacher development? Explaining heterogeneity in returns to teaching experience. Educational evaluation and policy analysis, 36(4), 476-500.
Kraft, M.A., Papay, J.P., & Chi, O.L. (2018). Teacher Skill Development: Evidence from Performance Ratings by Principals. Working Paper.
Ost, B. (2014). How do teachers improve? The relative importance of specific and general human capital. American Economic Journal: Applied Economics, 6(2), 127-51.
Papay, J. P., & Kraft, M. A. (2015). Productivity returns to experience in the teacher labor market: Methodological challenges and new evidence on long-term career improvement. Journal of Public Economics, 130, 105-119.
Papay, J.P. & Laski, M.E. (2018). The dynamics of teacher productivity: Exploring heterogeneity in the within-teacher returns to experience. Working paper.
Papay, J. P., Taylor, E. S., Tyler, J. H., & Laski, M.E. (2016). Learning job skills from colleagues at work: Evidence from a field experiment using teacher performance data (No. w21986). National Bureau of Economic Research.
Rivkin, S. G., Hanushek, E. A., & Kain, J. F. (2005). Teachers, schools, and academic achievement. Econometrica, 73(2), 417-458.
Rockoff, J. E. (2004). The impact of individual teachers on student achievement: Evidence from panel data. American Economic Review, 94, 247–252.
Ronfeldt, M., Farmer, S. O., McQueen, K., & Grissom, J. A. (2015). Teacher collaboration in instructional teams and student achievement. American Educational Research Journal, 52(3), 475-514.
Sun, M., Loeb, S., & Grissom, J. A. (2017). Building teacher teams: Evidence of positive spillovers from more effective colleagues. Educational Evaluation and Policy Analysis, 39(1), 104-125.
Taylor, E. S., & Tyler, J. H. (2012). The effect of evaluation on teacher performance. American Economic Review, 102, 3628–3651.
TNTP. (2015). The Mirage: Confronting the hard truth about our quest for teacher development.
REFERENCES
1 Estimating the within-teacher returns to experience is complicated for several methodological reasons (see Papay & Kraft, 2015, for a more detailed discussion in general and Papay & Laski, 2018, for more details on the methodology that produced the analyses features in this brief).
2 To our knowledge, no other scholars have looked at test scores beyond mathematics and reading/ELA or at ratings from a recent state teacher evaluation system (see Kraft, Papay & Chi, 2018, and Jacob & Walsh, 2011, for estimates derived from earlier teacher evaluation ratings).
3 Tennessee has since implemented a new state assessment called TNReady.
4 We define higher-poverty schools as those with at least 2/3 of students economically disadvantaged, and lower-poverty schools those with fewer than 1/3 of students economically disadvantaged.
ENDNOTES
vu.edu/TNEdResearchAlliance | 615.322.5538 | [email protected] | @TNEdResAlliance