Embed Size (px)
Citation preview

Exploring State Test Scores Key Questions for Teachers
Oklahoma State Department of Education Interpreting State Tests Scores- Key Questions for Teachers
System of Assessment In any year, a single test score does not provide a complete measure of student achievement. Therefore, Oklahoma believes that classroom, district, and state assessments should work together in a coherent system to produce multiple pieces of evidence at different points in time. Such a system provides timely and actionable information that helps us understand what students know and are able to do relative to the Oklahoma Academic Standards (OAS), as shown in the graphic below.
End-of-year summative assessment refers to testing that determines levels of proficiency on grade-level knowledge and skills for all students. State summative assessments provide stakeholders with a snapshot of student readiness in mathematics, English language arts, and science. Traditionally, state summative assessments help us understand system-level decisions such as:
How district or school curriculum might be working to support all learners; and
What additional professional development may be helpful.
This year, summative assessments are an important marker that helps us understand how well students did when compared against end-of-grade level expectations.

Oklahoma State Department of Education Key Questions for Teachers
2
Students and educators have faced serious disruptions throughout the 2019-2020 and 2020-2021 academic years. Students did not have a typical instructional year. Because of this, it is imperative that district and school personnel understand who tested this year, how students performed, and how learning conditions and interruptions might have affected performance on spring 2021 results. With this in mind, we ask that you work with your administrators to develop a shared understanding of the impact COVID-19 disruptions may have had reviewing your scores in the OSTP Data Portal. About Performance Data in the OSTP Portal Performance-related data in the OSTP Portal are reported out at three different levels: Performance Level, Performance Index Scale Score (OPI), and Reporting Category.
Performance Levels provide a broad view of whether a student, curricular program, or group of students is on track relative to grade-level expectations needed to be college- and career-ready.
Oklahoma Performance Index (OPI) Scale Scores supplement performance-level data by pinpointing where a score is relative to the performance level. OPI scale scores are obtained by converting raw scores onto a common scale. Scale scores even account for differences in assessment forms, which allows for consistency in score interpretations and because of this, Performance Index Scale Scores allow for numerical comparisons between groups of test takers taking the same test.

Oklahoma State Department of Education Key Questions for Teachers
3
Reporting Category Performance data provide an additional piece that when connected with your local attendance data, helps educators understand and prioritize content and to identify what areas of unfinished learning may need to be addressed. Reporting category performance is reported with an indicator that communicates a confidence level of a student’s likelihood of being able to demonstrate the proficient level Knowledge, Skills, and Abilities (KSAs). These KSAs are found in each Performance Level Descriptor (PLD) and are assessed through at least six questions. The indicators are Below Standard, At/Near Standard, and Above Standard.
Reviewing Performance Data in the OSTP Data Portal Performance related data displayed in the OSTP data portal can be aggregated and disaggregated to compare performance across student groups.
To access your site’s data, go to https://oklahoma.cognia.org/.
To view a single grade level, choose Group Summary Performance Levels. You can also choose Group Summary PL: All Grades to view multiple grades.
Note: you will need district access to view grade level/s data beyond your school site.
Login with your Username and Password
Click Reporting. Note: Usernames and Passwords are assigned through your district.
Oklahoma State Department of Education Key Questions for Teachers
4
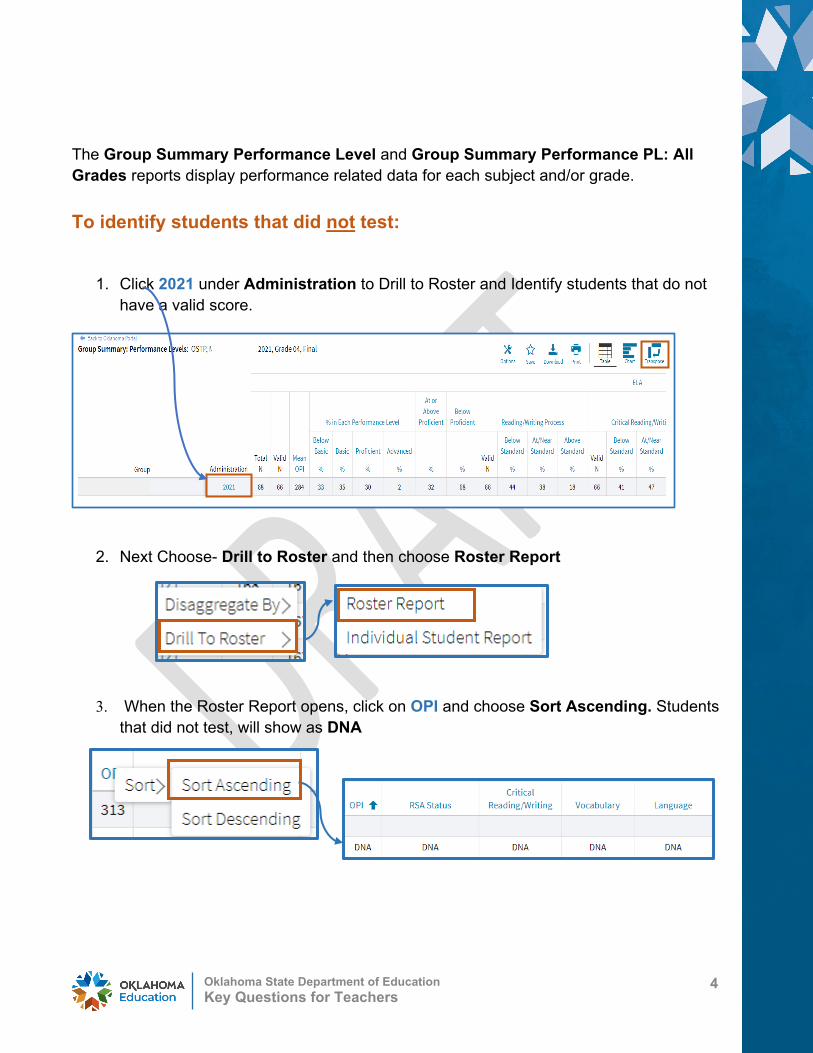
The Group Summary Performance Level and Group Summary Performance PL: All Grades reports display performance related data for each subject and/or grade. To identify students that did not test:
1. Click 2021 under Administration to Drill to Roster and Identify students that do not have a valid score.
2. Next Choose- Drill to Roster and then choose Roster Report
3. When the Roster Report opens, click on OPI and choose Sort Ascending. Students that did not test, will show as DNA

Oklahoma State Department of Education Key Questions for Teachers
5
To review performance:
1. Use the transpose feature to display the data vertically so that you can compare across standards, subjects, and /or grade levels.
Reminder: students scoring At/Near or Above Standard are likely to meet grade-level expectations based on their performance on the state summative assessment.

Oklahoma State Department of Education Key Questions for Teachers
6
2. Use the Options feature to Disaggregate by student group
Reminder: Compare the Total N and Valid N for each student group to think about who tested and who did not test in each group before comparing performance.

Oklahoma State Department of Education Key Questions for Teachers
7
Types of Reports Available
Report Data Available
Group Summary: Performance Levels
• Single grade: performance level data including OPI, percent scoring at each performance level and reporting category.
• Data can be disaggregated by student group for comparison purposes. Reminder: connect participation rates to consider who tested and who did not test.
Group Summary PL: All Grades
• Multiple grades: performance level data including OPI, percent scoring at each performance level and reporting category by subject.
• Data can be disaggregated by student group for comparison purposes. Reminder: connect participation rates to consider who tested and who did not test.
Group Summary PL: All Selections
• Single Grade: performance level data for all student groups including OPI, percent scoring at each performance level and reporting category by subject. Reminder: connect participation rates to consider who tested and who did not test.
Summary Counts
• Provides summary counts for online, not other placement, total tested, and total did not attempt.
Longitudinal Roster
• Provides student level performance across grades for students enrolled at a site across multiple years. (For example, grade 3 in 2018, grade 4 in 2019 and grade 6 in 2021.)
Oklahoma State Department of Education Key Questions for Teachers
8
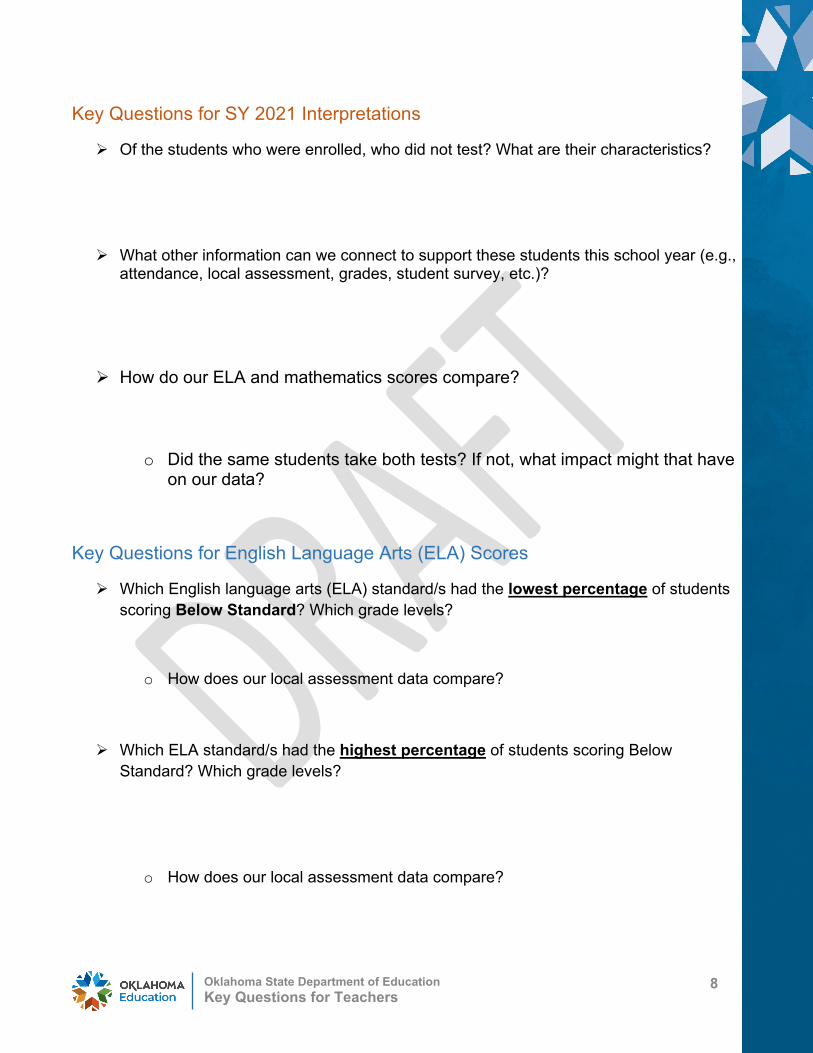
Key Questions for SY 2021 Interpretations
Of the students who were enrolled, who did not test? What are their characteristics?
What other information can we connect to support these students this school year (e.g., attendance, local assessment, grades, student survey, etc.)?
How do our ELA and mathematics scores compare?
o Did the same students take both tests? If not, what impact might that have on our data?
Key Questions for English Language Arts (ELA) Scores
Which English language arts (ELA) standard/s had the lowest percentage of students scoring Below Standard? Which grade levels?
o How does our local assessment data compare?
Which ELA standard/s had the highest percentage of students scoring Below Standard? Which grade levels?
o How does our local assessment data compare?
Oklahoma State Department of Education Key Questions for Teachers
9
What differences in student experiences did students have and what impact might that have on our ELA performance data? (Consider opportunities to learn [OTL] data relative to your local context [e.g., proportion of time spent in synchronous and asynchronous instruction, amount of time teacher interacts with students, curriculum choices, reduced instructional time, access to learning supports, etc.])
• How can our ELA performance data inform the adjustments we are planning to horizontal alignment and prioritization of grade-level content? (Consider using the vertical ELA progressions found here: https://sde.ok.gov/ela-standards)
• Based on our ELA performance data, what additional plans may we wish to consider? (consider using the ELA curriculum frameworks grade-level objective analysis, literacy progressions and engagement strategies)
Oklahoma State Department of Education Key Questions for Teachers
10
Key Questions for Mathematics Scores Which mathematics strand/s had the lowest percentage of students scoring Below
Standard? Which grade levels? (High percentage of At/Near and Above standard)
o How does our local assessment data compare?
Which mathematics strand/s had the highest percentage of students scoring Below Standard? Which grade levels?
o How does our local assessment data compare?
• What differences in student experiences did students have and what impact might that have had on our math performance data? (Consider opportunities to learn data relative to your local context [e.g., proportion of time spent in synchronous and asynchronous instruction, amount of time teacher interacts with students, curriculum choices, reduced instructional time, access to learning supports, etc.].)

Oklahoma State Department of Education Key Questions for Teachers
11
• How can our math performance data inform the adjustments we are planning to horizontal alignment and prioritization of grade-level content? (consider using the vertical progressions found here: https://sde.ok.gov/sites/ok.gov.sde/files/OAS-Math-Final%20Version_3.pdf- Appendix B.1).
• Based on our math performance data, what additional plans may we wish to consider? (consider using the mathematics curriculum frameworks grade-level objective analysis, learning progressions and engagement strategies)
Connecting Supports
Ready Together website-
• Ready Together Brief- How can students be supported through accelerated learning in mathematics?
• Ready Together Brief- How can students be supported through accelerated learning in English language arts?