Embed Size (px)
Citation preview

Exploring specialty finance data

Introducing:
John Lodmell Advance America Paul DeSaulniers Experian Crissy Wallace Experian

©Experian 3
• CFPB proposal
• Data analysis
• Business impact and the market ahead
Contents
4/21/2017 Experian Public Vision 2017

©Experian 4
Live poll
4/21/2017 Experian Public Vision 2017

©Experian 5
Consumer Finance Protection Bureau Proposed payday loan rules
Paul DeSaulniers Experian
4/21/2017 Experian Public Vision 2017

©Experian 6
Two categories of loans covered:
• Term of 45 days or less
• Term greater then 45 days that total cost of credit is greater than 36%, and:
– Repaid directly from borrowers bank account or secured by borrowers vehicle
The proposed rule:
• Require lenders too make a determination that borrower has ability to repay loan
– Verify income
– Verify borrowers debt obligations using a credit report
– Verify borrowers housing cost
– Forecast reasonable living expenses
– Project borrowers net income, debt obligations and housing cost and ability to repay for the loan period
• Require lender to furnish information to registered information system (RIS)
Summary of the 1,300+ pages
4/21/2017 Experian Public Vision 2017

©Experian 7
Impact of rules, if implemented as written
4/21/2017 Experian Public Vision 2017
Significant
reduction in pay
day lending activity
• CFPB’s own
estimate would
eliminate 84% of
volume
Online and FinTech
lenders believe
proposed rules will
provide greater
opportunity to fill
void left by less
sophisticated lenders
(brick and mortar
lenders
Consumer groups
have divergent
views • Represents an
attempt to protect borrowers
• Does not go far enough
• Diminished liquidity options driving consumers to loan sharks, pawn shops or less desirable alternatives
Over one million
comments
submitted to the
CFPB

©Experian 8
• Does ability repay criteria as describe in rule predict consumer pay day loan performance
• How do traditional credit risk scores predict consumer performance in this space
• Profiles of consumers in the specialty finance consumers
What we will explore today
4/21/2017 Experian Public Vision 2017

©Experian 9
Data analysis
4/21/2017 Experian Public Vision 2017
Crissy Wallace Experian

©Experian 10
Additional data provides
better visibility to consumers
4/21/2017 Experian Public Vision 2017

©Experian 11
Currently lenders decision heavily on generic score to define risk
4/21/2017 Experian Public Vision 2017
Super Prime
Prime
Near Prime
Subprime
Deep Subprime
781-850
661-780
601-660
500-600
300-499
Low risk
High risk

©Experian 12
Traditional data Specific models Trended data
Thin file Aspirational data Specialty finance
The more we know about a consumer, the more accurately we can predict risk, using additional data
4/21/2017 Experian Public Vision 2017

©Experian 13
Low risk
High risk
Some data will increase predictability
with positive data for subprime consumers
4/21/2017 Experian Public Vision 2017
Positive examples:
Rental, telecom,
and utility

©Experian 14
Some data will increase predictability
with negative data for prime consumers
4/21/2017 Experian Public Vision 2017
Negative samples:
Short-term loans, payday,
rent-to-own
Low risk
High risk

©Experian 15
This provides increase predictability, and this data is FCRA, disputable and CAN be used for decisioning
4/21/2017 Experian Public Vision 2017
Low risk
High risk
Negative samples:
Short-term loans, payday,
rent-to-own
Positive examples:
Rental, telecom,
and utility
©Experian 16
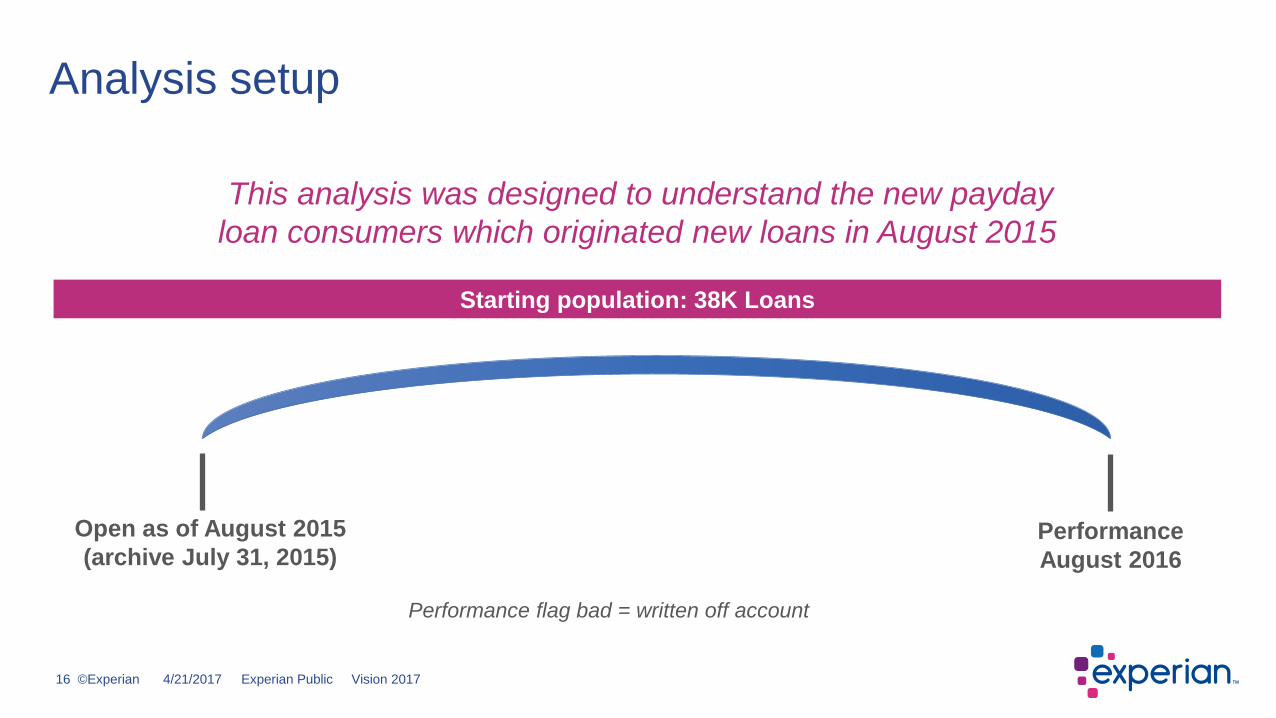
Analysis setup
4/21/2017 Experian Public Vision 2017
This analysis was designed to understand the new payday
loan consumers which originated new loans in August 2015
Open as of August 2015
(archive July 31, 2015)
Starting population: 38K Loans
Performance
August 2016
Performance flag bad = written off account

©Experian 17
Data overview Waterfall counts
4/21/2017 Experian Public Vision 2017
Input records
38,490
Unable to identify (No Hit to bureau) 1.5%
Address error <0.1%
No Pin 0.56%
Hit, but suppressed 0.91%
Consumer identified (Hit to bureau) 98.5%
Hit but no credit/scores (Collection, inquiry, public record or unscoreable)
11.5%
Thin File (1-4 trades)
39%
Thick File (5 or more trades)
48%

©Experian 18
Model performance
4/21/2017 Experian Public Vision 2017
0%
20%
40%
60%
80%
100%
0% 5% 10% 15% 20% 25% 30% 35% 40% 45% 50% 55% 60% 65% 70% 75% 80% 85% 90% 95% 100%
Cum
ula
tive
% o
f b
ad
acco
un
ts
Cumulative % of accounts
KS Statistic
Custom Model Score
Telecom Risk Score
TEC Connect
VantageScore V3
ExtendedView
31 25 23 23 20
KS
Custom Model Telecom Risk
VantageScore V3 EVS
TEC Connect
A statistical process called Kolmogorov-Smirnov (K-S) measures the separation of two
populations, for example ‘Goods’ versus ‘Bads’. The K-S statistic aims at measuring the
maximum difference in two populations’ cumulative distributions. The K-S measure for the
model shows the capability to distinguish ‘Good Accounts’ from ‘Bad Accounts’.

©Experian 19
Model performance
4/21/2017 Experian Public Vision 2017
15%
29%
43%
15%
28%
41%
13%
26%
39%
14%
26%
38%
14%
26%
38%
10% 20% 30%
Worst Scoring 30%
Custom Model
Telecom Risk Score
VantageScore V3
ExtendedView
TEC Connect
Pe
rcen
t o
f b
ad
acco
un
ts
Lowest scoring ranges
The ability of a model to push the largest percentage of bads
to the lowest scoring ranges is a hallmark of scorecard performance.

©Experian 20
Custom model
4/21/2017 Experian Public Vision 2017
24.8%
49.1%
58.8% 62.6%
65.6% 69.2% 67.0%
41.6%
0%
10%
20%
30%
40%
50%
60%
70%
-
2,000
4,000
6,000
8,000
10,000
12,000
14,000
16,000
900-999 800-899 700-799 600-699 500-599 400-499 300-399 Exclusion Score
Write
-off r
ate
Num
be
r o
f a
cco
un
ts
Loans Writeoff Writeoff Rate

©Experian 21
Profiling specialty finance consumers
4/21/2017 Experian Public Vision 2017
What does the AVERAGE
specialty finance (payday)
consumer really look like?
Total # bankcard loans = 2 trades; $98/mo
Total # personal loans = 1 trades; $21/mo
Total # mortgage loans =
0.27 trade; $961/mo
Average debt-to-income
16% Average Vantage
Score® V3 = 536
Average Income
InsightSM $39K
Total # traditional
credit trades = 8 trades
Total # auto loans = 1 trade; 448/mo

©Experian 22
Income distributions
4/21/2017 Experian Public Vision 2017
Loans Write-off Write-off rate
52.6%
40.7%
27.1%
14.3%
46.8%
0%
10%
20%
30%
40%
50%
60%
70%
-
2,000
4,000
6,000
8,000
10,000
12,000
14,000
16,000
18,000
$1-35K $35-50K $50-100K $100K+ Exclusion
Write
-off r
ate
Nu
mb
er
of a
cco
un
ts
Income InsightSM

©Experian 23
Generation segments and sample distribution
4/21/2017 Experian Public Vision 2017
Gen Z
Age 18–20
Gen Y
Younger: Age 21–27
Older: Age 28–34
Gen X
Age 35–49
Boomer
Age 50–70
Silent
Age 70+

©Experian 24
Loans by generation
4/21/2017 Experian Public Vision 2017
2.6%
19.6%
23.3%
29.0%
22.1%
3.4%
0.0%
Generation
Percent of loans by generation
Gen Z Gen YY Gen OY Gen X
Boomer Silent Unknown
Pe
rce
nt o
f a
cco
un
ts
545
525 525
533
552
576
490
500
510
520
530
540
550
560
570
580
0
2000
4000
6000
8000
10000
12000
Gen Z Gen YY Gen OY Gen X Boomer Silent
Super Prime Prime Near Prime
Subprime Deep Subprime Average VS3
Accounts by generation
and VantageScore® band

©Experian 25
File thickness overall and by generation
4/21/2017 Experian Public Vision 2017
Match but no trades
11.5%
Thin 1-4 trades 39.0%
Thick >= 5 trades 48.0%
-
1,000
2,000
3,000
4,000
5,000
6,000
7,000
No bureau match
Match but no trade data
Thin 1-4 trades
Thick >=5 trades
No match /
Not scoreable 1.5%

©Experian 26
Age of oldest trade
-
1,000
2,000
3,000
4,000
5,000
6,000
Missing Gen Z Gen YY Gen OY Gen X Boomer Silent
Age of oldest trade on bureau by generation
Missing < 2 yrs 2-5 yrs 5-10 yrs 10+ yrs
Nu
mb
er
of
ac
co
un
ts
4/21/2017 Experian Public Vision 2017

©Experian 27
Number of payday loans by generation and score band
-
5,000
10,000
15,000
20,000
25,000
Super Prime Prime NearPrime Subprime Deep Subprime
1 Loan 2 Loans 3 Loans 4 Loans 5 Loans 6 to 10 Loans 11 to 15 Loans 16 to 20 Loans >20 Loans
Number of payday loans by VantageScore® band
4/21/2017 Experian Public Vision 2017
©Experian 28
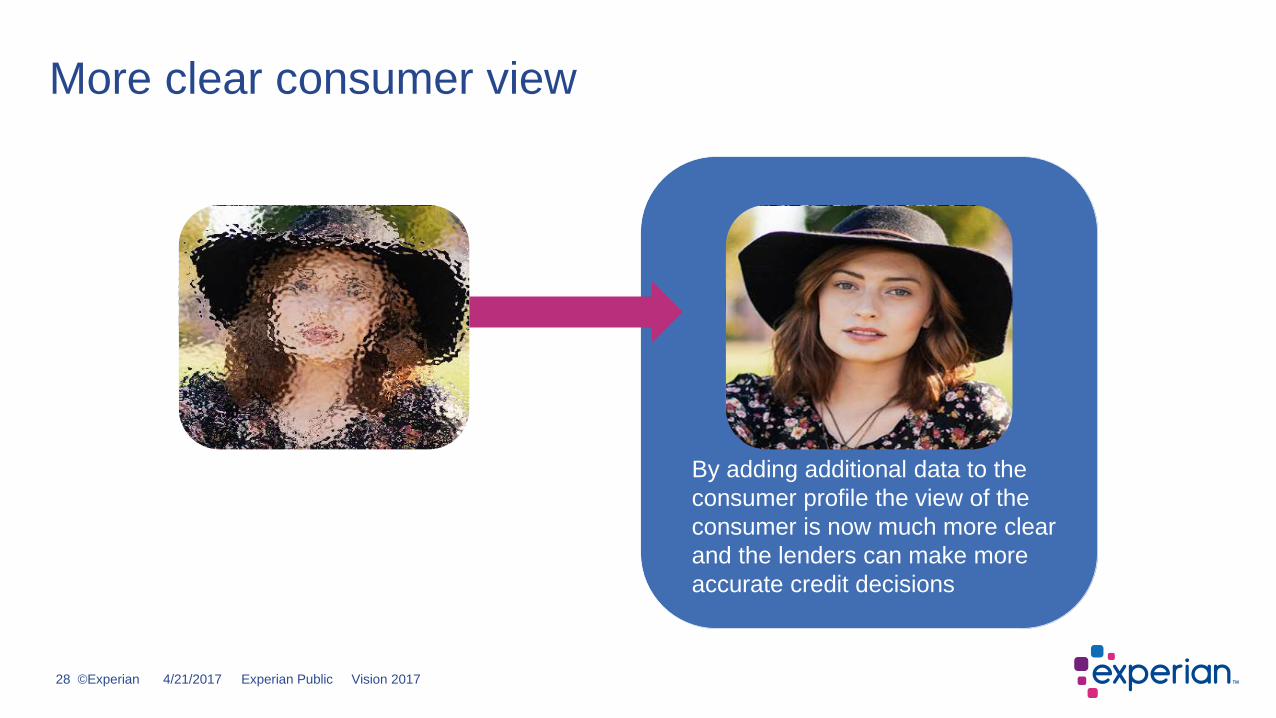
More clear consumer view
By adding additional data to the
consumer profile the view of the
consumer is now much more clear
and the lenders can make more
accurate credit decisions
4/21/2017 Experian Public Vision 2017
©Experian 29
Business impact and the market ahead
4/21/2017 Experian Public Vision 2017
John Lodmell Advance America

©Experian 30
Thoughts on the market ahead…
4/21/2017 Experian Public Vision 2017

©Experian 31
Experian contact:
Paul DeSaulniers [email protected]
Crissy Wallace [email protected]
Questions and answers
4/21/2017 Experian Public Vision 2017
PaulDeSauliners @PDesaulniers
@CrissyWallace CrissyWallaceMyler

©Experian 32
Share your thoughts about Vision 2017!
4/21/2017 Experian Public Vision 2017
Please take the time now to give us your feedback about this session.
You can complete the survey at the kiosk outside.
How would you rate both the Speaker and Content?