Embed Size (px)
Citation preview

Exploring Second-Harmonic
Generation Spectroscopy for the
Characterization of MX2
Vincent Vandalon, Akhil Sharma, Erwin Kessels & Ageeth Bol
Eindhoven University of Technology, The Netherlands
Characterization and Metrology Workshop for 3D CMOS
IMEC | Leuven | 21st April 2017
SiO2
MoS2
Tang, Qing, and De-en Jiang. Chemistry of Materials, 2015: 3743-3748.
Fiori, G. et al., Nature, 2014
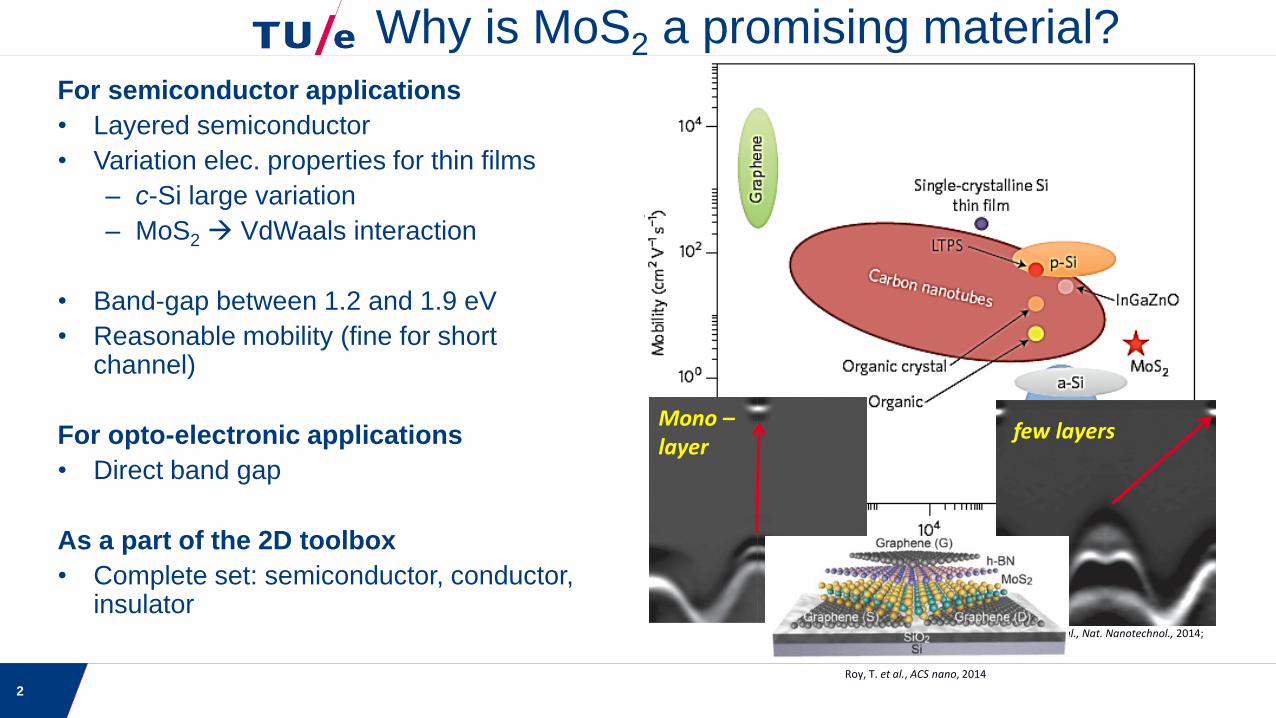
For semiconductor applications
• Layered semiconductor
• Variation elec. properties for thin films
– c-Si large variation
– MoS2 VdWaals interaction
• Band-gap between 1.2 and 1.9 eV
• Reasonable mobility (fine for short channel)
For opto-electronic applications
• Direct band gap
As a part of the 2D toolbox
• Complete set: semiconductor, conductor, insulator
Why is MoS2 a promising material?
few layers
Zhang, Y. et al., Nat. Nanotechnol., 2014;
Mono –layer
Roy, T. et al., ACS nano, 2014
2

Key parameters
• Thickness, number of layers
• Electronic & material structure (grain size…)
Linear optical characterization techniques
• Raman spectroscopy
• Photoluminescence (PL) spectroscopy
Nonlinear optical techniques
• Second-harmonic generation (SHG) promising candidate
340 360 380 400 420 440
Ra
ma
n I
nte
nsit
y (
a.u
.)
Raman Shift (cm-1)
Pl. - 20s
Pl. - 40s
Pl. - 60s
Predominant synthesis of MoS2
Exfoliation
• High-quality, near defect free
• Flakes/grains um size
• Less control (# layers, placement)
Chemical vapor deposition (CVD) & Sulfidationprocesses
• Fairly high quality
• Large grains (100 um especially CVD)
• Process at high temperature
• Blanket films
Atomic-layer deposition (ALD) our focus
• Fairly high quality
• Process at low(er) temperature
• Blanket films
• Highly uniform & conformal
• Highly repeatable
Synthesis of MoS2 & characterization
Mak et al., Physical Review Letters, 2010
3 Yang et al (2015). Scientific ReportsDOI: 10.1038/srep10378
Zhang (2016). Light: Science & ApplicationsDOI: 10.1038/lsa.2016.131

• Introduction
• What is second-harmonic generation (SHG)
• Show case: Characterizing c-Si interface with SiO2/Al2O3
– Determining built-in charge density
• Exploring SHG spectroscopy for the characterization of MoS2
– Built-in charge density
– Crystal structure, symmetry and the SHG response
– Outlook
• Conclusions
Outline of the presentation
4
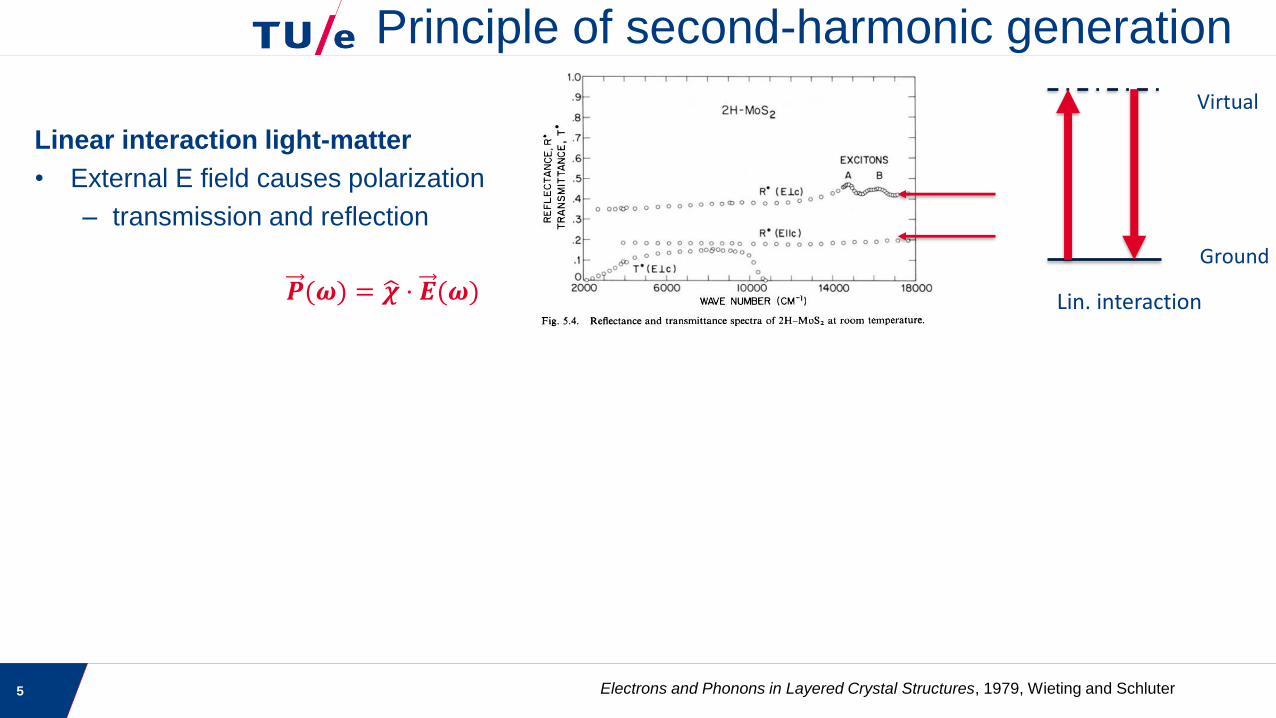
Linear interaction light-matter
• External E field causes polarization
– transmission and reflection
𝑷(𝝎) = ෝ𝝌 ⋅ 𝑬(𝝎)
Principle of second-harmonic generation
Ground
Virtual
Lin. interaction
5 Electrons and Phonons in Layered Crystal Structures, 1979, Wieting and Schluter

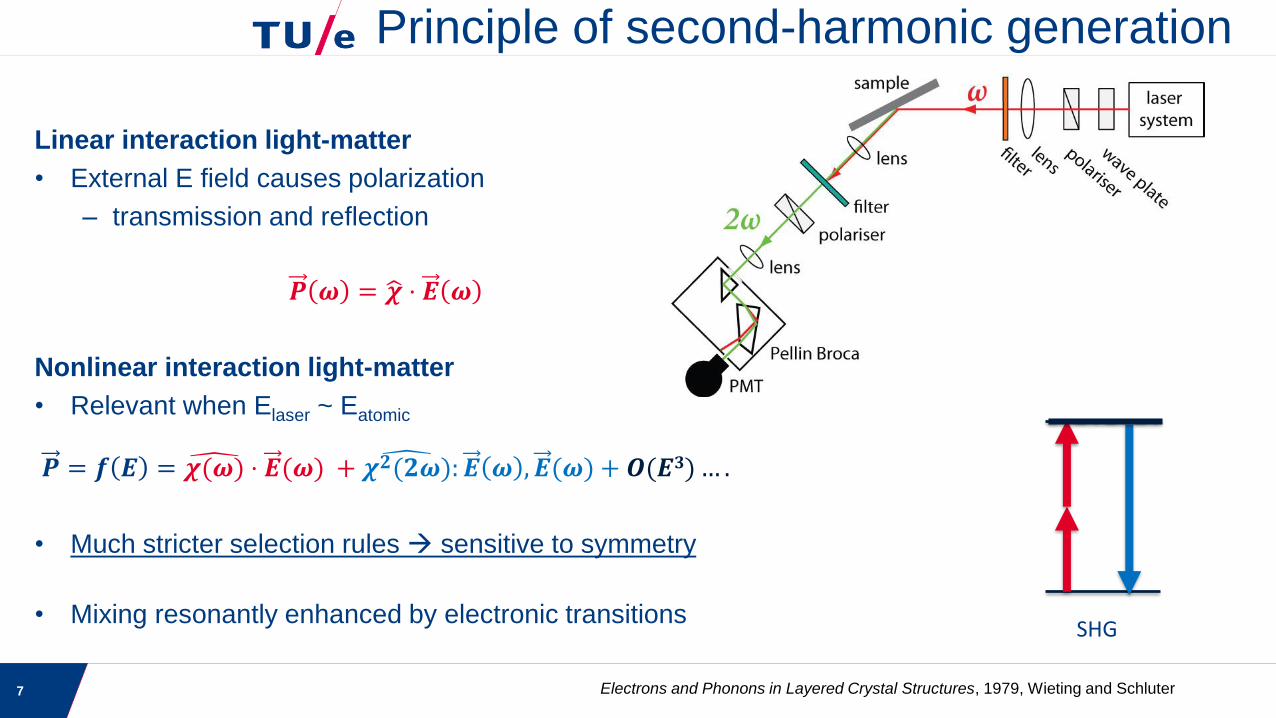
Linear interaction light-matter
• External E field causes polarization
– transmission and reflection
𝑷 𝝎 = ෝ𝝌 ⋅ 𝑬 𝝎
Nonlinear interaction light-matter
• Relevant when Elaser ~ Eatomic
𝑷 = 𝒇 𝑬 = 𝝌(𝝎) ⋅ 𝑬(𝝎) + 𝝌𝟐(𝟐𝝎): 𝑬 𝝎 ,𝑬(𝝎) + 𝑶(𝑬𝟑)… .
• Much stricter selection rules sensitive to symmetry
• Mixing resonantly enhanced by electronic transitions
Principle of second-harmonic generation
Ground
Virtual
Lin. interaction
6
SHG
Electrons and Phonons in Layered Crystal Structures, 1979, Wieting and Schluter
Linear interaction light-matter
• External E field causes polarization
– transmission and reflection
𝑷 𝝎 = ෝ𝝌 ⋅ 𝑬 𝝎
Nonlinear interaction light-matter
• Relevant when Elaser ~ Eatomic
𝑷 = 𝒇 𝑬 = 𝝌(𝝎) ⋅ 𝑬(𝝎) + 𝝌𝟐(𝟐𝝎): 𝑬 𝝎 ,𝑬(𝝎) + 𝑶(𝑬𝟑)… .
• Much stricter selection rules sensitive to symmetry
• Mixing resonantly enhanced by electronic transitions
Principle of second-harmonic generation
7
SHG
Electrons and Phonons in Layered Crystal Structures, 1979, Wieting and Schluter
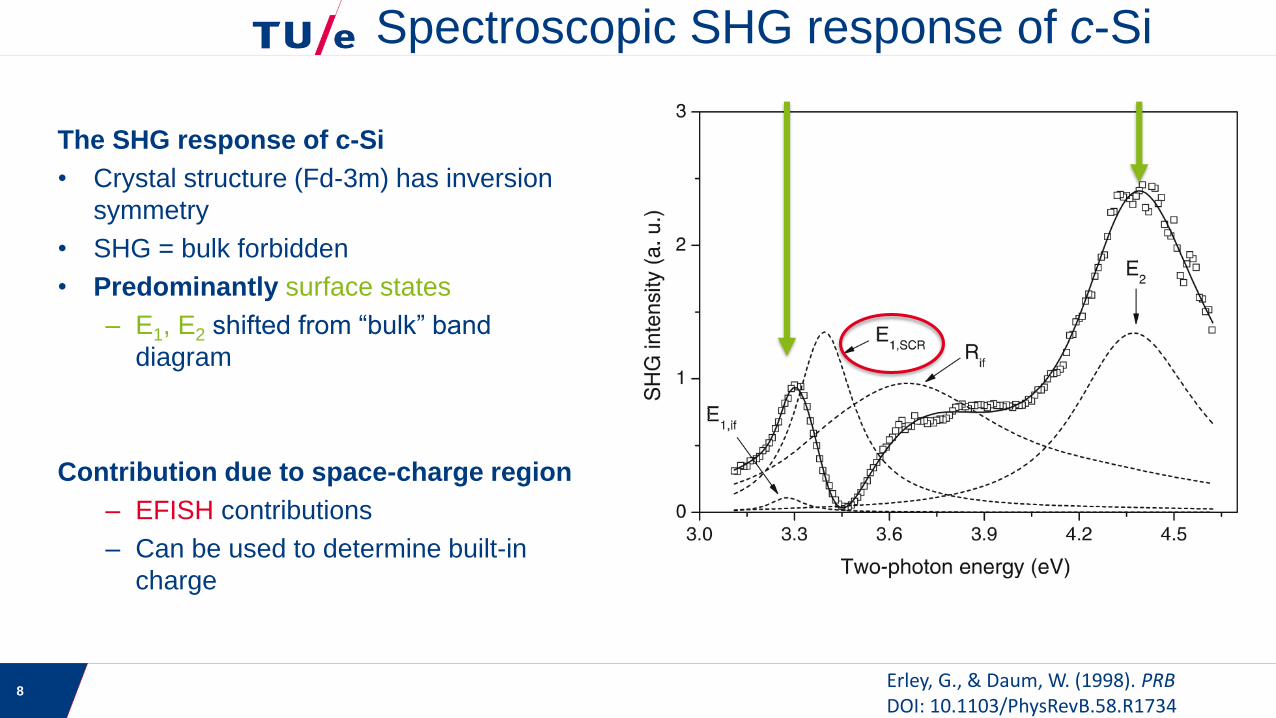
The SHG response of c-Si
• Crystal structure (Fd-3m) has inversion
symmetry
• SHG = bulk forbidden
• Predominantly surface states
– E1, E2 shifted from “bulk” band
diagram
Contribution due to space-charge region
– EFISH contributions
– Can be used to determine built-in
charge
Spectroscopic SHG response of c-Si
Erley, G., & Daum, W. (1998). PRBDOI: 10.1103/PhysRevB.58.R1734
8

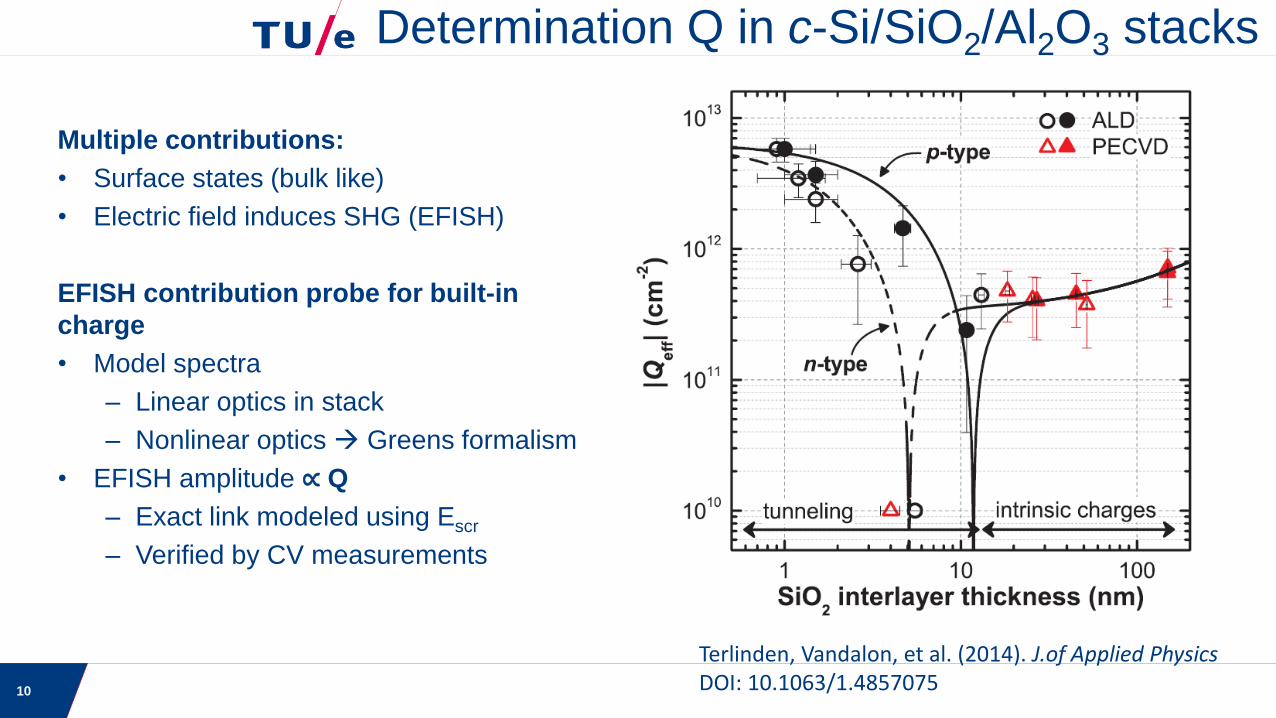
Multiple contributions:
• Surface states (bulk like)
• Electric field induces SHG (EFISH)
EFISH contribution probe for built-in
charge
• Model spectra
– Linear optics in stack
– Nonlinear optics Greens formalism
• EFISH amplitude ∝ Q
Determination Q in c-Si/SiO2/Al2O3 stacks
Terlinden, Vandalon, et al. (2014). J.of Applied PhysicsDOI: 10.1063/1.48570759
Multiple contributions:
• Surface states (bulk like)
• Electric field induces SHG (EFISH)
EFISH contribution probe for built-in
charge
• Model spectra
– Linear optics in stack
– Nonlinear optics Greens formalism
• EFISH amplitude ∝ Q
– Exact link modeled using Escr
– Verified by CV measurements
Determination Q in c-Si/SiO2/Al2O3 stacks
Terlinden, Vandalon, et al. (2014). J.of Applied PhysicsDOI: 10.1063/1.485707510

• Introduction
• What is second-harmonic generation (SHG)
• Show case: Characterizing c-Si interface with SiO2/Al2O3
– Determining built-in charge density
• Exploring SHG spectroscopy for the characterization of MoS2
– Built-in charge density
– Crystal structure, symmetry and the SHG response
– Outlook
• Conclusions
Outline of the presentation
11
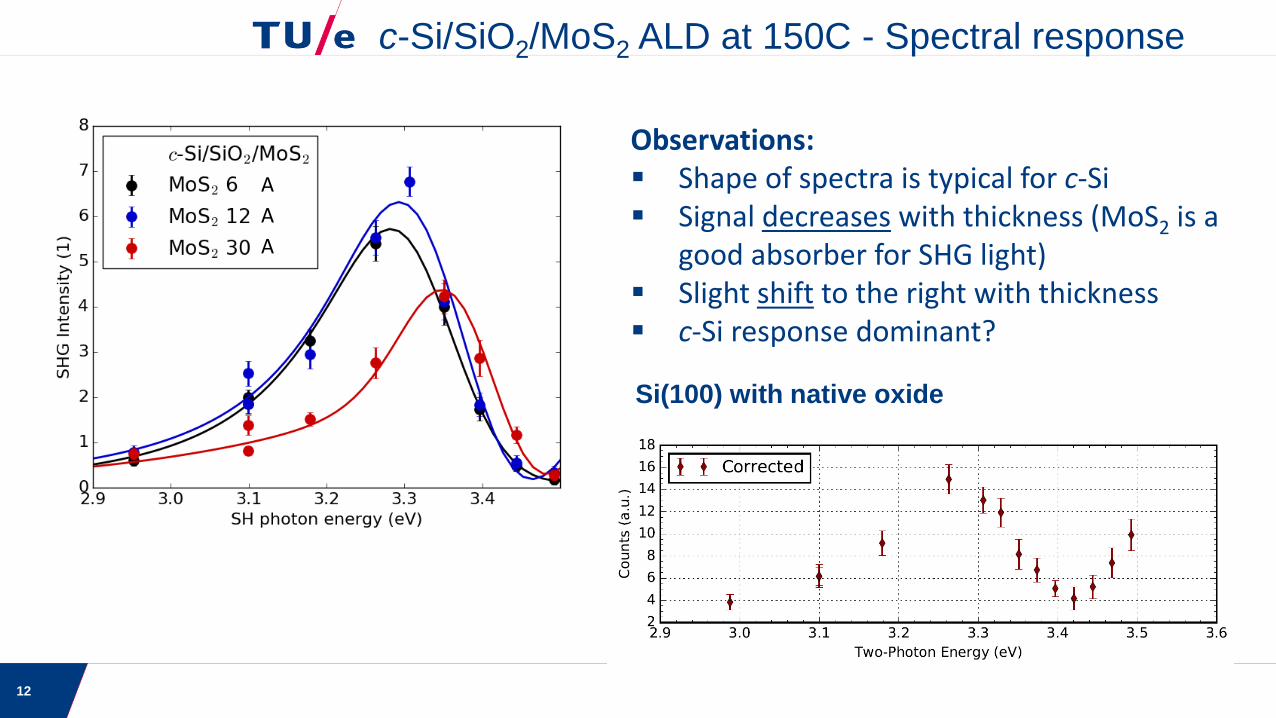
c-Si/SiO2/MoS2 ALD at 150C - Spectral response
Observations: Shape of spectra is typical for c-Si Signal decreases with thickness (MoS2 is a
good absorber for SHG light) Slight shift to the right with thickness c-Si response dominant?
12
Si(100) with native oxide
A
A
A

Polarization dependence Si/SiO2/MoS2
• Typical symmetry for c-Si
Sanity checks: MoS2 contribution?
MoS2 on glass substrate
• SHG glass substrate below detection limit
using unamplified pulses
• Only thick (3.6 nm) MoS2 film could be
detected
13
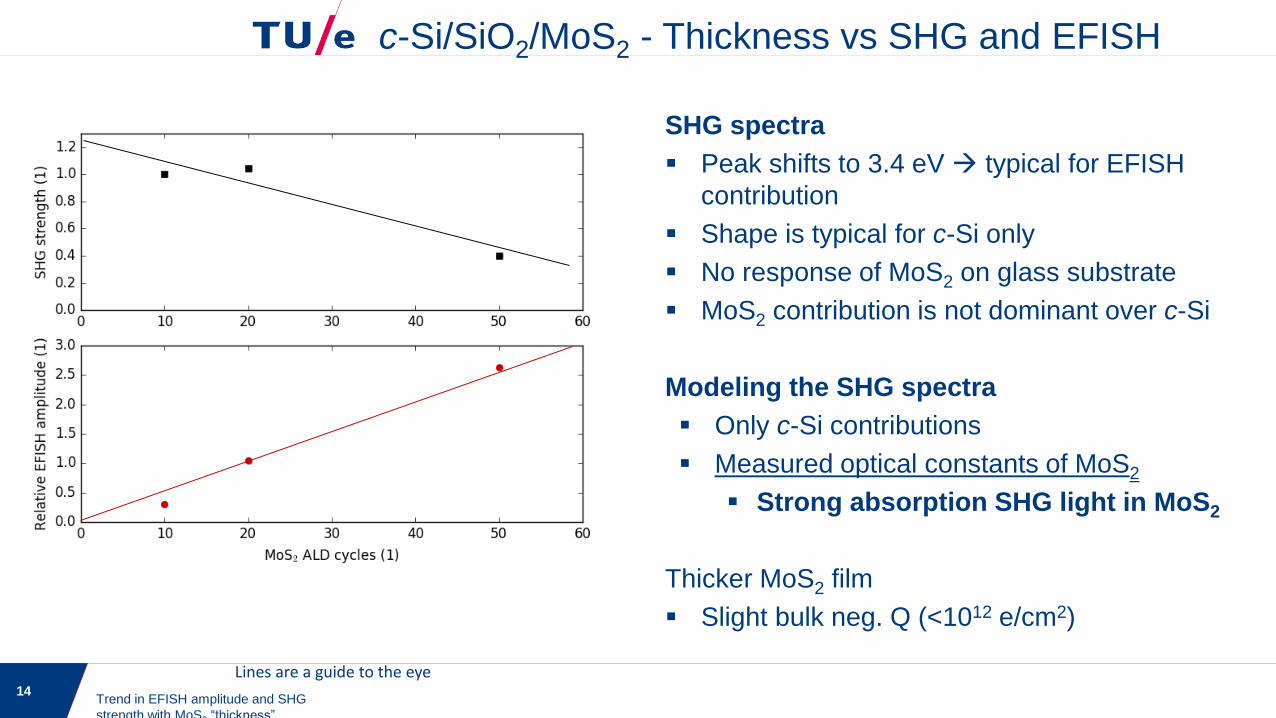
SHG spectra
Peak shifts to 3.4 eV typical for EFISH
contribution
Shape is typical for c-Si only
No response of MoS2 on glass substrate
MoS2 contribution is not dominant over c-Si
Modeling the SHG spectra
Only c-Si contributions
Measured optical constants of MoS2
Strong absorption SHG light in MoS2
Thicker MoS2 film
Slight bulk neg. Q (<1012 e/cm2)
Trend in EFISH amplitude and SHG
strength with MoS2 “thickness”
c-Si/SiO2/MoS2 - Thickness vs SHG and EFISH
Lines are a guide to the eye14
• Introduction
• What is second-harmonic generation (SHG)
• Show case: Characterizing c-Si interface with SiO2/Al2O3
– Determining built-in charge density
• Exploring SHG spectroscopy for the characterization of MoS2
– Built-in charge density
– Crystal structure, symmetry and the SHG response
– Outlook
• Conclusions
Outline of the presentation
15
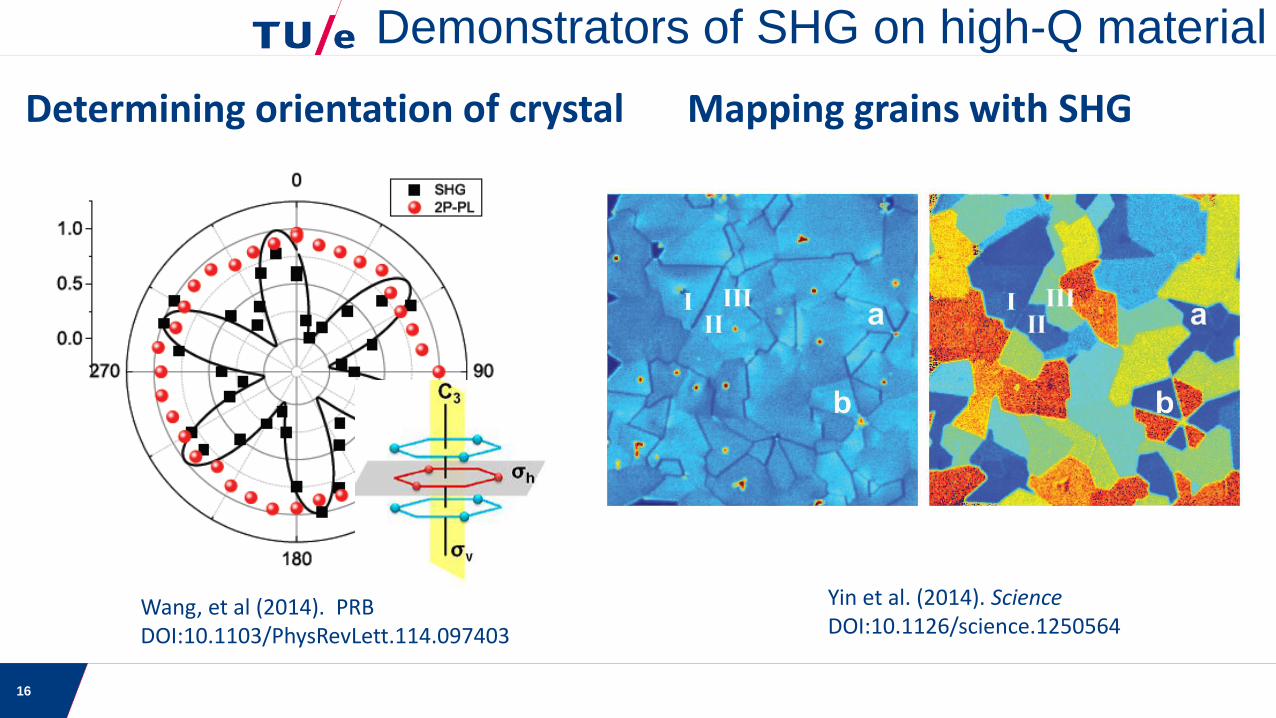
Mapping grains with SHG
Demonstrators of SHG on high-Q material
Yin et al. (2014). ScienceDOI:10.1126/science.1250564
Wang, et al (2014). PRBDOI:10.1103/PhysRevLett.114.097403
Determining orientation of crystal
16
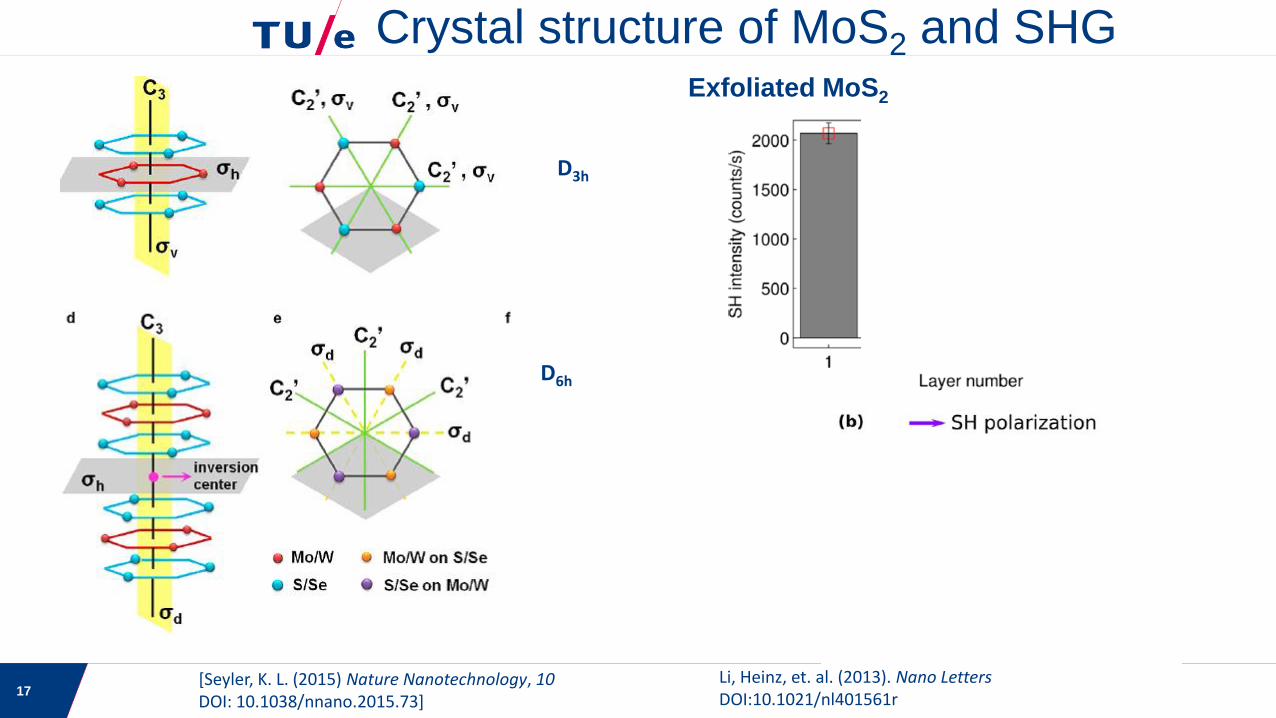
Crystal structure of MoS2 and SHG
Li, Heinz, et. al. (2013). Nano LettersDOI:10.1021/nl401561r
17
D3h
D6h
Exfoliated MoS2
[Seyler, K. L. (2015) Nature Nanotechnology, 10DOI: 10.1038/nnano.2015.73]
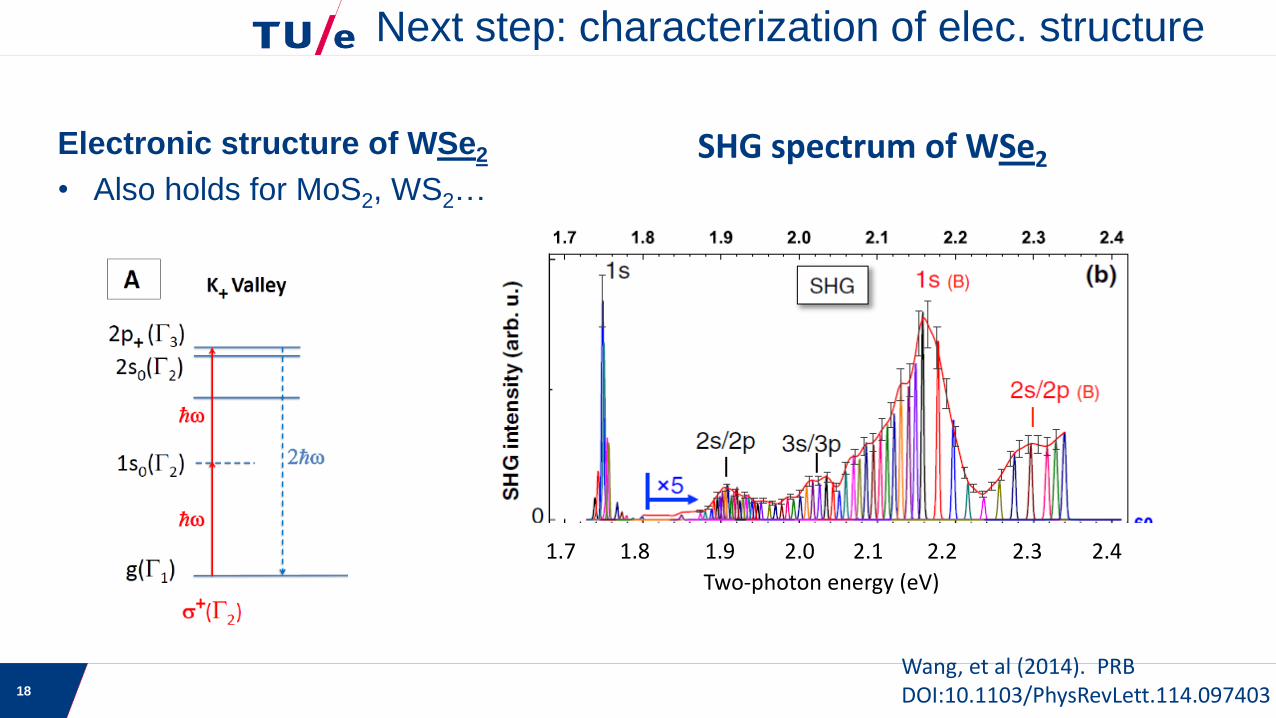
Electronic structure of WSe2
• Also holds for MoS2, WS2…
SHG spectrum of WSe2
Next step: characterization of elec. structure
Wang, et al (2014). PRBDOI:10.1103/PhysRevLett.114.097403
Two-photon energy (eV)
1.7 1.8 1.9 2.0 2.1 2.2 2.3 2.4
18

• MX2 material have many promising applications
• SHG can help characterize MX2 materials
– Built-in charge
– Electronic structure
– Number of layers
– Orientation / structure
• Works well for exfoliated or nearly-ideal material; needs to be
studied if it also works for non-ideal material
Summary
19


21
• Intro: why TMD’s
– Future electronic, optical, and catalytic
application
– Synthesis methods: exfoliation, CVD,
ALD
– Characterization techniques: Raman,
PL, XPS, TEM SHG, CL
– Key problems: polytype, thickness,
electronic structure
• What is second-harmonic generation
• Applications of SHG
• SHG on MX2 materials
• Conclusions
Flow of talk
23