Embed Size (px)
Citation preview

Topic 9: Exploring rate of change in other situations 345
Copyright © 2015 Charles A. Dana Center at the University of Texas at Austin, Learning Sciences Research Institute at the University of Illinois at Chicago, Agile Mind, Inc.
EXPLORING RATE OF CHANGE IN OTHER SITUATIONS
Lesson 9.1 Constant rates of change
9.1 OPENER Every autumn, the Marino Community Center uses a pump to
drain all the water from its swimming pool in order to perform pool maintenance. Picture the water being pumped from a swimming pool, then answer the following questions. Be sure
to justify your thinking.
1. Do you think the water drains at a constant rate?
2. What does it mean to drain at a constant rate?
9.1 CORE ACTIVITY 1. Complete the table showing the volume of water in the pool at
different times. 2. Use the data in the table to justify that the pool is draining at a
constant rate.
a. Find the rate of change. Include units.
b. What does the rate mean in the context of the pool situation?
Elapsed time draining in hours
Volume of water in pool in gallons

346 Unit 3 – Rate of change
Copyright © 2015 Charles A. Dana Center at the University of Texas at Austin, Learning Sciences Research Institute at the University of Illinois at Chicago, Agile Mind, Inc.
3. Consider the graph of the pool draining situation.
a. Explain why a negative rate of change makes sense for this situation.
b. What kind of situation would be described by a positive rate of change for the pool context (volume of water in pool versus elapsed time)?
c. If the rate of change for the pool context (volume of water in pool versus elapsed time) were positive, what would a graph of the data look like?
4. Using the graph, consider some possible changes to the pool situation.
a. What if the pool director rented a more powerful pump that pumped -‐200 gallons/hour? Plot that data on the grid using a small square for each point.
b. What if the pool had 1350 gallons to start and drained at the same rate as that shown in the original graph? Plot that data on the grid using a small triangle for each point.
c. What if the pool had 1050 gallons to start and drained at -‐200 gallons/hour? Plot that data on the grid using a small diamond for each point.
d. What if the pool started with the same amount of water as in the original graph, but the pool director decided not to drain the pool that day? Plot that data on the grid using a small star for each point.
9.1 CONSOLIDATION ACTIVITY 1. Suppose you want to work out on a stationary exercise
bicycle. The number of calories you will burn depends on the number of minutes you pedal.
a. Find the first differences in time and in calories burned.
b. Use the first differences to calculate the rate of
change. What are the units of the rate of change?

Topic 9: Exploring rate of change in other situations 347
Copyright © 2015 Charles A. Dana Center at the University of Texas at Austin, Learning Sciences Research Institute at the University of Illinois at Chicago, Agile Mind, Inc.
2. Now, consider what happens to the graph if something changes about the exercise situation.
a. What if you burn twice as many calories per minute? Plot that data on the grid using a small square for each point.
b. What if you ride the bicycle for 30 minutes at the same rate as that shown in the original graph, but then decide to stop riding the bicycle and rest for another 30 minutes? Plot that data on the grid using a small star for each point.
3. The table and graph show the amount of money collected in terms of the number of caps sold.
a. What is the rate of change of these data? Justify the rate of change using both the table and the graph.
Baseball Team Cap Sales
Number of caps sold
Amount collected
0 $0.00
1 $10.00
3 $30.00
5 $50.00
6 $60.00
9 $90.00
b. Interpret the rate of change in the context of the problem situation.
348 Unit 3 – Rate of change
Copyright © 2015 Charles A. Dana Center at the University of Texas at Austin, Learning Sciences Research Institute at the University of Illinois at Chicago, Agile Mind, Inc.
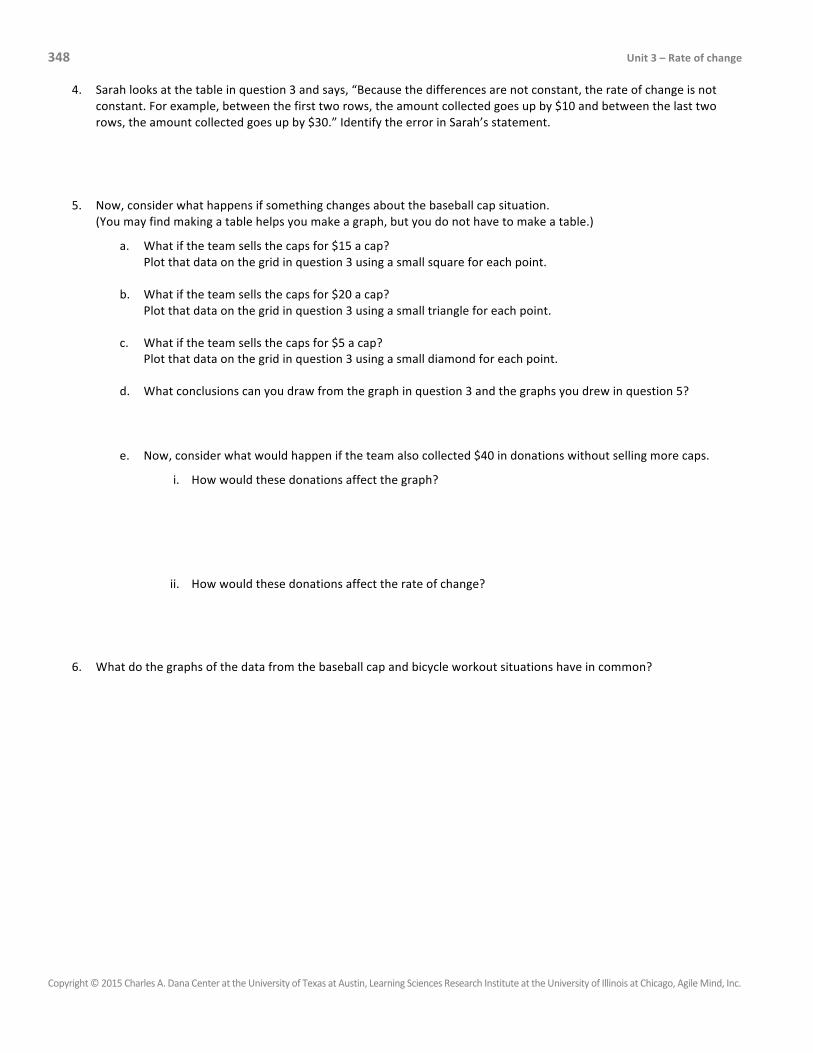
4. Sarah looks at the table in question 3 and says, “Because the differences are not constant, the rate of change is not constant. For example, between the first two rows, the amount collected goes up by $10 and between the last two rows, the amount collected goes up by $30.” Identify the error in Sarah’s statement.
5. Now, consider what happens if something changes about the baseball cap situation. (You may find making a table helps you make a graph, but you do not have to make a table.)
a. What if the team sells the caps for $15 a cap? Plot that data on the grid in question 3 using a small square for each point.
b. What if the team sells the caps for $20 a cap? Plot that data on the grid in question 3 using a small triangle for each point.
c. What if the team sells the caps for $5 a cap? Plot that data on the grid in question 3 using a small diamond for each point.
d. What conclusions can you draw from the graph in question 3 and the graphs you drew in question 5?
e. Now, consider what would happen if the team also collected $40 in donations without selling more caps.
i. How would these donations affect the graph?
ii. How would these donations affect the rate of change?
6. What do the graphs of the data from the baseball cap and bicycle workout situations have in common?
Topic 9: Exploring rate of change in other situations 349
Copyright © 2015 Charles A. Dana Center at the University of Texas at Austin, Learning Sciences Research Institute at the University of Illinois at Chicago, Agile Mind, Inc.
HOMEWORK 9.1
Notes or additional instructions based on whole-‐class discussion of homework assignment:
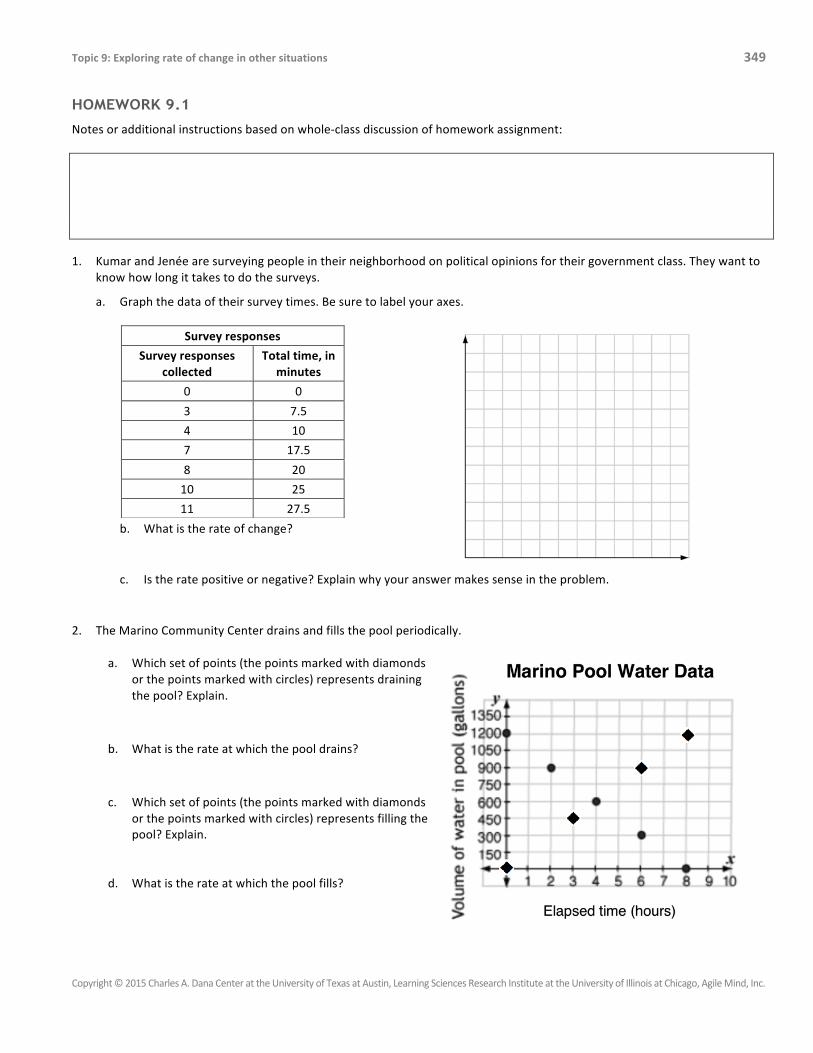
1. Kumar and Jenée are surveying people in their neighborhood on political opinions for their government class. They want to know how long it takes to do the surveys.
a. Graph the data of their survey times. Be sure to label your axes.
b. What is the rate of change?
c. Is the rate positive or negative? Explain why your answer makes sense in the problem.
2. The Marino Community Center drains and fills the pool periodically.
a. Which set of points (the points marked with diamonds or the points marked with circles) represents draining the pool? Explain.
b. What is the rate at which the pool drains?
c. Which set of points (the points marked with diamonds or the points marked with circles) represents filling the pool? Explain.
d. What is the rate at which the pool fills?
Survey responses
Survey responses collected
Total time, in minutes
0 0
3 7.5
4 10
7 17.5
8 20
10 25
11 27.5

350 Unit 3 – Rate of change
Copyright © 2015 Charles A. Dana Center at the University of Texas at Austin, Learning Sciences Research Institute at the University of Illinois at Chicago, Agile Mind, Inc.
3. Two elevators, A and B, travel at different rates. The graphs represent their heights above ground level in floor numbers.
a. Elevator A moves more quickly than Elevator B. On the graph, label the line that represents Elevator A and the line that represents Elevator B.
b. What is the rate of each elevator?
4. Now suppose Elevator A takes the same ride but starts one floor higher.
a. On the same graph, sketch a new line to represent Elevator A. Label it A' (pronounced “A prime”).
b. How does the rate of change shown by line A' compare to that of line A?
c. How is line A' different from line A? 5. A technician works on Elevator B. Now Elevator B moves twice as fast.
a. On the same graph, sketch a new line to represent Elevator B. Label it B' (pronounced “B prime”). b. How does the rate of change shown by line B' compare to that of line B?
c. How is line B' different from line B?
Topic 9: Exploring rate of change in other situations 351
Copyright © 2015 Charles A. Dana Center at the University of Texas at Austin, Learning Sciences Research Institute at the University of Illinois at Chicago, Agile Mind, Inc.
STAYING SHARP 9.1 Practicing
algeb
ra skills & con
cepts
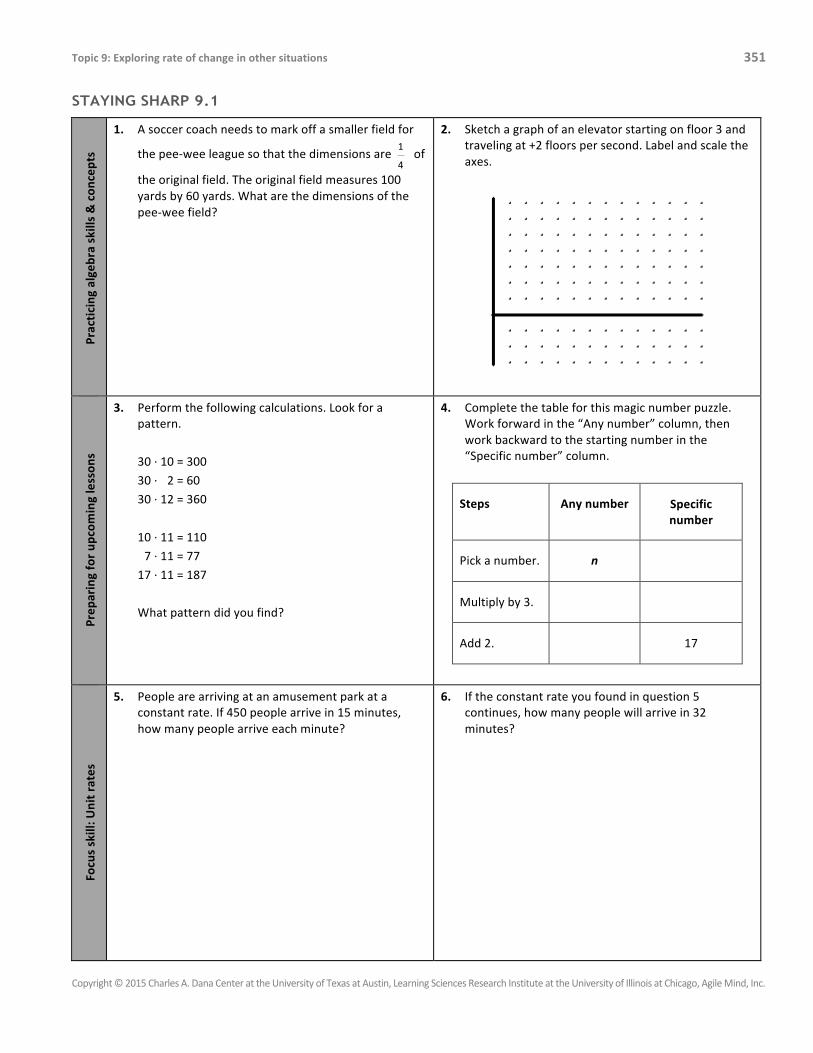
1. A soccer coach needs to mark off a smaller field for
the pee-‐wee league so that the dimensions are of
the original field. The original field measures 100 yards by 60 yards. What are the dimensions of the pee-‐wee field?
2. Sketch a graph of an elevator starting on floor 3 and traveling at +2 floors per second. Label and scale the axes.
Prep
aring for up
coming lesson
s
3. Perform the following calculations. Look for a pattern.
30 ·∙ 10 = 300
30 ·∙ 12 = 60
30 ·∙ 12 = 360
10 ·∙ 11 = 110
17 ·∙ 11 = 77
17 ·∙ 11 = 187
What pattern did you find?
4. Complete the table for this magic number puzzle. Work forward in the “Any number” column, then work backward to the starting number in the “Specific number” column.
Steps Any number Specific number
Pick a number. n
Multiply by 3.
Add 2. 17
Focus skill: U
nit rates
5. People are arriving at an amusement park at a constant rate. If 450 people arrive in 15 minutes, how many people arrive each minute?
6. If the constant rate you found in question 5 continues, how many people will arrive in 32 minutes?

352 Unit 3 – Rate of change
Copyright © 2015 Charles A. Dana Center at the University of Texas at Austin, Learning Sciences Research Institute at the University of Illinois at Chicago, Agile Mind, Inc.

Topic 9: Exploring rate of change in other situations 353
Copyright © 2015 Charles A. Dana Center at the University of Texas at Austin, Learning Sciences Research Institute at the University of Illinois at Chicago, Agile Mind, Inc.
Lesson 9.2 Proportional relationships
9.2 OPENER Three people hiked the same trail. Each line on the graph represents the relationship between the elapsed time and the distance from the beginning of the trail for one of the people.
1. What does each person have in common?
2. What is different for each person?
3. At what rate is each person hiking?
9.2 CORE ACTIVITY Joshua’s job at the Jean-‐E factory is inspecting blue jeans for defects. When he finds a certain number of pairs of defective jeans, the machinery must be stopped for maintenance. Of the 84 pairs he has inspected so far, only 3 have had defects.
If the defect rate stays constant, what else can you determine about this situation?
1. A table can show how many pairs of blue jeans Joshua will inspect if the defect rate stays constant.
a. Complete the table.
Pairs of jeans with
defects
Pairs of jeans
inspected
3 84
6
8
12
15
b. Use the table to find the rate of change.

354 Unit 3 – Rate of change
Copyright © 2015 Charles A. Dana Center at the University of Texas at Austin, Learning Sciences Research Institute at the University of Illinois at Chicago, Agile Mind, Inc.
2. Express the rate of change in two other ways.
a. Complete the following statement:
Joshua should expect to find 1 pair of jeans with defects for every _________ pairs of jeans he inspects.
b. What is the ratio of the number of pairs of jeans inspected to the number of pairs of jeans with defects?
a. Represent this relationship in two other ways.
a. Write a function rule to represent the blue jean situation by relating y, the number of pairs of jeans inspected, to x, the number of pairs of jeans with defects.
b. Graph the data representing Joshua’s blue jean
inspections.
b. Apply your understanding of the relationship to answer these questions.
a. How many pairs of blue jeans will Joshua need to inspect to find 30 pairs with defects?
b. How many pairs of blue jeans will Joshua need to inspect to find x pairs with defects? Show your work.
c. How many pairs of blue jeans with defects will Joshua find if he inspects 252 pairs?
Show how you can find the answer using the table, a graph, and the function rule.
c. Describe two key terms related to this situation.
a. Why do we say the number of pairs of jeans inspected is proportional to the number of pairs of jeans with defects?
b. What is the constant of proportionality for this situation?
Topic 9: Exploring rate of change in other situations 355
Copyright © 2015 Charles A. Dana Center at the University of Texas at Austin, Learning Sciences Research Institute at the University of Illinois at Chicago, Agile Mind, Inc.
You have now worked with proportional relationships represented as tables or graphs. Use the Co-‐construction Routine to identify ways you can recognize and apply proportional relationships.
Co-‐construction Routine
Step 1. Work with your partner
Write observations and/or solutions on your whiteboard.
Step 2. Discuss your observations and/or solutions with the class Decide as a class which conclusions can accurately be drawn.
Step 3. Record the conclusions in your activity book
Discuss the following questions with your partner and write at least two responses on your whiteboards:
• What are important graphical features of proportional relationships?
• From a table of values that represents a proportional relationship, how can you write a function rule that relates the two variables?
• For a proportional relationship, how can you find one variable from the value of the other variable, using
o a graphical method?
o a tabular method?
o a method using function rules?
d. Record the co-‐constructed conclusions.
Graphical features of proportional relationships
Writing a function rule that relates two variables in a proportional relationship
Finding the value of one variable from the other variable in a proportional relationship
356 Unit 3 – Rate of change
Copyright © 2015 Charles A. Dana Center at the University of Texas at Austin, Learning Sciences Research Institute at the University of Illinois at Chicago, Agile Mind, Inc.
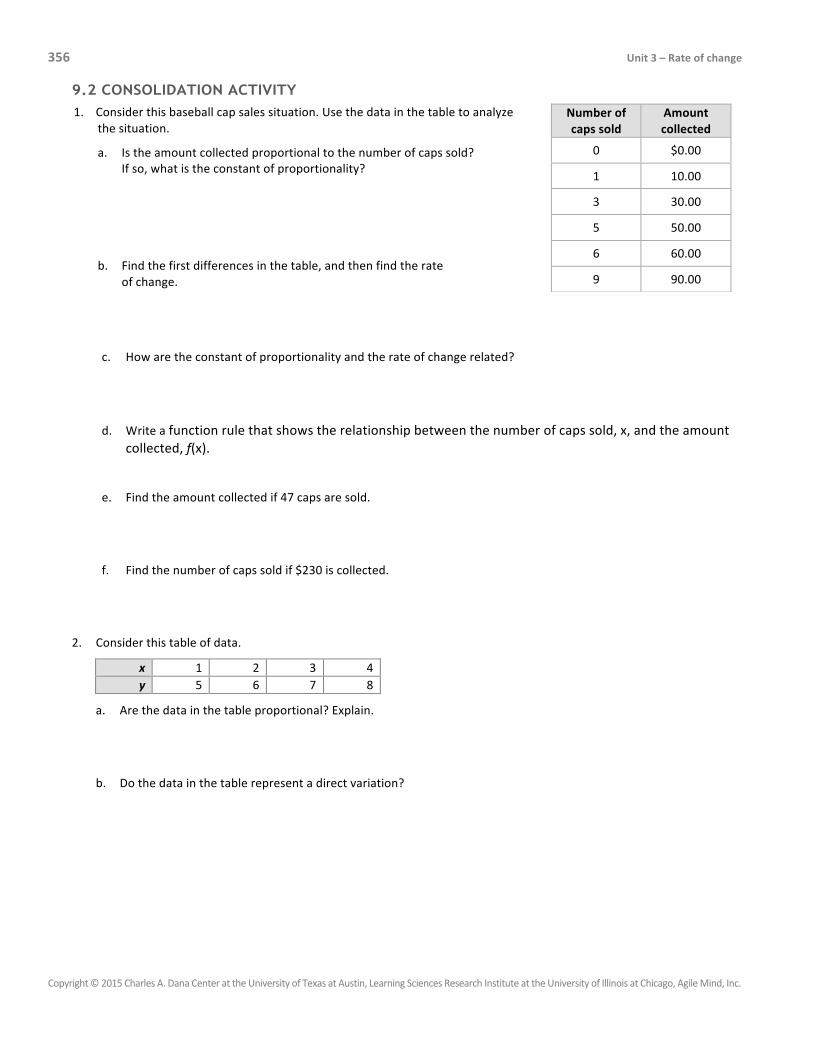
9.2 CONSOLIDATION ACTIVITY 1. Consider this baseball cap sales situation. Use the data in the table to analyze
the situation.
a. Is the amount collected proportional to the number of caps sold? If so, what is the constant of proportionality?
b. Find the first differences in the table, and then find the rate of change.
Number of caps sold
Amount collected
0 $0.00
1 10.00
3 30.00
5 50.00
6 60.00
9 90.00
c. How are the constant of proportionality and the rate of change related?
d. Write a function rule that shows the relationship between the number of caps sold, x, and the amount collected, f(x).
e. Find the amount collected if 47 caps are sold.
f. Find the number of caps sold if $230 is collected.
2. Consider this table of data.
x 1 2 3 4 y 5 6 7 8
a. Are the data in the table proportional? Explain.
b. Do the data in the table represent a direct variation?
Topic 9: Exploring rate of change in other situations 357
Copyright © 2015 Charles A. Dana Center at the University of Texas at Austin, Learning Sciences Research Institute at the University of Illinois at Chicago, Agile Mind, Inc.
3. Now compare and contrast graphical representations of the data in questions 1 and 2.
a. Graph the data from the baseball cap situation in question 1.
b. Graph the data from the table in question 2.
c. What is similar about the two graphs?
d. What is different about the two graphs?

358 Unit 3 – Rate of change
Copyright © 2015 Charles A. Dana Center at the University of Texas at Austin, Learning Sciences Research Institute at the University of Illinois at Chicago, Agile Mind, Inc.
HOMEWORK 9.2
Notes or additional instructions based on whole-‐class discussion of homework assignment:
1. What are important graphical features of proportional relationships? Circle all correct statements:
a. The graph is a straight line.
b. The line has a y-‐intercept of 0.
c. The line passes through the origin.
d. The line has an x-‐intercept of 0.
e. The line passes through the point (0,0).
Use the graph to answer questions 2–5.
2. Which lines represent proportional relationships? Explain how you know.
3. Find the rate of change for each line.
A:
B:
C:
D:
E:
4. Find the constant of proportionality for each proportional
relationship. 5. Write a function rule for each proportional relationship.
Topic 9: Exploring rate of change in other situations 359
Copyright © 2015 Charles A. Dana Center at the University of Texas at Austin, Learning Sciences Research Institute at the University of Illinois at Chicago, Agile Mind, Inc.
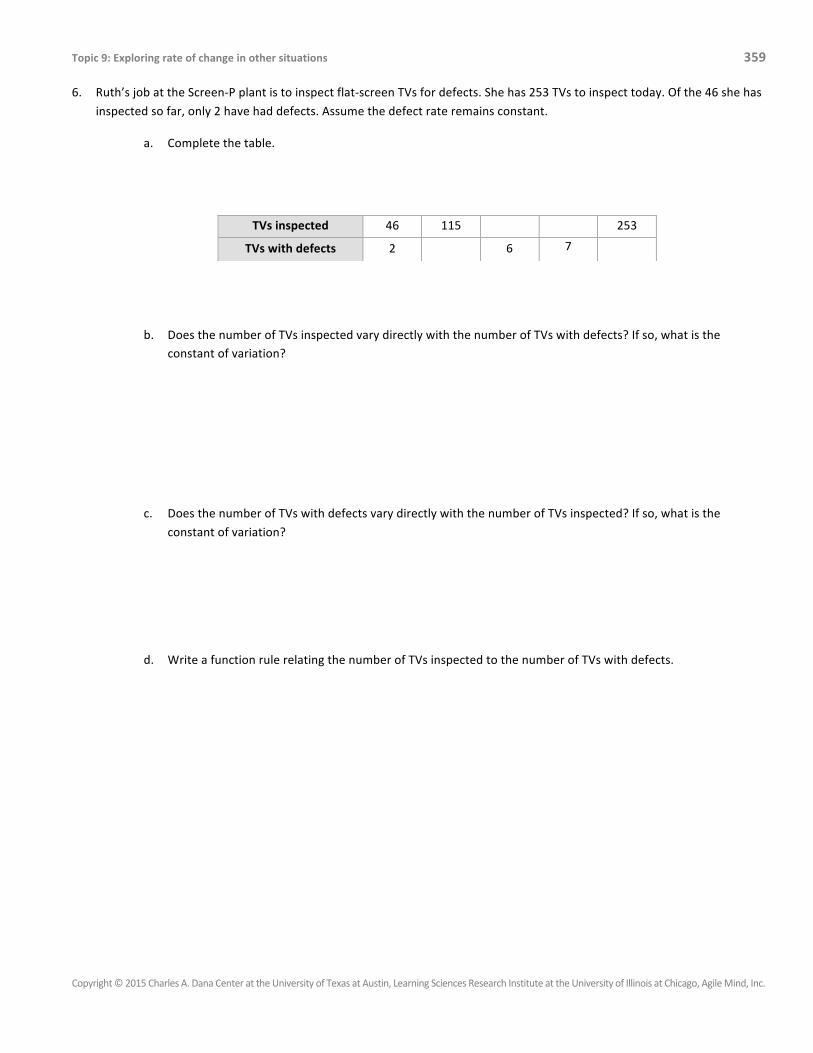
6. Ruth’s job at the Screen-‐P plant is to inspect flat-‐screen TVs for defects. She has 253 TVs to inspect today. Of the 46 she has
inspected so far, only 2 have had defects. Assume the defect rate remains constant.
a. Complete the table.
b. Does the number of TVs inspected vary directly with the number of TVs with defects? If so, what is the constant of variation?
c. Does the number of TVs with defects vary directly with the number of TVs inspected? If so, what is the
constant of variation?
d. Write a function rule relating the number of TVs inspected to the number of TVs with defects.
TVs inspected 46 115 253
TVs with defects 2 6 7

360 Unit 3 – Rate of change
Copyright © 2015 Charles A. Dana Center at the University of Texas at Austin, Learning Sciences Research Institute at the University of Illinois at Chicago, Agile Mind, Inc.
7. Complete the math journal to help you organize information about important proportional relationship concepts. State ideas in your own words; you can refer to your notes and work in the activity book if you need help.
Concept My answer or understanding
of this concept
An example that illustrates this
concept (new or from the lesson or homework)
a. What does it mean to say y is proportional to x?
b. What is a constant of proportionality?
c. How do you know if a graph represents a proportional relationship?
d. How do you write a function rule for a proportional relationship?
Topic 9: Exploring rate of change in other situations 361
Copyright © 2015 Charles A. Dana Center at the University of Texas at Austin, Learning Sciences Research Institute at the University of Illinois at Chicago, Agile Mind, Inc.
STAYING SHARP 9.2 Practicing
algeb
ra skills & con
cepts
1. If you received a score of 80% on an assignment, what is the ratio of correct answers to incorrect answers?
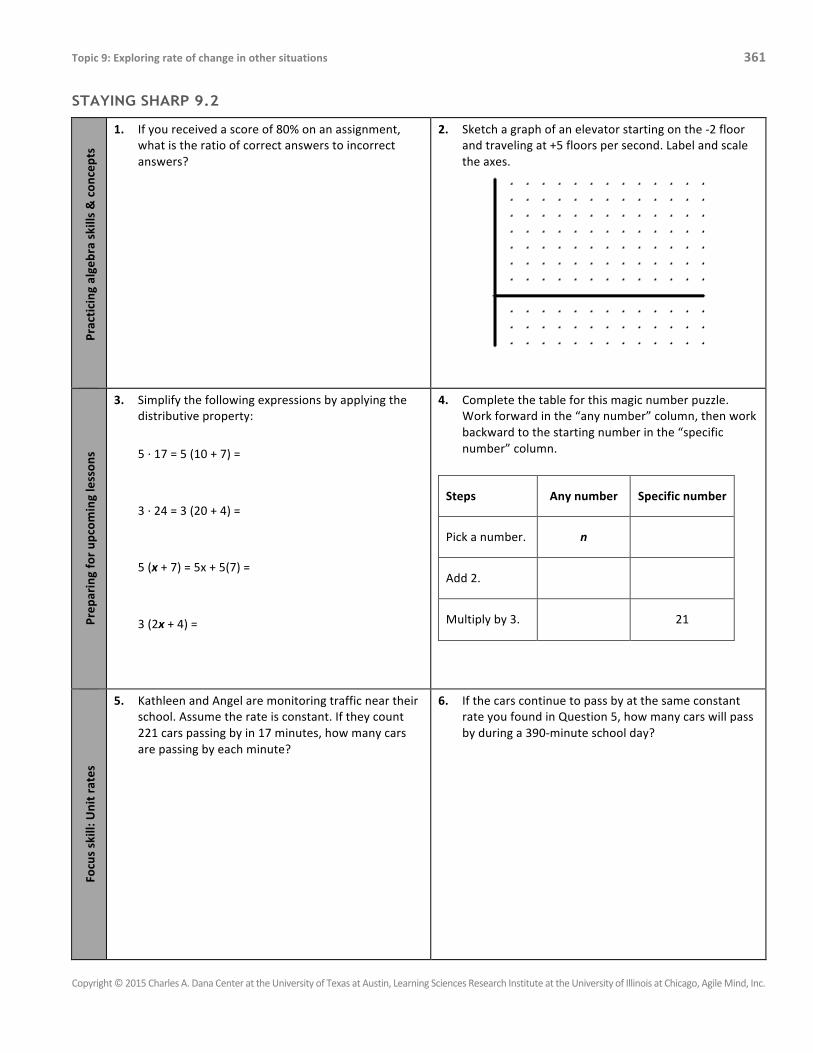
2. Sketch a graph of an elevator starting on the -‐2 floor and traveling at +5 floors per second. Label and scale the axes.
Prep
aring for up
coming lesson
s
3. Simplify the following expressions by applying the distributive property:
5 ·∙ 17 = 5 (10 + 7) =
3 ·∙ 24 = 3 (20 + 4) =
5 (x + 7) = 5x + 5(7) =
3 (2x + 4) =
4. Complete the table for this magic number puzzle. Work forward in the “any number” column, then work backward to the starting number in the “specific number” column.
Steps Any number Specific number
Pick a number. n
Add 2.
Multiply by 3. 21
Focus skill: U
nit rates
5. Kathleen and Angel are monitoring traffic near their school. Assume the rate is constant. If they count 221 cars passing by in 17 minutes, how many cars are passing by each minute?
6. If the cars continue to pass by at the same constant rate you found in Question 5, how many cars will pass by during a 390-‐minute school day?

362 Unit 3 – Rate of change
Copyright © 2015 Charles A. Dana Center at the University of Texas at Austin, Learning Sciences Research Institute at the University of Illinois at Chicago, Agile Mind, Inc.

Topic 9: Exploring rate of change in other situations 363
Copyright © 2015 Charles A. Dana Center at the University of Texas at Austin, Learning Sciences Research Institute at the University of Illinois at Chicago, Agile Mind, Inc.
Lesson 9.3 More on proportional relationships
9.3 OPENER The parents of the baseball team members want to raise money for new uniforms. The parents order team baseball caps and sell them at pep rallies and games. They sell the caps for $10 each. They pay a design fee of $100, plus $3.50 for each baseball cap they order from the manufacturer. These tables show the money they spend for each cap they order and the money they collect for each cap they sell.
Caps Ordered Cap Sales
Number of caps ordered
Amount paid Number of caps sold Amount collected
0 $100.00 0 $00.00
1 $103.50 1 $10.00
2 $107.00 2 $20.00
3 $110.50 3 $30.00
4 $114.00 4 $40.00
5 $117.50 5 $50.00
1. Does the cap order situation represent a
proportional relationship? How do you know? 2. Does the cap sale situation represent a proportional
relationship? How do you know?.
9.3 CORE ACTIVITY 1. Complete the table to show amounts and ratios of blue to yellow paint to produce the shade of green paint in the
animation.
Cups of blue Cups of yellow Ratio of blue to yellow
364 Unit 3 – Rate of change
Copyright © 2015 Charles A. Dana Center at the University of Texas at Austin, Learning Sciences Research Institute at the University of Illinois at Chicago, Agile Mind, Inc.
2. In question 1, you found different amounts of yellow and blue paint that create a certain shade of green. Use that work to answer the following questions:
a. Graph the data from your table.
b. How do you know that the relationship you graphed is proportional?
c. What is the constant of proportionality?
d. Write a function rule that you could use to find the number of cups of blue paint, b, you would need to make this shade of green given any number of cups of yellow paint, y.
Topic 9: Exploring rate of change in other situations 365
Copyright © 2015 Charles A. Dana Center at the University of Texas at Austin, Learning Sciences Research Institute at the University of Illinois at Chicago, Agile Mind, Inc.
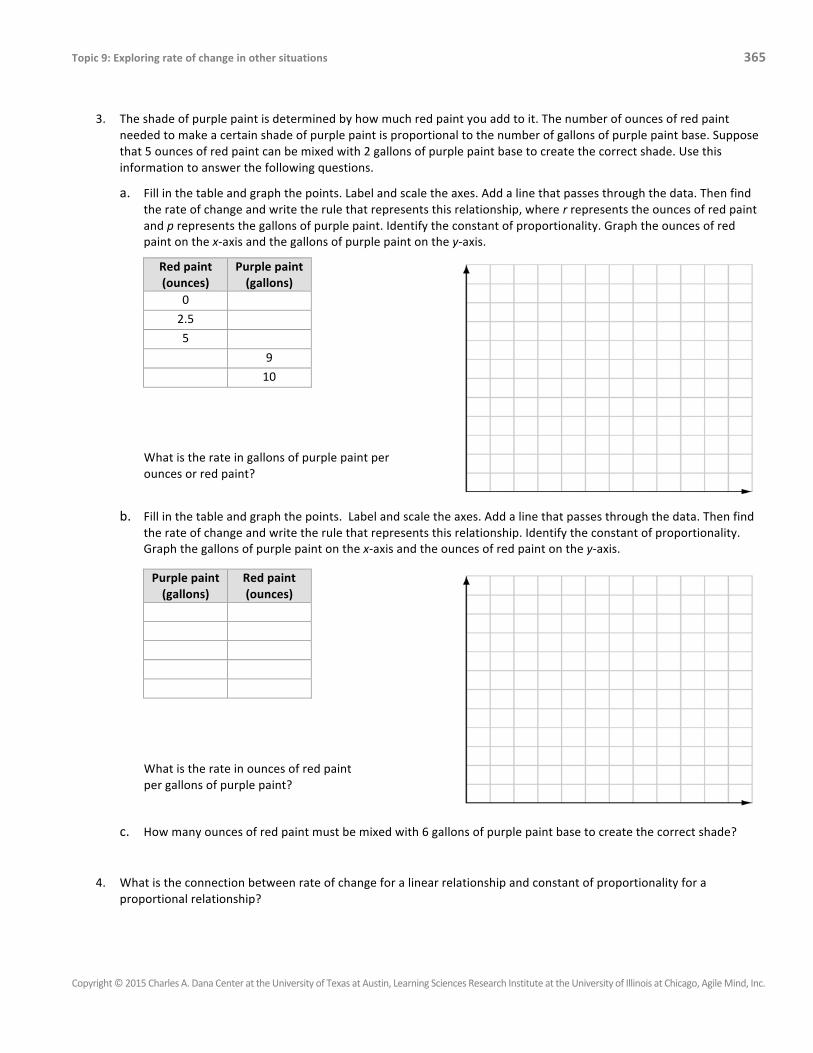
3. The shade of purple paint is determined by how much red paint you add to it. The number of ounces of red paint needed to make a certain shade of purple paint is proportional to the number of gallons of purple paint base. Suppose that 5 ounces of red paint can be mixed with 2 gallons of purple paint base to create the correct shade. Use this information to answer the following questions.
a. Fill in the table and graph the points. Label and scale the axes. Add a line that passes through the data. Then find the rate of change and write the rule that represents this relationship, where r represents the ounces of red paint and p represents the gallons of purple paint. Identify the constant of proportionality. Graph the ounces of red paint on the x-‐axis and the gallons of purple paint on the y-‐axis.
Red paint (ounces)
Purple paint (gallons)
0
2.5
5
9
10
What is the rate in gallons of purple paint per ounces or red paint?
b. Fill in the table and graph the points. Label and scale the axes. Add a line that passes through the data. Then find the rate of change and write the rule that represents this relationship. Identify the constant of proportionality. Graph the gallons of purple paint on the x-‐axis and the ounces of red paint on the y-‐axis.
Purple paint (gallons)
Red paint (ounces)
What is the rate in ounces of red paint per gallons of purple paint?
c. How many ounces of red paint must be mixed with 6 gallons of purple paint base to create the correct shade?
4. What is the connection between rate of change for a linear relationship and constant of proportionality for a proportional relationship?

366 Unit 3 – Rate of change
Copyright © 2015 Charles A. Dana Center at the University of Texas at Austin, Learning Sciences Research Institute at the University of Illinois at Chicago, Agile Mind, Inc.
You have examined proportional relationships represented in various ways. Now, use the Co-‐construction Routine to identify ways you can determine if a linear relationship is proportional.
Co-‐construction Routine
Step 1. Work with your partner Write observations and/or solutions on your whiteboard.
Step 2. Discuss your observations and/or solutions with the class
Decide as a class which conclusions can accurately be drawn. Step 3. Record the conclusions in your activity book
Discuss the following questions with your partner and write at least two responses on your whiteboards:
• I know a table represents a proportional relationship when…
• I know a graph represents a proportional relationship when…
• I know a verbal description represents a proportional relationship when…
• I know a function rule represents a proportional relationship when…
5. Record the co-‐constructed conclusions.
Characteristics of a representation of a proportional relationship

Topic 9: Exploring rate of change in other situations 367
Copyright © 2015 Charles A. Dana Center at the University of Texas at Austin, Learning Sciences Research Institute at the University of Illinois at Chicago, Agile Mind, Inc.
9.3 CONSOLIDATION ACTIVITY
1. The mini-‐golf course charges $1 to rent a club and $3 for each game. Bowen says, “They charge the same amount for each game, so I can just multiply my number of games to find my total cost. This is a proportional relationship.”
a. Complete the table.
Number of games Total cost
1 2 3 4
b. Is Bowen correct? Explain why or why not.
2. Nicole is examining a graph of some nutritional data. She says, “The graph does not pass through (0, 0), so this is not a proportional relationship.” Is Nicole correct? Explain why or why not.
3. Now, it is your turn to write a problem based on a context of your choice. Think of a context in which two quantities are related. It can be real or imaginary.
a. Decide on your input and output variables and define them here.
b. Make a table representing a linear relationship between your variables.

368 Unit 3 – Rate of change
Copyright © 2015 Charles A. Dana Center at the University of Texas at Austin, Learning Sciences Research Institute at the University of Illinois at Chicago, Agile Mind, Inc.
4. Trade pages with your partner. Answer the following questions using your partner’s table:
a. Verify that the table represents a linear relationship.
b. Find the rate of change.
c. Does the table represent a proportional or a nonproportional relationship? Explain.
5. Discuss your results with your partner. Do you both agree on your answers? Be ready to share.

Topic 9: Exploring rate of change in other situations 369
Copyright © 2015 Charles A. Dana Center at the University of Texas at Austin, Learning Sciences Research Institute at the University of Illinois at Chicago, Agile Mind, Inc.
HOMEWORK 9.3
Notes or additional instructions based on whole-‐class discussion of homework assignment:
The values in the tables represent points on lines. Use them to answer questions 1–3.
A B C D x y x y x y x y -‐2 -‐3 0 -‐1 -‐1 -‐2 -‐3 3 0 0 8 7 1 2 4 -‐4
1. Which tables of data represent proportional relationships? Explain how you know.
2. Find the rate of change for each table of data. Write a function rule for each proportional relationship.
A:
B:
C:
D:
3. Graph the data. Label and scale the axes. For each data set, add a line that passes through the data and label the line A-‐D, using the letter that matches the data in the table.
Free Simple Grid Graph Paper from http://incompetech.com/graphpaper/lite/

370 Unit 3 – Rate of change
Copyright © 2015 Charles A. Dana Center at the University of Texas at Austin, Learning Sciences Research Institute at the University of Illinois at Chicago, Agile Mind, Inc.
The tables and graphs in questions 4 and 5 represent a skateboarder skating at a constant rate of change. In the tables and graphs, x represents time elapsed in seconds and y represents distance from the starting position in feet. Fill in the missing information (complete the table, construct the graph, and find the rate).
x y 5. x y
0 0 0
1 2 3
2 10 3
3 5
4.
How fast was he skating?
How fast was he skating?

Topic 9: Exploring rate of change in other situations 371
Copyright © 2015 Charles A. Dana Center at the University of Texas at Austin, Learning Sciences Research Institute at the University of Illinois at Chicago, Agile Mind, Inc.
STAYING SHARP 9.3 Practicing
algeb
ra skills & con
cepts
1. Find the ratio of width to length for the rectangles listed. Simplify each ratio.
Width Length Ratio
0.2 0.8
0.4 1.6
0.5 2.0
0.6 2.4
Are the rectangles similar?
2. Sketch a graph of an elevator starting on the -‐2 floor and traveling at 1.5 floors per second. Label and scale the axes.
Prep
aring for up
coming lesson
s
3. A classroom contains 3 chairs, 4 dictionaries, 8 desks, and 5 textbooks.
How many books are there?
How many pieces of furniture are there?
3 + 4 + 8 + 5 = 20. Why wouldn't it make sense to say that there are 20 books?
4. Complete the table for this magic number puzzle by working backward to the starting number in the “specific number” column.
Steps Any number Specific number
Pick a number. n
Multiply by 4. 4n
Add 11. 4n + 11 23
Your table also solves the equation 4n + 11 = 23. Confirm that the starting number you found makes this equation true when you substitute it for n:
Focus skill: U
nit rates
5. Raymond and Lei are buying rope for their field trip on a boat. If they pay $73.50 for 30 feet of rope, how much does the rope cost per foot?
6. Use your answer to question 5 to determine how much 71 feet of rope would cost.

372 Unit 3 – Rate of change
Copyright © 2015 Charles A. Dana Center at the University of Texas at Austin, Learning Sciences Research Institute at the University of Illinois at Chicago, Agile Mind, Inc.

Topic 9: Exploring rate of change in other situations 373
Copyright © 2015 Charles A. Dana Center at the University of Texas at Austin, Learning Sciences Research Institute at the University of Illinois at Chicago, Agile Mind, Inc.
Lesson 9.4 Rates that are not constant
9.4 OPENER The graphs represent two different skateboarders’ distance from a motion detector over time.
Compare the two graphs. Consider the starting points, directions, and rates of change in your comparison.
What are some differences between the rides represented by the graphs?
9.4 CORE ACTIVITY 1. Fold a piece of paper in half, then open it and record the number of rectangles formed. Refold the paper, fold it in half
again, and record the number of rectangles formed. Continue this process five times, until your table is complete.
Creating Rectangles by Folding Paper
Number of folds Number of rectangles
0 1
1
2
3
4
5
2. Graph the data. What do you notice about the rate of change?
374 Unit 3 – Rate of change
Copyright © 2015 Charles A. Dana Center at the University of Texas at Austin, Learning Sciences Research Institute at the University of Illinois at Chicago, Agile Mind, Inc.
3. Analyze the table and graph to understand the relationship.
a. Find the first differences in the number of folds and number of rectangles. After finding the first differences, find the differences between the first differences. Mark the differences on the table. What patterns do you see?
b. Can you find a common multiplier among the first differences? If so, what is it?
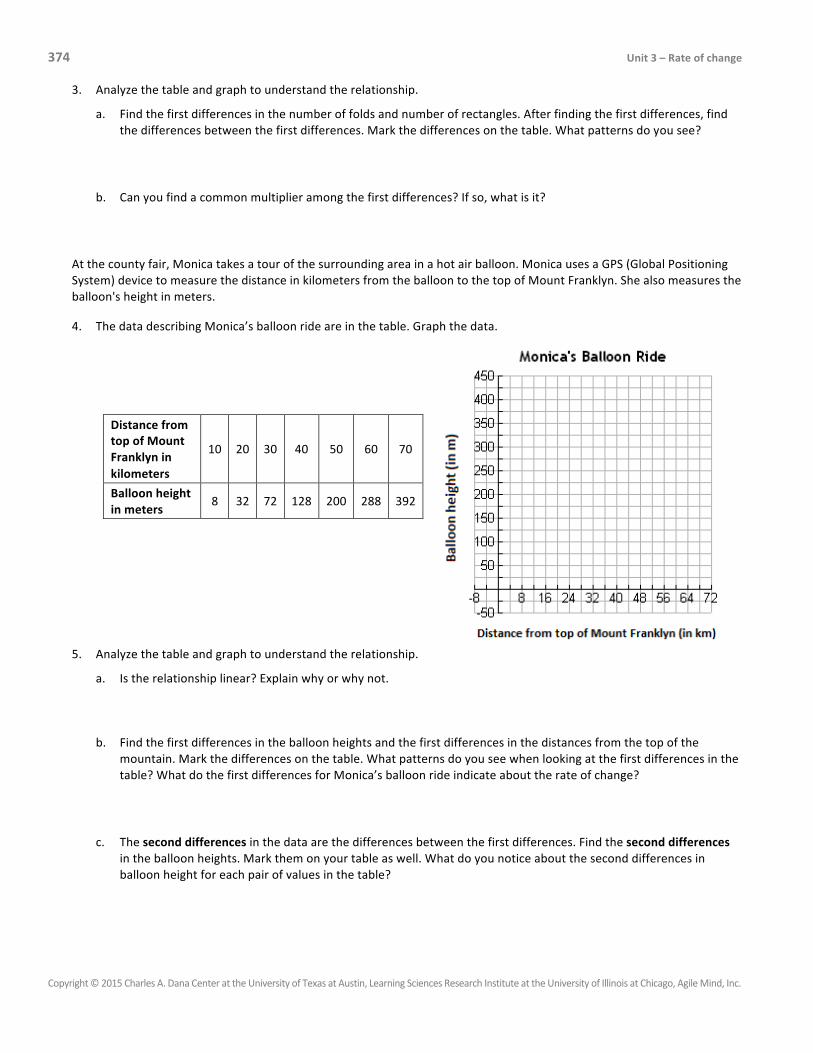
At the county fair, Monica takes a tour of the surrounding area in a hot air balloon. Monica uses a GPS (Global Positioning System) device to measure the distance in kilometers from the balloon to the top of Mount Franklyn. She also measures the balloon's height in meters.
4. The data describing Monica’s balloon ride are in the table. Graph the data.
Distance from top of Mount Franklyn in kilometers
10 20 30 40 50 60 70
Balloon height in meters
8 32 72 128 200 288 392
5. Analyze the table and graph to understand the relationship.
a. Is the relationship linear? Explain why or why not.
b. Find the first differences in the balloon heights and the first differences in the distances from the top of the mountain. Mark the differences on the table. What patterns do you see when looking at the first differences in the table? What do the first differences for Monica’s balloon ride indicate about the rate of change?
c. The second differences in the data are the differences between the first differences. Find the second differences in the balloon heights. Mark them on your table as well. What do you notice about the second differences in balloon height for each pair of values in the table?
Topic 9: Exploring rate of change in other situations 375
Copyright © 2015 Charles A. Dana Center at the University of Texas at Austin, Learning Sciences Research Institute at the University of Illinois at Chicago, Agile Mind, Inc.
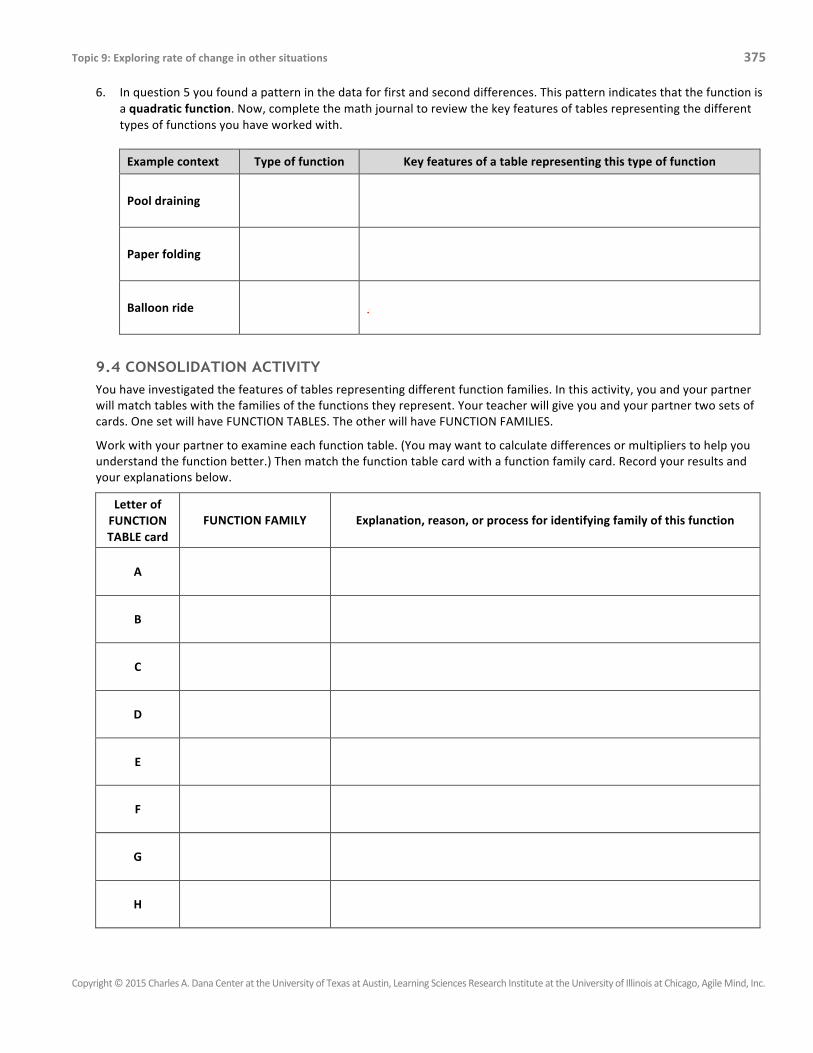
6. In question 5 you found a pattern in the data for first and second differences. This pattern indicates that the function is a quadratic function. Now, complete the math journal to review the key features of tables representing the different types of functions you have worked with.
Example context Type of function Key features of a table representing this type of function
Pool draining
Paper folding
Balloon ride .
9.4 CONSOLIDATION ACTIVITY You have investigated the features of tables representing different function families. In this activity, you and your partner will match tables with the families of the functions they represent. Your teacher will give you and your partner two sets of cards. One set will have FUNCTION TABLES. The other will have FUNCTION FAMILIES.
Work with your partner to examine each function table. (You may want to calculate differences or multipliers to help you understand the function better.) Then match the function table card with a function family card. Record your results and your explanations below.
Letter of FUNCTION TABLE card
FUNCTION FAMILY Explanation, reason, or process for identifying family of this function
A
B
C
D
E
F
G
H
376 Unit 3 – Rate of change
Copyright © 2015 Charles A. Dana Center at the University of Texas at Austin, Learning Sciences Research Institute at the University of Illinois at Chicago, Agile Mind, Inc.
HOMEWORK 9.4 Notes or additional instructions based on whole-‐class discussion of homework assignment:
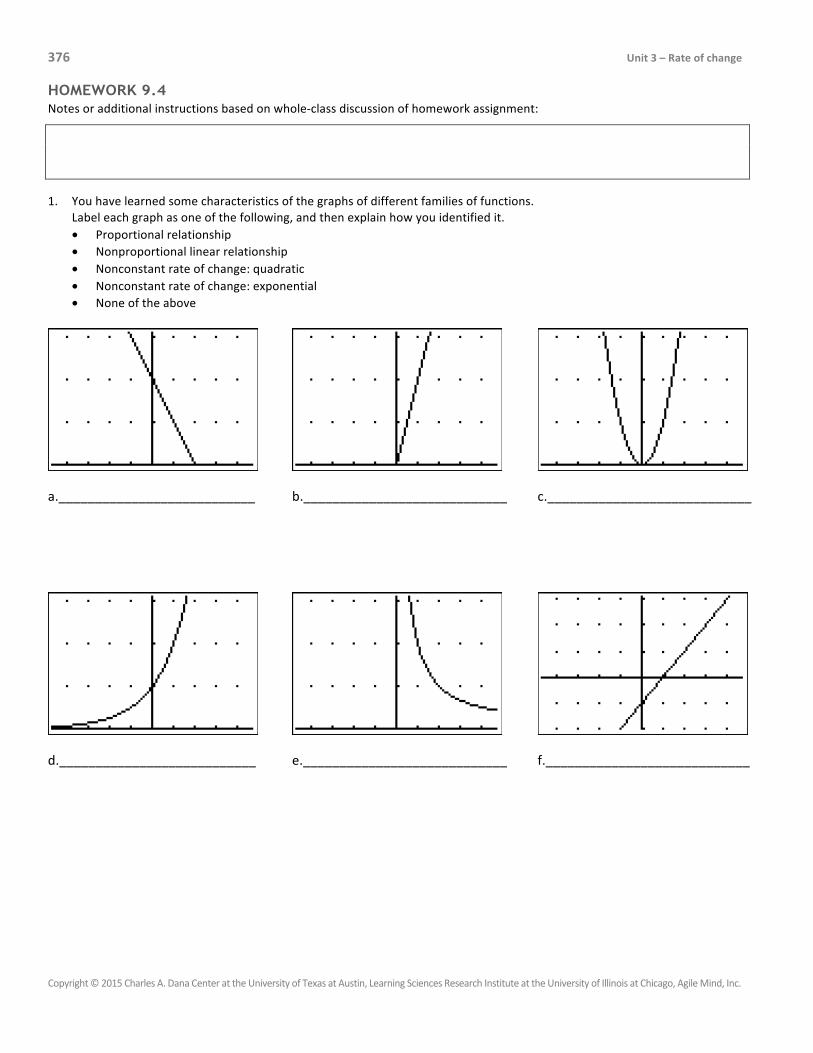
1. You have learned some characteristics of the graphs of different families of functions. Label each graph as one of the following, and then explain how you identified it. • Proportional relationship • Nonproportional linear relationship • Nonconstant rate of change: quadratic • Nonconstant rate of change: exponential • None of the above
a.___________________________ b.____________________________ c.____________________________
d.___________________________ e.____________________________ f.____________________________
Topic 9: Exploring rate of change in other situations 377
Copyright © 2015 Charles A. Dana Center at the University of Texas at Austin, Learning Sciences Research Institute at the University of Illinois at Chicago, Agile Mind, Inc.
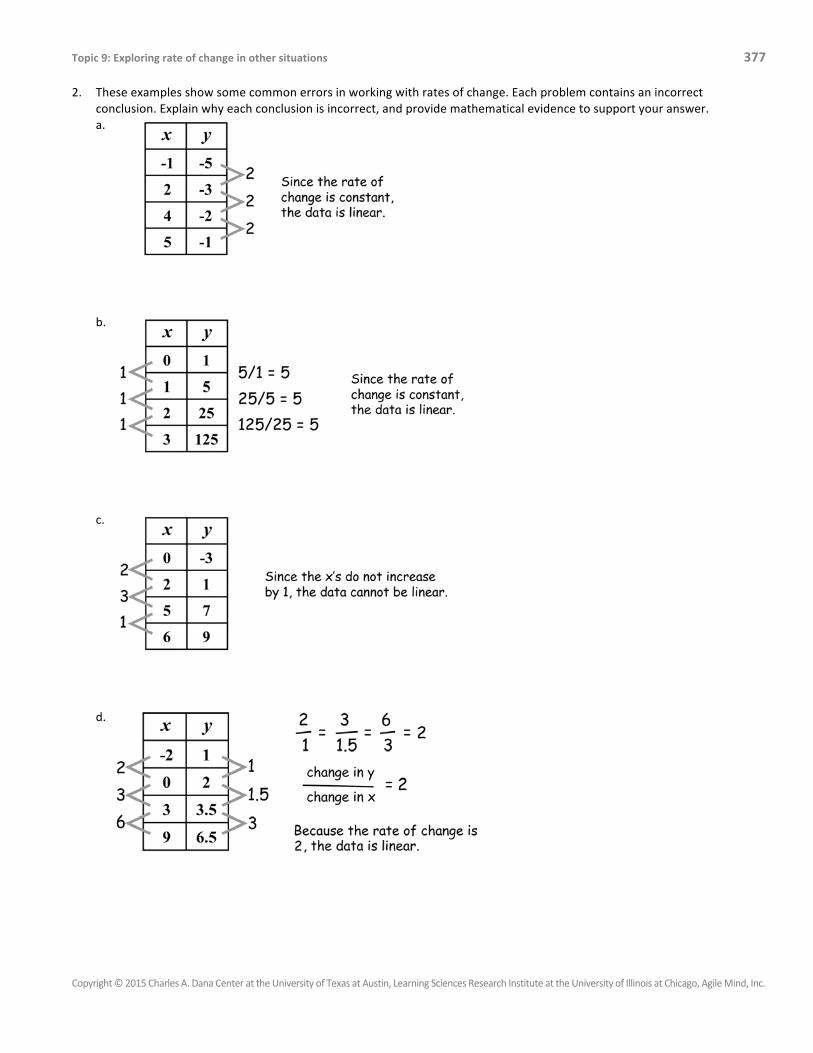
2. These examples show some common errors in working with rates of change. Each problem contains an incorrect conclusion. Explain why each conclusion is incorrect, and provide mathematical evidence to support your answer. a.
b.
c.
d.

378 Unit 3 – Rate of change
Copyright © 2015 Charles A. Dana Center at the University of Texas at Austin, Learning Sciences Research Institute at the University of Illinois at Chicago, Agile Mind, Inc.
STAYING SHARP 9.4
Practicing
algeb
ra skills & con
cepts
1. Each point on the graph represents a rectangle. Find the ratio of width to length for each rectangle. Are the rectangles similar? Explain your answer.
2. Sketch a graph of an elevator starting on floor 7 and traveling at -‐1.5 floors per second. Label and scale the axes.
Prep
aring for up
coming lesson
s
3. Rewrite each expression more simply:
5x + 4x
3y + 8y
Use the Distributive Property to rewrite the expressions without parentheses:
(5 + 4) x
(3 + 8) y
4. Bob gets 3n + 2 = 20 as the final row of his magic number puzzle table. What was his starting number? Show how you found your answer.
Focus skill: U
nit rates
5. The record-‐holder in eating chocolate ate 31.5 ounces of Chicago Chocolate Hearts in 7 minutes. Assume he ate at a constant rate. How much chocolate did he eat per minute?
6. If the record-‐holder continued eating at the same rate you found in Question 5, how much chocolate would he eat in an hour?
Do you think assuming a constant rate makes sense for this situation? Explain.

Topic 9: Exploring rate of change in other situations 379
Copyright © 2015 Charles A. Dana Center at the University of Texas at Austin, Learning Sciences Research Institute at the University of Illinois at Chicago, Agile Mind, Inc.
Lesson 9.5 Another function family
9.5 OPENER You are part of a team that started a new website. After months of hard work, your site has been sold for 12 million dollars. The team members will split the money evenly. Your share of the money will depend on how many team members there were when the site was sold.
1. Find your share of the sale price for different numbers of team members and complete the table.
2. Is the relationship between your share and the number of people linear?
How do you know?
9.5 CORE ACTIVITY Completing a house always takes 200 person-‐days of labor. This means that it takes 1 person working alone 200 days to complete a house, but 2 people working together need only 100 days to complete a house. Use this information to answer the following questions.
1. How long does it take for one person to complete a house?
2. Graph the data in this table showing the relationship between the crew size and the days each person must work to complete a house.
3. Does the graph show an increasing or decreasing function?
Number of
team members
Your share
2
4
6
8
10
12

380 Unit 3 – Rate of change
Copyright © 2015 Charles A. Dana Center at the University of Texas at Austin, Learning Sciences Research Institute at the University of Illinois at Chicago, Agile Mind, Inc.
4. Use the table and graph to determine if the rate of change for the volunteer situation is constant. Explain how you can tell from the graph and how you can tell from the table.
5. What patterns do you see in the table of data?
6. What do you notice about the product of the two quantities in each row of the table?
7. The relationship in the Construction Crew Problem is an example of inverse variation. What is a characteristic of inverse variation?
9.5 ONLINE ASSESSMENT
Today you will take an online assessment.
Topic 9: Exploring rate of change in other situations 381
Copyright © 2015 Charles A. Dana Center at the University of Texas at Austin, Learning Sciences Research Institute at the University of Illinois at Chicago, Agile Mind, Inc.
HOMEWORK 9.5 Notes or additional instructions based on whole-‐class discussion of homework assignment:
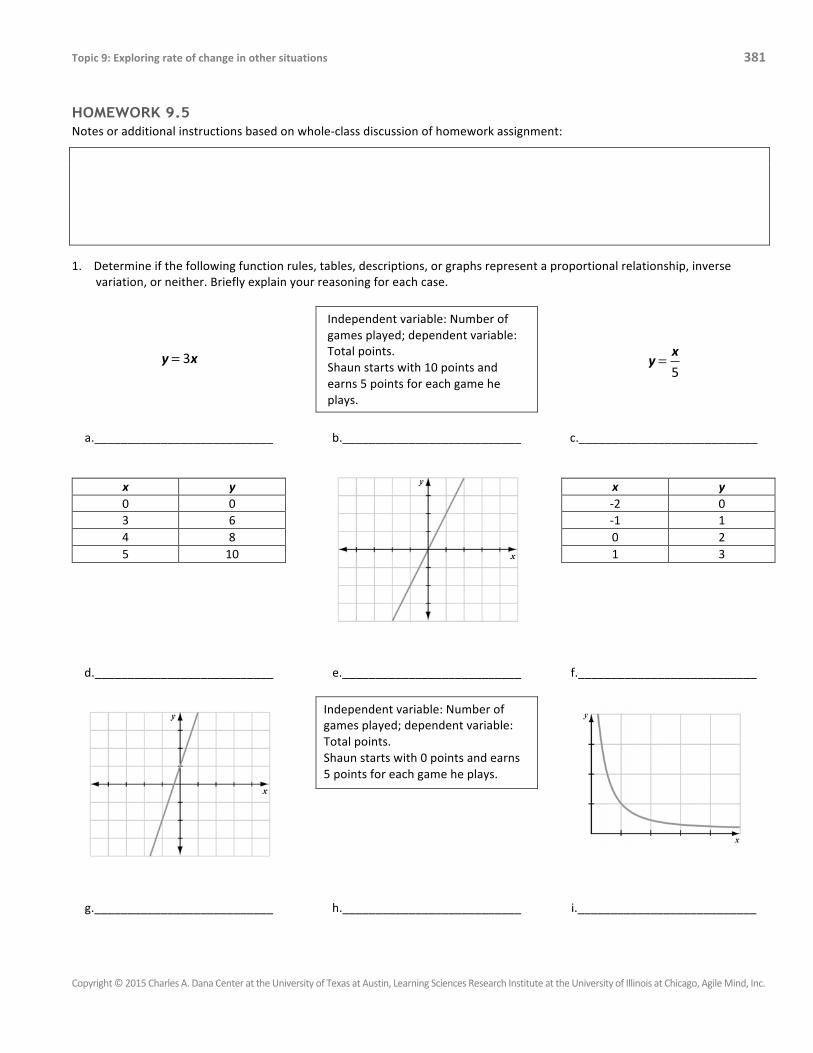
1. Determine if the following function rules, tables, descriptions, or graphs represent a proportional relationship, inverse variation, or neither. Briefly explain your reasoning for each case.
!!!!
�
y = 3x
Independent variable: Number of games played; dependent variable: Total points. Shaun starts with 10 points and earns 5 points for each game he plays.
!!!!
�
y = x5
a.___________________________ b.___________________________ c.___________________________
x y 0 0 3 6 4 8 5 10
x y -‐2 0 -‐1 1 0 2 1 3
d.___________________________ e.___________________________ f.___________________________
Independent variable: Number of games played; dependent variable: Total points. Shaun starts with 0 points and earns 5 points for each game he plays.
g.___________________________ h.___________________________ i.___________________________
382 Unit 3 – Rate of change
Copyright © 2015 Charles A. Dana Center at the University of Texas at Austin, Learning Sciences Research Institute at the University of Illinois at Chicago, Agile Mind, Inc.
2. One mile is approximately equal to 1.6 kilometers.
a. If a road measures 10 miles in length, how long is it in kilometers?
b. Is the relationship between lengths measured in miles and lengths measured in kilometers linear and proportional? If so, write a function rule relating length in miles to length in kilometers.
c. Use graph paper to create a graph that shows the relationship between length in miles and length in kilometers.
d. How many miles are equal to 4 kilometers? Show or describe how you found your answer.
e. How many kilometers are equal to 4 miles? Show or describe how you found your answer.

Topic 9: Exploring rate of change in other situations 383
Copyright © 2015 Charles A. Dana Center at the University of Texas at Austin, Learning Sciences Research Institute at the University of Illinois at Chicago, Agile Mind, Inc.
STAYING SHARP 9.5 Practicing
algeb
ra skills & con
cepts
1. On a field trip, there were 5 girls for every 8 boys. How many girls attended the 130-‐student field trip?
2. Sketch three different lines, each of which represents a proportional relationship between x and y.
Prep
aring for up
coming lesson
s
3. Rewrite each expression as simply as you can:
3x + 5y + 2x + 11y + 4x
2a + 4b + 7c + 9b + 3a
3.7d + 13.4p + 15.8p + 2.6d
4. Find the value of n that makes this equation true. (Use any method you want, including working backward.) Show how you found your answer.
5n + 4 = 39
Focus skill: U
nit rates
5. Matthew can gather 120 shopping carts in 15 minutes. Assume he works at a steady pace. How many shopping carts can he gather in 1 minute?
6. If he continued working at the constant rate you found in question 5, how long would it take Matthew to gather 216 shopping carts?

384 Unit 3 – Rate of change
Copyright © 2015 Charles A. Dana Center at the University of Texas at Austin, Learning Sciences Research Institute at the University of Illinois at Chicago, Agile Mind, Inc.

Topic 9: Exploring rate of change in other situations 385
Copyright © 2015 Charles A. Dana Center at the University of Texas at Austin, Learning Sciences Research Institute at the University of Illinois at Chicago, Agile Mind, Inc.
Lesson 9.6 Working with nonlinear function families
9.6 OPENER Consider each table and decide whether it could represent a linear function. Explain your reasoning.
1. x y
1 -‐3
2 0
3 5
4 12
2. x y
1 10
2 14
3 18
4 22
9.6 CORE ACTIVITY 1. Use what you have learned about rates of change to match each table of data to a function family: linear, quadratic,
exponential, or inverse variation. (You examined tables a and b In the Opener.) Be ready to explain your choices for each table. You may want to use your whiteboard to do some computation.
a. x y
1 -‐3
2 0
3 5
4 12
b. x y
1 10
2 14
3 18
4 22
c. x y
1 4
2 8
3 16
4 32
d. x y
1 12
3 4
4 3
6 2
e. x y
1 2
3 10
4 17
6 37
f. x y
1 18
3 14
4 12
6 8

386 Unit 3 – Rate of change
Copyright © 2015 Charles A. Dana Center at the University of Texas at Austin, Learning Sciences Research Institute at the University of Illinois at Chicago, Agile Mind, Inc.
2. Now graph each set of data.
a.
b.
c.
d.
e.
f.
3. Indicate whether you agree or disagree with each statement. Circle the appropriate word. Then explain your decision.
a. A graph allows you to identify quickly whether a function is linear or nonlinear. Agree / Disagree
Explanation:
b. A graph allows you to distinguish easily between a quadratic or exponential pattern. Agree / Disagree
Explanation:

Topic 9: Exploring rate of change in other situations 387
Copyright © 2015 Charles A. Dana Center at the University of Texas at Austin, Learning Sciences Research Institute at the University of Illinois at Chicago, Agile Mind, Inc.
4. Here are several samples of students’ work. For each sample, examine the work carefully to decide whether you agree with the student’s conclusions. Be ready to discuss your findings with the class. You should be able to explain your reasoning and identify the evidence for your reasoning from the student’s work.
a.
b.
c.
d.
5. Tara and Terrence both analyzed the same data. Their work and conclusions are shown here.
Tara
Since the quotients are constant, this is a proportional relationship.
Is Tara’s work correct? Why or why not?
Do you agree with her conclusion? Why or why not?
Terrence
Since the rate of change is constant, the data is linear.
Is Terrence’s work correct? Why or why not?
Do you agree with his conclusion? Why or why not?
-2
388 Unit 3 – Rate of change
Copyright © 2015 Charles A. Dana Center at the University of Texas at Austin, Learning Sciences Research Institute at the University of Illinois at Chicago, Agile Mind, Inc.
9.6 REVIEW ONLINE ASSESSMENT
You will work with your class to review the online assessment questions.
Problems we did well on: Skills and/or concepts that are addressed in these problems:
Problems we did not do well on: Skills and/or concepts that are addressed in these problems:
Addressing areas of incomplete understanding
Use this page and notebook paper to take notes and re-‐work particular online assessment problems that your class
identifies.
Problem #_____ Work for problem:
Problem #_____ Work for problem:
Problem #_____ Work for problem:

Topic 9: Exploring rate of change in other situations 389
Copyright © 2015 Charles A. Dana Center at the University of Texas at Austin, Learning Sciences Research Institute at the University of Illinois at Chicago, Agile Mind, Inc.
HOMEWORK 9.6 Notes or additional instructions based on whole-‐class discussion of homework assignment:
Next class period, you will take an end-‐of-‐unit assessment. One good way prepare for tests is to review the important skills and ideas you have learned. Use this list to help you review these skills and concepts by reviewing related course materials.
Important skills and ideas you have learned so far in the unit Rate of change:
• Finding rate of change
• Working with proportional relationships across representations
• Distinguishing a proportional from a nonproportional relationship
• Identifying a quadratic relationship from a table using first and second differences
• Identifying an exponential relationship from a table using constant multipliers
• Identifying an inverse variation relationship from a table using constant products
Homework Assignment
Part I: Study for the end-‐of-‐unit assessment by reviewing the key ideas listed above.
Part II: Complete the online More practice for this topic. Note the skills and ideas for which you need more review, and refer back to related activities and animations to help you study.
Part III: Complete Staying Sharp 9.6.
390 Unit 3 – Rate of change
Copyright © 2015 Charles A. Dana Center at the University of Texas at Austin, Learning Sciences Research Institute at the University of Illinois at Chicago, Agile Mind, Inc.
STAYING SHARP 9.6
Practicing
algeb
ra skills & con
cepts
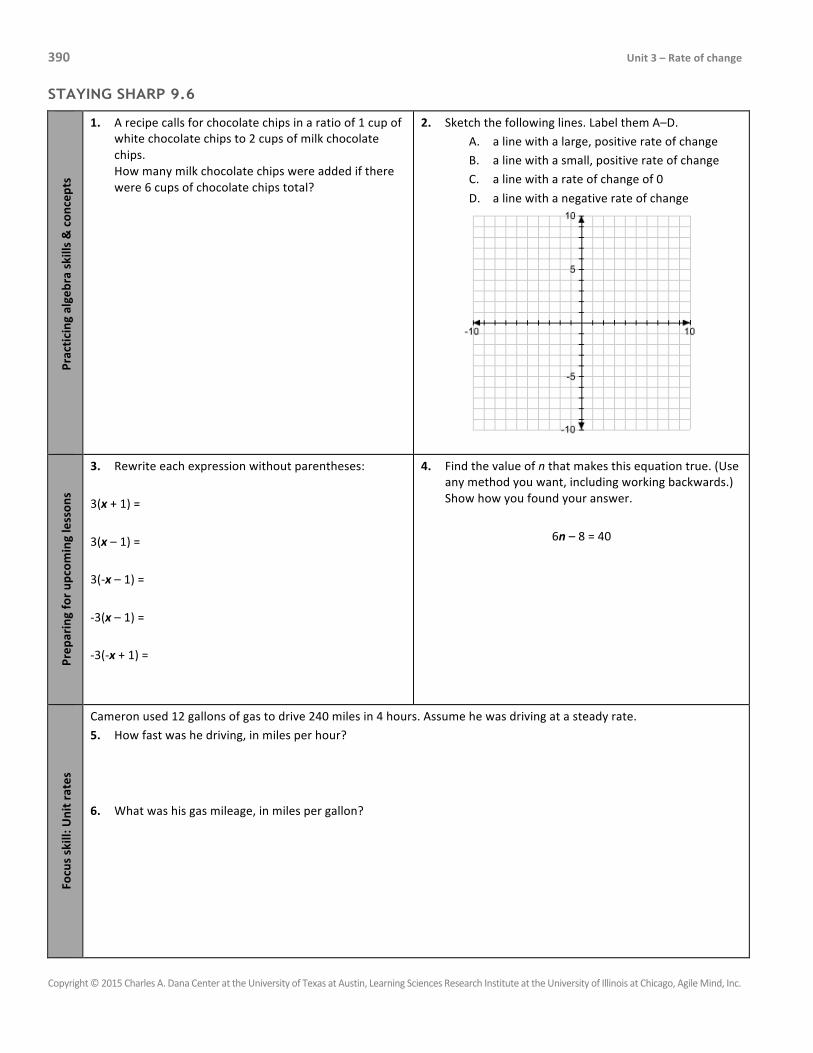
1. A recipe calls for chocolate chips in a ratio of 1 cup of white chocolate chips to 2 cups of milk chocolate chips. How many milk chocolate chips were added if there were 6 cups of chocolate chips total?
2. Sketch the following lines. Label them A–D.
A. a line with a large, positive rate of change
B. a line with a small, positive rate of change
C. a line with a rate of change of 0
D. a line with a negative rate of change
Prep
aring for up
coming lesson
s
3. Rewrite each expression without parentheses:
3(x + 1) =
3(x – 1) =
3(-‐x – 1) =
-‐3(x – 1) =
-‐3(-‐x + 1) =
4. Find the value of n that makes this equation true. (Use any method you want, including working backwards.) Show how you found your answer.
6n – 8 = 40
Focus skill: U
nit rates
Cameron used 12 gallons of gas to drive 240 miles in 4 hours. Assume he was driving at a steady rate.
5. How fast was he driving, in miles per hour?
6. What was his gas mileage, in miles per gallon?

Topic 9: Exploring rate of change in other situations 391
Copyright © 2015 Charles A. Dana Center at the University of Texas at Austin, Learning Sciences Research Institute at the University of Illinois at Chicago, Agile Mind, Inc.
Lesson 9.7 Checking for understanding
9.7 OPENER 1. Provide two more outputs so
the table represents a linear relationship.
x y
1 3
2 6
3
4
2. Provide two more outputs so the table represents a quadratic relationship.
x y
1 3
2 6
3
4
3. Provide two more outputs so that the table represents an exponential relationship.
x y
1 3
2 6
3
4
4. Can you complete the table so it represents a relationship of inverse variation? If so, explain or show how. If not, explain why this is not possible.
9.7 END-OF-UNIT ASSESSMENT
Today you will take an end-‐of-‐unit assessment.
9.7 CONSOLIDATION ACTIVITY One common kind of relationship is a conversion of a measurement between different units. Three conversion situations are described here. Graph the data and answer the questions about each situation.
1. The relationship between temperature in degrees Celsius and degrees Fahrenheit
Degrees in Celsius Degrees in Fahrenheit -‐17.8 0 0 32 26 78.8 37.8 100 100 212
a. Graph the data. Is the relationship proportional or nonproportional? Justify your answer.
b. If the relationship is proportional, write the function rule that models the data.
c. Ask two questions about the situation and show the graphical solution to each question.

392 Unit 3 – Rate of change
Copyright © 2015 Charles A. Dana Center at the University of Texas at Austin, Learning Sciences Research Institute at the University of Illinois at Chicago, Agile Mind, Inc.
2. The relationship between length measured in inches and length measured in centimeters
a. Graph the data. Is the relationship proportional or nonproportional? Justify your answer.
b. If the relationship is proportional, write the function rule that models the data.
c. Ask two questions about the situation and show the graphical solution to each question.
3. The relationship between the Richter scale magnitude and the amount of seismic energy released by an earthquake
Magnitude Richter Scale
Seismic energy (metric tons of TNT)
2.0 1 3.0 32 4.0 1000 4.5 5600
a. Graph the data. Is the relationship proportional or nonproportional? Justify your answer.
b. If the relationship is proportional, write the function rule that models the data.
c. Ask two questions about the situation and show the graphical solution to each question.
Length in inches Length in centimeters 4 10.16
7.87 20 12 30.48
21.65 55 39.37 100

Topic 9: Exploring rate of change in other situations 393
Copyright © 2015 Charles A. Dana Center at the University of Texas at Austin, Learning Sciences Research Institute at the University of Illinois at Chicago, Agile Mind, Inc.
4. Answer the following questions to reflect on your performance and effort this unit.
a. Summarize your thoughts on your performance and effort in math class over the course of this unit of study. Which areas were strong? Which areas need improvement? What are the reasons that you did well or did not do as well as you would have liked?
b. Set a new goal for the next unit of instruction. Make your goal SMART.
• Description of goal:
• Description of enabling goals that will help you achieve your goal:

394 Unit 3 – Rate of change
Copyright © 2015 Charles A. Dana Center at the University of Texas at Austin, Learning Sciences Research Institute at the University of Illinois at Chicago, Agile Mind, Inc.
HOMEWORK 9.7
Notes or additional instructions based on whole-‐class discussion of homework assignment:
Here is information about the population of several cities presented in a variety of representations.
Big Rock
Time (year) Population
0 6002
1 6101
2 6199
3 6302
4 6400
Waltersville
Time (year) Population
1 502
2 2008
3 4518
4 8032

Topic 9: Exploring rate of change in other situations 395
Copyright © 2015 Charles A. Dana Center at the University of Texas at Austin, Learning Sciences Research Institute at the University of Illinois at Chicago, Agile Mind, Inc.
1. For each city, complete the tasks outlined below. Write your answers in the table.
• Determine if the population has a constant rate of change or a nonconstant rate of change.
• For cities with a constant rate, find that rate.
• For cities with a nonconstant rate, decide which decide which type of nonlinear function (exponential, quadratic, inverse variation) best describes the relationship between the variables.
• Use your answers in the first three columns to predict each city’s population for the next year. Enter your findings in the fourth column of the table.
City Constant rate or nonconstant rate?
If constant rate, what is the rate?
If nonconstant rate, what nonlinear function type?
Predict the population for the next year
Hettsburg
Big Rock
Rock Canyon City
Rapid City
Waltersville
Bristol
Triple Falls
2. Pick two cities and represent the data in two different forms besides the one in which their data were originally given (graph, table, description, news broadcast, newspaper) on separate paper. Be creative!
396 Unit 3 – Rate of change
Copyright © 2015 Charles A. Dana Center at the University of Texas at Austin, Learning Sciences Research Institute at the University of Illinois at Chicago, Agile Mind, Inc.
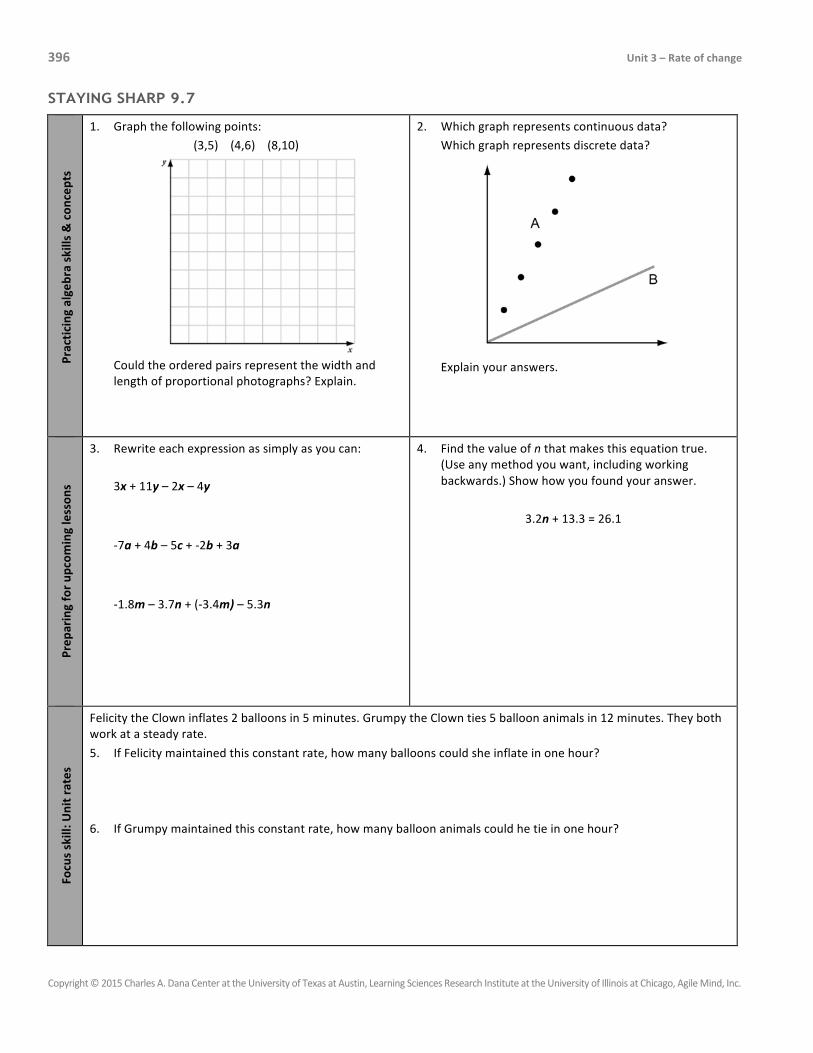
STAYING SHARP 9.7
Practicing
algeb
ra skills & con
cepts
1. Graph the following points:
(3,5) (4,6) (8,10)
Could the ordered pairs represent the width and length of proportional photographs? Explain.
2. Which graph represents continuous data?
Which graph represents discrete data?
Explain your answers.
Prep
aring for up
coming lesson
s
3. Rewrite each expression as simply as you can:
3x + 11y – 2x – 4y
-‐7a + 4b – 5c + -‐2b + 3a
-‐1.8m – 3.7n + (-‐3.4m) – 5.3n
4. Find the value of n that makes this equation true. (Use any method you want, including working backwards.) Show how you found your answer.
3.2n + 13.3 = 26.1
Focus skill: U
nit rates
Felicity the Clown inflates 2 balloons in 5 minutes. Grumpy the Clown ties 5 balloon animals in 12 minutes. They both work at a steady rate.
5. If Felicity maintained this constant rate, how many balloons could she inflate in one hour?
6. If Grumpy maintained this constant rate, how many balloon animals could he tie in one hour?