Embed Size (px)
Citation preview

i
Exploring mTOR Signalling as a Targeted
Approach Against Ovarian Cancer
A thesis submitted for the degree of Doctor of Philosophy
by
Karly-Rai Rogers-Broadway
Department of Life Sciences
College of Health and Life Sciences
Brunel University
September 2015

ii
Declaration
I hereby declare that the research presented in this thesis is my own work, except
where otherwise specified, and has not been submitted for any other degree.
Karly-Rai Rogers-Broadway

iii
Dedication
For Doug Brawley, who started it all.
And for Julie Davies, through whom all things are possible.

iv
Abstract
Ovarian cancer is the second most common gynaecological malignancy and was
diagnosed in over 7000 women in 2011 in the UK. There are currently no reliable
biomarkers available for use in a regular screening assay for ovarian cancer and due
to characteristic late presentation (78% in stages III and IV) ovarian cancer suffers
from a low survival rate (35% after 10 years). The mTOR pathway is a central
regulator of growth, proliferation, apoptosis and angiogenesis; providing balance
between available resources such as amino acids and growth factors, and stresses
such as hypoxia, to control cellular behaviour accordingly. Emerging data links
mTOR with the aetiopathogenesis of ovarian cancer. We hypothesised that mTOR
inhibitors could play a therapeutic role in ovarian cancer treatment.
In this study we began by validating the expression of four main mTOR pathway
components, mTOR, DEPTOR, rictor and raptor, at gene and protein level in in vitro
models of endometrioid (MDAH-2774) and clear cell (SKOV3) ovarian cancer using
qPCR and ImageStream technology. We demonstrate that MDAH-2774 cells have
higher proliferative capacity than SKOV3 cells, suggesting different inherent
signalling capacities. Using a wound healing assay we show that inhibition of the
mTOR pathway using Rapamycin, rapalogues, Resveratrol and NVP BEZ-235 induces
a cytostatic and not cytotoxic response up to 18 hours in these cell lines. We
extended these findings up to 72 hours with a proliferation assay and show that the
effects of inhibition of the mTOR pathway are primarily mediated by the
dephosphorylation of p70S6 kinase. We show that mTOR inhibition does not
involve alteration of mTOR pathway components or induce caspase 9 or 3 cleavage.
Preclinical studies including ovarian tissue of ovarian cancer patients, unaffected
controls and patients with unrelated gynaecological conditions show that DEPTOR is
reliably upregulated in ovarian cancer. We also show that increased DEPTOR is a
positive prognostic predictor in ovarian cancer and is decreased in later stage
disease. Finally, we demonstrate that DEPTOR upregulation is mirrored in RNA
extracted from whole blood of ovarian cancer patients. This in conjunction with the
development of ultra-fast qPCR instrumentation can provide a valuable point of
care testing platform for non-invasive diagnostics. A screening method that could
provide early detection of ovarian cancer would represent a sea change in the
diagnosis and treatment of this commonly lethal disease.

v
Acknowledgments
Πρώτον, ένα μεγάλο ευχαριστώ στον Δρ. "αφεντικό" Καρτέρη, για την εποπτεία,
την καθοδήγηση και την κατανόησή του. Δεν πίστευα ότι θα μπορούσα να το κάνω
όλο αυτό, ευχαριστώ πολύ που το πιστέψατε για μένα.
(Firstly, thank you to Dr. Manos “The Boss” Karteris, for your supervision, guidance
and understanding. I didn’t know I could do this, thank you for knowing for me.)
To Richard Lewis, Nick Burroughs, Ian Gunter, Neil Mallon, Mark Otridge and Mike
Nash at BJS Biotechnologies, thank you so much for all of your support. Who would
have imagined that we would end up here?
Thank you to Dr. Julie Davies and Georgios Sotiriadis, you guys know what you
mean to me, don’t make me say it. And to Amanda Rozeik and Dimple Chudasama
for all of your help. Thank you to Dr. Amanda Harvey, for being the mediating voice
through all my head-spins. I appreciate what you’ve done.
A special thank you to Edward Pendragon Knowler and Sarah Driver, for being my
connection to the real world of hospitals and medicine and reminding me that I
don’t operate in a vacuum.
Thank you to my wonderful family, I know you haven’t always understood why I
wanted to do this but you’ve never shown me anything but total love and support
and I couldn’t be more grateful. To my mum and dad, Leigh Stent and Dennis
Broadway, your unending support means the world to me, I couldn’t have done this
without you. Also, to my step-dad Adrian, I promise to never tell mum where you
hide the chocolate biscuits. To my beautiful siblings, Adam, Jessica and George,
thank you for your encouragement and your acceptance, it means the world to me.
And especially to George, my amazing little brother, always remember that you are
much more intelligent than I am and I’m okay with that. To my Grandma Joanie
and Grandad Bob, thank you for all of your support. And to my most excellent
godmother, Helen Rowley, if I am half as kind and generous as you I’ll consider
myself a good person.
A special thank you to Dee Mann and Suzi Robertson, who listened and never
doubted.
And to Joyce Sharpe, who knew I’d finish before I started, I miss you every day.

vi
Contents
Declaration Abstract Acknowledgments Table of Contents List of Figures List of Tables List of Abbreviations Publications Resulting From This Work Aims and Objectives 1: Prolegomenon
1.1: Ovarian Cancer 1.1.1: The Ovaries 1.1.2: Incidence of Ovarian Cancer 1.1.3: Severity and Advancement of Ovarian Cancer 1.1.4: Ovarian Cancer Survival 1.1.5: Ovarian Cancer Subtypes 1.1.6: Diagnosis of Ovarian Cancer 1.1.7: Ovarian Cancer Risk Factors 1.1.8: Treating Ovarian Cancer
1.1.8.1: Chemotherapy 1.2: Endometriosis
1.2.1: Diagnosing Endometriosis 1.2.2: Pathogenesis of Endometriosis 1.2.3: Treating Endometriosis
1.3: Endometriosis and Ovarian Cancer: The Connection 1.4: The mTOR Pathway
1.4.1: mTOR Complexes 1.4.1.1: mTOR 1.4.1.2: DEPTOR 1.4.1.3: GβL 1.4.1.4: Raptor 1.4.1.5: PRAS40 1.4.1.6: Rictor 1.4.1.7: mSIN1 1.4.1.8: Protor
1.4.2: Downstream of mTOR Complexes 1.4.2.1: mTORC1 1.4.2.2: mTORC2
1.4.3: Upstream of mTOR Complexes 1.4.3.1: mTORC1
1.4.3.1.1: TSC1/TSC2 1.4.3.1.2: The PI3 Kinase/Akt/mTOR Axis 1.4.3.1.3: The Ras/MAP Kinase Pathway 1.4.3.1.4: Stress Signals: Energy, Hypoxia and DNA Damage
ii iv v vi xi xv
xvii xx xxi 1 1 1 3 4 6 8
12 13 15 15 17 19 20 22 23 23 24 24 25 25 26 26 26 26 27 30 30 31 33 33 33 33 34 34

vii
1.4.3.1.5: Growth Signals: Nutrients and Amino Acids
1.4.3.2: mTORC2 1.5: Ovarian Cancer, Endometriosis and the mTOR Pathway 1.6: mTOR Pathway Inhibitors
1.6.1: Rapamycin and the Rapalogues 1.6.1.1: Rapamycin: Mechanism of Action
1.6.2: Dual mTOR and PI3 Kinase Inhibitors 1.7: Point of Care Diagnostics
1.7.1: qPCR 1.7.2: Thermal Cyclers 1.7.3: Point of Care Testing
2: Methodology 2.1: Tissue Culture
2.1.1: Cell Lines 2.1.2: Tissue Culture Practice 2.1.3: Thawing Cryopreserved Cells 2.1.4: Subculturing Cells 2.1.5: Cryopreserving Cells
2.2: Cell Treatments 2.2.1: Seeding Cells 2.2.2: Treating Cells
2.3: Proliferation Assay 2.4: Wound Healing Assay 2.5: Clinical Samples
2.5.1: Fresh Ovarian Tissues 2.5.2: Paraffin Embedded Ovarian Tissues 2.5.3: Whole Blood
2.6: RNA Extraction 2.6.1: RNA Extraction from Cultured Cells
2.6.1.1: GenElute™ 2.6.1.2: Nucleospin®
2.6.2: RNA Extraction from Tissue Samples 2.6.3: RNA Extraction from Whole Blood 2.6.4: RNA Quantification
2.7: cDNA Synthesis 2.7.1: SuperScript® II 2.7.2: nanoScript™ 2
2.8: Protein Extraction 2.8.1: Laemmli Buffer
2.9: Reference Gene Assessment 2.9.1: geNorm 2.9.2: geNorm Analysis
2.10: qPCR 2.10.1: Primers 2.10.2: Gel Electrophoresis
2.10.3: Power SYBR® Master Mix
36
37 37 40 40 41 42 47 47 48 49 51 51 51 52 52 53 53 53 53 54 55 55 56 56 56 60 60 60 60 61 62 62 63 63 64 65 65 65 66 67 69 69 69 70 71
viii
2.10.4: KAPA SYBR® Fast Universal Master Mix 2.10.5: qPCR Analysis
2.11: Western Blotting 2.11.1: Western Blot Analysis
2.12: ImageStream 2.12.1: Fixing Cells 2.12.2: Staining Cells
2.13: Immunohistochemistry 2.14: Statistical Analysis
3: mTOR, DEPTOR, rictor and raptor expression in ovarian cancer models and in response to mTOR pathway inhibition
3.1: Introduction 3.2: Objectives 3.3: Results
3.3.1: Confirmation of mTOR pathway component expression in SKOV3 and MDAH-2774 ovarian cancer cell lines 3.3.2: Gene expression of mTOR pathway components and mTOR pathway inhibition
3.3.2.1: mTOR Expression in SKOV3 Cells 3.3.2.2: mTOR Expression in MDAH-2774 Cells 3.3.2.3: DEPTOR Expression in SKOV3 Cells 3.3.2.4: DEPTOR Expression in MDAH-2774 Cells 3.3.2.5: Rictor Expression in SKOV3 Cells 3.3.2.6: Rictor Expression in MDAH-2774 Cells 3.3.2.7: Raptor Expression in SKOV3 Cells 3.3.2.8: Raptor Expression in MDAH-2774 Cells
3.3.3: Summary 3.4: Discussion
4: The effects of mTOR pathway inhibition in in vitro models of ovarian cancer
4.1: Introduction 4.2: Objectives 4.3: Results
4.3.1: Proliferation and migration of SKOV3 and MDAH-2774 cells in a wound healing scenario
4.3.1.1: SKOV3 4.3.1.2: MDAH-2774
4.3.2: Proliferative capacity of SKOV3 and MDAH-2774 cells after mTOR pathway inhibition
4.3.2.1: SKOV3 4.3.2.2: MDAH-2774
4.3.3: Activity of mTOR and caspase pathways after mTOR pathway inhibition
4.3.3.1: Caspase 9 4.3.3.1.1: SKOV3 4.3.3.1.2: MDAH-2774
4.3.3.2: Caspase 3
72 74 75 81 81 81 82 83 85 86
86 87 88 88
90
93 95 98
100 103 105 108 110 113 113 115
115 116 116 116
117 118 119
120 122 125
125 126 128 130
ix
4.3.3.3: p70S6 Kinase 4.4: Discussion
5: Mapping of mTOR, DEPTOR, rictor, raptor and p70S6 kinase at gene and protein level in ovarian cancer clinical samples
5.1: Introduction 5.2: Objectives 5.3: Results
5.3.1: Analysis of reference gene stability in ovarian clinical tissue samples using the geNorm™ 12 gene kit 5.3.2: Gene expression analysis of mTOR, DEPTOR, rictor and raptor in ovarian tissue clinical samples from patients with ovarian cancer, endometrial cancer, endometriosis and fibroids 5.3.3: In silico analysis of mTOR pathway component gene expression levels in unaffected and ovarian cancer patients
5.3.3.1: mTOR 5.3.3.2: DEPTOR 5.3.3.3: Raptor
5.3.4: Protein expression analysis of mTOR, DEPTOR, rictor, raptor and p70S6 kinase in paraffin embedded ovarian tissue clinical samples from patients with ovarian cancer
5.3.4.1: mTOR 5.3.4.2: DEPTOR 5.3.4.3: Rictor 5.3.4.4: Raptor 5.3.4.5: p70S6 Kinase
5.3.5: In silico analysis of survival in relation to mTOR pathway component biomarker expression
5.3.5.1: mTOR Overall Survival 5.3.5.2: DEPTOR Overall Survival
5.4: Discussion 6: Development of a PoCT platform for ovarian cancer
6.1: Introduction 6.2: Objectives 6.3: Results
6.3.1: Reaction Efficiency and Time 6.3.2: Reaction Uniformity 6.3.3: Biomarker Detection in Whole Blood
6.4: Discussion 7: General Discussion
7.1: Why is this research important? 7.2: How is the mTOR pathway implicated in ovarian cancer? 7.3: What role does mTOR pathway inhibition play in the treatment of ovarian cancer? 7.4: How could CTCs form the basis of a PoCT for ovarian cancer? 7.5: What are the limitations of this research? 7.6: Future Directions
131 132 137
137 138 138 139
142
145
146 147 147 148
149 152 155 156 158 161
162 163 164 169 169 173 173 173 176 180 181 185 185 185 186
187 188 190

x
7.6.1: Increase sample size 7.6.2: Optimise PoC blood assay 7.6.3: Further elucidate the cytostatic effects of mTOR pathway inhibition 7.6.4: Use additional in vitro models to study the effects of mTOR pathway inhibition 7.6.5: Investigate the role of MAP kinase signalling in ovarian cancer 7.6.6: Elucidate the subcellular localisation of mTOR complexes 7.6.7: Investigate the stoichiometry of the DEPTOR/mTOR interaction
7.7: Concluding Remarks 8: Bibliography 9: Appendix 1 - qPCR
9.1: qPCR 9.2: Experimental Design 9.3: Amplification 9.4: Post-Amplification Controls
190 191 191
192
192
193
193
194 196 233 233 233 235 239

xi
List of Figures
1: Prolegomenon 1.1: Diagram of the ovary 1.2: Cases and rate of ovarian cancer diagnosis in the UK 1.3: The location and metastasis of ovarian cancer and the corresponding stage 1.4: Examples of high and low grade serous ovarian carcinoma 1.5: Ovarian cancer survival 1.6: Ovarian cancer survival by stage at diagnosis 1.7: Examples of serous, mucinous, endometrioid and clear cell carcinoma 1.8: New cases and deaths of ovarian cancer 1.9: Lifestyle and health related risk factors for ovarian cancer 1.10: Chemical structures of Carboplatin and Paclitaxel 1.11: The endometrium throughout the menstrual cycle 1.12: The common sites of ectopic endometrium implantation 1.13: Retrograde menstruation 1.14: The mTOR pathway 1.15: Inputs and outputs of mTORC1 signalling 1.16: The mTOR pathway in cancer 1.17: The mechanism of action of Rapamycin
3: mTOR, DEPTOR, rictor and raptor expression in ovarian cancer models and in response to mTOR pathway inhibition
3.1: Relative mTOR, DEPTOR, rictor and raptor gene expression in SKOV3 and MDAH-2774 cell lines 3.2: Representative images of mTOR, DEPTOR, rictor and raptor protein expression in SKOV3 and MDAH-2774 cell lines 3.3: Relative mTOR expression in SKOV3 cells following treatment with Rap, Eve and Def 3.4: Relative mTOR expression in SKOV3 cells following treatment with Tem, Res and BEZ 3.5: Relative mTOR expression in MDAH-2774 cells following treatment with Rap, Eve and Def 3.6: Relative mTOR expression in MDAH-2774 cells following treatment with Tem, Res and BEZ 3.7: Relative DEPTOR expression in SKOV3 cells following treatment with Rap, Eve and Def 3.8: Relative DEPTOR expression in SKOV3 cells following treatment with Tem, Res and BEZ 3.9: Relative DEPTOR expression in MDAH-2774 cells following treatment with Rap, Eve and Def 3.10: Relative DEPTOR expression in MDAH-2774 cells following treatment with Tem, Res and BEZ 3.11: Relative rictor expression in SKOV3 cells following treatment with Rap, Eve and Def 3.12: Relative rictor expression in SKOV3 cells following Tem, Res and
2 3 5
6 7 8 8
12 14 16 18 19 21 28 36 38 42
89
90
93
94
95
96
98
99
100
101
103
104

xii
BEZ treatment 3.13: Relative rictor expression in MDAH-2774 cells following Rap, Eve and Def treatment 3.14: Relative rictor expression in MDAH-2774 cells following Tem, Res and BEZ treatment 3.15: Relative raptor expression in SKOV3 cells following Rap, Eve and Def treatment 3.16: Relative raptor expression in SKOV3 cells following Tem, Res and BEZ treatment 3.17: Relative raptor expression in MDAH-2774 cells following Rap, Eve and Def treatment 3.18: Relative raptor expression in MDAH-2774 cells following Tem, Res and BEZ treatment
4: The effects of mTOR pathway inhibition in in vitro models of ovarian cancer
4.1: Representative images of wound healing assay in SKOV3 cells 4.2: Representative images of wound healing assay in MDAH-2774 cells 4.3: Proliferation assay graph for SKOV3 cells following Rap, Eve and Def treatment 4.4: Proliferation assay graph for SKOV3 cells following Tem, Res and BEZ treatment 4.5: Proliferation assay graph for MDAH-2774 cells following Rap, Eve and Def treatment 4.6: Proliferation assay graph for MDAH-2774 cells following Tem, Res and BEZ treatment 4.7: Average viable cell increase of SKOV3 and MDAH-2774 cells after 72 hours 4.8: Representative images of western blots for caspase 9 in SKOV3 and MDAH-2774 cells 4.9: Densitometric analysis of western blots for caspase 9 in SKOV3 cells following Rap, Eve and Def treatment 4.10: Densitometric analysis of western blots for caspase 9 in SKOV3 cells following Tem, Res and BEZ treatment 4.11: Densitometric analysis of western blots for caspase 9 in MDAH-2774 cells following Rap, Eve and Def treatment 4.12: Densitometric analysis of western blots for caspase 9 in MDAH-2774 cells following Tem, Res and BEZ treatment 4.13: Representative images of western blots for caspase 3 in SKOV3 and MDAH-2774 cells 4.14: Representative images of western blots for p70S6 kinase in SKOV3 and MDAH-2774 cells
5: Mapping of mTOR, DEPTOR, rictor, raptor and p70S6 kinase at gene and protein level in ovarian cancer clinical samples
5.1: geNorm M values for reference gene panel 5.2: geNorm V values for reference gene panel 5.3: Relative mTOR, DEPTOR, rictor and raptor gene expression in
105
106
108
109
110
111
117 118
120
121
122
123
124
125
126
127
128
129
130
131
140 141 142

xiii
ovarian cancer clinical samples 5.4: Relative mTOR, DEPTOR, rictor and raptor gene expression in endometriosis clinical samples 5.5: Relative mTOR, DEPTOR, rictor and raptor gene expression in fibroids clinical samples 5.6: Relative mTOR, DEPTOR, rictor and raptor gene expression endometrial cancer clinical samples 5.7: Oncomine analysis of mTOR gene expression in ovarian carcinoma 5.8: Oncomine analysis of mTOR gene expression in ovarian serous cystadenocarcinoma 5.9: Oncomine analysis of DEPTOR gene expression in ovarian serous adenocarcinoma 5.10: Oncomine analysis of raptor gene expression in ovarian serous adenocarcinoma 5.11: Immunohistochemical analysis of mTOR expression in epithelial and germ cell tumours and representative images of staining 5.12: Immunohistochemical analysis of mTOR expression in grade I, II and III tumours and representative images of staining 5.13: Immunohistochemical analysis of mTOR expression in stage I, II, III and IV tumours and representative images of staining 5.14: Immunohistochemical analysis of DEPTOR expression in epithelial and germ cell tumours and representative images of staining 5.15: Immunohistochemical analysis of DEPTOR expression in grade I, II and III tumours and representative images of staining 5.16: Immunohistochemical analysis of DEPTOR expression in stage I, II, III and IV tumours and representative images of staining 5.17: Immunohistochemical analysis of rictor expression in grade I, II and III tumours and representative images of staining 5.18: Immunohistochemical analysis of raptor expression in epithelial and germ cell tumours and representative images of staining 5.19: Immunohistochemical analysis of raptor expression in grade I, II and III, and stage I, II, III and IV tumours and representative images of staining 5.20: Immunohistochemical analysis of phosphorylated p70S6 kinase expression in epithelial and germ cell tumours and representative images of staining 5.21: Immunohistochemical analysis of phosphorylated p70S6 kinase expression in grade I, II and III tumours and representative images of staining 5.22: Immunohistochemical analysis of phosphorylated p70S6 kinase expression in stage I, II, III and IV tumours and representative images of staining 5.23: Kaplan-Meier plot of overall survival and mTOR expression in ovarian cancer patients 5.24: Kaplan-Meier plot of overall survival and mTOR expression in
143
144
145
146
146
147
147
149
150
151
152
153
154
155
156
157
158
159
160
162
162

xiv
ovarian cancer patients with TP53 mutation 5.25: Kaplan-Meier plot of overall survival and DEPTOR expression in ovarian cancer patients 5.26: Kaplan-Meier plot of overall survival and DEPTOR expression in stage III and IV ovarian cancer patients
6: Development of a PoCT platform for ovarian cancer 6.1: Three xxplate™ well configurations 6.2: xxplate™ electrical contact points 6.3: Heatmap images of two different xxplate™ current pathways 6.4: Standard curves of comparative qPCR experiments 6.5: Fluorescence uniformity of CFX96™ and 7900HT Fast thermal cyclers 6.6: Fluorescence uniformity of xxpress® and Rotor-Gene Q thermal cyclers 6.7: Average Cq values of fluorescence uniformity qPCRs 6.8: Relative DEPTOR expression in whole blood and ovarian tissue of ovarian cancer patients
7: General discussion and concluding remarks 7.1: Proposed patient screening stream
9: Appendix – qPCR 9.1: Schematic representation of a typical three-step qPCR thermal protocol 9.2: Schematic representation of the stages of a qPCR reaction 9.3: An example of an amplification curve 9.4: An example of a dissociation curve
163
163
170 172 172 175 177
178
179 180
191
237
238 239 240
xv
List of Tables
1: Prolegomenon 1.1: Ovarian cancer staging parameters 1.2: Ovarian cancer grading parameters
1.3: Clinical details of the subtypes of ovarian cancer 1.4: Endometriosis staging parameters 1.5: mTOR pathway inhibitors
Chapter 2: Methodology 2.1: Characteristics of SKOV3 and MDAH-2774 cell lines 2.2: mTOR pathway inhibitor concentrations 2.3: Details of clinical tissue samples 2.4: Details of paraffin embedded clinical tissue samples (20) 2.5: Details of paraffin embedded clinical tissue samples (70) 2.6: Primer/dNTP mix (Superscript® II) 2.7: First Strand Buffer mix (Superscript® II) 2.8: Extension buffer (nanoScript™ 2) 2.9: Laemmli buffer 2.10: Details of reference gene panel 2.11: Components of a qPCR reaction (geNorm) 2.12: The thermal protocol of qPCR experiment (geNorm) 2.13: Details of primers used in qPCR 2.14: Components of a qPCR reaction (Power SYBR® Master Mix) 2.15: The thermal protocol of a qPCR experiment (Power SYBR® Master Mix) 2.16: Components of a qPCR reaction (Kapa SYBR® Fast Master Mix) 2.17: The thermal protocol of a qPCR experiment (Kapa SYBR® Fast Master Mix) 2.18: Formulations of resolving and stacking gels 2.19: Formulation of 10X running buffer 2.20: Formulation of 1X wet-transfer buffer 2.21: Formulation of 10X TBS 2.22: Formulation of 1X TBS Tween 2.23: Details of antibodies used in western blotting 2.24: Formulation of solutions for enhanced chemiluminescence 2.25: Details of antibodies used in ImageStream 2.26: Incubations to deparaffinise and rehydrate paraffin embedded tissue 2.27: Formulation of antigen retrieval solution 2.28: Incubations to dehydrate stained tissue samples 2.29: The asterisk denotations of p values
3: mTOR, DEPTOR, rictor and raptor expression in ovarian cancer models and in response to mTOR pathway inhibition
3.1: Details of mTOR pathway inhibitors 3.2: Summary of gene expression changes
5: Mapping of mTOR, DEPTOR, rictor, raptor and p70S6 kinase at gene and protein level in ovarian cancer clinical samples
4 5
11 20 45
52 54 56 57 60 64 64 65 66 66 68 68 70 71 72
73 73
75 76 77 77 77 80 80 82 83
83 85 85
91 113

xvi
5.1: A summary of clinical samples 6: Development of a PoCT platform for ovarian cancer
6.1: A summary of thermal cyclers compared 6.2: The thermal profile of comparative qPCR experiments 6.3: Summary of comparative qPCR experiments
7: General discussion and concluding remarks 7.1: Examples of currently active clinical trials involving rapalogues
9: Appendix – qPCR 9.1: A typical qPCR reaction formulation 9.2: A typical two-step qPCR thermal protocol 9.3: A typical three-step qPCR thermal protocol
139
173 174 176
187
235 236 237

xvii
Abbreviations
4EBP1 4E binding protein 1
AMPK AMP-responsive protein kinase
ARID1A AT rich interactive domain 1A
Atg13 Autophagy related 13
ATP Adenosine triphosphate
BEZ NVP BEZ-235
BMI Body mass index
bp Base pairs
BRAF B-Raf proto-oncogene, serine
threonine kinase
BRCA Breast cancer, early onset
CA125 Cancer antigen 125
CCC Clear cell carcinoma
CCDN1 Cyclin D1
CDK1 Cyclin dependent kinase 1
CDKN2A Cyclin-dependent kinase
inhibitor 2A
cDNA Complementary DNA
CO2 Carbon dioxide
Cq Quantification cycle
CTCs Circulating tumour cells
CTNNB1 Catenin beta 1
DAB 3,3’-Diaminobenzidine
DAPI 4',6-diamidino-2-phenylindole
Def Deforolimus
DIE Deep infiltrating endometriosis
DMEM Dulbecco’s Modified Eagle’s
Medium
DMSO Dimethyl sulfoxide
DNA Deoxyribonucleic acid
dNTP Deoxynucleoside triphosphate
DPX Di-N-butyl phthalate in xylene
DTT Dithiothreitol
ECL Enhanced chemiluminescence
EDTA Ethylenediaminetetraacetic acid
EGA European Genome-phenome
Archive
EGF Epidermal growth factor
ELMO3 Engulfment and cell motility 3
EMA European Medicines Agency
EMT Epithelial-mesenchymal
transition
EIF-4E Eukaryotic translation initiation
factor 4E
EIF-4G Eukaryotic translation
initiation factor 4G
EIF-4EBP1 Eukaryotic translation
initiation factor 4E binding protein 1
EU European Union
Eve Everolimus
FBS Foetal bovine serum
FIGO International Federation of
Gynecology and Obstetrics
FIP200 FAK family kinase-interacting
protein of 200 kDa
FKBP12 FK-506 binding protein 12
FRAP FK-506 binding protein 12-
rapamycin-associated protein
FRB - FKBP12 Rapamycin binding
xviii
GAP - GTPase activating protein
GEO - Gene Expression Omnibus
GnRH Gonadotrophin releasing
hormone
GOI Gene of interest
Grb10 Growth factor receptor-bound
protein 10
GTP Guanosine triphosphate
GβL G protein beta subunit-like
HGSC High grade serous carcinoma
HIF-1α Hypoxia inducible factor 1
alpha
HR Hazard ratio
HRP Horseradish peroxidase
HRT Hormone replacement therapy
IOSE Immortalised ovarian surface
epithelial
IRS Insulin receptor substrate
KRAS Kirsten rat sarcoma viral
oncogene homologue
LGSC Low grade serous carcinoma
LKB1 Liver kinase B1
MAP Mitogen activated protein
MAPKAP1 Mitogen activated protein
kinase associated protein 1
MIQE Minimum Information for the
publication of Quantitative Real-Time
PCR Experiments
miRNA MicroRNA
mLST8 Mammalian lethal with SEC13
protein 8
MMP Matrix metalloproteinase
mRNA Messenger ribonucleic acid
mSIN1 Mammalian stress-activated
MAP kinase-interacting protein 1
mTOR Mechanistic target of
Rapamycin
mTORC Mechanistic target of
Rapamycin complex
NHS National Health Service
NICE National Institute for Health and
Care Excellence
NSAID Non-steroidal anti-
inflammatory drug
NSCLC Non-small cell lung cancer
NTC Non-template control
OD Optical density
OS Overall survival
PBS Phosphate buffered saline
PCNA Proliferating cell nuclear
antigen
PDK1 PIP3 dependent protein kinase 1
PFA Paraformaldehyde
PFS Progression free survival
PI3 kinase Phosphoinositide 3-kinase
PIK3CA Phosphatidylinositol-4,5-
bisphosphate 3-kinase, catalytic
subunit alpha
PIP2 PtdIns 4,5-bisphosphate
(PtdIns(4,5)P2)
PIP3 PtdIns 4,5-bisphosphate
(PtdIns(3,4,5)P3)
PKB Protein kinase B
PKCα Protein kinase C alpha

xix
PoC Point of Care
PoCT Point of Care Test(ing)
PPARγ Peroxisome proliferator-
activated receptor gamma
PRAS40 Proline rich Akt substrate of
40kDa
Protor Protein observed with rictor
PRR5L Proline rich 5 like
PtdIns Phosphatidylinositide
PTEN Phosphatase and tensin
homologue on chromosome ten
qPCR Quantitative polymerase chain
reaction
RAF1 Raf-1 proto-oncogene,
serine/threonine kinase
Rap Rapamycin
Raptor Regulatory associated protein
of TOR
Res Resveratrol
Rheb Ras homologue enriched in
brain
Rictor Rapamycin insensitive
companion of mTOR
RNA Ribonucleic acid
RNF43 Ring finger protein 43
RQ Relative quantity
SD Standard deviation
SDS Sodium dodecyl sulphate
SEER Surveillance, Epidemiology and
End Results Program
SREBP Sterol regulatory element-
binding protein
ST13 Suppression of tumorigenicity
13
TBE Tris borate EDTA
TBS Tris buffered saline
TCC Transitional cell carcinoma
TCGA The Cancer Genome Atlas
Tem Temsirolimus
TEMED Tetramethylethylenediamine
TERT Telomerase reverse
transcriptase
TIOSE Telomerase immortalised
ovarian surface epithelial
TP53 Tumour protein 53
TSC1 Tuberous sclerosis complex 1
TSC2 Tuberous sclerosis complex 2
ULK1 Unc-51 like autophagy
activating kinase 1
VEGF Vascular endothelial growth
factor

xx
Publications Resulting From This Work
Amplification efficiency and thermal stability of qPCR instrumentation: Current landscape and future perspectives. Rogers-Broadway KR, Karteris E. Exp Ther Med. 2015 Oct;10(4):1261-1264.
Differential effects of rapalogues, dual kinase inhibitors on human ovarian
carcinoma cells in vitro. Rogers-Broadway KR, Chudasama D, Pados G, Tsolakidis D, Goumenou A, Hall M, Karteris E. Int J Oncol. 2016 May.

xxi
Aims and Objectives
To validate gene and protein expression of four key mTOR complex components (mTOR, DEPTOR, rictor and raptor) in two ovarian cancer cell lines as in vitro models of ovarian cancer.
To investigate the effects of differential mTOR pathway inhibition on the wound healing capability, proliferative capacity, and markers of cell death and mTOR pathway activity to assess suitability as an ovarian cancer treatment.
To investigate changes in gene and protein expression of key mTOR pathway components (mTOR, DEPTOR, rictor, raptor and phosphorylated p70S6 kinase) with a view to assessing their suitability as a biomarker of ovarian cancer disease.
To assess the prognostic effects of mTOR pathway component expression using in silico Kaplan-Meier analysis.
To assess four commercially available thermal cyclers for efficiency, correlation coefficient, speed and usability to evaluate their suitability as a point of care testing device.

1
Chapter 1
Prolegomenon
Despite the many medical advances made in the past 40 years, cancer still remains
the most distressing diagnosis to receive. This is particularly true for ovarian
cancer, where the 5 year survival rate remains alarmingly low at 46% and whose
death rate has scarcely improved since the 1970s (Figure 1.8) (SEER, 2015c; CRUK,
2015h). Two main limitations of the treatment of all human disease are the time
taken for diagnosis and the lack of insight into the interpatient variability that
modulates response to therapeutics; to remedy this, much interest is now being
taken in point of care (PoC) diagnostics. Point of Care Testing (PoCT), where a full
diagnostic test is carried out in a single visit to a healthcare provider, is able to
reduce the delay in central laboratory based assessment and improve patient
outcomes through earlier and more appropriate commencement of treatment.
PoCT is not currently a reality for ovarian cancer due to the lack of reliable
biomarkers of disease. This is worsened by the mild and ambiguous symptoms
associated with ovarian cancer which often go unnoticed or misdiagnosed. Here we
discuss PoCT by quantitative polymerase chain reaction (qPCR), ovarian cancer and
its strongly related risk factor, endometriosis, and how the mTOR (mechanistic
target of Rapamycin) signaling pathway may be a useful bridge to connect ovarian
cancer to a reliable PoCT.
1.1 Ovarian Cancer
1.1.1 The Ovaries
The ovaries are female reproductive organs which sit bilateral to the uterus and
superior to the vagina in the pelvic cavity. They are responsible for the
development and release of ova, or female germ cells, into the fallopian tubes
during ovulation and the release of the sex hormones oestrogens and

2
progesterone. Mammals have two ovaries which are encapsulated in an epithelial
layer and alternate the release of an ova with each ~28 day menstrual cycle.
Follicular cells in the ovary form a follicle containing a single germ cell in a process
called folliculogenesis. As the germ cell matures, the follicular cells increase in
number and develop into granulosa cells which nourish the germ cell. When the
follicle has matured, it ruptures and releases the germ cell to the fallopian tube in a
process called ovulation. This leaves an empty follicle known as a corpus luteum
which continues to secrete sex hormones throughout the menstrual cycle (Tortora
and Derrickson, 2005) (Figure 1.1).
Figure 1.1 - Diagram of the ovary showing the stages of follicular development
(image adapted from Servier Medical Art, with permission).
Oestrogen and progesterone levels change throughout the menstrual cycle with
oestrogen peaking just before ovulation and progesterone steadily increasing after
ovulation has occurred. If fertilisation does not take place, oestrogen and
progesterone return to basal levels and menstruation occurs. The ovaries cease to

3
produce oestrogen and progesterone at menopause, at which time menstruation
and fertility terminates (Tortora and Derrickson, 2005).
1.1.2 Incidence of Ovarian Cancer
Ovarian cancer is the fifth most common female cancer and is diagnosed in more
than 7,000 people in the UK every year (NHS Choices, 2013). Risk of ovarian cancer
is increased when a first degree relative is affected, particularly in cases of serous
disease and if presentation occurs under 50 years of age (Jervis et al., 2014). Most
commonly, ovarian cancer is epithelial in origin with other types accounting for only
10% of cases (CRUK, 2014b). Ovarian cancer is primarily a post-menopausal disease
with the majority of cases occurring in patients over 60 years of age (Figure 1.2).
Figure 1.2 - The average number of ovarian cancer cases diagnosed and the rate per
100,000 people in the UK in relation to age at diagnosis (CRUK, 2012, with
permission). Ovarian cancer is primarily a post-menopausal condition with the
majority of cases diagnosed in patients over 60 years of age.

4
1.1.3 Severity and Advancement of Ovarian Cancer
The severity of ovarian cancer metastasis is currently assessed using the
International Federation of Gynecology and Obstetrics (FIGO) staging system
detailed below (Table 1.1, Figure 1.3):
Stage Substage Description
I Ia The tumour is confined to one ovary with no signs of tumour on the
surface.
Ib As Ia but involving both ovaries.
Ic The tumour is confined to one or both ovaries with either or all of the
following: signs of the tumour on the surface of the ovary, rupture of
tumour capsule before or during surgery, malignant cells found in
ascites.
II IIa Metastasis outside the ovaries in the uterus or fallopian tubes.
IIb Metastasis to pelvic cavity organs for example the bladder.
III IIIa Metastasis to retroperitoneal lymph nodes or microscopic malignancy
found outside the pelvis.
IIIb Tumour smaller than or equal to 2cm found outside the pelvic cavity
including surface of liver and/or spleen.
IIIc Tumour bigger than 2cm found outside the pelvic cavity including
surface of liver and/or spleen.
IV IVa Pleural effusion (fluid around the lungs) positive for malignant cells.
IVb Metastasis to distant sites including extra-abdominal and
parenchymal liver or spleen involvement.
Table 1.1 - Ovarian cancer staging parameters as defined by FIGO (Society for
Gynecologic Oncology, 2014).

5
Figure 1.3 - The location and metastasis of ovarian cancer and the corresponding
stage. (A) Stage I ovarian cancer is confined to the ovaries. (B) Stage II ovarian
cancer has metastasised to near locations within the pelvic cavity such as the
fallopian tubes or bladder, (C) Stage III ovarian cancer has metastasised to the
retroperitoneal lymph nodes or outside of the pelvic cavity, (D) Stage IV ovarian
cancer involves malignant cells in pleural effusion and metastasis to distant sites.
Diagram adapted from Cancer Research UK (CRUK, 2014a, with permission).
In addition to stage, a patient can also be given a grade defining the level of
differentiation of the tumour cells. Grades are defined as follows (Table 1.2):
Grade Description
I Well differentiated
II Moderately differentiated
III Poorly differentiated
Table 1.2 - Ovarian cancer grading parameters (Table adapted from CRUK, 2014a,
with permission).
6
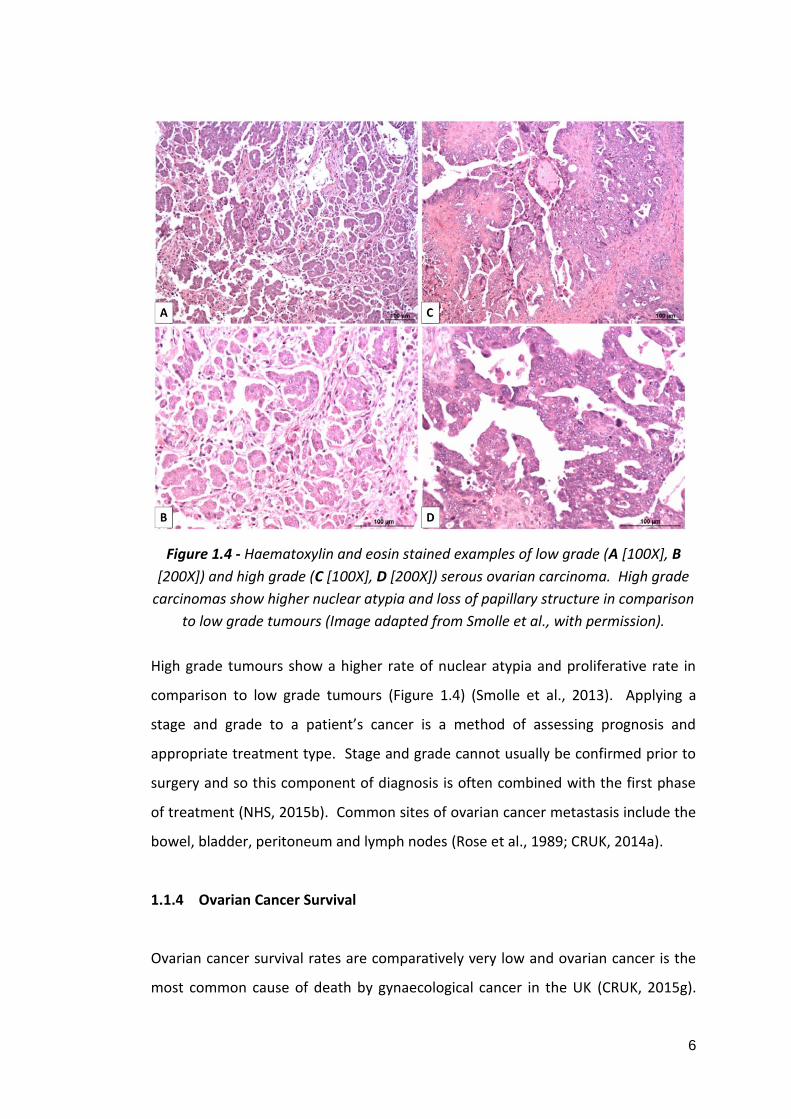
Figure 1.4 - Haematoxylin and eosin stained examples of low grade (A [100X], B
[200X]) and high grade (C [100X], D [200X]) serous ovarian carcinoma. High grade
carcinomas show higher nuclear atypia and loss of papillary structure in comparison
to low grade tumours (Image adapted from Smolle et al., with permission).
High grade tumours show a higher rate of nuclear atypia and proliferative rate in
comparison to low grade tumours (Figure 1.4) (Smolle et al., 2013). Applying a
stage and grade to a patient’s cancer is a method of assessing prognosis and
appropriate treatment type. Stage and grade cannot usually be confirmed prior to
surgery and so this component of diagnosis is often combined with the first phase
of treatment (NHS, 2015b). Common sites of ovarian cancer metastasis include the
bowel, bladder, peritoneum and lymph nodes (Rose et al., 1989; CRUK, 2014a).
1.1.4 Ovarian Cancer Survival
Ovarian cancer survival rates are comparatively very low and ovarian cancer is the
most common cause of death by gynaecological cancer in the UK (CRUK, 2015g).

7
The five and ten year survival rates are 46.2 and 34.5% respectively (Figure 1.5).
This compares unfavourably to the five year survival rate of breast cancer (86.6%),
prostate cancer (84.8%), bowel cancer (59.2%), cervical cancer (67.4%) and uterine
cancer (79%) (CRUK, 2015c; CRUK, 2015i; CRUK, 2015b; CRUK, 2015d; CRUK,
2015k).
Figure 1.5 - The net survival (years after diagnosis) of patients with ovarian cancer
in the UK. One, five and ten year survival rates for ovarian cancer are 72.4, 46.2 and
34.5% respectively in the UK (CRUK, 2015h)
Ovarian cancer survival depends greatly upon the stage at which it is diagnosed.
Survival for cancers diagnosed in stage I is 90% but only 4% for stage IV cancers in
the UK (Figure 1.6) (CRUK, 2015h). Due to lack of overt symptoms, the majority of
ovarian cancers (up to 78%) are diagnosed at stage III or IV (Buys et al., 2011).

8
Figure 1.6 - The ovarian cancer survival rates depending on the stage of disease at
diagnosis. Survival is greatly reduced in patients diagnosed in later stages of
disease (CRUK, 2015h).
1.1.5 Ovarian Cancer Subtypes
Figure 1.7 - Histological preparations of haematoxylin and eosin stained ovarian
cancer subtypes (A) serous carcinoma (B) mucinous carcinoma (C) endometrioid
carcinoma (D) clear cell carcinoma (Cho, 2009, with permission).

9
Ovarian cancer is a highly heterogenous disease originating from either epithelial,
germ or stromal cells. Epithelial ovarian cancers account for up to 90% of all
ovarian cancers (Weiss et al., 1977; Rose et al., 1989) and are subcategorised into
four main types: serous, endometrioid, clear cell and mucinous (Figure 1.7, Table
1.3) (Lalwani et al., 2011). The incidence of epithelial ovarian cancers increases
with age; however, the same effect is not seen in non-epithelial ovarian cancers
(Weiss et al., 1977). Serous types are the most common among epithelial cancers,
accounting for around 53-78% of cases and the majority of BRCA (breast cancer
(1/2), early onset) gene related tumours are serous (Seidman et al., 2004; Callahan
et al., 2007). Serous tumours are further categorised as high or low grade based on
appearance of nuclei (nuclear atypia) and proliferative rate with high grade serous
carcinomas (HGSCs) being more common than low grade serous carcinomas (LGSCs)
(Malpica et al., 2004; Plaxe, 2008). Serous ovarian cancer cells resemble surface
epithelium of the fallopian tube and there is evidence that this category of tumour
arises from the implantation of fallopian tube cells to the ovary (Vang et al., 2009;
Reade et al., 2014; Malcolm Coppleson and C. Paul Morrow, 1992). HGSCs often
involve tumour protein 53 (TP53) mutations that are not seen in LGSCs and LGSCs
show a better survival than HGSCs (average 99 months and 57 months respectively)
which is not related to stage of disease or metastasis (Salani et al., 2008; Plaxe,
2008). LGSCs are more likely to show mitogen-activated protein (MAP) kinase
pathway activation, commonly show mutation in Kirsten rat sarcoma viral
oncogene homologue (KRAS) and B-Raf proto-oncogene, serine threonine kinase
(BRAF) genes (Hsu et al., 2004) and are less responsive to platinum based
chemotherapies than HGSCs (Schmeler et al., 2008; Santillan et al., 2007).
Endometrioid and clear cell carcinomas (CCCs) are associated with endometriosis
with up to 29-50% and 23-49% arising from endometriosis respectively (Machado-
Linde et al., 2015; Orezzoli et al., 2008; Acién et al., 2015). Endometrioid carcinoma
tissue resembles that of the endometrium (Malcolm Coppleson and C. Paul
Morrow, 1992). TP53, AT rich interactive domain 1A (ARID1A),
phosphatidylinositol-4,5-bisphosphate 3-kinase, catalytic subunit alpha (PIK3CA),
catenin beta 1 (CTNNB1), cyclin D1 (CCND1) and phosphatase and tensin

10
homologue on chromosome ten (PTEN) gene deregulations are frequently
associated with endometrioid carcinomas (Stewart et al., 2013; McConechy et al.,
2014; Forbes et al., 2015; COSMIC, 2015). CCCs account for around 10% of
epithelial ovarian cancers and can be further categorised into cystic- and
adenofibromata-associated types with cystic CCCs being more frequently associated
with endometriosis (91% versus 44%) (Seidman et al., 2004; Veras et al., 2009). CCC
tumours contain large, glycogen filled cells and are often present as mixed-cell
tumours containing other cell types (Malcolm Coppleson and C. Paul Morrow,
1992). CCCs commonly show mutations in ARID1A, PIK3CA, telomerase reverse
transcriptase (TERT), TP53 and KRAS genes (Forbes et al., 2015; COSMIC, 2015).
CCC is an aggressive form of ovarian cancer with only a 73% 5 year survival rate for
cases presenting at stage I (Kennedy et al., 1999) compared to 90% for all types of
ovarian cancer (CRUK, 2015h). Five year survival differs between cystic- and
adenofibromata-associated CCCs (77% and 37% respectively) (Veras et al., 2009).
However, although endometriosis patients are more likely to develop CCC,
endometriosis associated CCCs present 10 years earlier, are more likely to present
at an earlier stage and show a better overall prognosis than de novo CCCs (Orezzoli
et al., 2008).
Mucinous carcinomas account for 10-15% of all epithelial ovarian cancers (Seidman
et al., 2004) and are characterised by TP53, KRAS, ring finger protein 43 (RNF43),
cyclin-dependent kinase inhibitor 2A (CDKN2A) and BRAF gene mutations and may
also show gastrointestinal markers (Forbes et al., 2015; COSMIC, 2015; Tenti et al.,
1992). Cells of mucinous tumours resemble those of the endocervix but may also
contain goblet cells similar to those found in the gastrointestinal tract (Malcolm
Coppleson and C. Paul Morrow, 1992).

11
Cell of Origin Type Subtype Associated Genes Endometriosis
Associated?
Age at
presentation
(years)
Response to
platinum based
therapies
Five year
survival
Epithelial
(90-95%)
Serous (40-60%) High grade
(90%)
BRCA1, BRCA2, TP53 No 56 Good 71%
Low grade (10%) BRCA1, BRCA2, KRAS, BRAF No 45-63 Bad
Endometrioid
(10-20%)
- TP53, ARID1A, PIK3CA,
CTNNB1, CCND1, PTEN
Yes 40-60 Good 62%
Clear Cell (4-10%) Cystic ARID1A, PIK3CA, TERT, TP53,
KRAS
Yes 58 Bad 77%
Adenofibroma No 37%
Mucinous (10-
15%)
- TP53, KRAS, RNF43, CDKN2A,
BRAF
No 40-50 Bad
Germ (2.6%) - - KIT, KRAS, CDKN2A Not available 15-19 Not available 84%
Stromal
(1.2%)
- - FOXL2, DICER1, TP53 Not available 30-59 Not available 88%
Table 1.3 - Clinical details of the subtypes of ovarian cancer (Table adapted from Forbes et al., 2015; COSMIC, 2015; Zwart et al., 1998; Lalwani
et al., 2011; Guseh et al., 2014; Plaxe, 2008; Schmeler et al., 2008; Santillan et al., 2007; Kennedy et al., 1999; Seidman et al., 2004; Hsu et al.,
2004; Machado-Linde et al., 2015; Orezzoli et al., 2008; Acién et al., 2015; Nakayama et al., 2008; Quirk and Natarajan, 2005; Smith et al.,
2006; Sarwar et al., 2014; Alexandre et al., 2010).

12
1.1.6 Diagnosis of Ovarian Cancer
Ovarian cancer often presents with mild and ambiguous symptoms. NICE guidelines
advise primary care providers to consider abdominal mass, distension or pain,
ascites, early satiety or loss of appetite, urinary urgency or increased urinary
frequency, change in bowel habits including apparent onset of irritable bowel
syndrome, weight loss and fatigue as potential indications of ovarian cancer (NICE,
2011). Ovarian cancer can readily be mistaken for other, less serious conditions
such irritable bowel syndrome. It is for this reason that ovarian cancer is often not
diagnosed until it has reached stage III or IV, resulting in a poor prognosis (Buys et
al., 2011). The mortality rate has remained almost unchanged in the past 40 years
with ovarian cancer deaths decreasing by only 2.4 persons per 100,000 in
comparison to 10.1, 13.4 and 11.4 persons in breast, colon and prostate cancer
respectively in the USA (Figure 1.8) (SEER, 2015c; SEER, 2015d; SEER, 2015b; SEER,
2015a). Despite this, there is currently no ovarian cancer screening programme
available on the NHS.
Figure 1.8 - Graph plotted from SEER data (SEER, 2015c) of new cases and deaths
per 100,000 persons associated with ovarian cancer from the SEER 9 registry
(Atlanta, Connecticut, Detroit, Hawaii, Iowa, New Mexico, San Francisco-Oakland,
Seattle-Puget Sound and Utah in the United States of America). Ovarian cancer 5
year survival has improved by 2.4 persons per 100,000 since 1975.
The lack of an ovarian cancer screening programme in the UK is, in part, due to an
absence of known, reliable biomarkers for the disease. Cancer Antigen 125
(CA125), a membrane associated glycoprotein involved in cell adhesion, migration
and metastasis, is commonly used to monitor disease progression in patients being
treated for ovarian cancer and has been proposed as a good candidate for a

13
screening assay (Menon et al., 2015; Giannakouros et al., 2014; Reinartz et al.,
2012; Rump et al., 2004; Gaetje et al., 1999; Gaetje et al., 2002). The efficacy of
CA125, however, is a subject of debate as the propensity for false positives is high.
Other conditions, such as heart failure, endometriosis and breast cancer, and
demographic and lifestyle factors such as ethnicity, obesity and tobacco use, also
raise CA125 levels (Folga et al., 2012; Mol et al., 1998; Johnson et al., 2008).
Greater than or equal to 35 units per mL of CA125 is considered to be abnormally
high but Johnson et al., found this to be the case in 1.6% of non-cancer individuals
(Johnson et al., 2008). An investigation into the benefits of ovarian cancer
screening involving 68,557 patients showed that annual screening by CA125 and
transvaginal ultrasound caused no reduction in mortality from ovarian cancer but
substantially increased screening related harm (for example, 1080 patients
underwent surgery based on false positive results) (Buys et al., 2011). Recently, the
development of a risk algorithm to determine abnormal CA125 levels in individual
patients after annual measurement has been shown to double ovarian cancer
detection, indicating that a universal CA125 threshold is not useful as an ovarian
cancer screen (Menon et al., 2015). Despite this, CA125 measurement is still
recommended as the first-line diagnostic test for ovarian cancer with a universal
threshold of 35U/mL by NICE (NICE, 2011).
In addition to CA125 measurement, NICE guidelines also recommend pelvic
ultrasound for assessment of ovarian abnormalities. If CA125 measurement
suggests pathology but ultrasound does not or vice versa, medics are advised to
recommend the patient returns if symptoms persist or worsen (NICE, 2011). The
use of non-specific testing with a high threshold for further investigation may
contribute to the late diagnosis and low survival of ovarian cancer in the UK.
1.1.7 Ovarian Cancer Risk Factors
As previously discussed, the risk of ovarian cancer increases with age (Figure 1.2).
Ovarian cancer has a familial aspect and risk is increased when first degree relatives
have been diagnosed with ovarian, breast or prostate cancer (Jervis et al., 2014;

14
Hemminki et al., 2011). Inherited mutations in the BRCA1 and BRCA2 genes have
been shown to confer a 17-50 fold increased risk of ovarian cancer (Ingham et al.,
2013; Mavaddat et al., 2013). Endometriosis is also an important risk factor for
ovarian cancer, discussed in section 1.3. In addition to this, a number of lifestyle
related factors are also known to increase or decrease the likelihood of developing
ovarian cancer (Figure 1.9).
Figure 1.9 - The lifestyle and health related factors which can increase or decrease
ovarian cancer risk (CRUK, 2015f; Beral et al., 2007; Collaborative Group on
Epidemiological Studies of Ovarian Cancer, 2012; Terry et al., 2013; Faber et al.,
2013; Starup-Linde et al., 2013; CRUK, 2012; Ingham et al., 2013; Mavaddat et al.,
2013; Jervis et al., 2014; Hemminki et al., 2011; Risch et al., 1996; Tung et al., 2003;
Kurian et al., 2005; Chiaffarino et al., 2007; Beral et al., 2007).
Some risk factors for ovarian cancer are subtype specific. For example, genital
talcum powder use is more related to serous, clear cell and endometrioid types
(Terry et al., 2013), current and former tobacco use are related more to mucinous
and serous subtypes (Faber et al., 2013; Kurian et al., 2005), the risk of serous
ovarian cancer is greater than any other subtype with HRT (Beral et al., 2007), and

15
pregnancy, use of oral contraceptives, increased breastfeeding and decreased
menstrual cycles reduce the risk of all types of epithelial ovarian cancer except
mucinous (Risch et al., 1996; Tung et al., 2003; Chiaffarino et al., 2007).
1.1.8 Treating Ovarian Cancer
In the UK, ovarian cancer is treated with a combination of surgery, chemotherapy
and radiotherapy depending on the type and stage of cancer at diagnosis. Most
patients will undergo primary debulking surgery to remove malignant tissue before
further treatment (NHS, 2015b). As stage often cannot be determined without
surgery, staging and debulking may be performed in the same operation (NHS,
2015b). Debulking surgery may include lateral or bilateral salpingo-oophorectomy
(removal of one or both ovaries and fallopian tubes), total abdominal hysterectomy
(removal of the uterus and cervix), omentectomy (removal of the fatty layer that
lines the peritoneal cavity) and removal of the retroperitoneal lymph nodes (NHS,
2015b; NHS Choices, 2013). Early stage cancers may be treated with surgery only or
surgery and adjuvant chemotherapy (Trimbos et al., 2003; NICE, 2011). Late stage
ovarian cancers may be treated with a combination of neoadjuvant chemotherapy,
debulking surgery, adjuvant chemotherapy and interval debulking surgery (where
debulking surgery is performed during a course of chemotherapy) (CRUK, 2015j;
NHS, 2015b). If the ovarian cancer is too advanced or the patient is unable to
undergo surgery due to extraneous risk factors, radiotherapy may be used as a form
of palliative care (CRUK, 2015j).
1.1.8.1 Chemotherapy
Chemotherapy is used in the treatment of almost all ovarian cancers. Platinum
based chemotherapeutic drugs are most commonly used including Carboplatin, a
platinum containing analogue of Cisplatin (Figure 1.10, A) (CRUK, 2015e) which
induces DNA damage and causes apoptosis through the formation of adducts
between DNA bases (Reed et al., 1987; Unger et al., 2009; Hamada et al., 1998;
Siemer et al., 1999). In addition to Carboplatin, Paclitaxel is also used as a
16
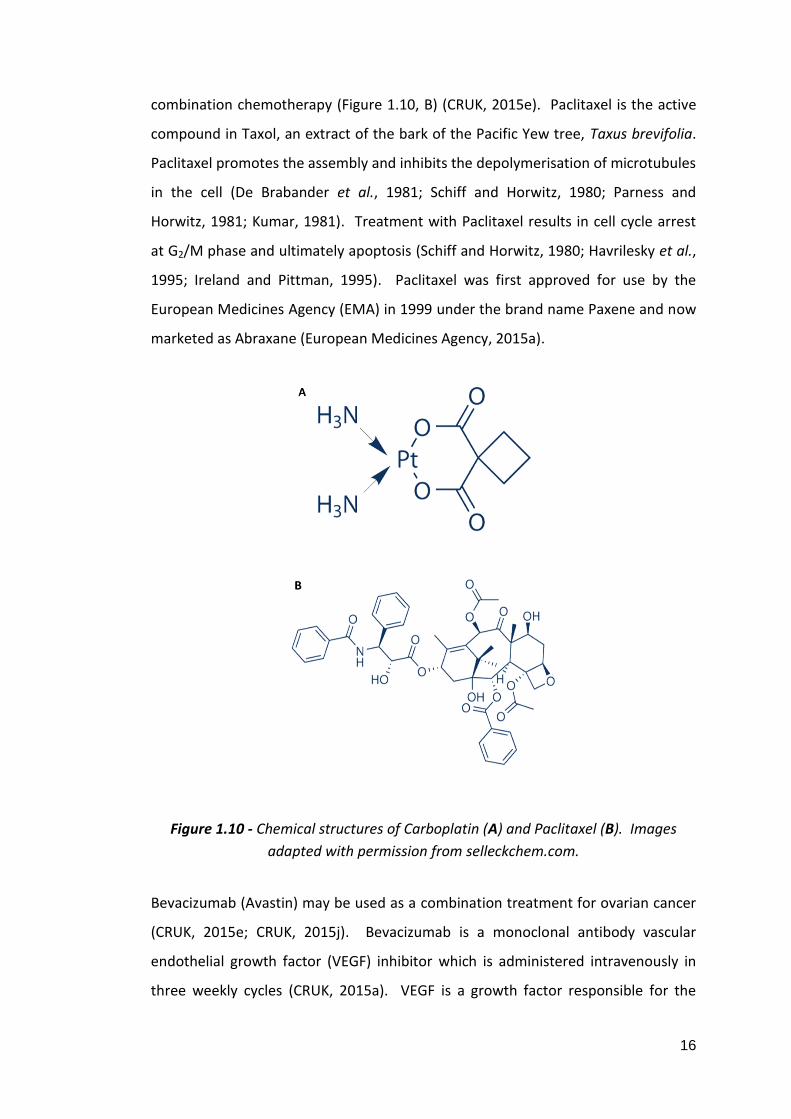
combination chemotherapy (Figure 1.10, B) (CRUK, 2015e). Paclitaxel is the active
compound in Taxol, an extract of the bark of the Pacific Yew tree, Taxus brevifolia.
Paclitaxel promotes the assembly and inhibits the depolymerisation of microtubules
in the cell (De Brabander et al., 1981; Schiff and Horwitz, 1980; Parness and
Horwitz, 1981; Kumar, 1981). Treatment with Paclitaxel results in cell cycle arrest
at G2/M phase and ultimately apoptosis (Schiff and Horwitz, 1980; Havrilesky et al.,
1995; Ireland and Pittman, 1995). Paclitaxel was first approved for use by the
European Medicines Agency (EMA) in 1999 under the brand name Paxene and now
marketed as Abraxane (European Medicines Agency, 2015a).
Figure 1.10 - Chemical structures of Carboplatin (A) and Paclitaxel (B). Images
adapted with permission from selleckchem.com.
Bevacizumab (Avastin) may be used as a combination treatment for ovarian cancer
(CRUK, 2015e; CRUK, 2015j). Bevacizumab is a monoclonal antibody vascular
endothelial growth factor (VEGF) inhibitor which is administered intravenously in
three weekly cycles (CRUK, 2015a). VEGF is a growth factor responsible for the

17
initiation of angiogenesis, an important feature of tumour development, via VEGF
receptors (Claffey and Robinson, 1996; Pecorino, 2008). Inhibiting VEGF suppresses
tumour growth by blocking cell survival, endothelial permeability and cellular
migration (Presta et al., 1997; Wang et al., 2004). Bevacizumab has shown
moderate improvement in progression free survival (the cessation of disease
progression brought about by treatment) in ovarian cancer patients (Petrillo et al.,
2015) and NICE (National Institute for Health and Care Excellence) currently
recommends the use of bevacizumab in the treatment of early stage ovarian cancer
(NICE, 2013).
1.2 Endometriosis
The endometrium is the lining of the uterus which proliferates during the menstrual
cycle in anticipation of zygote implantation and pregnancy. Endometrium consists
of a basal layer (stratum basalis) which gives rise to a new functional layer (stratum
functionalis) which proliferates in response to oestrogens and progesterone with
each menstrual cycle. If fertilisation does not occur, oestrogen and progesterone
return to basal levels due to the degeneration of the corpus luteum, stimulating the
release of prostaglandins and causing a reduction in blood supply to the stratum
functionalis. This results in endometrial cell death and the stratum functionalis of
the endometrium is discharged via the vagina (Figure 1.11) (Tortora and Derrickson,
2005).

18
Figure 1.11 - The stages of endometrium development throughout the menstrual
cycle. The menstrual cycle begins with the menstrual phase, during which the
stratum functionalis is shed and discharged via the vagina. The preovulatory
(follicular) phase follows menstruation during which oestrogen stimulates
proliferation of the stratum basalis to form a new stratum functionalis including
endometrial glands and arterioles. Ovulation occurs at approximately 14 days and
signifies movement into the postovulatory (Luteal) phase. At this time, the
endometrium further proliferates and vascularises in preparation of ovum
implantation. If fertilisation has not occurred, the menstrual phase begins once
again (Tortora and Derrickson, 2005) (image adapted from Servier Medical Art, with
permission) (Servier, 2014).
Endometriosis is a non-malignant condition characterised by the ectopic
implantation and growth of endometrial tissue in locations within the abdominal
cavity such as the fallopian tubes, ovaries, peritoneum, vagina, bladder, bowel and
rectum (Figure 1.12). Ectopic endometrium responds to hormonal changes in the
same way as eutopic endometrium, by proliferating and shedding with the
menstrual cycle causing pain and inflammation in the affected areas. Symptoms of
endometriosis include dysmenorrhea (pain during menstruation), dyspareunia (pain
during sexual intercourse), dysuria (pain during urination), dyschezia (pain during
defecation), infertility and chronic pelvic pain as well as an increased risk of

19
allergies, asthma, fibromyalgia, autoimmune disease, hypothyroidism, multiple
sclerosis and chronic fatigue syndrome (Sinaii et al., 2002). Endometriosis is
estimated to affect around 2 million people in the UK (NHS Choices, 2015).
Figure 1.12 - The common sites of ectopic endometrium implantation in cases of
endometriosis (Berek, 2007, with permission).
1.2.1 Diagnosing Endometriosis
Diagnosis of endometriosis can only be confirmed surgically by laparoscopy.
Endometriosis is currently assessed and classified into one of four stages using
guidelines set out by the American Society for Reproductive Medicine (American
Society for Reproductive Medicine, 1997) as follows (Table 1.4):

20
Stage Description
I (1-5 points) Minimal: superficial lesions of less than 1cm in the ovary or 1-3cm in
the peritoneum.
II (6-15 points) Mild: deeper implantation and lesions of greater than 3cm.
III (16-40 points) Moderate: implication of the larger pelvic area.
IV (>40 points) Severe: deep, dense and infiltrating lesions.
Table 1.4 - Endometriosis staging parameters as defined by ASRM (American
Society for Reproductive Medicine, 1997). Stage is given according to a points
based system which relate to the location and infiltration of adhesions.
1.2.2 Pathogenesis of Endometriosis
Many theories have been proposed as the cause of endometriosis. The most
accepted theory on the mechanism of development, proposed in 1927 by Sampson,
is retrograde menstruation where shed endometrium travels into the pelvic cavity
via the fallopian tubes and explants on neighbouring organs and structures (Figure
1.13) (Sampson, 1927). The endometriotic lesions can then amplify the symptoms
by releasing additional endometrium into the pelvic cavity which can then create
further lesions (Burney and Lathi, 2009). This theory is supported by the viable
proliferative capacity noted in shed endometrium (Koks et al., 1999; Koks et al.,
1997; Groothuis et al., 1999) and the observation that patients with obstructive
anomalies of the reproductive tract which do not allow for effective discharge of
the endometrium are more likely to develop endometriosis (D’Hooghe and
Debrock, 2002). However, it is not clear if retrograde menstruation happens more
frequently in patients with endometriosis or if there are other factors which
predispose to a higher likelihood of ectopic endometrium explantation (D’Hooghe
and Debrock, 2002).

21
Figure 1.13 - Retrograde menstruation is the most accepted theory of the
pathogenesis of endometriosis. Typical menstruation occurs when the stratum
functionalis of the endometrium is discharged via the vagina. Retrograde
menstruation involves menstrual effluent travelling into the pelvic cavity via the
fallopian tubes and implanting on nearby organs such as the ovaries (image
adapted from Servier Medical Art, with permission) (Servier, 2014).
The peritoneum is the lining of the abdominal cavity and often the site of
endometrial implantation in endometriosis. It consists of a basement support of
areolar connective tissue covered by a single layer of squamous epithelial cells
known as the mesothelium (Tortora and Derrickson, 2005). It has been shown that
endometrium adheres to the peritoneum only in places where there is damage (i.e.
absence of the mesothelial layer) (Koks et al., 1999; Groothuis et al., 1999)
indicating that the endometrium cannot adhere to epithelial cells and this layer
may provide protection from retrograde menstrual effluent. In support of this, it
has also been shown that conditioned media from menstrual effluent changes the
morphology of mesothelial cells in culture from a confluent polygonal monolayer to
spindle-like cells which do not necessarily adhere to one another and expose the
culture flask underneath (Demir Weusten et al., 2000). This suggests an interesting
relationship between retrograde menstrual effluent and site of implantation
whereby endometrial cells are able to create damage in order to adhere and
proliferate.

22
The genetic profile that characterises endometriosis is poorly understood; there is a
familial element with up to a 6 fold increase in risk for first degree relatives of
endometriosis patients but inheritance patterns are complex and it is likely that
environmental factors also play a role (Dun et al., 2010). Whole exome sequencing
of the eutopic and ectopic endometrium of 16 cases of ovarian endometriosis could
identify no significant mutations in either sample set (Li et al., 2014). However,
gene expression studies in baboons have found significant alterations in the EGF
(epidermal growth factor), PI3 kinase/Akt, and MAP kinase pathways in eutopic
endometrium upon the onset of endometriosis (Afshar et al., 2013). Dinulescu et
al., found that inducing K-Ras activation in the ovarian surface epithelial cells of
mice induced an endometriosis-like condition which was benign and never fatal
(Dinulescu et al., 2005). K-Ras is an oncogenic protein which is upstream of mTOR
and part of the MAP kinase pathway.
1.2.3 Treating Endometriosis
Treatment of endometriosis centres around management of pain and treatment of
infertility as there is no cure. Suppression of oestrogen, which induces proliferation
of the endometrium, is a common first-line treatment as it can be easily achieved
through the oral contraceptive which suppresses ovulation (Morotti et al., 2014;
Zito et al., 2014). In addition, gonadotrophin releasing hormone (GnRH) analogues
may be used for a short period of time to alleviate symptoms by imitating
menopause (NHS Choices, 2015; Ferrero et al., 2015). Analgesics such as
paracetamol or non-steroidal anti-inflammatory drugs (NSAIDs) such as ibuprofen
may be used to relieve pain and discomfort (NHS Choices, 2014; Zito et al., 2014).
Laparoscopic excision of endometriotic lesions or endometriomas (endometriosis
related cysts) is a common second-line treatment for the reduction of pain if non-
surgical interventions are not effective (NHS Choices, 2014; Kodaman, 2015). In
rare cases, hysterectomy (removal of the uterus) may be used to relieve symptoms
(NHS Choices, 2014; Magrina et al., 2015); however, this doesn’t necessarily result
in the dissipation of symptoms (Rizk et al., 2014).

23
1.3 Endometriosis and Ovarian Cancer: The Connection
Endometriosis is now becoming a well documented risk factor for ovarian cancer
with endometriosis occurring in up to 28% of patients with ovarian cancer (Sainz de
la Cuesta et al., 1996; Stewart et al., 2013; Pearce et al., 2012; Wu et al., 2009;
Merritt et al., 2008; Melin et al., 2006; Borgfeldt and Andolf, 2004; Brinton et al.,
1997; Brinton et al., 2004; Rossing et al., 2008; Brinton et al., 2005). A 20 year
study by Stewart et al., of more than 21,000 patients seeking fertility treatment in
Western Australia has shown that endometriosis is particularly associated with an
increased rate of ovarian cancer in patients who remained childless after fertility
treatment (Stewart et al., 2013). The study did not classify invasive epithelial
ovarian cancer any further however, a similarly large pooled analysis of 13 ovarian
cancer risk factor studies looked at the relationship between endometriosis and the
four major subtypes of epithelial ovarian cancer: clear cell, endometrioid, mucinous
and serous (high and low grade). They found that the association between
endometriosis and ovarian cancer differed between subtypes. Patients with low
grade serous (9.2%), endometrioid (13.9%) and clear cell (20.2%) subtypes were
more likely to have endometriosis (compared to 6.2% of control cases). Mucinous
epithelial ovarian cancer was not at all associated with endometriosis (Pearce et al.,
2012). In these studies no increased risk of ovarian cancer has been found in
patients with pelvic inflammatory disorder, ovarian cysts, fibroids, breastfeeding,
weight, height, body-mass index and tubal ligation highlighting the unique
relationship between endometriosis and ovarian cancer (Stewart et al., 2013;
Pearce et al., 2012; Borgfeldt and Andolf, 2004).
1.4 The mTOR Pathway
The mTOR signalling pathway is an integral mediator of growth and proliferation in
the cell; evolving to regulate anabolic and catabolic cellular processes based on the
resources available. The mTOR pathway is able to sense external energy and
oxygen status, nutrients and growth factors, amino acids and stress signals and
modulate protein and lipid synthesis, proliferation, growth, autophagy and

24
apoptosis accordingly (Laplante and Sabatini, 2012). In recent research,
components of the pathway have been implicated in a vast range of diseases and
conditions from Epilepsy (Russo et al., 2012) to intellectual disability (Troca-Marín
et al., 2012) to a range of malignancies and predispositions to them (Peterson et al.,
2009; Lu et al., 2015; Philp et al., 2001; Levine et al., 2005; Wataya-Kaneda, 2015).
1.4.1 mTOR Complexes
Activities of the mTOR pathway are mediated via two large complexes: mTOR
Complex 1 (mTORC1) and mTOR Complex 2 (mTORC2). mTORC1 and mTORC2 have
distinct functions, sensitivities and associated proteins that differentiate them from
one another and regulate their function under different contexts within the cell.
mTORC1 contains mTOR, raptor, DEPTOR, GβL and PRAS40. mTORC2 contains
mTOR, rictor, DEPTOR, GβL, mSIN1 and protor. mTORC1 modulates autophagy,
angiogenesis and protein and lipid synthesis in response to growth factors, amino
acids, genotoxicity, energy stress and hypoxia (Laplante and Sabatini, 2012).
mTORC2 is less well understood but it is known to regulate the actin cytoskeleton,
cell survival and apoptosis (Figure 1.14) (Jacinto et al., 2004; Dudek et al., 1997;
Peterson et al., 2009; García-Martínez and Alessi, 2008; Sarbassov et al., 2004;
Masri et al., 2007). mTORC1 is nutrient and Rapamycin sensitive whereas mTORC2
is not nutrient sensitive and is only secondarily sensitive to Rapamycin due to
Rapamycin’s binding to mTOR and removing it as an available component for
mTORC2 assembly (Jacinto et al., 2004; Jacinto et al., 2006; Kim et al., 2003; Kim et
al., 2002; Sarbassov et al., 2006). Below is a summary of the components of each
mTOR complex.
1.4.1.1 mTOR
mTOR (also known as FRAP), a 289kDa highly conserved serine/threonine kinase, is
the central catalytic component of mTORC1 and mTORC2. mTOR was first
identified in 1994 as the target of its inhibitor, Rapamycin (Sabers et al., 1995;

25
Brown et al., 1994) and in relation to the yeast homologues, DRR1 and DRR2
(Cafferkey et al., 1993) and is a member of the PIK-related kinase family.
1.4.1.2 DEPTOR
DEPTOR (also known as DEPDC6) is a 48kDa component of the mTOR pathway
which inhibits the activities of both mTORC1 and mTORC2 via direct interaction
with mTOR. Knockdown of DEPTOR causes an increase in phosphorylation of
downstream targets p70S6 kinase, 4EBP1 and Akt; in addition DEPTOR protein
expression is increased in reponse to serum starvation (Peterson et al., 2009).
Despite DEPTOR being an inhibitor of both mTORC1 and mTORC2, overexpression
of DEPTOR causes a decrease in mTORC1 signalling but an increase in mTORC2
signalling. This is because inhibition of mTORC1 relieves the feedback loop directed
at PI3 kinase, an upstream positive regulator of the mTORCs. PI3 kinase signalling is
then able to overcome DEPTOR inhibition of mTORC2, shown by Akt phophorylation
at threonine 308 (PI3 kinase associated) and serine 473 (mTORC2 associated)
(Peterson et al., 2009).
1.4.1.3 GβL
GβL (g protein beta subunit-like, also known as mLST8) is a 37kDa component of
both mTORC1 and mTORC2. GβL binds directly to the kinase domain of mTOR and
stabilises the mTOR-Raptor interaction; however, Raptor is not required for mTOR-
GβL interaction. It is a necessary component of mTORC1 and mTORC2 and
knockdown of GβL decreases the phosphorylation of downstream effectors p70S6
kinase and Akt and the nutrient sensitivity of mTORC1 (Kim et al., 2003; Guertin et
al., 2006). GβL is also necessary for the inhibition of mTORC1 by Rapamycin (Kim et
al., 2003).

26
1.4.1.4 Raptor
Raptor (regulatory associated protein of TOR, also known as KIAA1303) is a 150kDa
protein component of mTORC1 only (Hara et al., 2002). Raptor binds to mTOR
directly and at multiple contact points and is responsible for controlling mTOR’s
kinase activity, phosphorylation of downstream effectors p70S6 kinase and 4EBP1
and cell size (Kim et al., 2002; Hara et al., 2002). The mTOR-Raptor interaction is
sensitive to Rapamycin which interacts with FKBP12 to inhibit mTOR kinase activity
(Kim et al., 2002; Sedrani et al., 1998; Brown et al., 1995).
1.4.1.5 PRAS40
PRAS40 (proline rich Akt substrate of 40kDa) is a 40kDa raptor interacting, mTORC1
only component. PRAS40 inhibits mTOR kinase activity in an insulin sensitive
manner via phosphorylation by Akt at threonine 246 and decreases cell size when
overexpressed in HEK293 cells (Kovacina et al., 2003; Sancak et al., 2007; Thedieck
et al., 2007). Insulin stimulation causes PRAS40 phosphorylation and a decrease in
the amount bound to mTORC1 (Sancak et al., 2007). PRAS40 also appears to
protect from apoptosis in an mTORC1 independent fashion (Thedieck et al., 2007).
1.4.1.6 Rictor
Rictor (Rapamycin insensitive companion of mTOR) is a 192kDa mTORC2 only
component whose interaction with mTOR is not rapamycin sensitive (Sarbassov et
al., 2004). Rictor is an essential mTORC2 component for the phosphorylation of
PKCα, a downstream target of mTORC2, and for maintaining cell morphology
(Sarbassov et al., 2004).
1.4.1.7 mSIN1
mSIN1 (mammalian stress-activated MAP kinase-interacting protein 1, also known
as MAPKAP1) is a 78kDA mTORC2 protein component which mediates the mTORC2

27
specific Akt phosphorylation at serine 473 (Jacinto et al., 2006). mSIN1 and rictor
stabilise one another; knockdown of mSIN1 decreases rictor and vice versa (Jacinto
et al., 2006; Thedieck et al., 2007) (Pearce et al., 2007). mSIN1 interacts directly
with mTORC2 downstream target Akt (Jacinto et al., 2006).
1.4.1.8 Protor
Protor (protein observed with rictor, also known as PR55L) is an mTORC2 only
interacting protein via mSIN1 and/or rictor but is not required for mTORC2 complex
stability or kinase activity. Rictor knockout decreases protor expression suggesting
that rictor regulates protor (Pearce et al., 2007). Knockdown of protor causes an
increase in apoptosis in HeLa cells and cells with protor released from mTORC2
show increased apoptosis indicating that protor functions as a pro-apoptotic
protein when not bound to mTORC2 (Thedieck et al., 2007). This is further
supported by evidence that the pro-apoptotic function of protor is not diminished
when mTORC2 assembly is disrupted (Thedieck et al., 2007).

28
Figure 1.14 - Diagram of the main components of the mTOR pathway including upstream inputs and downstream effects. Image created based
on the research of (Laplante and Sabatini, 2012; Jacinto et al., 2004; Dudek et al., 1997; Peterson et al., 2009; García-Martínez and Alessi, 2008;

29
Sarbassov et al., 2004; Sarbassov et al., 2005; Sarbassov et al., 2006; Masri et al., 2007; Jacinto et al., 2006; Kim et al., 2002; Kim et al., 2003;
Sabers et al., 1995; Brown et al., 1995; Brown et al., 1994; Guertin et al., 2006; Hara et al., 2002; Sedrani et al., 1998; Kovacina et al., 2003;
Sancak et al., 2007; Thedieck et al., 2007; Pearce et al., 2007; Ma and Blenis, 2009; Isotani et al., 1999; Burnett et al., 1998; Holz et al., 2005;
Fingar et al., 2004; Gebauer and Hentze, 2004; A Pause et al., 1994; Dowling et al., 2010; Wang et al., 2004; Wang et al., 1995; Zhong et al.,
2000; Phillips et al., 2005; Hudson et al., 2002; Presta et al., 1997; Li et al., 2011; Peterson et al., 2011; Li et al., 2010; Porstmann et al., 2008;
Zhang et al., 2005; Kim and Chen, 2004; Liang et al., 1999; Yue et al., 2003; Qu et al., 2003; Hosokawa et al., 2009; Ganley et al., 2009; Jung et
al., 2009; Baskin and Sayeski, 2012; Amato et al., 2007; Aoyama et al., 2005; Lunhua Liu et al., 2010; Prevot et al., 2015; Jianquan Chen et al.,
2015; Potter et al., 2002; Misra and Pizzo, 2014; Stokoe et al., 1997; Hsu et al., 2011; Tzatsos and Kandror, 2006; Carracedo et al., 2008; Um et
al., 2004; Harrington et al., 2004; Young and Povey, 1998; Carpenter et al., 1990; Thorpe et al., 2015; Franke et al., 1995; Datta et al., 1996;
Alessi et al., 1997; Stambolic et al., 2001; Weng et al., 1999; Leslie et al., 2000; Sun et al., 1999; Manning et al., 2002; Inoki et al., 2002; Inoki et
al., 2003; Gwinn et al., 2008; Tee et al., 2003; Kenerson et al., 2002; Kastan et al., 1991; Sablina et al., 2005; Feng et al., 2005; Shaw et al.,
2004; Maxwell et al., 1997; Yoon et al., 2006; Sudhagar et al., 2011; Treins et al., 2002; Brugarolas et al., 2004; DeYoung et al., 2008;
Blommaart et al., 1995; Fox et al., 1998; Hara et al., 1998; Sancak et al., 2010; Kim et al., 2008; Zinzalla et al., 2011; Smith et al., 2005)
30
1.4.2 Downstream of mTOR Complexes
mTOR is known to induce or inhibit many cellular processes including protein
synthesis, angiogenesis, cell cycle progression, cell growth, lipid synthesis,
autophagy, cytoskeletal organisation, apoptosis and cell survival. The majority of
mTOR signalling occurs via mTORC1 and is involved in the initiation of translation
through the activation of translation machinery (Ma and Blenis, 2009).
1.4.2.1 mTORC1
mTORC1 acts via five main downstream effectors: p70S6 kinase, 4EBP1 (4E binding
protein 1, also known as EIF-4EBP1), HIF-1 (hypoxia inducible factor 1), PPARγ
(peroxisome proliferator-activated receptor gamma) and the ULK1 complex.
mTORC1 phosphorylates and activates p70S6 kinase at threonines 389 and 412
(Isotani et al., 1999; Burnett et al., 1998). p70S6 kinase stimulates cell cycle
progression and protein synthesis (Holz et al., 2005; Fingar et al., 2004). mTORC1
also directly phosphorylates 4EBP1 to initiate translation. Translation initiation is
the first stage of protein synthesis which involves the binding of the 40S ribosomal
subunit to the 5’ end of mRNA and ‘scanning’ until it reaches the start codon (AUG)
followed by the recruitment of the 60S ribosomal subunit to make a complete
ribosome (Gebauer and Hentze, 2004). When hypophosphorylated, 4EBP1 binds to
the 5’ mRNA cap binding protein eIF-4E (eukaryotic translation initiation factor 4E)
and removes it as an available component in the binding of the ribosome to mRNA
and therefore cap dependent translation (A Pause et al., 1994; Gebauer and
Hentze, 2004). mTORC1 phosphorylates 4EBP1 at threonines 36 and 45 which
prevents its association with eIF-4E and allows eIF-4E to act within the translation
initiation complex (Burnett et al., 1998). This results in protein synthesis which
promotes proliferation and cell cycle progression (Dowling et al., 2010).
The HIF-1 transcription factor and VEGF pathway are known to control angiogenesis
via mTORC1. The HIF-1α subunit of HIF-1 accumulates under hypoxic conditions
allowing for its association with HIF-1β (Wang et al., 1995). HIF-1α expression is

31
controlled by mTORC1 signalling (Zhong et al., 2000; Phillips et al., 2005; Hudson et
al., 2002) and HIF-1 induces the VEGF pathway which increases endothelial
permeability and cellular migration (Presta et al., 1997; Wang et al., 2004). In
support of its role in inducing proliferation, mTOR signalling is also able to initiate
lipid synthesis for cellular membranes and cell growth. mTORC1 induces lipid
synthesis via the transcription factor SREBP (sterol regulatory element-binding
protein) which is regulated by p70S6 kinase (Li et al., 2011; Peterson et al., 2011; Li
et al., 2010; Porstmann et al., 2008). mTORC1 also plays a role in adipocyte
differentiation via the transcription factor PPARγ (Zhang et al., 2005; Kim and Chen,
2004).
Autophagy is the lysosomic degradation and recycling of damaged or unneeded
cellular components and is a tumour suppressor function as it rids cells of damaged
organelles and decreases proliferation and tumourigenesis (Liang et al., 1999; Yue
et al., 2003; Qu et al., 2003). mTORC1 signalling suppresses autophagy via the ULK1
complex. The ULK1 complex is comprised of ULK1 (unc-51 like autophagy activating
kinase 1), Atg13 (autophagy related 13) and FIP200 (FAK family kinase-interacting
protein of 200 kDa) (Hosokawa et al., 2009; Ganley et al., 2009). mTORC1
phosphorylates ULK1 and Atg13 which inhibits the ULK1 complex and therefore
autophagy (Ganley et al., 2009; Jung et al., 2009).
1.4.2.2 mTORC2
mTORC2 acts independently of p70S6 kinase and the TSC1/TSC2 complex and is not
involved in some of the mTORC1 downstream effects such as regulation of cell size
(Sarbassov et al., 2004; Guertin et al., 2006). The Rictor-mTOR complex is
responsible for the phosphorylation of PKCα (protein kinase C alpha) which is in
turn, at least partially, responsible for organisation of the actin cytoskeleton and
maintenance of cell morphology (Sarbassov et al., 2004; Masri et al., 2007).
mTORC2 but not mTORC1 is responsible for control of apoptosis via SGK1 (serum
and glucocorticoid-inducible kinase 1) (Dudek et al., 1997; García-Martínez and
Alessi, 2008; Peterson et al., 2009). SGK1 is inhibitory of apoptosis via its target

32
NDRG1 (N-myc downstream regulated 1) (García-Martínez and Alessi, 2008; Baskin
and Sayeski, 2012; Amato et al., 2007; Aoyama et al., 2005). mTORC2 has also been
shown to play a role in anchorage dependent growth and motility, development of
immune cells, neutrophil chemotaxis and skeletal development (Masri et al., 2007;
Lunhua Liu et al., 2010; Prevot et al., 2015; Jianquan Chen et al., 2015).
Akt is both upstream of mTORC1 and downstream of mTORC2 and is differentially
phosphorylated with a dual role in mTOR pathway signalling. Akt is phosphorylated
on threonine 308 by PDK-1 after activation by PIP3 and is involved in disrupting the
TSC1/TSC2 complex upstream of mTORC1, affecting p70S6 kinase and 4EBP1
phosphorylation (Jacinto et al., 2006; Potter et al., 2002; Misra and Pizzo, 2014;
Stokoe et al., 1997). mTORC2 phosphorylates Akt on serine 473 which affects only
mTORC2 related functions such as phosphorylation of the FOXO1 and FOXO3a
transcription factors (Sarbassov et al., 2005; Jacinto et al., 2006). Phosphorylation
of Akt at serine 473 promotes cell survival and dephosphorylation at this site can
induce apoptosis (Jacinto et al., 2006).
The mTOR pathway is stabilised by a number of negative feedback loops. mTOR
mediates inhibition of PI3 kinase via adapter protein Grb10 (growth factor receptor-
bound protein 10), insulin receptor substrate (IRS) via raptor and the MAP kinase
pathway (Hsu et al., 2011; Tzatsos and Kandror, 2006; Carracedo et al., 2008).
Downstream of mTORC1, there is also evidence of IRS inhibition by p70S6 kinase
(Um et al., 2004; Harrington et al., 2004).

33
1.4.3 Upstream of mTOR Complexes
1.4.3.1 mTORC1
1.4.3.1.1 TSC1/TSC2
The TSC1 (tuberous sclerosis complex 1, also known as hamartin) and TSC2
(tuberous sclerosis complex 2, also known as tuberin) heterodimeric complex is
responsible for mediating the majority of upstream signals to mTORC1 (Laplante
and Sabatini, 2012). The components of the TSC complex are named for their
involvement in the condition tuberous sclerosis which is characterised by benign
growths affecting the whole body (Young and Povey, 1998).
1.4.3.1.2 The PI3 Kinase/Akt/mTOR Axis
The majority of mTOR signalling to TSC1/TSC2 is via the multifunctional PI3
kinase/Akt axis. PI3 kinase is a heterodimeric signalling protein composed of an
85kDa regulatory subunit and a 110kDa catalytic subunit of the class IA family of PI3
kinases (Carpenter et al., 1990; Thorpe et al., 2015). The kinase activity of PI3
kinase is inhibited by its regulatory subunit until receptor activation after which it is
able to phosphorylate phosphatidylinositide (PtdIns) 4,5-bisphosphate (PIP2) to
PtdIns 3,4,5-bisphosphate (PIP3) (Thorpe et al., 2015). Activation of PI3 kinase
signalling activates Akt via PIP3 dependent protein kinase 1 (PDK1) (Misra and Pizzo,
2014; Franke et al., 1995; Datta et al., 1996; Stokoe et al., 1997; Alessi et al., 1997).
The tumour suppressor PTEN (phosphatase and tensin homologue on chromosome
ten) acts to downregulate PI3 kinase signalling by dephosphorylating PIP3 to PIP2
and is controlled by p53 (Stambolic et al., 2001; Weng et al., 1999; Leslie et al.,
2000; Sun et al., 1999).
Activated Akt by phosphorylation of threonine 308 prevents the colocalisation of
TSC1 with TSC2 and therefore the formation of the TSC1/TSC2 complex by
phosphorylating TSC2 at serines 939, 1086 and 1088 and threonines 1462 and 1422

34
(Misra and Pizzo, 2014; Potter et al., 2002; Manning et al., 2002; Inoki et al., 2002).
The TSC1/TSC2 complex is differentially regulated by alternative phosphorylation
sites. Phosphorylation of threonine 1227 and serine 1345 can cause inhibition of
downstream mTOR signalling (Inoki et al., 2003; Gwinn et al., 2008). When in
complex with TSC1, TSC2 shows GAP (GTPase activating protein) activity toward
Rheb (rat homologue enriched in brain), converting Rheb-GTP to Rheb-GDP and
preventing its phosphorylation of mTOR at serine 2448 and therefore the
phosphorylation of downstream effectors of the mTOR pathway p70S6 kinase, S6,
4EBP1 and EIF-4G (eukaryotic translation initiation factor 4G) (Inoki et al., 2003;
Inoki et al., 2002; Tee et al., 2003; Kenerson et al., 2002).
1.4.3.1.3 The Ras/MAP Kinase pathway
In addition to PI3 kinase and Akt, TSC1/TSC2 is also downstream of the Ras/MAP
kinase pathway. MAP kinase (Erk) acts in a similar way to Akt on the TSC1/TSC2
complex by phosphorylating TSC2 and inducing its dissociation from TSC1; thereby
inactivating its inhibitory effect on mTOR. However, MAPK phosphorylates serine
664 on TSC2, which is different to the two phosphorylation sites targeted by Akt
(Ma and Blenis, 2009).
1.4.3.1.4 Stress Signals: Energy, Hypoxia and DNA Damage
It is critical that the cell is able to sense stress signals and respond accordingly, by
downregulating the positive growth effects of the mTOR pathway. Most stress-
mediated inhibition of mTOR signalling acts via the TSC1/TSC2 complex and
mTORC1. Many cellular indicators of stress cause mTOR pathway downregulation
(Figure 1.15) by the activation of tumour suppressor gene p53. p53 is activated in
cases of DNA damage and oxidative stress (Kastan et al., 1991; Sablina et al., 2005)
and acts via both the PI3 kinase/Akt pathway and in a PI3 kinase independent
manner. p53 causes the upregulation of PTEN protein expression by directly
binding to the PTEN gene promoter (Stambolic et al., 2001). PTEN
dephosphorylates PIP3 to form PIP2 in order to inhibit PI3 kinase signalling and is

35
therefore a tumour suppressor gene (Weng et al., 1999; Leslie et al., 2000; Sun et
al., 1999; Thorpe et al., 2015). DNA damage, therefore, is able to inhibit the mTOR
pathway to halt growth in the case of aberant genetic mutation by inducing PTEN
expression (Feng et al., 2005). p53 also acts by upregulating the expression of
Sestrin1 and Sestrin2 which act via AMP-responsive protein kinase (AMPK) to inhibit
mTORC1 pathway signalling by alternative phosphorylation of TSC2 (Budanov and
Karin, 2008). AMPK is also activated by LKB1 (liver kinase B1) by activating
phosphorylation at threonine 172 (Shaw et al., 2004). In contrast to the TSC1/TSC2
complex dissociating phosphorylation described above, AMPK phosphorylation at
threonine 1227 and serine 1345 does not activate mTOR pathway signalling but
inhibits it through an as yet unknown mechanism (Inoki et al., 2003; Gwinn et al.,
2008). In addition to involvement in the response to DNA damage, AMPK is also
important in sensing and responding to cellular energy levels. Cellular energy is
measured by ATP (adenosine triphosphate), the phosphate group donor molecule
used in signal transduction pathways which is critical in cell signalling. Protein
synthesis is a high energy consuming process and the cell must be able to respond
to ATP levels accordingly. AMPK also phosphorylates raptor to inhibit mTORC1
signalling (Gwinn et al., 2008).
Hypoxia, the state of having lower than optimal levels of available oxygen, is a
major indicator of cellular stress. Oxygen is used in cellular respiration to create
energy and is critical in normal cellular metabolism. The expression of hypoxia
inducible factor 1 alpha (HIF-1α), a subunit of the HIF-1 transcription factor which
induces the upregulation of genes involved in angiogenesis and erythropoiesis
(Maxwell et al., 1997; Yoon et al., 2006) is mediated via the mTOR signalling
pathway (Sudhagar et al., 2011; Treins et al., 2002). Hypoxia also upregulates
REDD1 which induces mTOR inhibition via the TSC1/TSC2 complex (Brugarolas et
al., 2004; DeYoung et al., 2008).
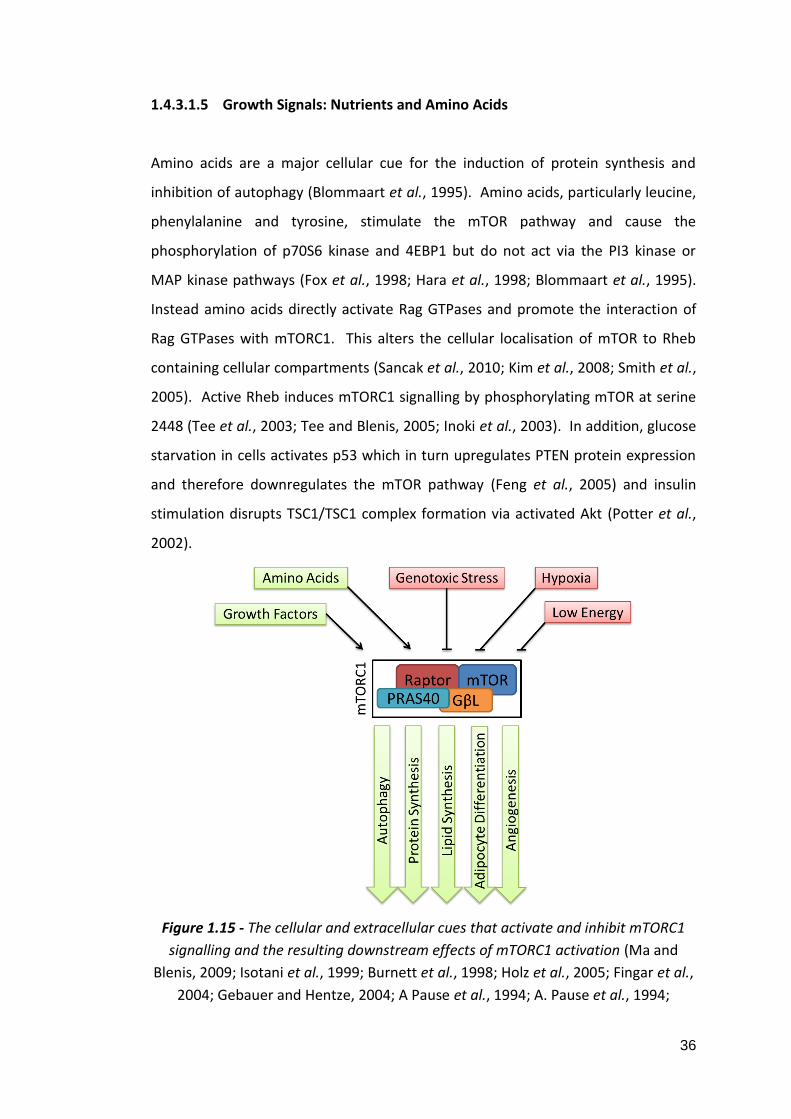
36
1.4.3.1.5 Growth Signals: Nutrients and Amino Acids
Amino acids are a major cellular cue for the induction of protein synthesis and
inhibition of autophagy (Blommaart et al., 1995). Amino acids, particularly leucine,
phenylalanine and tyrosine, stimulate the mTOR pathway and cause the
phosphorylation of p70S6 kinase and 4EBP1 but do not act via the PI3 kinase or
MAP kinase pathways (Fox et al., 1998; Hara et al., 1998; Blommaart et al., 1995).
Instead amino acids directly activate Rag GTPases and promote the interaction of
Rag GTPases with mTORC1. This alters the cellular localisation of mTOR to Rheb
containing cellular compartments (Sancak et al., 2010; Kim et al., 2008; Smith et al.,
2005). Active Rheb induces mTORC1 signalling by phosphorylating mTOR at serine
2448 (Tee et al., 2003; Tee and Blenis, 2005; Inoki et al., 2003). In addition, glucose
starvation in cells activates p53 which in turn upregulates PTEN protein expression
and therefore downregulates the mTOR pathway (Feng et al., 2005) and insulin
stimulation disrupts TSC1/TSC1 complex formation via activated Akt (Potter et al.,
2002).
Figure 1.15 - The cellular and extracellular cues that activate and inhibit mTORC1
signalling and the resulting downstream effects of mTORC1 activation (Ma and
Blenis, 2009; Isotani et al., 1999; Burnett et al., 1998; Holz et al., 2005; Fingar et al.,
2004; Gebauer and Hentze, 2004; A Pause et al., 1994; A. Pause et al., 1994;
37
Dowling et al., 2010; Wang et al., 1995; Zhong et al., 2000; Phillips et al., 2005;
Presta et al., 1997; Wang et al., 2004; Li et al., 2011; Peterson et al., 2011; Li et al.,
2010; Porstmann et al., 2008; Zhang et al., 2005; Kim and Chen, 2004; Liang et al.,
1999; Yue et al., 2003; Qu et al., 2003; Hosokawa et al., 2009; Ganley et al., 2009;
Jung et al., 2009; Sarbassov et al., 2004; Guertin et al., 2006; Sarbassov et al., 2004;
Masri et al., 2007; Dudek et al., 1997; García-Martínez and Alessi, 2008; Baskin and
Sayeski, 2012; Amato et al., 2007; Aoyama et al., 2005; Lunhua Liu et al., 2010;
Prevot et al., 2015; Jianquan Chen et al., 2015; Jacinto et al., 2006; Potter et al.,
2002; Misra and Pizzo, 2014; Stokoe et al., 1997; Sarbassov et al., 2005; Hsu et al.,
2011; Tzatsos and Kandror, 2006; Carracedo et al., 2008; Um et al., 2004;
Harrington et al., 2004; Laplante and Sabatini, 2012; Young and Povey, 1998;
Carpenter et al., 1990; Thorpe et al., 2015; Franke et al., 1995; Datta et al., 1996;
Stokoe et al., 1997; Alessi et al., 1997; Stambolic et al., 2001; Weng et al., 1999;
Leslie et al., 2000; Sun et al., 1999; Potter et al., 2002; Manning et al., 2002; Inoki et
al., 2002; Inoki et al., 2003; Gwinn et al., 2008; Tee et al., 2003; Kenerson et al.,
2002; Kastan et al., 1991; Sablina et al., 2005; Stambolic et al., 2001; Feng et al.,
2005; Budanov and Karin, 2008; Shaw et al., 2004; Maxwell et al., 1997; Yoon et al.,
2006; Sudhagar et al., 2011; Treins et al., 2002; Brugarolas et al., 2004; DeYoung et
al., 2008; Blommaart et al., 1995; Fox et al., 1998; Hara et al., 1998; Sancak et al.,
2010; Kim et al., 2008; Smith et al., 2005; Tee and Blenis, 2005; Tee et al., 2003;
Feng et al., 2005).
1.4.3.2 mTORC2
Less is understood of the upstream effectors of mTORC2 signalling. Zinzalla et al.,
demonstrated that the ribosome is required for mTORC2 signalling and that active
mTORC2 interacts with the ribosome directly, an association which is promoted by
PI3 kinase signalling. Although mTORC2 signalling requires the ribosome, it is
independent of protein synthesis (Zinzalla et al., 2011).
1.5 Ovarian Cancer, Endometriosis and the mTOR pathway
Due to its involvement in growth factor and energy sensing and its effects on
protein synthesis and cell cycle progression, the mTOR pathway is highly relevant in
disorders involving loss of growth restriction such as cancer. The mTOR pathway
has been shown to be implicated in a range of malignancies (Figure 1.16).

38
Figure 1.16 - The mTOR pathway has been shown to be implicated in breast cancer,
colorectal cancer, prostate cancer, glioma, lung cancer, melanoma, osteosarcoma,
renal cell carcinoma, lymphomas, thyroid cancers, endometrial cancer, pituitary
cancer and bladder cancer (Karthik et al., 2015; Lu et al., 2015; Majumder et al.,
2004; Masri et al., 2007; Guertin et al., 2009; Jiang et al., 2009; Jiang et al., 2015;
Shin et al., 2015; Shao et al., 2015; Song et al., 2015; Kawada et al., 2014; Moraitis
et al., 2014; Schrauwen et al., 2015; Lee et al., 2015; Shu et al., 2015; Arumugam et
al., 2012; Campbell et al., 2004; Campbell et al., 2008).
The mTOR pathway has been implicated in ovarian cancer in a number of ways.
Phosphorylated 4EBP1 and p70S6 kinase show high expression in comparison to
non-malignant tissues (Castellvi et al., 2006) and phosphorylated 4EBP1 specifically
shows correlation with advanced stage and grade, greater chemoresistance and
shorter disease free survival (No et al., 2011). In addition to this, Akt, PTEN, the
catalytic and regulatory subunits of PI3 kinase, PPARγ and VEGF have also been
shown to be mutated or upregulated in ovarian cancer (Zhang et al., 2005;
Masoumi-Moghaddam et al., 2015; De Marco et al., 2013; Philp et al., 2001; Levine
et al., 2005; Carpten et al., 2007; Yang et al., 2006; Obata et al., 1998).

39
Upregulation of the mTOR pathway in ovarian cancer has also been associated in
vitro with increased invasion and migration including upregulation of matrix
metalloproteinase (MMP) 9, epithelial-mesenchymal transition (EMT),
angiogenesis, metastasis, increased proliferation and chemoresistance (Zhou and
Wong, 2006; Meng et al., 2006; Pon et al., 2008; Bian et al., 2010; Ip et al., 2014;
Im-aram et al., 2013; Foster et al., 2010). However, little is known about the actual
expression of mTORC components in ovarian cancer. Preliminary studies have
shown that both mTORC1 and mTORC2 via raptor and rictor are important for
ovarian cancer proliferation (Montero et al., 2012) and that mTORC2 is more
frequently active in clear cell carcinoma than serous adenocarcinoma (Hisamatsu et
al., 2013).
The genetic changes that characterise endometriosis are poorly understood;
however, the mTOR pathway has been implicated in a number of ways. Leconte et
al., found that protein expression of both Akt and p70S6K was increased in both the
eutopic endometrium and endometriotic lesions of patients with deep infiltrating
endometriosis (DIE) in comparison to control endometrium. Interestingly, there
was minimal or no difference in expression between eutopic and lesion
endometrium in patients with DIE (Leconte et al., 2011). Afshar et al., showed
changes in 23 PI3 kinase/Akt pathway related genes and 26 MAP kinase pathway
related genes in the eutopic endometrium of baboons with endometriosis (Afshar
et al., 2013). Both the PI3 kinase and MAP kinase pathways can inactivate the
TSC1/TSC2 complex causing a release of its inhibitory effect on mTOR kinase activity
(Potter et al., 2002; Manning et al., 2002; Ma and Blenis, 2009). Guo et al., noted
higher phosphorylated mTOR in ectopic endometrium than in eutopic or control
endometrium (Guo et al., 2015).
An interesting study by Dinulescu et al., found that inducing K-ras activation caused
an endometriosis-like condition in mice that was benign. The addition of deletion
of PTEN, a tumour suppressor gene upstream of mTOR and involved in the PI3
kinase/Akt/mTOR axis, in mice induced ovarian endometrioid adenocarcinoma.
PTEN deletion alone did not induce pathology in the same time-span. In addition,

40
the study found that the combination of K-ras phosphorylation and PTEN deletion
induced the phosphorylation of Akt, mTOR and p70S6 kinase indicating that the
mTOR pathway, either by PI3 kinase/Akt or Ras/MAP kinase activation is implicated
in the transformation of endometriosis to ovarian cancer (Dinulescu et al., 2005).
This is further supported by the frequent downregulation of PTEN found in ovarian
cancers (Laudański et al., 2011; De Marco et al., 2013) and increased K-ras
activation in endometriosis (Shahrabi-Farahani et al., 2014; Amemiya et al., 2004).
1.6 mTOR Pathway Inhibitors
1.6.1 Rapamycin and the Rapalogues
Rapamycin (also known as Sirolimus), the first known inhibitor of mTOR kinase, was
first described in 1975 in two papers by Vezina et al., and Sehgal et al.,. Isolated
from the bacteria Streptomyces hygroscopicus found in a soil sample from Chilean
Easter Island and named for the Polynesian name for the island, Rapa Nui,
Rapamycin is a potent inhibitor of yeast and filamentous fungi but not bacteria
(Vézina et al., 1975; Sehgal et al., 1975). In 1991 the first target of Rapamycin, the
yeast equivalent of the kinase we now call mechanistic target of rapamycin (mTOR),
was identified by Heitman et al., (Heitman et al., 1991). The mammalian TOR was
discovered in 1994 and 1995 by Brown et al., and Sabers et al., respectively (Brown
et al., 1994; Sabers et al., 1995). Rapamycin’s anti-fungal properties were quickly
overshadowed when it was found to be a potent immunosuppressant and a useful
compound in preventing the rejection of transplanted organs by inhibiting the
proliferation and activation of T- and B-lymphocytes (Kay et al., 1991; Dumont et
al., 1990; Morelon et al., 2001). Rapamycin, under the brand name Rapamune
(Pfizer), was licenced for use in renal transplantation in the EU in 2001 (European
Medicines Agency, 2015c).
Since the discovery of Rapamycin, a host of semi-synthetic Rapamycin-related
mTOR inhibitors, known as Rapalogues, have been developed by modifying the C40
hydroxyl group to improve the aqueous solubility and pharmacokinetics of

41
Rapamycin. These include Everolimus (Novartis), Deforolimus (Merck/ARIAD
Pharmaceuticals) and Temsirolimus (Pfizer), among others. Everolimus (also known
as RAD001) was developed by chemical modification of Rapamycin to introduce a 2-
hydroxylethyl group to the hydroxyl in position 40 (Sedrani et al., 1998). The
resulting derivative has improved pharmacokinetics for oral administration without
loss of immunosuppressive properties (Sedrani et al., 1998; Benjamin et al., 2011)
and Everolimus was approved for the treatment of renal cell carcinoma and
pancreatic and breast neoplasms by the EMA in 2009. Deforolimus (also known as
Ridaforolimus, AP23573 and MK-8669) is a non-Rapamycin prodrug derivative of
Rapamycin where the second alcohol moiety of carbon 43 has been replaced with a
phosphate group to improve solubility for oral administration (Benjamin et al.,
2011). Although Deforolimus is considered a non-Rapamycin prodrug, its
mechanism of action is the same as Rapamycin and the other rapalogues.
Deforolimus is not yet approved for use by the EMA but is currently being evaluated
in clinical trials for patients with advanced solid tumours (Di Cosimo et al., 2015;
Brana et al., 2014; Tsoref et al., 2014). Temsirolimus (also known as CCI-779) is an
ester derivative of Rapamycin. Temsirolimus was licenced in 2007 by the EMA for
treatment of renal cell carcinoma and mantle cell lymphoma (Table 1.5).
1.6.1.1 Rapamycin: Mechanism of Action
Rapamycin and the rapalogues are primarily mTORC1 inhibitors due to their effect
on raptor. They act by binding the intracellular protein FK-506 binding protein 12
(FKBP12) (Sedrani et al., 1998; Brown et al., 1994) and acting in complex to inhibit
mTOR activity by causing the dissociation of mTOR and raptor (Figure 1.17)
(Beuvink et al., 2005; Kim et al., 2002; Yip et al., 2010). The Rapamycin/FKBP12
complex binds to a domain within mTOR known as the FRB (FKBP12 Rapamycin
binding) domain and identified as amino acids 2025-2114 (Chen et al., 1995).
Rapamycin and rapalogues have been shown to have a wide range of effects both in
vitro and in vivo including G1 cell cycle arrest, inhibition of proliferation, tumour
growth, angiogenesis and ascites production, improved survival, enhancement of
cytotoxic agents, suppression of T-cell proliferation and T- and B-cell activation

42
(Brown et al., 1994; Beuvink et al., 2005; Treeck et al., 2006; Hahn et al., 2005;
Dumont et al., 1990; Kay et al., 1991; Mabuchi, Deborah A Altomare, et al., 2007;
Mabuchi, Deborah A. Altomare, et al., 2007; Fagone et al., 2013).
Figure 1.17 - The mechanism of action of Rapamycin and the rapalogues.
Rapamycin complexes with FKBP12 and disrupts the interaction of mTOR and raptor
via the FRB domain of mTOR (Sedrani et al., 1998; Brown et al., 1994; Beuvink et al.,
2005; Kim et al., 2002; Yip et al., 2010; Chen et al., 1995).
It has recently been suggested that Rapamycin may have a secondary inhibitory
effect on mTORC2. Although Rapamycin doesn’t target mTORC2 directly, it does
bind to free mTOR (Brown et al., 1994; Sabers et al., 1995) which removes it as an
available complex component and thereupon disrupts mTORC2 assembly
(Sarbassov et al., 2006). Although the effect of Rapamycin on mTORC1 is potent
and immediate (30 minutes) the effect on mTORC2 is less so (24 hours) (Sarbassov
et al., 2006). However, this phenomenon has only been detected in HeLa and PC3
cell lines. This may be a cell type specific response and further studies are required
to determine if this effect can be detected in other cells.
1.6.2 Dual mTOR and PI3 Kinase Inhibitors
Rapalogues are not the only method of mTOR pathway inhibition and recent
interests have turned to single compounds with dual inhibitory properties.
Targeting both mTOR and PI3 kinase is advantageous as mTOR inhibition can relieve
negative feedback loops directed at the PI3 kinase and MAP kinase pathways which
in turn activate mTORC2 signalling (Zitzmann et al., 2010; Carracedo et al., 2008).

43
Resveratrol is a natural polyphenol found in some fruits, most notably in the skin of
grapes, which is a dual mTOR and PI3 kinase inhibitor. Resveratrol inhibits mTOR by
enhancing its interaction with native inhibitor DEPTOR (Meilian Liu et al., 2010) and
PI3 kinase directly via its ATP binding site (Fröjdö et al., 2007). Resveratrol is not
currently licenced for use in any conditions but has been the subject of a number of
clinical trials focussing on nonalcoholic fatty liver disease, metabolic syndrome and
insulin sensitivity with mixed outcomes (Faghihzadeh et al., 2014; Kjaer et al., 2015;
Liu et al., 2014). NVP BEZ-235 (Novartis) is a synthetic dual mTOR and PI3 kinase
inhibitor which acts by binding to the ATP binding sites of both proteins (Maira et
al., 2008). NVP BEZ-235 inhibits the mTOR pathway and lessens the negative
feedback induced upregulation of mTORC2 signalling by mTORC1 inhibition by also
targeting PI3 kinase (Serra et al., 2008; Brünner-Kubath et al., 2011). NVP BEZ-235
has shown more potent antiproliferative effects than rapalogues and suppresses
tumour growth in mice (Serra et al., 2008).

44
Inhibitor Mechanism of Action Molecular Structure Chemical
Formula
Licenced Uses
Rapamycin
(Sirolimus)
Forms a complex with
FKBP12 to allosterically
inhibit mTOR
C51H79NO13 Pfizer
Rapamune: prophylaxis for organ rejection
Everolimus
(RAD001)
Prodrug form of
Rapamycin
C53H83NO14 Novartis
Afinitor/Zortress: Advanced kidney cancer, post-
menopausal breast cancer, neuroendocrine
pancreatic cancer
Deforolimus
(Ridaforolimus,
AP23573, MK-
8669)
Non-Rapamycin
prodrug
C53H84NO14P Merck/ARIAD Pharmaceuticals
None

45
Temsirolimus
(CCI-779)
Prodrug form of
Rapamycin
C56H87NO16 Pfizer
Torisel: Renal cell carcinoma
Resveratrol Inhibits mTOR by
promoting interaction
with native inhibitor
DEPTOR. Binds directly
to ATP binding site of
PI3 kinase.
C14H12O3 None
NVP BEZ-235
(Dactolisib)
Binds to ATP binding
sites of both mTOR and
PI3 kinase.
C30H23N5O None
Table 1.5 - Molecular structures, chemical formulas and licenced uses of six mTOR or mTOR/PI3 kinase inhibitors. Table made using the
following sources (Vézina et al., 1975; Sehgal et al., 1975; Heitman et al., 1991; Brown et al., 1994; Sabers et al., 1995; Kay et al., 1991; Dumont
et al., 1990; Morelon et al., 2001; Sedrani et al., 1998; Benjamin et al., 2011; Di Cosimo et al., 2015; Brana et al., 2014; Tsoref et al., 2014;

46
Beuvink et al., 2005; Kim et al., 2002; Yip et al., 2010, p.2010; Chen et al., 1995; Treeck et al., 2006; Hahn et al., 2005; Dumont et al., 1990; Kay
et al., 1991; Mabuchi, Deborah A Altomare, et al., 2007; Mabuchi, Deborah A. Altomare, et al., 2007; Fagone et al., 2013; Zitzmann et al., 2010;
Carracedo et al., 2008; Fröjdö et al., 2007; Maira et al., 2008; Serra et al., 2008; Brünner-Kubath et al., 2011). Molecular structure diagrams
adapted from selleckchem.com with permission

47
1.7 Point of Care Diagnostics
PoCT is becoming the gold standard of diagnostics in medical fields. PoCT allows a
test to be carried out and results obtained in a single visit to a primary or secondary
care health provider, dramatically reducing the wait time between doctor
consultation and diagnosis. This allows for immediate commencement of
treatment, increasing the likelihood of a favourable patient outcome, reducing the
chance of transmission in the case of communicable conditions, eliminating the rate
of specimen loss in transit and increasing the potential for personalised medicine.
In developing countries and low-resource settings, PoCT is perhaps even more
effective; the need for expensive central laboratories, highly trained technicians
and a reliable method of data storage can all be removed with the implementation
of a well-designed multifunctional PoCT system. Bringing the test into the clinic in
areas of high displacement reduces the likelihood of losing patient contact before
the condition has been effectively treated. With over 15,000 NHS patients waiting
longer than 6 weeks for the implementation of a diagnostic test in England in May
2015 (NHS, 2015a), PoC diagnostics is not yet a reality in the UK and is even less so
in the developing world.
1.7.1 qPCR
qPCR, the method by which a nucleotide sequence can be exponentially amplified
and quantitatively measured in real-time, is now a mainstay in research and
medical laboratories alike. The polymerase chain reaction (PCR) was first described
by Har Gobind Khorana and Kjell Kleppe in the early 1960s but was not fully
appreciated until development by Kary Mullis in 1983, for which he won a Nobel
Prize. The method uses cycling temperatures and short nucleotide primers to
induce the amplification of deoxyribonucleic acid (DNA) with a DNA polymerase.
Significant improvements have now been made to the technique, including the
development of thermally stable DNA polymerases from the thermophilic bacteria
Thermus aquaticus (Taq) which was originally found in the hot springs of
Yellowstone National Park (Brock and Freeze, 1969). PCR was able to become

48
quantitative with the addition of SYBR® Green, a fluorophore which selectively
binds to double stranded DNA (Zipper et al., 2004) and allows amplification to be
measured in real-time by fluorescence measurement.
Full details of the development and mechanism of qPCR can be found in Appendix
1.
1.7.2 Thermal Cyclers
The three stages of the qPCR process, dissociation, primer annealing and extension,
are temperature dependent. qPCR assays are carried out on thermal cyclers;
instruments which serve to incubate the sample at appropriate temperatures and
measure fluorescence change over time. The PCR process cycles samples through a
temperature profile; typically 95°C, 60°C, and 72°C, forty times or more. The time
taken to increase or decrease the temperature between these levels, known as the
ramp rate, varies from instrument to instrument and can lengthen a qPCR
experiment to a greater or lesser degree beyond the incubation times. A typical
qPCR experiment can take more than 2 hours to complete; a time which is not
compatible with PoCT and limits the potential benefits of qPCR diagnostics.
Thermal uniformity in qPCR is the degree to which there is a temperature gradient
over the sample area and is in opposition with test speed. The absence of thermal
uniformity can cause divergence in the cycling conditions experienced by different
samples in the same assay. qPCR instruments typically connect a heat source to
sample tray via a conductive metal block. The nature of the block allows heat to
distribute evenly, after a period of equilibration. It is the time taken to even out the
applied temperature that can constrain the speed at which thermal cycling can
proceed. In addition to this, the so called ‘edge effect’ by which heat loss is greater
at the edges of the block means that thermal uniformity is difficult to maintain
without active control over the sample area. A fast qPCR instrument is only useful if
experimental integrity can be maintained (Tania Nolan, 2013).

49
1.7.3 Point of Care Testing
The use of qPCR as a diagnostic method is not new but, in recent years, efforts to
improve the technique have increased and qPCR diagnostics is an ever rapidly
developing field. As the process has evolved, the applications for it have increased,
and now range from infectious diseases to paternity identification and from
forensic analysis to food processing.
qPCR diagnostic tests have been developed for many infectious conditions;
Cepheid, who specialise in clinical diagnostic testing, have cartridge based
diagnostic tests for a range of clinically relevant conditions such as MRSA and
Norovirus to accompany their GeneXpert system (Cepheid, 2015). In the cases of
infectious diseases, qPCR can be carried out for nucleic acid sequences specific to
the pathogen, for example the Zaire Ebola virus nucleoprotein gene in Ebola
haemorrhagic fever (Liu et al., 2015). However, the diagnosis of cancer by qPCR can
be challenging as it requires a comparison of ‘self with self’ and not ‘self with other’
as with infectious diseases. In the case of cancer, there is rarely a gene expressed
solely in disease states that is not also expressed to some degree in normal tissue
and so research must be used to assess the threshold for increase or decrease in
expression which can be reliably correlated with malignancy. This would require
large, multifactorial studies into cancer expression profiles which take into account
all variables which may affect gene expression including cancer type, severity, age,
race, gender, diet and lifestyle (Wu et al., 2015; Samaan et al., 2015; Knappskog et
al., 2014; Saeed et al., 2015; Liedtke et al., 2015). Due to this, the potential for false
positives or false negatives in cancer diagnosis by gene expression is high. Some
genetic biomarkers of cancer have been established, and proof of principle cancer
diagnostics by qPCR have been demonstrated. For example Dong et al., identified
the ST13 (suppression of tumorigenicity 13) gene as being expressed in lesser
quantities in colorectal mucosal carcinoma tissue in comparison to normal adjacent
intestinal mucosa in 50 patients (Dong et al., 2005). Zhou et al., showed by qPCR
that the microRNAs (miRNAs) miR-652 and miR-660 were upregulated in non-small
cell lung cancer (NSCLC) in 300 patients (Zhou et al., 2015). Jia et al., also showed

50
the predictive value of miRNAs, specifically miR-21, miR-29a, miR-200a, miR-25 and
miR-486-5p, in 371 cervical cancer patients (Jia et al., 2015). Fan et al., showed that
the engulfment and cell motility 3 (ELMO3) gene is significantly upregulated in 125
non-small cell lung carcinoma (NSCLC) patients in comparison to unaffected
adjacent tissue and 89 control patients (Fan et al., 2015). However, none of these
studies is sufficiently extensive to be able to conclude that these changes could be
applied to general populations and therefore form the basis of a robust diagnostic
test.
Although a number of cancer biomarkers have been determined, limitations to
their use in PoCT exist. Consideration must be given to the source of sample for
testing by qPCR. Less invasive techniques such as blood extraction are preferable;
however, this requires that the biomarker is present in high enough quantity for
detection, if present at all, in the blood. In addition to this, haem compounds found
in blood inhibit the PCR reaction (Akane et al., 1994) which can contribute to false
negative results and eliminates whole blood from being a suitable candidate for
qPCR before processing. More invasive methods of sample collection, such as
tissue biopsy, preclude true PoCT as they require surgery.
In addition to diagnostic uses, qPCR testing can be used to assess clinically relevant
biomarkers for determining appropriate treatment approaches. Response to
certain therapeutic approaches can be highly diverse even within one cancer type
(Lalwani et al., 2011). Assessing a patient prior to treatment to establish the most
effective therapeutic path is an example of personalised medicine and would
represent a significant improvement to current methods. For example, melanoma
patients with Raf-1 proto-oncogene, serine/threonine kinase (RAF1), KRAS and
CCND1 gene copy number increases show an improved response to the addition of
Sorafenib therapy to Carboplatin and Paclitaxel treatment and low grade serous
ovarian cancer patients do not respond as well to conventional chemotherapies
(Carboplatin and Paclitaxel) as they do to alternative therapies such as Etoposide,
Doxorubicin and Topotecan (Wilson et al., 2015; Santillan et al., 2007).

51
Chapter 2
Methodology
2.1 Tissue Culture
2.1.1 Cell Lines
SKOV3 and MDAH-2774 cell lines were used as models for epithelial ovarian cancer.
SKOV3 human ovarian clear cell adenocarcinoma cells were purchased from ATCC
and were derived in 1973 from the ascites of a Caucasian female patient aged 64
years. MDAH-2774 cells were purchased from ATCC and are human ovarian
endometrioid adenocarcinoma derived. They were isolated from the ascites of an
untreated female patient in 1972. MDAH-2774 cells show a trend towards triploidy,
particularly trisomy of chromosomes 1, 2, 3, 6, 11, 12, 16 and X and monosomy of
chromosomes 17 and 21; the modal number of chromosomes being 66-68
(Freedman et al., 1978). Characteristics of both cell lines are summarised in Table
2.1.
SKOV3 and MDAH-2774 cells were grown in DMEM (Dulbecco’s Modified Eagle’s
Medium, Gibco) supplemented with 10% FBS (fetal bovine serum, Gibco), 1%
penicillin/streptomycin (Gibco) and 1% L-glutamine (Gibco). Both cell lines were
cultured at 37°C/5% carbon dioxide (CO2) and subcultured when approaching 80%
confluency, approximately three times a week.

52
Cell Line Origin Grade Key Gene Mutations Chemotherapeutic
Sensitivities
SKOV3 Ascites 1/2 TP53
PIK3CA
Docetaxel
Paclitaxel
Carboplatin
Doxorubicin
MDAH-2774 Ascites 2 TP53
PIK3CA
KRAS
BRCA1 (silent)
BRCA2 (silent)
Docetaxel
Paclitaxel
Oxaliplatin
Fluorouracil
Doxorubicin
Table 2.1 - Characteristics of two epithelial ovarian cancer cell lines, SKOV3 and
MDAH-2774. Table adapted from Beaufort et al., (Beaufort et al., 2014).
2.1.2 Tissue Culture Practice
An aseptic environment was maintained with the use of a HERAsafe laminar flow
cabinet (Heraeus), and generous and repeated applications of TriGene Advance
(Medimark Scientific) and 70% industrial methylated spirits (IMS) in dH2O to all
surfaces and equipment used. Where possible, commercial pre-packed and pre-
sterilised items were used. Plasticware was sterilised by autoclave.
2.1.3 Thawing Cryopreserved Cells
When growing cells up from stocks frozen in liquid nitrogen, 20mL of media was
first stored in a T-75 cell culture flask in the incubator for at least one hour to allow
the media to equilibrate to the temperature and CO2 conditions. After this period,
the cells were moved with speed from liquid nitrogen, defrosted in a water bath at
37°C and immediately transferred to the pre-warmed media which was then left
undisturbed in the incubator for 12 hours. At 12 hours the media was replaced
with fresh media that had been warmed to 37°C, removing the high concentration
of DMSO remaining from the freezing medium and replenishing the nutrients.

53
2.1.4 Subculturing Cells
Cells were subcultured at around 80% confluency by aspirating the media,
incubating with 2.5ml TrypLE™ Express (Invitrogen) per ~75c2 growth surface area
and manually disturbing the flask to detach adherent cells. The detached cells were
then suspended in 17.5mL of their appropriate media and 5mL transferred to each
of four new T-75 cell culture flasks already containing 15mL of media. All media
used in the subculturing process was first warmed to 37°C. MDAH-2774 and SKOV3
cell lines required a 1 in 4 split approximately three times per week.
2.1.5 Cryopreserving Cells
When no longer needed, stocks of each cell line were stored in liquid nitrogen. This
was achieved by aspirating the media and detaching the cells by incubating them
for two minutes with 2.5mL TrypLE™ Express (Invitrogen) per ~75cm2 surface area
and manually disturbing the flask to detach adherent cells. The cells were
resuspended in 4mL of media, the suspension moved to a 50mL centrifuge tube and
centrifuged for five minutes at 12,000 RPM to form a cell pellet. The supernatant
was removed and 0.5mL of FBS and 0.4mL of media was used to resuspended the
cells. The cell suspension with 100µl DMSO was added to a cryovial and cooled
slowly, first to -80°C in a Mr. Frosty freezing container (Nalgene) and then in liquid
nitrogen 24 hours later.
2.2 Cell treatments
2.2.1 Seeding Cells
Cells were seeded in 6-well plates (~10cm2 surface area per well) at a specific
seeding density (100,000 cells per well except for wound healing assays where cells
were cultured to a confluent monolayer) with 2mL of appropriate media. Cell
counts to determine seeding requirements were performed with a Countess®
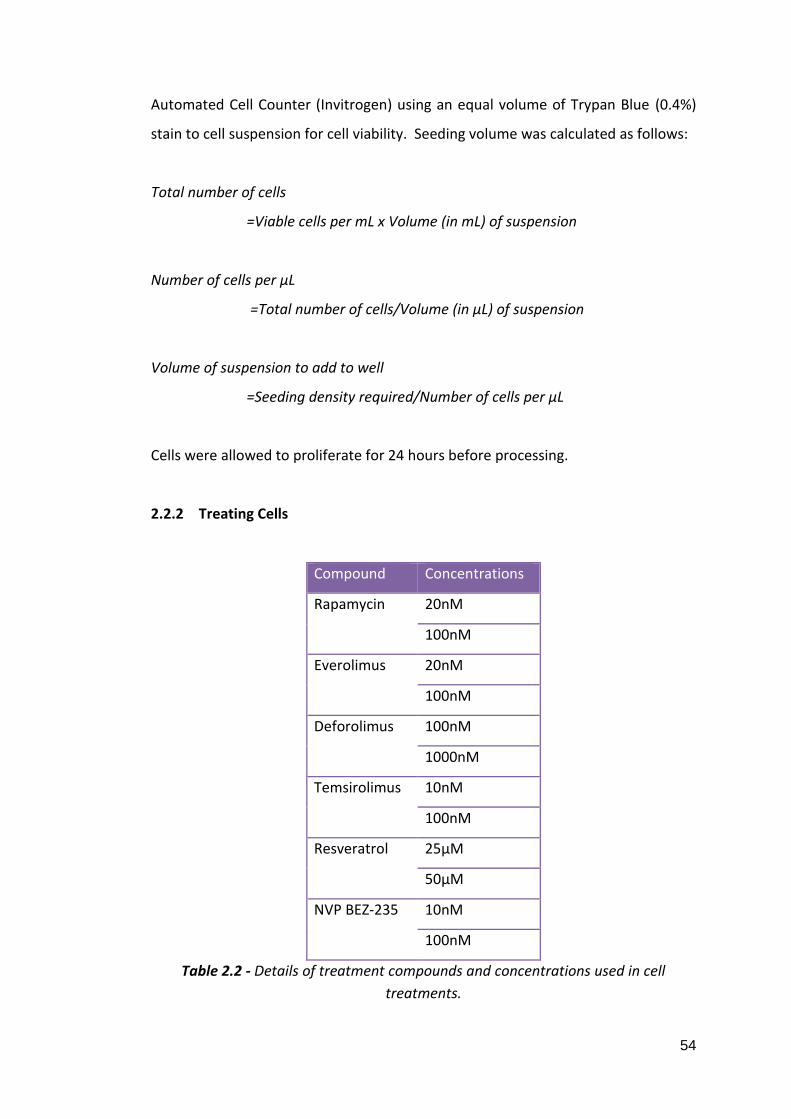
54
Automated Cell Counter (Invitrogen) using an equal volume of Trypan Blue (0.4%)
stain to cell suspension for cell viability. Seeding volume was calculated as follows:
Total number of cells
=Viable cells per mL x Volume (in mL) of suspension
Number of cells per µL
=Total number of cells/Volume (in µL) of suspension
Volume of suspension to add to well
=Seeding density required/Number of cells per µL
Cells were allowed to proliferate for 24 hours before processing.
2.2.2 Treating Cells
Compound Concentrations
Rapamycin 20nM
100nM
Everolimus 20nM
100nM
Deforolimus 100nM
1000nM
Temsirolimus 10nM
100nM
Resveratrol 25µM
50µM
NVP BEZ-235 10nM
100nM
Table 2.2 - Details of treatment compounds and concentrations used in cell
treatments.

55
Cells treatment compounds were dissolved in a dimethyl sulfoxide (DMSO) carrier.
As DMSO can be cytotoxic, dilutions were calculated such that equal amounts
(0.5%) of carrier were exposed to each well despite the concentration of the
treatment. Cells treated with only carrier were used as a control. Treatment
compounds were stored at -20℃. Cell treatments used are detailed in Table 2.2.
Treatments were first mixed into prewarmed media before being applied to the
cells to ensure full homogenisation and avoid cells experiencing toxically high
concentrations of carrier or inhibitor.
2.3 Proliferation Assay
Proliferation, death and viability of the cells were assessed after treatment using a
Countess® Automated Cell Counter (Invitrogen) and trypan blue stain. Media was
aspirated from the cells which were then incubated with 200μL of TrypLE™ Express
(Life Technologies) per well and manually agitated to detach the cells. The cells
were resuspended in 800μL of appropriate media to make 1mL of cell suspension in
total. An equal volume of cell suspension was mixed thoroughly with trypan blue
stain (0.4%, trypan blue is selectively absorbed by dead cells) and applied to a
Countess® cell counting chamber slide (Invitrogen). Three readings were taken per
sample and an average value calculated.
2.4 Wound Healing Assay
Cells were assessed for their ability to close a created gap in cell growth area. One
confluent T-75 cell culture flask was seeded per three 6-well plates with 2mL
appropriate media per well and grown until there was a confluent monolayer. A
20µL pipette tip was used create a ‘scratch’ in growth area perpendicular to a line
drawn on the underside of the well in marker pen. The media was then aspirated
and replaced with treated media. The scratch was then monitored and an image
taken after 0, 6, 12 and 18 hours. The perpendicular line of marker was used as a
landmark to ensure that an image of the same area was taken at each time point.

56
2.5 Clinical Samples
2.5.1 Fresh Ovarian Tissues
Ovarian clinical tissue samples from patients with ovarian cancer, endometrial
cancer, endometriosis and fibroids as well as unaffected controls were obtained
from the University of Thessanoliki, Greece (ethical approval obtained by the local
hospital authority and by Brunel University ethics committee, Table 2.3). Samples
were shipped on dry ice in RNAlater® (Life Technologies) to preserve RNA integrity.
Pathology Total Age ⩽30 Age >30 Unknown Age
Control 34 12 9 13
Endometriosis Total Grade score <50 Grade Score
>50
Unknown grade
score
24 12 9 3
Age ⩽30 Age >30 Unknown age
12 9 3
Ovarian Cancer 13
Fibroids 4
Endometrial
Cancer
4
Table 2.3 - Table detailing clinical sample details including pathology and, where
available, stage and grade of disease and age of patient at time of surgery.
2.5.2 Paraffin Embedded Ovarian Tissues
Clinical tissue arrays containing paraffin embedded ovarian samples from 20 or 70
malignancies were purchased from US Biomax (Tables 2.4 and 2.5 respectively).
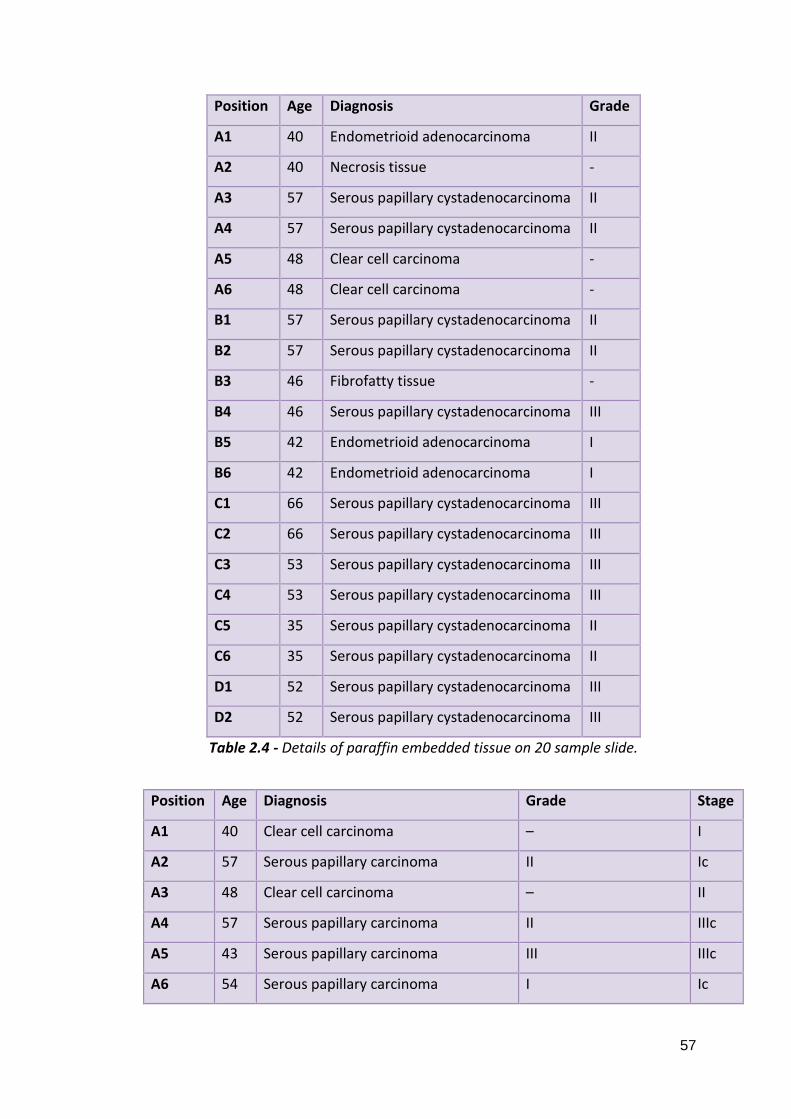
57
Position Age Diagnosis Grade
A1 40 Endometrioid adenocarcinoma II
A2 40 Necrosis tissue -
A3 57 Serous papillary cystadenocarcinoma II
A4 57 Serous papillary cystadenocarcinoma II
A5 48 Clear cell carcinoma -
A6 48 Clear cell carcinoma -
B1 57 Serous papillary cystadenocarcinoma II
B2 57 Serous papillary cystadenocarcinoma II
B3 46 Fibrofatty tissue -
B4 46 Serous papillary cystadenocarcinoma III
B5 42 Endometrioid adenocarcinoma I
B6 42 Endometrioid adenocarcinoma I
C1 66 Serous papillary cystadenocarcinoma III
C2 66 Serous papillary cystadenocarcinoma III
C3 53 Serous papillary cystadenocarcinoma III
C4 53 Serous papillary cystadenocarcinoma III
C5 35 Serous papillary cystadenocarcinoma II
C6 35 Serous papillary cystadenocarcinoma II
D1 52 Serous papillary cystadenocarcinoma III
D2 52 Serous papillary cystadenocarcinoma III
Table 2.4 - Details of paraffin embedded tissue on 20 sample slide.
Position Age Diagnosis Grade Stage
A1 40 Clear cell carcinoma – I
A2 57 Serous papillary carcinoma II Ic
A3 48 Clear cell carcinoma – II
A4 57 Serous papillary carcinoma II IIIc
A5 43 Serous papillary carcinoma III IIIc
A6 54 Serous papillary carcinoma I Ic

58
A7 63 Serous papillary carcinoma III IV
A8 46 Serous papillary carcinoma III IIIc
A9 54 Serous papillary carcinoma III IIIc
A10 56 Hyperplastic fibrous tissue – –
B1 44 Granular cell tumor – –
B2 49 Serous papillary carcinoma III II
B3 18 Immature teratoma – –
B4 15 Endodermal sinus carcinoma – IIa
B5 38 Metastatic adenocarcinoma III –
B6 39 Serous papillary carcinoma III IV
B7 24 Endodermal sinus carcinoma – II
B8 42 Serous papillary carcinoma III II
B9 50 Serous papillary carcinoma III I
B10 49 Serous papillary carcinoma III IIIc
C1 62 Serous papillary carcinoma III II
C2 53 Mucinous papillary carcinoma I IV
C3 38 Metastatic adenocarcinoma III –
C4 43 Clear cell carcinoma – Ia
C5 26 Serous papillary carcinoma I Ic
C6 47 Serous papillary carcinoma I I
C7 62 Squamous cell carcinoma III I
C8 35 Dysgerminoma – Ia
C9 41 Dysgerminoma – I
C10 47 Serous papillary carcinoma III I
D1 42 Clear cell carcinoma – Ic
D2 39 Metastatic adenocarcinoma I –
D3 66 Metastatic adenocarcinoma III –
D4 48 Malignant follicular theca cytoma – III
D5 51 Serous papillary carcinoma I IIIc
D6 33 Metastatic signet-ring cell carcinoma –
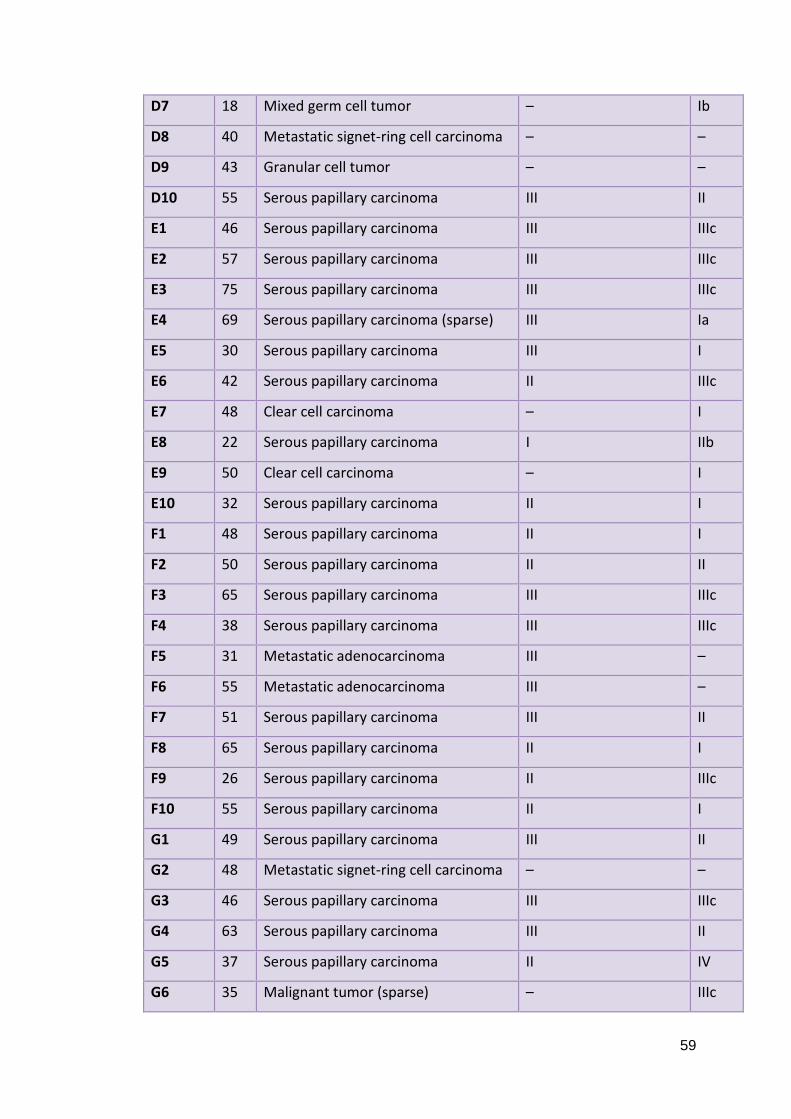
59
D7 18 Mixed germ cell tumor – Ib
D8 40 Metastatic signet-ring cell carcinoma – –
D9 43 Granular cell tumor – –
D10 55 Serous papillary carcinoma III II
E1 46 Serous papillary carcinoma III IIIc
E2 57 Serous papillary carcinoma III IIIc
E3 75 Serous papillary carcinoma III IIIc
E4 69 Serous papillary carcinoma (sparse) III Ia
E5 30 Serous papillary carcinoma III I
E6 42 Serous papillary carcinoma II IIIc
E7 48 Clear cell carcinoma – I
E8 22 Serous papillary carcinoma I IIb
E9 50 Clear cell carcinoma – I
E10 32 Serous papillary carcinoma II I
F1 48 Serous papillary carcinoma II I
F2 50 Serous papillary carcinoma II II
F3 65 Serous papillary carcinoma III IIIc
F4 38 Serous papillary carcinoma III IIIc
F5 31 Metastatic adenocarcinoma III –
F6 55 Metastatic adenocarcinoma III –
F7 51 Serous papillary carcinoma III II
F8 65 Serous papillary carcinoma II I
F9 26 Serous papillary carcinoma II IIIc
F10 55 Serous papillary carcinoma II I
G1 49 Serous papillary carcinoma III II
G2 48 Metastatic signet-ring cell carcinoma – –
G3 46 Serous papillary carcinoma III IIIc
G4 63 Serous papillary carcinoma III II
G5 37 Serous papillary carcinoma II IV
G6 35 Malignant tumor (sparse) – IIIc

60
G7 12 Dysgerminoma – Ib
G8 55 Serous papillary carcinoma II I
G9 20 Malignant tumor cell (sparse) – I
G10 55 Serous papillary carcinoma II I
Table 2.5 - Details of paraffin embedded tissue on 70 sample slide.
2.5.3 Whole Blood
Whole blood from 7 ovarian cancer patients and 6 unaffected controls were
obtained from the Department of Obstetrics and Gynaecology at University
Hospital, University of Crete, Greece (ethical approval obtained by the local hospital
authority and by Brunel University ethics committee). Samples were extracted into
EDTA vacuum tubes and shipped on dry ice.
2.6 RNA Extraction
mRNA was extracted from cells to examine gene expression transcripts. All surfaces
and equipment were cleaned thoroughly with 70% IMS before and throughout any
RNA work. RNA was stored at -80°C when not in use and kept on ice at all other
times to prevent degradation.
2.6.1 From Cultured Cells
2.6.1.1 GenElute™ (Sigma Aldrich)
GenElute™ Mammalian Total RNA MiniPrep Kit is a commercially available silica
membrane, spin column based RNA extraction system. Media was removed from
the cells, collected in pre-labelled sample tubes and stored at -80°C for later use.
The cells were briefly washed in phosphate buffered saline (PBS, Gibco) and 250μL
of lysis buffer per 10cm2 cell growth area containing 1% β-mercaptoethanol per
well was applied directly to the cells to lyse cell membranes and inactivate RNases.

61
The plate was then gently rocked to ensure all cells were covered and incubated at
room temperature for 60 seconds to ensure complete cell lysis. The bottom of each
well was scraped with a pipette tip and the lysate was transferred into a blue
filtration column contained within a collection tube and centrifuged for 2 minutes
at 12,000 x g to remove cellular debris and shear DNA. The filtered lysate was then
mixed with 250μL of 70% ethanol to enhance binding of nucleic acids to the silica
membrane and loaded into a red silica column contained within a collection tube.
*The column was centrifuged for 15 seconds at 12,000 x g; the flow-through was
discarded as the RNA was now bound to the membrane. The RNA was washed
three times, once with Wash Solution I and twice with Wash Solution II (supplied in
kit) by centrifuging for 15 seconds at 12,000 x g to remove impurities including
proteins, cellular debris and salts. A final centrifugation of 12,000 x g for 2 minutes
was carried out to ensure that the ethanol was completely removed from the
membrane. RNA was eluted by placing the membrane column in a fresh collection
tube, applying 50μL of pure water (elution solution) to the membrane and
centrifuging at 12,000 x g for 60 seconds. RNA was stored at -80°C until further use.
2.6.1.2 NucleoSpin® (Macherey-Nagel)
NucleoSpin® RNA/Protein is a commercially available silica membrane, spin column
based dual RNA and protein extraction system. Media was removed from the cells,
collected in pre-labelled sample tubes and stored at -80°C for later use. The cells
were briefly washed in PBS (Gibco) and lysis buffer (350µl per 10cm2 of cells) was
added directly to the adherent cells to lyse cell membranes and inactivate RNases.
The bottom of each well was scraped with a pipette tip and the lysates were
collected in sample tubes and stored on ice before processing. Each tube was
vortexed for at least ten seconds to ensure complete lysis of the cells. Each lysate
was passed through a clearing membrane to reduce viscosity and remove cellular
debris. 350µl of 70% ethanol was added to each of the lysates to enhance the RNA
binding efficiency to the silica membrane. The lysates were then passed through a
silica membrane by centrifugation for 30 seconds at 11,000 x g. The protein, now

62
contained within the flow through, was stored at +4°C for later processing. Salt was
removed from the membrane and bound RNA with 350µl Membrane Desalting
Buffer (centrifuged for one minute at 11,000 x g) to enhance the subsequent
rDNase digest where 95µl of rDNase reaction mixture was incubated on the silica
membrane for 15 minutes at room temperature to remove any DNA. The rDNase
was inactivated and residual protein, salts and contaminants removed by one wash
with 200µl of Buffer RA2 (centrifuged for 30 seconds at 11,000 x g), one wash with
600µl of Buffer RA3 (centrifuge for 30 seconds at 11,000 x g) and one wash with
250µl of Buffer RA3 (centrifuge for 2 minutes at 11,000 x g). The membrane bound
RNA was rehydrated and eluted with 60µl of RNase-free water and stored at -80°C
until further use.
2.6.2 From Tissue Samples (from GenElute™ kit by Sigma Aldrich, above)
Tissue samples were removed from RNAlater® (Life Technologies) and 40mg of
tissue was placed in a sterile 2mL sample tube with 500μL of lysis buffer containing
1% β-Mercaptoethanol and a 2mm ball bearing. The tissue was then homogenised,
membranes lysed and RNases inactivated with a TissueLyser II (Qiagen) tissue lyser
for 2 minutes. The homogenised tissue was transferred into a blue filtration
column contained within a collection tube and centrifuged for 2 minutes at 12,000 x
g to remove cellular debris and shear DNA. The filtered lysate was then mixed with
500μL of 70% ethanol to enhance binding of nucleic acids to the silica membrane
and loaded into a red silica column contained within a collection tube. GenElute™
protocol was then continued as above from *.
2.6.3 From Whole Blood
RNA was extracted from whole blood using the QIAamp® RNA Blood Mini Kit
(Qiagen). 1mL of whole blood was mixed with 1mL of Buffer EL and incubated on
ice for 15 minutes to lyse erythrocytes. Samples were centrifuged for 10 minutes at
400 x g to form a cell pellet and the supernatant was discarded. 2mL of Buffer EL

63
was vortexed with the pellet which was centrifuged for a further 10 minutes at 400
x g to ensure complete removal of erthythrocytes and supernatant was discarded.
600μL of Buffer RLT was added to the pellet and vortexed to remove clumps. The
cell mixture was then transferred to a QIAshredder spin column and centrifuged for
2 minutes at 13,000 x g to lyse cells and remove debris. 600μL of 70% ethanol was
mixed into the lysate to enhance RNA binding efficiency and was then transferred
into a QIAamp® spin column. The QIAamp® spin column was centrifuged for 15
seconds at 8000 x g to bind RNA to the silica membrane. Flow through was
discarded and the spin column was transferred to a fresh collection tube. The
membrane was washed in 700μL Buffer RW1 followed by 500μL of Buffer RPE by
centrifuging for 15 seconds at 8000 x g. A further wash in 500μL of Buffer RPE was
followed by centrifugation for 3 minutes at 20,000 x g to dry the membrane before
RNA elution. The QIAamp® spin column was transferred to a fresh collection tube
and 30μL of RNase-free water was applied directly to the membrane. Samples
were centrifuged for 1 minute at 8000 x g and eluted RNA was stored at -80°C until
further processing.
2.6.4 RNA Quantification
1μL of extracted RNA per sample was analysed spectrophotometrically for
concentration and purity using a NanoDrop 2000C (Thermo Fisher Scientific).
Concentration was calculated from absorbance at 280nm and purity was calculated
by A260/A280 ratio with an acceptable range of 1.7-2.0.
2.7 cDNA Synthesis
Complementary DNA (cDNA) was synthesised from extracted RNA for use in qPCR
experiments. All surfaces and equipment were cleaned thoroughly with 70% IMS
before and throughout cDNA synthesis work. Random primers were chosen over
oligo-dT in order to avoid 3’ poly-A tail weighting. RNA volume input was calculated
by the following:

64
RNA input
=desired cDNA concentration/RNA concentration (ng/µL)
2.7.1 SuperScript® II (Life Technologies)
RNA input was calculated and the appropriate amount, made up to 10μL with pure
H2O, was mixed in one 0.6mL, thin walled sample tube for each sample. 2μL of
primer/dNTP mix (Table 2.6) was added each tube which was then heated to 65°C
for 5 minutes in a heat block to denature RNA secondary structure. Samples were
cooled on ice immediately after incubation to stop the reaction.
Reagent Volume per sample
Random Hexamer Primers (3μg/μL) 1μL
dNTPs (10mM) 1μL
Table 2.6 - Reagent volumes for primer/dNTP mix for one sample for use in
the SuperScript® II Reverse Transcriptase cDNA synthesis kit (Life
Technologies)
Each tube was briefly centrifuged to collect contents. 7μL of First Strand Buffer mix
(Table 2.7) was added to each sample to maintain appropriate pH and incubated at
room temperature for 2 minutes before 1μL Superscript® II enzyme was added.
The samples were then incubated at room temperature for 10 minutes to anneal
the primers, 42°C for 50 minutes to extend the synthesis and 70°C for 10 minutes to
inactivate the enzyme. cDNA was stored at -20°C until further processing.
Reagent Volume per sample
First Strand Buffer 4μL
0.1M DTT 2μL
Pure H2O 1μL
Table 2.7 - Reagent volumes for First Strand Buffer mix for one sample for use in the
SuperScript® II Reverse Transcriptase cDNA synthesis kit (Life Technologies).

65
2.7.2 nanoScript™ 2 (Primerdesign)
RNA input was calculated and the appropriate amount, made up to 9μL with pure
H2O, was mixed in one 0.6mL, thin walled sample tube for each sample. 1μL of
random nonamer primers were added to each sample which were then incubated
at 65°C for 5 minutes to denature RNA secondary structure. The samples were
cooled on ice and 10μL of extension buffer (Table 2.8) was added to each sample.
Reagent Volume per sample
nanoScript™ 2 4X Buffer 5μL
dNTP mix (10nM) 1μL
Pure H2O 3μL
nanoScript™ 2 enzyme 1μL
Table 2.8 - Reagent volumes for extension buffer for one sample for use in the
nanoScript™ 2 Reverse Transcription kit (Primerdesign).
Tubes were vortexed and briefly centrifuged to collect reagents. The samples were
incubated at room temperature for five minutes to allow primer annealing, 42°C for
20 minutes to extend the reaction and 75°C for 10 minutes to inactivate the
reaction. cDNA was stored at -20°C until further processing.
2.8 Protein Extraction
Protein was extracted from cultured cells in 6-well plates in order to examine
expression patterns of phosphorylated p70S6 kinase, caspase 3 and caspase 9.
2.8.1 Laemmli Buffer
Media was aspirated and cells were washed briefly in PBS (Gibco). 100μL of
Laemmli buffer (Table 2.9) was added per 10cm2 cell growth area and the plate
gently rocked to cover all cells. Cells were scraped with a pipette tip and lysate was

66
transferred into a sterile 1.5mL sample tube. Lysates were denatured by boiling for
10 minutes at 95°C in a heat block before storage at -20°C until further use.
Reagent Volume
Tris (pH 6.8) 1mL
10% SDS 4mL
Glycerol 2mL
β-mercaptoethanol 0.5mL
dH2O 2.5mL
Bromophenol blue Small amount to achieve desired colour to aid visualisation
Table 2.9 – Volume of components of 10mL Laemmli buffer.
2.9 Reference Gene Assessment
Gene Name Gene
ACTB* Actin, beta (mRNA)
GAPDH* Glyceraldehyde-3-phosphate dehydrogenase (mRNA)
UBC* Ubiquitin C (mRNA)
B2M* Beta-2-microglobulin (mRNA)
YWHAZ* Phospholipase A2 (mRNA)
RPL13A* Ribosomal protein L13A (mRNA)
18S 18S RNA (rRNA)
CYC1 Cytochrome C-1 (mRNA)
EIF4A2 Eukaryotic translation initiation factor 4A isoform 2 (mRNA)
SDHA Succinate dehydrogenase complex (mRNA)
TOP1 Topoisomerase (DNA) 1 (mRNA)
ATP5B ATP synthase subunit (mRNA)
Table 2.10 – Clinical samples were assessed for the most stably expressed reference
gene using the geNorm™ human 12 gene kit from Primerdesign. The above table
details the 12 genes included in the kit. Genes included in the 6 gene kit are denoted
with an asterisk.

67
According to MIQE guidelines (minimum information for the publication of qPCR
experiments), an assessment of the most appropriate reference genes specific to
the samples used must be carried out prior to any qPCR experiment. In light of this,
a selection of samples representing the whole cohort in each experiment were
assessed using the either the geNorm™ human 12 gene kit or geNorm™ human 6
gene kit (Primerdesign). The genes assessed are detailed in Table 2.10.
2.9.1 geNorm™ with PrecisionPLUS™ Mastermix (Primerdesign)
geNorm™ experiments were prepared in a qPCR exclusive area and all equipment
used was sterilised using TriGene Advance (Medimark Scientific) and 70% IMS
(industrial methylated spirits) initially and repeatedly throughout the preparation.
All reagents were defrosted and stored on ice when in use to preserve their
integrity and SYBR® Green containing reagents were kept in a light proof bag
whenever possible. geNorm™ experiments were carried out on a 7900HT Fast
thermal cycler (Life Technologies). PrecisionPLUS™ Mastermix by Primerdesign was
used for geNorm™ experiments as per manufacturer’s instructions. PrecisionPlus™
Mastermix is pre-prepared master mix containing a hot start Taq polymerase
enzyme, SYBR® Green I dye and deoxynucleoside triphosphates (dNTPs). Primers in
the geNorm™ kit were supplied lyophilised and so tubes were briefly centrifuged to
collect dry components at the bottom of the tubes which were then rehydrated
with 220μL of pure H2O. Forward and reverse primers were contained within the
same tube. Samples were run in duplicate and so small mixes were made up for
each primer for (n x 2)+1 containing the following (Table 2.11):

68
Reagent Volume (μL) for n=1
Primer Mixture 1
PrecisionPLUS™ Mastermix 10
Pure H2O 4
cDNA (5ng/μL) 5
Total 20
Table 2.11 - Volume of components for primer mixes in geNorm™ experiment.
cDNAs for representative samples were diluted to be 5ng/μL. 15μL of the primer
mix was pipetted into each well (two reactions for each sample) of a MicroAmp®
Fast Optical 96-Well Reaction Plate (Life Technologies) followed by 5μL of
appropriate cDNA. The wells were sealed hermetically with a transparent, contact
adhesive sealing film and the plate centrifuged to ensure all the reagents had
collected. The reagents were then subject to the following thermal protocol (Table
2.12):
Temperature Time Cycles
95°C 2 minutes 1
95°C 15 seconds 40
60°C 60 seconds
Fluorescence Measurement -
Dissociation Curve 60-95°C 1
Table 2.12 - The thermal protocol of a geNorm™ experiment on a 7900HT Fast
thermal cycler (Life Technologies).
Following the amplification protocol, the dissociation temperature of the PCR
products generated were assessed by a dissociation protocol. In this protocol the
temperature was increased by 1°C from 60-95°C and a fluorescence measurement
taken at each increase. The differential fluorescence was plotted against the
temperature (°C) to determine the temperature at which the product strands
dissociated.

69
2.9.2 geNorm™ Analysis
geNorm™ was analysed using qBase+ software (Biogazelle). qPCR data was
uploaded and qBase+ calculated an M and V value for expressional stability and
optimum number of reference genes to use respectively.
2.10 qPCR
qPCR (quantitative polymerase chain reaction) was used to assess relative gene
expression in a number of different experiments. qPCR experiments were prepared
in an exclusive area and all equipment used was sterilised using TriGene Advance
(Medimark Scientific) and 70% IMS (industrial methylated spirits) initially and
repeatedly throughout the preparation. All reagents were defrosted and stored on
ice when in use to preserve their integrity and SYBR® Green containing reagents
were kept in a light proof bag whenever possible.
2.10.1 Primers
The primer sequences for mTOR, DEPTOR, rictor, raptor and 18S RNA were taken
from Foster et al., (Foster et al., 2010). Primer Design does not disclose the
sequence of the primers used in their geNorm™ kit. As it is a MIQE requirement to
publish primer sequences, alternative primers were designed for the selected
reference genes, YWHAZ and RPL13A, using the OligoPerfect™ Designer (Life
Technologies), keeping the Tm and product size (base pairs, bp) as similar as
possible to the Primer Design primers. Below is a summary of the primers (Table
2.13):

70
Name Amplicon
Size (bps)
Strand Size
(bases)
Sequence (5’-3’)
mTOR 135 Forward 20 t g c c a a c t a c c t t c g g a a c c
Reverse 20 g c t c g c t t c a c c t c a a a t t c
DEPTOR 202 Forward 20 c a c c a t g t g t g t g a t g a g c a
Reverse 20 t g a a g g t g c g c t c a t a c t t g
Rictor 117 Forward 20 g g a a g c c t g t t g a t g g t g a t
Reverse 20 g g c a g c c t g t t t t a t g g t g t
Raptor 170 Forward 20 a c t g a t g g a g t c c g a a a t g c
Reverse 20 t c a t c c g a t c c t t c a t c c t c
YWHAZ 127 Forward 20 a g a c g g a a g g t g c t g a g a a a
Reverse 20 g a a g c a t t g g g g a t c a a g a a
RPL13A 144 Forward 20 c c t g g t c t g a g c c c a a t a a a
Reverse 20 c t t g c t c c c a g c t t c c t a t g
18S RNA 155 Forward 20 a a a c g g c t a c c a c a t c c a a g
Reverse 20 c c t c c a a t g g a t c c t c g t t a
Table 2.13 - The primer sequences for the mTOR, Deptor, Rictor and Raptor, YWHAZ
and RPL13A genes. mTOR, DEPTOR, rictor, raptor and 18S RNA were taken from
Foster et al., (Foster et al., 2010). YWHAZ and RPL13A primers were designed by
Oligo Perfect Designer (Invitrogen). All primers were synthesised by Sigma-Aldrich.
None of the primers used showed evidence of primer dimer formation.
Primers were supplied lyophilised and so were briefly centrifuged to collect dry
components at the bottom of the tubes. Primers were then rehydrated according
to manufacturer’s direction.
2.10.2 Gel Electrophoresis
Primers were validated by running PCR products on a 2% agarose gel. 2g of agarose
(Fisher Scientific) was added to 100mL of 1 X tris borate EDTA (TBE, 89mM Tris-
borate, 2mM EDTA, pH 8.3) buffer and microwaved for 2 minutes or until the
agarose has dissolved and the mixture was clear. The mixture was cooled to

71
approximately 50°C and 5μL ethidium bromide was added and mixed well. The gel
was poured into a prepared casting tray on a level surface and a 20 well comb
inserted at one end. The gel was left to set for approximately 25 minutes and
transferred into a tank containing 1 X TBE buffer. 2μL of DNA loading buffer was
added to 20μL qPCR product and mixed well to aid loading and visualisation of
migration through the gel. 15μL of this mixture was added to each well. In a
separate well 5μL of 1kb Plus DNA Ladder™ (Life Technologies) was added as a
measure of product size. The gel was run at 100V and 400mA for approximately 45
minutes until the product had migrated a satisfactory distance. The gel was
visualised using a Gel Doc™ XR+ Imaging System (Bio-Rad) and analysed visually for
consistency of product size to predicted product size and the presence of extra
products which may represent contamination or primer dimers.
2.10.3 Power SYBR® Master Mix (Life Technologies)
Power SYBR® Master Mix (Life Technologies) was used with a 7900HT Fast thermal
cycler (Life Technologies). Power SYBR® Master Mix is pre-prepared master mix
containing AmpliTaq Gold DNA Polymerase, SYBR® Green I dye and dNTPs (with a
blend of dUTP and dTTP). Reactions were formulated as follows (Table 2.14):
Reagent Volume (μL) for n=1
Power SYBR® Master Mix (2x) 10
Pure H2O 7
Forward Primer (10μM) 1
Reverse Primer (10μM) 1
cDNA (100ng/μL) 1
Total 20
Table 2.14 - Volume of components for primer mixes in qPCR experiment with
Power SYBR® Master Mix (Life Technologies).

72
A different mix was prepared for each primer set. 19µL of the appropriate mix and
1µL of cDNA was dispensed into a MicroAmp® Fast Optical 96-Well Reaction Plate
(Life Technologies) according to a pre-designed well plan. NTCs (non-template
controls), where water was substituted for cDNA, were included for each of the
primer mixes as a negative control. According to MIQE guidelines and geNorm™
analysis completed previously, 2 reference genes, RPL13A and YWHAZ, were
expressionally stable and thus were included as an endogenous controls. The wells
were sealed hermetically with a transparent, contact adhesive sealing film and the
plate centrifuged to ensure all the reagents had collected. The sample plate was
subjected to a temperature protocol consisting of the following (Table 2.15):
Step Temperature Time Cycles
Hot Start 95°C 10 minutes 1
Amplification 95°C 15 seconds 40
60°C 60 seconds
Fluorescence Measurement 60°C -
Dissociation Curve 60-95°C 1 1
Table 2.15 - The thermal protocol of a qPCR experiment using Power SYBR® Master
Mix on a 7900HT Fast thermal cycler (both Life Technologies).
Following the amplification protocol, the dissociation temperature of the PCR
products generated were assessed by a dissociation protocol as described above.
2.10.4 Kapa SYBR® Fast Universal Master Mix (Kapa Biosystems)
Kapa SYBR® Fast Universal Master Mix (Kapa Biosystems) was used with an xxpress®
thermal cycler (BJS Biotechnologies). Kapa SYBR® Fast Universal Master Mix is pre-
prepared master mix containing a DNA Polymerase, SYBR® Green I dye and dNTPs.
Reactions were formulated as follows (Table 2.16):

73
Reagent Volume (μL) for n=1
Kapa SYBR® Fast Universal Master Mix (2x) 2
Forward Primer (2.5μM) 1
Reverse Primer (2.5μM) 1
cDNA (25ng/μL) 1
Total 5
Table 2.16 - Volume of components for primer mixes in qPCR experiment with Kapa
SYBR® Fast Master Mix (Kapa Biosystems).
A different mix was prepared for each primer and cDNA set. 5µL of the appropriate
mix was dispensed into a 96-Well xxplate™ (BJS Biotechnologies) according to a pre-
designed well plan. NTCs (non-template controls), where water was substituted for
cDNA, were included for each of the primer mixes as a negative control. The wells
were sealed hermetically with a transparent, heat adhesive sealing film using an
xxsealer (BJS Biotechnologies). The sample plate was subjected to a temperature
protocol consisting of the following (Table 2.17):
Step Temperature Time Cycles
Hot Start 95°C 3 minutes 1
Amplification 95°C 15 seconds 40
60°C 60 seconds
Fluorescence Measurement 60°C -
Dissociation Curve 50-95°C - 1
Table 2.17 - The thermal protocol of a qPCR experiment using Kapa SYBR® Master
Mix (Kapa Biosystems) on an xxpress® thermal cycler (BJS Biotechnologies).
Following the amplification protocol, the dissociation temperature of the PCR
products generated were assessed by a dissociation protocol as shown in Table
2.17.

74
2.10.5 qPCR Analysis
Amplicon load can be measured in two ways, by absolute or relative quantification.
Absolute quantification measures amplification in relation to a known standard to
provide an absolute copy number. Relative quantification measures amplification
in relation to a reference gene or genes which are stably expressed under the
conditions of the experiment (for example after treatment of cultured cells with a
drug compound). The most common way to analyse relative quantification qPCR
data is the Δ or ΔΔCq method detailed below:
ΔCq
=Cq (gene of interest) - Cq (reference gene)
(Normalises GOI expression to the reference gene)
ΔΔCq
=ΔCq (sample) - ΔCq (calibrator)
(Normalises GOI expression in a sample to that of a calibrator, for example
untreated cells)
For ΔCq method: RQ = 2-ΔCq
For ΔΔCq method: RQ = 2-ΔΔCq
(Inverts value to show change whilst assuming 100% efficiency)
The ΔΔCq method demonstrates fold change in expression in comparison to a
calibrator and is only appropriate when a valid calibrator is available; for example in
the case of cultured cells treated with a drug compound the calibrator would be the
same cells under basal conditions. In the case of gene expression in clinical
samples, unless each sample is matched to non-affected adjacent tissue and the
assumption is made that the tissue is ‘normal’, it is not acceptable to match the ΔCq
value from one patient to that of a different patient as natural individual
differences will mean that gene expression will differ from person to person. If this

75
is the case, the ΔCq method can be used to provide a comparison between samples
and calibrators.
2.11 Western Blotting
Protein expression of caspases 3 and 9 and phosphorylated p70S6 kinase in cell
lysates was analysed by western blot. Proteins were separated by mass by SDS-
PAGE (sodium dodecyl sulphate polyacrylamide gel electrophoresis). A 12%
resolving and 5% stacking gel were used and were prepared as follows (Table 2.18):
Reagent Resolving Gel (mL) Stacking Gel (mL)
dH2O 1.6 3.4
30% Acrylamide/Bisacrylamide (Sigma-
Aldrich)
2 0.83
1.5M Tris (pH 8.8) 1.3 N/A
1M Tris (pH 6.8) N/A 0.63
10% SDS (sodium dodecyl sulphate) 0.05 0.05
10% Ammonium Persulphate (APS) in
dH2O
0.05 0.05
TEMED (tetramethylethylenediamine) 0.002 0.005
Total 5 5
Table 2.18 - Formulations of resolving and stacking gels.
The gels were poured at a thickness of 1mm between glass plates according to the
recipes in Table 2.18. Resolving gel was topped with 100% methanol to level and
allowed to set for 20-30 minutes at room temperature. Once the resolving gel had
set the methanol was poured away, the gel was washed with distilled H2O and
excess water removed with filter paper. The stacking gel was poured on top of the
resolving gel at an approximate height of 2cm, and a comb placed between the
glass plates to form wells. The stacking gel was left to set for a further 20-30
minutes at room temperature.

76
Cell lysates were incubated at 95-100°C for at least 10 minutes to linearise the
protein, break down disulphide bonds and remove tertiary structure. SDS in the
protein buffer and gel serves to coat the protein in a consistent negative charge to
avoid the varying charges on amino acids to affect migration of the protein through
the gel. 10μl of each sample was loaded into each well according to a predesigned
well plan. 5μl of PageRuler™ Prestained Protein Ladder (Life Technologies) was used
as a reference of mass. The gels were run in 1X Running Buffer (Table 2.19) at 100V
and 40mA per gel until the visible blue band of Laemmli buffer was close to the
bottom of the gel and the ladder was fully separated out. When the samples move
through the stacking gel they are concentrated between a chloride and glycine
front and so enter the resolving gel simultaneously. The proteins are then able to
separate based on their mass by their differential rate of movement through the
resolving gel.
Reagent Quantity
Tris Base 30g
Glycine 44g
10% SDS 100mL
dH2O Up to 1L
Table 2.19 - Formulation of 10X Running Buffer.
The separated proteins were then electrophoretically transferred onto a
nitrocellulose membrane (Thermo Scientific) in Wet-Transfer Buffer (Table 2.20).
The transfer apparatus were assembled while immersed in Wet-Transfer Buffer to
avoid the gel and membrane drying out. The membrane and gel were sandwiched
between sponges and filter paper and placed in a cassette before being placed in a
tank of Wet-Transfer buffer and run at 100V and 300mA for 2 hours.

77
Reagent Quantity
Tris Base 2.41g
Glycine 11.25g
dH2O Up to 800mL
Methanol 200mL
Table 2.20 - Formulation of 1X Wet-Transfer Buffer.
After successful transfer the protein ladder was visible on the nitrocellulose
membrane. The membrane was then rinsed briefly in 1X TBS Tween (Tables 2.21
and 2.22) and incubated in 50mL of 5% cow’s milk (Marvel milk powder in TBS
Tween) for one hour at room temperature on a shaker.
Reagent Quantity
Tris Base 24.2g
NaCl 80g
dH2O Up to 1L
Table 2.21 - Formulation of 10X TBS.
Reagent Quantity
10X TBS 100mL
dH2O 899mL
Tween 20 1mL
Table 2.22 - Formulation of 1X TBS Tween.
After blocking, the membrane was washed four times for ten minutes each in TBS
Tween to remove any unbound milk proteins. A primary antibody (Table 2.23)
diluted in 5% bovine serum albumin/TBS Tween was applied to the membrane and
incubated overnight at 4°C on a shaker. The membrane was then washed a further
four times for ten minutes each in TBS Tween to remove any unbound primary
antibody. The secondary antibody (Table 2.23) was diluted in 5% bovine serum

78
albumin/TBS Tween and incubated with the membrane for one hour at room
temperature.
After a further four ten minute washes in TBS Tween to remove any unbound
secondary antibody, the membrane was stored in TBS Tween while reagents are
prepared for visualisation of the proteins by enhanced chemiluminescence (ECL).
Development of the membranes was carried out in a dark room so as not to spoil
the light-sensitive x-ray films. Solution A and B were prepared (Table 2.24)
beforehand, mixed and applied to the drained membranes in the dark room. The
membranes were incubated for five minutes, blotted on filter paper and exposed to
x-ray film within a light impermeable cassette for a range of times (usually 30
seconds to 5 minutes). The films were developed on a Curix60 (AGFA) automatic
developing machine.

80
Primary Antibody Dilution Species Molecular
Weight (kDa)
Supplier Secondary Antibody Dilution Supplier
Anti-Caspase 3 (full length and
large cleaved fragment)
1:1000 Rabbit 17, 19 & 35 Cell Signaling Anti-rabbit, HRP-conjugated 1:2000 Sigma
Anti-Caspase 9 (full length and
large cleaved fragment)
1:1000 Rabbit 35, 37 & 47 Cell Signaling Anti-rabbit, HRP-conjugated 1:2000 Sigma
Phosphorylated p70S6 kinase
(Thr 389)
1:750 Rabbit 70 Cell Signaling Anti-rabbit, HRP-conjugated 1:2000 Sigma
GAPDH 1:1000 Rabbit 37 Cell Signaling Anti-rabbit, HRP-conjugated 1:2000 Sigma
Table 2.23 - Details of antibodies used in western blotting experiments
Solution A Solution B
Reagent Quantity Reagent Quantity
100mM TRIS (pH 8) 5mL 100mM TRIS (pH 8) 5mL
Luminol 50μL Hydrogen Peroxide (30%) 3μL
Coumaric Acid 22μL
Table 2.24 - Formulation of solutions A and B for enhanced chemiluminescence.

81
2.11.1 Western Blot Analysis
Western blots for caspase 9 were analysed densitometrically using ImageJ software
(National Institutes of Health). Optical density (OD) of the bands representing total
and cleaved fragment caspase 9 was measured and a ratio calculated by dividing
the cleaved fragment OD by the total OD.
2.12 ImageStream
Protein expression and localisation was investigated using ImageStream (Amnis)
high resolution flow cytometry. Expression and cellular location of mTOR, DEPTOR,
rictor and raptor was assessed using ImageStream™ (Amnis) imaging flow
cytometry.
2.12.1 Fixing Cells
Cells were cultured in T-75 tissue culture flasks until 80-90% confluent. Media was
aspirated and the cells were washed briefly in PBS (Gibco). The cells were
incubated with 2.5mL of TrypLE™ Express (Invitrogen) per ~75c2 growth surface
area and the flask was manually disturbed to detach adherent cells which were
resuspended in 2.5mL of prewarmed PBS (Gibco). Cell suspension was transferred
into a 50mL centrifuge tube and centrifuged for 5 minutes at 1200 RPM to form a
pellet. Supernatant was removed and cells were resuspended in 5mL of
prewarmed PBS (Gibco) a further two times to remove debris. The pellet was then
resuspended in 1mL of prewarmed PBS (Gibco), transferred to a 1.5mL
microcentrifuge tube and centrifuged for 5 minutes at 1200 RPM. The supernatant
was removed and the cells were resuspended and incubated in 4%
paraformaldehyde (PFA, Sigma) for 7 minutes to crosslink proteins in the cells. The
sell suspension was centrifuged for 2 minutes at 3600 RPM and the PFA removed.
The cells were washed in prewarmed PBS a further three times, centrifuging for 2
minutes at 3600 RPM between each wash. The cells were then resuspended in ice-
cold methanol-acetone (1:1) and stored at -20°C until further use.

82
2.12.2 Staining Cells
The cells were incubated in blocking buffer (5% bovine serum in PBS) for 30 minutes
with gentle agitation. Cells were centrifuged for 3 minutes at 2000 RPM and the
blocking buffer was removed. The cells were then incubated in the appropriate
primary antibody (Table 2.25) diluted in blocking buffer overnight at 4°C with gentle
agitation. Following primary antibody incubation, cells were centrifuged for 3
minutes at 2000 RPM and the antibody removed. The cells were resuspended in
PBS (Gibco) to remove any remaining antibody and centrifuged again for 3 minutes
at 2000 RPM. From this step onwards the cell were protected from light as the
fluorphore conjugated to the secondary antibody is light sensitive. The PBS was
removed and the cells incubated in secondary antibody (Table 2.25) diluted in
blocking buffer for 30 minutes with gentle agitation. After secondary antibody
incubation the cells were centrifuged for 3 minutes at 2000 RPM and the secondary
antibody removed. The cells were resuspended in PBS (Gibco) to remove any
remaining antibody and and centrifuged for 3 minutes at 2000 RPM. PBS was
removed and the cells were resuspended in 100μL Accumax (Innovative Cell
Technologies) to dissociate any cellular aggregates. 1μL of Draq5 nuclear stain was
added before visualisation on ImageStream.

82
Primary
Antibody
Dilution Species Supplier Secondary Antibody Dilution Supplier
Anti-mTOR 1:200 Rabbit Cell Signaling Anti-rabbit, alexafluor conjugated 1:1000 Molecular Probes
Anti-DEPTOR 1:200 Rabbit Cell Signaling Anti-rabbit, alexafluor conjugated 1:1000 Molecular Probes
Anti-Rictor 1:200 Mouse AbCam Anti-mouse, alexafluor conjugated 1:1000 Molecular Probes
Anti-Raptor 1:200 Rabbit Cell Signaling Anti-rabbit, alexafluor conjugated 1:1000 Molecular Probes
Table 2.25 - Details of antibodies used in ImageStream experiments.

83
2.13 Immunohistochemistry
Immunohistochemistry and DAB (3,3’-Diaminobenzidine) staining was used to
visualise mTOR, DEPTOR, rictor, raptor and phosphorylated p70S6 kinase protein
expression in paraffin embedded ovarian cancer tissue samples. Tissue was
deparaffinised and rehydrated by incubation in Histo-Clear (National Diagnostics)
and decreasing concentrations of ethanol as follows (Table 2.26):
Solution Time
Histoclear 3 x 5 minutes
Histoclear:ethanol (1:1) 3 minutes
100% ethanol 3 minutes
95% ethanol 3 minutes
70% ethanol 3 minutes
50% ethanol 3 minutes
Running tap water 3 minutes
Table 2.26 - Incubations to deparaffinise and rehydrate paraffin embedded tissue
samples.
Antigen retrieval was achieved by boiling slides in sodium citrate (pH6, Table 2.27)
for 20 minutes. Additional sodium citrate was added every 5 minutes to avoid the
slides boiling dry.
Reagent Volume
Sodium citrate 2.94g
dH2O 1L
Tween 20 500μL
Table 2.27 - Formulation of antigen retrieval solution.
The slides were then washed in running tap water for 10 minutes and TBS 0.025%
Triton X 2 times for 5 minutes to remove sodium citrate. Endogenous hydrogen

84
peroxidase activity was blocked by incubation with 0.3% hydrogen peroxide for 30
minutes. The slides were then washed in TBS 0.025% Triton X 3 times for 5 minutes
each on a shaker. A humidity chamber was created by placing dH2O soaked tissue
in a tray and covering with cling film; slides were placed in the humidity chamber
for subsequent incubations to avoid evaporation. The tissue was blocked in 1%
donkey serum in TBS for 1 hour at room temperature by dispensing 200μL onto the
tissue area of the slide and using a small square of parafilm to ensure the blocking
buffer spreads over the tissue. Blocking buffer was carefully removed from the
slides with tissue and the primary antibody (diluted blocking buffer) was applied to
to tissue in the same way as the blocking buffer and incubated over two nights at
4°C. After primary antibody incubation, the slides were washed 3 times for 5
minutes each time in TBS 0.025% Triton X on a shaker to remove any unbound
primary antibody. The tissue was then incubated in horseradish peroxidase (HRP)
conjugated secondary antibody (diluted in blocking buffer) at room temperature for
1 hour in the same way as blocking buffer. The slides were then washed 3 times for
5 minutes in TBS 0.025% Triton X on a shaker to remove any unbound secondary
antibody. DAB solution (VectorLabs) was prepared in 5mL dH2O as follows: 2 drops
of buffer stock solution, 4 drops of DAB stock solution, 2 drops of hydrogen
peroxide solution. 200μL of DAB solution was applied to the tissue and incubated
at room temperature for 2-10 minutes until a brown colour develops. DAB solution
was washed off the slide by incubation in dH2O for 5 minutes on a shaker.
Haematoxylin (Fisher Scientific) was used to stain nuclei blue to provide contrast to
the brown DAB staining. The tissue was incubated in haematoxylin for 1 minute
and rinsed off with running tap water followed by incubation in 0.1% sodium
bicarbonate for 1 minute and a second wash in running tap water. Tissue was
dehydrated prior to coverslip mounting as follows (Table 2.28):

85
Solution Time
50% ethanol 3 minutes
70% ethanol 3 minutes
95% ethanol 3 minutes
100% ethanol 3 minutes
Histoclear:ethanol (1:1) 3 minutes
Histoclear 3 minutes
Table 2.28 - Incubations to dehydrate stained tissue samples.
Coverslips were mounted with di-N-butyl phthalate in xylene (DPX) to protect the
tissue. DPX was dried overnight at 4°C before observation.
2.14 Statistical Analysis
Changes observed in experiments were assessed for statistical significance using
the Student’s t-test. An assessment for homoscedasticity of data from each
category was made using the F-test. If homoscedasticity was proven, an unpaired,
two-tailed Student’s t-test was performed to assess significance in all cases as no
matched pairs of samples were used. If data were not homoscedastic, an unpaired,
two-tailed Student’s t-test with Welch’s correction was performed to account for
variance. All statistical tests were performed using GraphPad Prism® Software
(GraphPad Software). p values were denoted on graphs as follows (Table 2.29):
p value Denotation
0.01-0.05 *
0.001-0.009 **
<0.0009 ***
Table 2.29 - The asterisk denotations of p values on graphs.

86
Chapter 3
mTOR, DEPTOR, rictor and raptor expression in
ovarian cancer models and in response to mTOR
pathway inhibition
3.1 Introduction
SKOV3 (clear cell adenocarcinoma) and MDAH-2774 (endometrioid
adenocarcinoma) human adherent epithelial cell lines were used as in vitro models
of human ovarian cancer. SKOV3 cells were obtained from the ascites of a 64 year
old caucasian female patient in 1973 and are hypodiploid, containing a number of
chromosome derivatives and deletions (ATCC, 2014). They are designated as grade
1-2 for well to moderately differentiated cells (CRUK, 2014a; Beaufort et al., 2014).
SKOV3 cells are p53 null and show mutation in the PIK3CA gene for the catalytic
subunit of PI3 kinase but are wildtype for PTEN, BRCA1, BRCA2 and KRAS and
sensitive to Docetaxel, Paclitaxel, Carboplatin and Doxorubicin (Mabuchi, Deborah
A. Altomare, et al., 2007; Beaufort et al., 2014). MDAH-2774 cells were obtained
from the ascites of a female patient of unknown age in 1972 and shows triploidy of
many chromosomes and monosomy of chromosomes 17 and 21 (AddexBio, 2015;
Beaufort et al., 2014). They are designated as grade 2 for moderately differentiated
cells. MDAH-2774 cells show mutations in TP53, PIK3CA, KRAS and silent mutations
in BRCA1 and BRCA2. They are sensitive to the effects of Docetaxel, Paclitaxel,
Oxaliplatin, Fluorouracil and Doxorubicin (Beaufort et al., 2014).
Rapamycin (Rap, C51H79NO13) was first discovered in 1975 from a soil sample taken
from Rapa Nui (Easter Island) and was originally shown to be an anti-fungal agent
produced by streptomyces hygroscopicus (Vézina et al., 1975; Sehgal et al., 1975).
It was not until 1994 that interacting partners of Rap were found. Rapamycin and
FK-506 Binding Protein 12 (FKBP12) were found to interact with one another and,
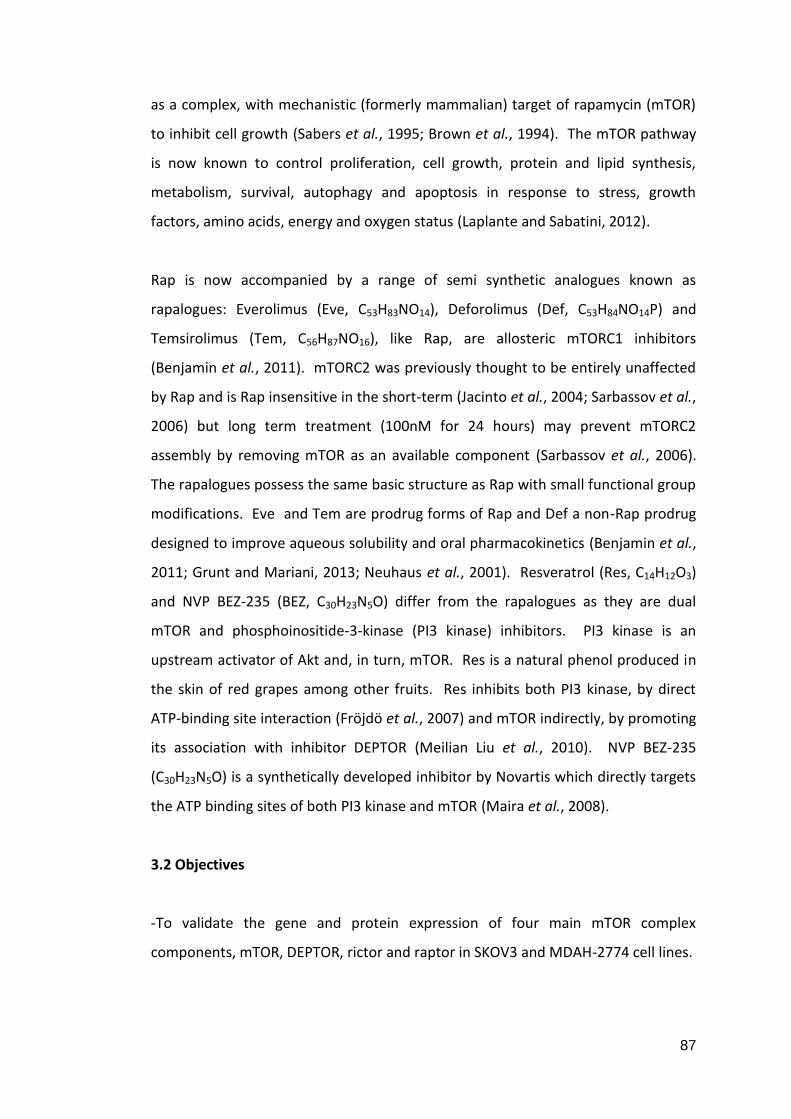
87
as a complex, with mechanistic (formerly mammalian) target of rapamycin (mTOR)
to inhibit cell growth (Sabers et al., 1995; Brown et al., 1994). The mTOR pathway
is now known to control proliferation, cell growth, protein and lipid synthesis,
metabolism, survival, autophagy and apoptosis in response to stress, growth
factors, amino acids, energy and oxygen status (Laplante and Sabatini, 2012).
Rap is now accompanied by a range of semi synthetic analogues known as
rapalogues: Everolimus (Eve, C53H83NO14), Deforolimus (Def, C53H84NO14P) and
Temsirolimus (Tem, C56H87NO16), like Rap, are allosteric mTORC1 inhibitors
(Benjamin et al., 2011). mTORC2 was previously thought to be entirely unaffected
by Rap and is Rap insensitive in the short-term (Jacinto et al., 2004; Sarbassov et al.,
2006) but long term treatment (100nM for 24 hours) may prevent mTORC2
assembly by removing mTOR as an available component (Sarbassov et al., 2006).
The rapalogues possess the same basic structure as Rap with small functional group
modifications. Eve and Tem are prodrug forms of Rap and Def a non-Rap prodrug
designed to improve aqueous solubility and oral pharmacokinetics (Benjamin et al.,
2011; Grunt and Mariani, 2013; Neuhaus et al., 2001). Resveratrol (Res, C14H12O3)
and NVP BEZ-235 (BEZ, C30H23N5O) differ from the rapalogues as they are dual
mTOR and phosphoinositide-3-kinase (PI3 kinase) inhibitors. PI3 kinase is an
upstream activator of Akt and, in turn, mTOR. Res is a natural phenol produced in
the skin of red grapes among other fruits. Res inhibits both PI3 kinase, by direct
ATP-binding site interaction (Fröjdö et al., 2007) and mTOR indirectly, by promoting
its association with inhibitor DEPTOR (Meilian Liu et al., 2010). NVP BEZ-235
(C30H23N5O) is a synthetically developed inhibitor by Novartis which directly targets
the ATP binding sites of both PI3 kinase and mTOR (Maira et al., 2008).
3.2 Objectives
-To validate the gene and protein expression of four main mTOR complex
components, mTOR, DEPTOR, rictor and raptor in SKOV3 and MDAH-2774 cell lines.

88
-To map the gene expression of mTOR signalling components mTOR, DEPTOR, rictor
and raptor in cell treated with mTOR pathway inhibitors and untreated controls.
3.3 Results
3.3.1 Confirmation of mTOR pathway component expression in SKOV3 and
MDAH-2774 ovarian cancer cell lines
We first sought to confirm the expression of four main mTOR pathway components
at gene and protein level in two ovarian cancer cell lines. qPCR experiments were
carried out to assess gene expression of mTOR, DEPTOR, rictor and raptor in SKOV3
and MDAH-2774 cells grown under basal conditions. Cells were seeded in 6-well
plates at a density of 100,000 per well (~10cm2 growth area). RNA was purified at
48 and 72 hours with the NucleoSpin® RNA/Protein extraction kit and cDNA
synthesised using the nanoScript™ 2 Reverse Transcription kit (Primerdesign) as
previously described (Sections 2.6.1.2 and 2.7.2). qPCR on cDNA was performed as
previously described on an xxpress® (BJS Biotechnologies) thermal cycler using Kapa
SYBR® Fast Master Mix (Kapa Biosystems) (Section 2.10.4) using primers for mTOR,
Deptor, Rictor, Raptor and reference gene YWHAZ. Biological and technical
triplicates were performed for each condition.
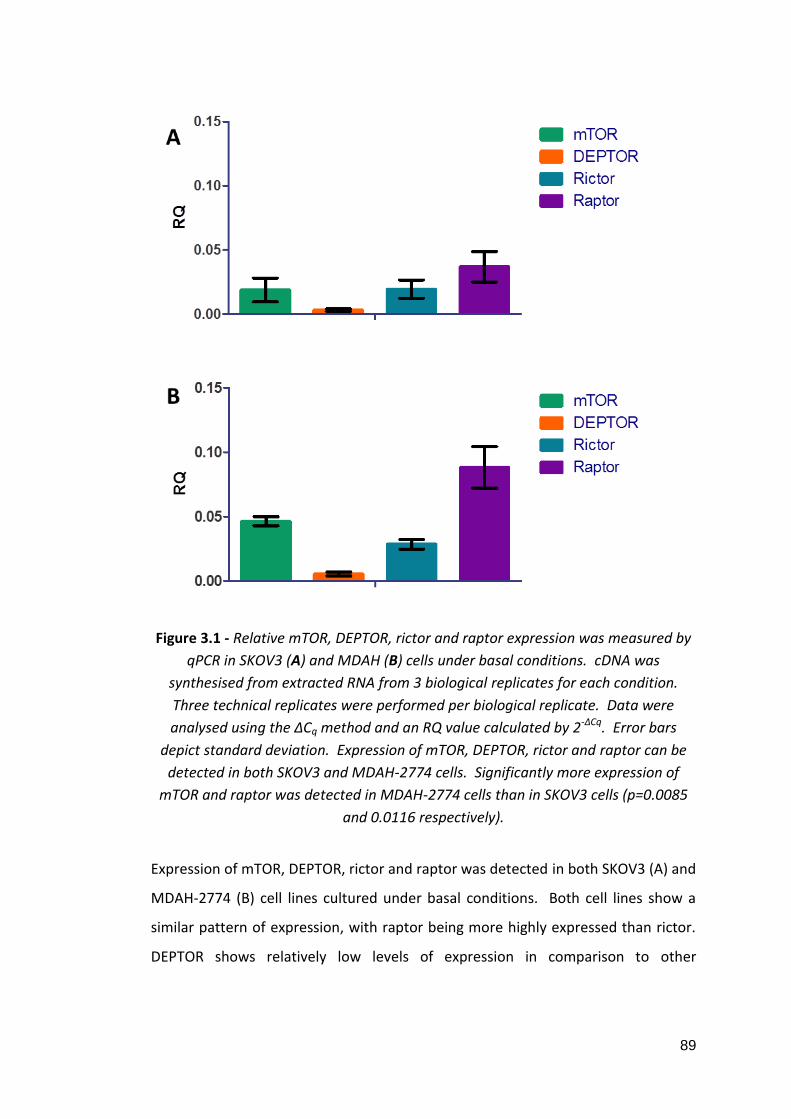
89
Figure 3.1 - Relative mTOR, DEPTOR, rictor and raptor expression was measured by
qPCR in SKOV3 (A) and MDAH (B) cells under basal conditions. cDNA was
synthesised from extracted RNA from 3 biological replicates for each condition.
Three technical replicates were performed per biological replicate. Data were
analysed using the ΔCq method and an RQ value calculated by 2-ΔCq. Error bars
depict standard deviation. Expression of mTOR, DEPTOR, rictor and raptor can be
detected in both SKOV3 and MDAH-2774 cells. Significantly more expression of
mTOR and raptor was detected in MDAH-2774 cells than in SKOV3 cells (p=0.0085
and 0.0116 respectively).
Expression of mTOR, DEPTOR, rictor and raptor was detected in both SKOV3 (A) and
MDAH-2774 (B) cell lines cultured under basal conditions. Both cell lines show a
similar pattern of expression, with raptor being more highly expressed than rictor.
DEPTOR shows relatively low levels of expression in comparison to other
90
components. The MDAH-2774 cell line showed higher relative expression of mTOR
and raptor than the SKOV3 cell line (p=0.0085 and 0.0116 respectively).
ImageStream flow cytometry was used to confirm protein expression of mTOR,
DEPTOR, rictor and raptor in SKOV3 and MDAH-2774 cell lines. Cells were grown
under basal conditions and fixed with 4% PFA before being stained with primary
antibodies for mTOR, DEPTOR, rictor or raptor and a secondary alexafluor 488
conjugated antibody. Nuclei were stained using Draq5 (described in 2.12).
Figure 3.2 - Images of individual SKOV3 and MDAH-2774 cells after mTOR, DEPTOR,
rictor and raptor in brightfield, with alexafluor (protein of interest) and Draq5
(nuclei) staining. Images show that mTOR, DEPTOR, rictor and raptor are present in
the cytoplasm of SKOV3 and MDAH-2774 cells.
Staining for mTOR, DEPTOR, rictor and raptor was detected in both SKOV3 and
MDAH-2774 cells confirming that protein expression of these components is
present at basal levels in both cell lines (Figure 3.2).
3.3.2 Gene Expression of mTOR pathway components and mTOR pathway
inhibition
We next sought to investigate the effects of mTOR pathway inhibition on the gene
expression of mTOR, DEPTOR, rictor and raptor in SKOV3 and MDAH-2774 cells.
The effect of mTOR pathway inhibition was investigated using 6 different inhibitory

91
agents: Rap, Eve, Def, Tem, Res and BEZ. mTOR inhibitors were applied in
concentrations and for times proven to be effective in the literature (Table 3.1).
Böhm et al., showed a decrease in cell viability of primary acute myeloid leukaemia
cells after treatment with 20 and 100nM Rap, Eve and Tem (Böhm et al., 2009).
Squillace et al., treated a range of metastatic sarcoma and endometrial carcinoma
cell lines with up to 1000nM Def and demonstrated decreased proliferation as a
result (Squillace et al., 2011). Resveratrol treatment was shown to be effective at
inhibiting proliferation in medullary thyroid cancer cell lines at 50μM by Truong et
al., (Truong et al., 2011). To the best of our knowledge, no in vitro experiments
using BEZ were published at the time this study was devised and so we chose 10
and 100nM as initial exploratory concentrations.
Inhibitor MoA Concentrations Times (hours)
Rap Allosteric mTOR inhibitor. 20nM 100nM 48 72
Eve 20nM 100nM
Def 100nM 1000nM
Tem 10nM 100nM
Res Dual mTOR (via DEPTOR) & PI3
kinase (via ATP binding site)
inhibitor.
25μM 50μM
BEZ Dual mTOR and PI3 kinase
inhibitor via ATP binding sites of
both.
10nM 100nM
Table 3.1 - Details of the mTOR pathway inhibitory agent used in this study.
Inhibitor concentrations were chosen to reflect the range of which other studies had
found effective. Treatments were conducted for 48 and 72 hours.
qPCR experiments were performed in order to map the gene expression of mTOR,
DEPTOR, rictor and raptor in treated and control SKOV3 and MDAH-2774 cells.
Cells were seeded in 6-well plates at a density of 100,000 per well (~10cm2 growth
area) and allowed to proliferate for 24 hours before treatment with Rap (20 and
100nM), Eve (20 and 100nM), Def (100 and 1000nM), Tem (10 and 100nM), Res (25

92
and 50), BEZ (10 and 100nM) or carrier (DMSO) (Section 2.2). RNA was purified at
48 and 72 hours after treatment with the NucleoSpin® RNA/Protein extraction kit
and cDNA synthesised using the nanoScript™ 2 Reverse Transcription kit
(Primerdesign) as previously described (Sections 2.6.1.2 and 2.7.2). qPCR on cDNA
from treated and control cells was performed as previously described on an
xxpress® (BJS Biotechnologies) thermal cycler using Kapa SYBR® Fast Master Mix
(Kapa Biosystems) (Section 2.10.4). Primers for mTOR, Deptor, rictor, raptor and
reference gene YWHAZ were used. Biological and technical triplicates were
performed for each condition. Analysis was performed using the ΔCq method as
described previously (Section 2.10.5).

93
3.3.2.1 mTOR Expression in SKOV3 Cells
Figure 3.3 - Relative mTOR expression was measured by qPCR in SKOV3 cells treated
with Rap (20 and 100nM), Eve (20 and 100nM), Def (100 and 1000nM) and carrier
(DMSO) only control for 48 and 72 hours. cDNA was synthesised from extracted
RNA from 3 biological replicates for each condition. Three technical replicates were
performed per biological replicate. Data were analysed using the ΔCq method and
an RQ value calculated by 2-ΔCq. An F-test was performed to assess variance
between groups and two-tailed, unpaired Student’s t-tests with Welch’s correction
for unequal variance were performed to assess significance. Error bars depict
standard deviation and asterisks denote significance. Results show no change in
expression resulting from Rap or Eve treatment (A and B respectively). An increase
was detected after 72 hours treatment with 100nM Def (C, p=0.0301).

94
Figure 3.4 - Relative mTOR expression was measured by qPCR in SKOV3 cells treated
with Tem (10nM and 100nM), Res (25 and 50μM), BEZ (10 and 100nM) and carrier
(DMSO) only control for 48 and 72 hours. cDNA was synthesised from extracted
RNA from 3 biological replicates for each condition. Three technical replicates were
performed per biological replicate. Data were analysed using the ΔCq method and
an RQ value calculated by 2-ΔCq. An F-test was performed to assess variance
between groups and two-tailed, unpaired Student’s t-tests with Welch’s correction
for unequal variance were performed to assess significance. Error bars depict
standard deviation and asterisks denote significance. Results show no change in
expression resulting from Tem or BEZ treatment (A and C respectively). An increase
was detected after 72 hours treatment with 25μM Res (B, p=0.0107).

95
3.3.2.2 mTOR Expression in MDAH-2774 Cells
Figure 3.5 - Relative mTOR expression was measured by qPCR in MDAH-2774 cells
treated with Rap (20 and 100nM), Eve (20 and 100nM), Def (100 and 1000nM) and
carrier (DMSO) only control for 48 and 72 hours. cDNA was synthesised from
extracted RNA from 3 biological replicates for each condition. Three technical
replicates were performed per biological replicate. Data were analysed using the
ΔCq method and an RQ value calculated by 2-ΔCq. An F-test was performed to assess
variance between groups and two-tailed, unpaired Student’s t-tests with Welch’s
correction for unequal variance were performed to assess significance. Error bars
depict standard deviation and asterisks denote significance. Results show no
change in expression resulting from Rap or Eve (A and B respectively). 100nM
treatment with Def induced an increase after 48 hours (C, p=0.0251).

96
Figure 3.6 - Relative mTOR expression was measured by qPCR in MDAH-2774 cells
treated with Tem (10nM and 100nM), Res (25 and 50μM), BEZ (10 and 100nM) and
carrier (DMSO) only control for 48 and 72 hours. cDNA was synthesised from
extracted RNA from 3 biological replicates for each condition. Three technical
replicates were performed per biological replicate. Data were analysed using the
ΔCq method and an RQ value calculated by 2-ΔCq. An F-test was performed to assess
variance between groups and two-tailed, unpaired Student’s t-tests with Welch’s
correction for unequal variance were performed to assess significance. Error bars
depict standard deviation and asterisks denote significance. Results show no
change in expression resulting from BEZ treatment (C). 100nM Tem treatment
induced an increase in mTOR expression after 72 hours (A, p=0.0366). 50μM Res
treatment showed an increase after 48 hours (B, p=0.0017).
97
mTOR expression was generally unchanged in SKOV3 and MDAH-2774 cells. There
was no change in SKOV3 cells at 48 or 72 hours induced by Rap, Eve, Tem, or BEZ at
low or high concentrations (Figure 3.3, A and B, Figure 3.4 A and C). A significant
increase was detected after treatment with 100nM Def after 72 hours (Figure 3.3,
C, p=0.0301) and 72 hours after 25μM Res treatments in comparison to controls
(Figure 3.4, B, p=0.0107). MDAH-2774 cells showed no change in mTOR expression
at 48 and 72 hours after treatment with Rap, Eve or BEZ at high or low
concentration (Figure 3.5, A and B, Figure 3.6, C). A significant increase was
detected in mTOR expression in MDAH-2774 cells after 100nM Def treatment at 48
hours in comparison to controls (Figure 3.5, C, p=0.0251). A significant increase in
mTOR expression was detected after 100nM Tem treatment at 72 hours (Figure 3.6,
A, p=0.0366) and after 50μM Res treatment at 48 hours (Figure 3.6, B, p=0.0017) in
comparison to controls.

98
3.3.2.3 DEPTOR Expression in SKOV3 Cells
Figure 3.7 - Relative DEPTOR expression was measured by qPCR in SKOV3 cells
treated with Rap (20 and 100nM), Eve (20 and 100nM), Def (100 and 1000nM) and
carrier (DMSO) only control for 48 and 72 hours. cDNA was synthesised from
extracted RNA from 3 biological replicates for each condition. Three technical
replicates were performed per biological replicate. Data were analysed using the
ΔCq method and an RQ value calculated by 2-ΔCq. An F-test was performed to assess
variance between groups and two-tailed, unpaired Student’s t-tests with Welch’s
correction for unequal variance were performed to assess significance. Error bars
depict standard deviation and asterisks denote significance. No change in
expression was detected as a result of Rap, Eve or Def treatment (A, B and C
respectively).

99
Figure 3.8 - Relative DEPTOR expression was measured by qPCR in SKOV3 cells
treated with Tem (10nM and 100nM), Res (25 and 50μM), BEZ (10 and 100nM) and
carrier (DMSO) only control for 48 and 72 hours. cDNA was synthesised from
extracted RNA from 3 biological replicates for each condition. Three technical
replicates were performed per biological replicate. Data were analysed using the
ΔCq method and an RQ value calculated by 2-ΔCq. An F-test was performed to assess
variance between groups and two-tailed, unpaired Student’s t-tests with Welch’s
correction for unequal variance were performed to assess significance. Error bars
depict standard deviation and asterisks denote significance. A decrease was
detected in DEPTOR expression after 48 hour 10nM Tem treatment (A, p=0.0463).
25μM Res treatment induced an increase in DEPTOR expression at 48 hours but a
decrease in DEPTOR expression at 72 hours (B, p=0.0203 and 0.0493 respectively).
50μM Res treatment induced a decrease in DEPTOR expression at 72 hours (B,
p=0.0173). An increase in DEPTOR expression was detected after 48 hour treatment
with 100nM BEZ (C, p=0.003).

100
3.3.2.4 DEPTOR Expression in MDAH-2774 Cells
Figure 3.9 - Relative DEPTOR expression was measured by qPCR in MDAH-2774 cells
treated with Rap (20 and 100nM), Eve (20 and 100nM), Def (100 and 1000nM) and
carrier (DMSO) only control for 48 and 72 hours. cDNA was synthesised from
extracted RNA from 3 biological replicates for each condition. Three technical
replicates were performed per biological replicate. Data were analysed using the
ΔCq method and an RQ value calculated by 2-ΔCq. An F-test was performed to assess
variance between groups and two-tailed, unpaired Student’s t-tests with Welch’s
correction for unequal variance were performed to assess significance. Error bars
depict standard deviation and asterisks denote significance. An increase in DEPTOR
expression was detected after 48 and 72 hour treatment with 20nM Rap (A,
p=0.0125 and 0.0189 respectively). 100nM Eve treatment induced an increase in
DEPTOR expression after 48 hours (B, p=0.0175) and 20nM Eve treatment induced
an increase in DEPTOR expression after 48 and 72 hours (B, p=0.0114 and 0.004
respectively). 1000nM Def treatment resulted in an increase in DEPTOR at 48 and
72 hours (C, p=0.0184 and 0.0021 respectively). 100nM treatment with Def also
induced a DEPTOR increase after 48 hours (C, p=0.0018).

101
Figure 3.10 - Relative DEPTOR expression was measured by qPCR in MDAH-2774
cells treated with Tem (10nM and 100nM), Res (25 and 50μM), BEZ (10 and 100nM)
and carrier (DMSO) only control for 48 and 72 hours. cDNA was synthesised from
extracted RNA from 3 biological replicates for each condition. Three technical
replicates were performed per biological replicate. Data were analysed using the
ΔCq method and an RQ value calculated by 2-ΔCq. An F-test was performed to assess
variance between groups and two-tailed, unpaired Student’s t-tests with Welch’s
correction for unequal variance were performed to assess significance. Error bars
depict standard deviation and asterisks denote significance. 100nM Tem treatment
induced an increase in DEPTOR expression after 48 and 72 hours (A, p=0.0377 and
0.0026 respectively). 10nM Tem treatment induced an increase in DEPTOR after 48
hours (A, p=0.0043). 25μM treatment with Res induced an increase in DEPTOR
expression at 48 and 72 hours (B, p=0.0001 and 0.0007 respectively) and 50μM
treatment with Res induced an increase in DEPTOR expression after 48 and 72 hours
(B, p=0.0449 and 0.0007 respectively). 100nM BEZ treatment resulted in an
increase in DEPTOR expression after 48 and 72 hours (C, p=0.0072 and 0.0266
respectively) and 10nM BEZ treatment also induced an increase at 48 hours (C,
p=0.0146).

102
DEPTOR was generally increased in response to mTOR pathway inhibition
particularly in MDAH-2774 cells. SKOV3 cells showed no change in DEPTOR
expression at 48 and 72 hours after Rap, Eve and Def treatment at high or low
concentrations (Figure 3.7, A, B and C). A significant decrease was detected in
SKOV3 cells at 48 hours after 10nM Tem treatment in comparison to controls but
no other change was detected as a result of Tem treatment (Figure 3.8, A,
p=0.0463). A significant increase in DEPTOR expression was detected in SKOV3 cells
at 48 hours after 25μM Res treatment in comparison to controls (Figure 3.8, B,
p=0.0203). At 72 hours after treatment, Res induced a dose dependent decrease in
DEPTOR expression in comparison to controls (Figure 3.8, B, p=0.0493 [25μM] and
p=0.0173 [50μM]). BEZ treatment induced an increase in DEPTOR expression at 48
hours after 100nM BEZ treatment (Figure 3.8, C, p=0.0030) in comparison to
controls. MDAH-2774 cells showed an increase in DEPTOR expression induced by
all inhibitors in comparison to controls. 20nM Rap treatment induced a significant
increase in DEPTOR expression after 48 and 72 hours (Figure 3.9, A, p=0.0125 and
0.0189 respectively). 20nM Eve treatment induced an increase in DEPTOR after 48
and 72 hours in comparison to controls (Figure 3.9, B, p=0.0114 and 0.004
respectively). 100nM Eve treatment induced an increase in DEPTOR after 72 hours
in comparison to controls (Figure 3.9, B, p=0.0175). Def treatment induced an
increase in DEPTOR expression after 48 hours treatment at 100nM (Figure 3.9, C,
p=0.0018) and after 48 and 72 hours treatment at 1000nM (Figure 3.9, C, p=0.0184
and 0.0021 respectively). 10nM Tem treatment induced an increase in DEPTOR
expression after 48 hours in comparison to controls (Figure 3.10, A, p=0.0043).
100nM Tem treatment induced an increase in DEPTOR expression after 48 and 72
hours in comparison to controls (Figure 3.10, A, p=0.0377 and 0.0026 respectively).
25μM Res treatment induced an increase in DEPTOR expression after 48 and 72
hours in comparison to controls (Figure 3.9, B, p=0.0001 and 0.0194 respectively).
50μM Res treatment induced an increase in DEPTOR expression after 48 and 72
hours in comparison to controls (Figure 3.9, B, p=0.0449, 0.0007 respectively). An
increase in DEPTOR expression was detected in comparison to controls after 10nM
BEZ treatment for 48 hours (Figure 3.9, C, p=0.0146) and after 100nM BEZ
treatment for 48 and 72 hours (Figure 3.9, C, p=0.0072 and 0.0266 respectively).

103
3.3.2.5 Rictor Expression in SKOV3 Cells
Figure 3.11 - Relative rictor expression was measured by qPCR in SKOV3 cells
treated with Rap (20 and 100nM), Eve (20 and 100nM), Def (100 and 1000nM) and
carrier (DMSO) only control for 48 and 72 hours. cDNA was synthesised from
extracted RNA from 3 biological replicates for each condition. Three technical
replicates were performed per biological replicate. Data were analysed using the
ΔCq method and an RQ value calculated by 2-ΔCq. An F-test was performed to assess
variance between groups and two-tailed, unpaired Student’s t-tests with Welch’s
correction for unequal variance were performed to assess significance. Error bars
depict standard deviation and asterisks denote significance. No change in rictor
expression was detected as a result of treatment with Rap, Eve or Def (A, B and C
respectively).

104
Figure 3.12 - Relative rictor expression was measured by qPCR in SKOV3 cells
treated with Tem (10nM and 100nM), Res (25 and 50μM), BEZ (10 and 100nM) and
carrier (DMSO) only control for 48 and 72 hours. cDNA was synthesised from
extracted RNA from 3 biological replicates for each condition. Three technical
replicates were performed per biological replicate. Data were analysed using the
ΔCq method and an RQ value calculated by 2-ΔCq. An F-test was performed to assess
variance between groups and two-tailed, unpaired Student’s t-tests with Welch’s
correction for unequal variance were performed to assess significance. Error bars
depict standard deviation and asterisks denote significance. No change in rictor
expression was detected as a result of treatment with Tem, Res or BEZ (A, B and C
respectively).

105
3.3.2.6 Rictor Expression in MDAH-2774 Cells
Figure 3.13 - Relative rictor expression was measured by qPCR in MDAH-2774 cells
treated with Rap (20 and 100nM), Eve (20 and 100nM), Def (100 and 1000nM) and
carrier (DMSO) only control for 48 and 72 hours. cDNA was synthesised from
extracted RNA from 3 biological replicates for each condition. Three technical
replicates were performed per biological replicate. Data were analysed using the
ΔCq method and an RQ value calculated by 2-ΔCq. An F-test was performed to assess
variance between groups and two-tailed, unpaired Student’s t-tests with Welch’s
correction for unequal variance were performed to assess significance. No change
in rictor expression was detected in response to Eve treatment (B). 20nM Rap
treatment induced an increase in rictor expression after 48 hours treatment (A,
p=0.006). 100nM Rap treatment also induced an increase in rictor expression after
48 hours (A, p=0.0302). An increase was detected in rictor expression after 48 hours
of 100nM Def treatment (C, p=0.0227).

106
Figure 3.14 - Relative rictor expression was measured by qPCR in MDAH-2774 cells
treated with Tem (10nM and 100nM), Res (25 and 50μM), BEZ (10 and 100nM) and
carrier (DMSO) only control for 48 and 72 hours. cDNA was synthesised from
extracted RNA from 3 biological replicates for each condition. Three technical
replicates were performed per biological replicate. Data were analysed using the
ΔCq method and an RQ value calculated by 2-ΔCq. An F-test was performed to assess
variance between groups and two-tailed, unpaired Student’s t-tests with Welch’s
correction for unequal variance were performed to assess significance. No change
in rictor expression was detected in response to Tem or BEZ treatment (A and C
respectively). 50μM Res treatment induced a significant increase in rictor
expression after 48 and 72 hours (B, p=0.0210 and 0.0213 respectively).

107
No change was detected in rictor expression in SKOV3 cells in response to mTOR
pathway inhibition (Figures 3.11 and 3.12). 20nM Rap treatment induced a
significant increase in rictor expression after 48 hours in MDAH-2774 cells in
comparison to controls (Figure 3.13, A, p=0.006). 100nM Rap treatment induced an
increase in rictor expression after 48 hours (Figure 3.13, A, p=0.0302). An increase
in rictor expression was detected at 48 hours after 100nM Def treatment in
comparison to controls (Figure 3.13, C, p=0.0227). Res treatment at 50μM induced
an increase in rictor expression after 48 and 72 hours in comparison to controls
(Figure 3.13, B, p=0.021 and 0.0213 respectively). No significant change was
detected in rictor expression in response to Tem or BEZ treatment at high or low
concentration in MDAH-2774 cells at any time point (Figure 3.14, A and C).

108
3.3.2.7 Raptor Expression in SKOV3 Cells
Figure 3.15 - Relative raptor expression was measured by qPCR in SKOV3 cells
treated with Rap (20 and 100nM), Eve (20 and 100nM), Def (100 and 1000nM) and
carrier (DMSO) only control for 48 and 72 hours. cDNA was synthesised from
extracted RNA from 3 biological replicates for each condition. Three technical
replicates were performed per biological replicate. Data were analysed using the
ΔCq method and an RQ value calculated by 2-ΔCq. An F-test was performed to assess
variance between groups and two-tailed, unpaired Student’s t-tests with Welch’s
correction for unequal variance were performed to assess significance. No change
in raptor expression was detected after treatment with Rap, Eve or Def (A, B and C
respectively).

109
Figure 3.16 - Relative raptor expression was measured by qPCR in SKOV3 cells
treated with Tem (10nM and 100nM), Res (25 and 50μM), BEZ (10 and 100nM) and
carrier (DMSO) only control for 48 and 72 hours. cDNA was synthesised from
extracted RNA from 3 biological replicates for each condition. Three technical
replicates were performed per biological replicate. Data were analysed using the
ΔCq method and an RQ value calculated by 2-ΔCq. An F-test was performed to assess
variance between groups and two-tailed, unpaired Student’s t-tests with Welch’s
correction for unequal variance were performed to assess significance. No change
in raptor expression was detected after treatment with Res or BEZ (B and C
respectively). 10nM Tem treatment induced an increase in rictor expression after 72
hours (A, p=0.0144).

110
3.3.2.8 Raptor Expression in MDAH-2774 Cells
Figure 3.17 - Relative raptor expression was measured by qPCR in MDAH-2774 cells
treated with Rap (20 and 100nM), Eve (20 and 100nM), Def (100 and 1000nM) and
carrier (DMSO) only control for 48 and 72 hours. cDNA was synthesised from
extracted RNA from 3 biological replicates for each condition. Three technical
replicates were performed per biological replicate. Data were analysed using the
ΔCq method and an RQ value calculated by 2-ΔCq. An F-test was performed to assess
variance between groups and two-tailed, unpaired Student’s t-tests with Welch’s
correction for unequal variance were performed to assess significance. No change
in expression was detected as a result of Rap or Eve treatment (A and B
respectively). 1000nM Def treatment induced a decrease in rictor expression after
48 hours (C, p=0.0067).

111
Figure 3.18 - Relative raptor expression was measured by qPCR in MDAH-2774 cells
treated with Tem (10nM and 100nM), Res (25 and 50μM), BEZ (10 and 100nM) and
carrier (DMSO) only control for 48 and 72 hours. cDNA was synthesised from
extracted RNA from 3 biological replicates for each condition. Three technical
replicates were performed per biological replicate. Data were analysed using the
ΔCq method and an RQ value calculated by 2-ΔCq. An F-test was performed to assess
variance between groups and two-tailed, unpaired Student’s t-tests with Welch’s
correction for unequal variance were performed to assess significance. 10nM Tem
treatment showed a decrease in raptor expression after 48 and 72 hours (A,
p=0.0457 and 0.0101 respectively). 100nM Tem treatment also decreased rictor
expression at 48 hours (A, p=0.0115). 25μM Res treatment caused a decrease in
rictor expression after 72 hours (B, p=0.0412) and 50μM Res treatment showed a
decrease after 48 hours (B, p=0.0318). BEZ treatment induced a decrease in raptor
expression after 48 hour 10nM treatment (C, p=0.0120) and after 72 hour 100nM
treatment (C, p=0.0298).

112
Little change in raptor expression was detected in SKOV3 cells. No change was
detected in raptor expression in comparison to controls in response to Rap, Eve,
Def, Res or BEZ treatment at high or low concentrations and at any time point
(Figure 3.15, A, B and C, Figure 3.16 B and C). An increase in raptor expression was
detected after 72 hours of 10nM Tem treatment (Figure 3.16, A, p=0.0144). MDAH-
2774 cells showed an overall trend towards decreasing raptor expression in
response to mTOR pathway inhibition. Rap and Eve treatment induced no change
in expression at any time point or in response to high or low concentrations in
MDAH-2774 cells (Figure 3.17, A and B respectively). 1000nM Def treatment
induced a decrease in raptor expression after 48 hours of treatment in comparison
to controls (Figure 3.17, C, p=0.0067). 10nM Tem treatment induced a decrease in
raptor expression after 48 and 72 hours of treatment in MDAH-2774 cells in
comparison to controls (Figure 3.18, A, p=0.0457 and 0.0101 respectively). In
addition, 100nM Tem treatment also induced a decrease in raptor expression after
48 hours of treatment (Figure 3.18, A, p=0.0115). 25μM Res treatment resulted in
decreased raptor expression after 72 hours in comparison to controls and 50μM
Res treatment had the same effect after 48 hours treatment (Figure 3.18, B,
p=0.0412 and 0.0318 respectively). 10nM BEZ treatement induced a decrease in
raptor expression after 48 hours of treatment and 100nM BEZ treatment resulted in
decreased raptor expression after 72 hours in comparison to controls (Figure 3.18,
C, p=0.012 and 0.0298 respectively).

113
3.3.3 Summary
Component
Cell Line
SKOV3 MDAH-2774
Expressional Change
mTOR X X
DEPTOR X Increase
Rictor X X
Raptor X Decrease
Table 3.2 - Summary of gene expression changes of mTOR components in SKOV2
and MDAH-2774 cells following treatment with mTOR pathway inhibitors.
Expressional change was included when observed in greater than five instances.
3.4 Discussion
This study validated the expression of four core mTOR complex components, mTOR,
DEPTOR, rictor and raptor in two in vitro models of ovarian cancer. Both gene and
protein expression of mTOR, DEPTOR, rictor and raptor was confirmed. In
agreement with previous studies, we showed that these components are primarily
located in the cytoplasm (Roos et al., 2007; Foster et al., 2010; Zhang et al., 2002).
We detected a significant increase in mTOR and raptor gene expression in MDAH-
2774 cells in comparison to SKOV3 cells. Raptor is an mTORC1 component (Hara et
al., 2002) and the detected upregulation may suggest increased mTORC1 assembly
and signalling in this cell line. We also examined the gene expression changes that
occurred in mTOR, DEPTOR, rictor and raptor in SKOV3 and MDAH-2774 ovarian
cancer cell lines after treatment with single mTOR and dual mTOR and PI3 kinase
inhibitors. There are few reports on the effect of mTOR pathway inhibition on
expression of mTOR pathway components. Differential effects were detected in
response to mTOR pathway inhibition in SKOV3 and MDAH-2774 cells. In
agreement with previous data, mTOR showed little change in expression in SKOV3
or MDAH-2774 cells after treatment with rapalogues, Res or BEZ. No consistent
change in DEPTOR expression was detected with rapalogue treatment in SKOV3

114
cells. In contrast to SKOV3 cells DEPTOR expression was increased in response to all
treatments in MDAH-2774 cells.
SKOV3 and MDAH-2774 cells also showed a differential effect in rictor and raptor
expression in response to mTOR pathway inhibition. Rictor and raptor expression
was unaffected by Rap, rapalogues, Res and BEZ in SKOV3 cells; however, MDAH
cells showed a general increase in rictor expression and a general decrease in
raptor expression. mTOR pathway inhibitors have been shown to increase mTORC2
signalling through the inactivation of a negative feedback loop to PI3 kinase as a
result of mTOR inhibition (Peterson et al., 2009). Rictor is an mTORC2 component
(Sarbassov et al., 2004) and an increase may suggest increased mTORC2 assembly
and signalling. SKOV3 and MDAH-2774 cells differ in their origins; SKOV3 cells were
derived from a clear cell adenocarcinoma and MDAH-2774 cells were derived from
an endometrioid adenocarcinoma. As discussed previously, these cell lines differ
substantially in the types of genetic aberrations they carry (Beaufort et al., 2014)
and this may contribute to the differential effects on DEPTOR, rictor and raptor
expression detected after mTOR pathway inhibition.
Res treatment of SKOV3 cells showed an increase in expression after 48 hours and a
decrease after 72 hours, suggesting that the effects of Res treatment on DEPTOR
expression are biphasic. Res inhibits mTOR by enhancing its interaction with
DEPTOR (Meilian Liu et al., 2010) and in this cell type, DEPTOR expression at RNA
level may be regulated by the amount of unbound DEPTOR protein. There is limited
research into the transcriptional and translational control of DEPTOR but recent
research has shown that mTOR activation is able to induce the degradation of
DEPTOR protein (Gao et al., 2011). DEPTOR expression at both RNA and protein
level is decreased in response to TGFβ (Das et al., 2013) which activates mTORC1
signalling (Lamouille et al., 2012; Rozen-Zvi et al., 2013). Collectively, these data
show that mTOR component expression at gene level are differentially regulated
dependent on cell type and that phenotypic responses to mTOR pathway inhibition
may vary.

115
Chapter 4
The effects of mTOR pathway inhibition in in
vitro models of ovarian cancer
4.1 Introduction
The mTOR pathway is a key regulator of growth and proliferation and responds to
stimuli such as growth factors, amino acids, DNA damage, energy and oxygen status
to mediate proliferation, cell growth and autophagy among other processes.
mTOR, DEPTOR, rictor and raptor are four main components of mTORC1 and
mTORC2, the central complexes of the mTOR pathway, and it is evident that a
majority of the pathway’s actions are mediated by mTORC1 (Laplante and Sabatini,
2012).
mTOR inhibitor Rap was first approved for clinical use throughout the european
union (EU) in 2001 under the brand name Rapamune in patients who had
undergone kidney transplantation to prevent rejection due to Rap’s potent
immuno-inhibitory effects (European Medicines Agency, 2015c; Kay et al., 1991;
Dumont et al., 1990; Morelon et al., 2001). Since this time, Eve (Afinitor, Novartis)
and Tem (Torisel, Pfizer) have also been approved for renal cell carcinoma,
pancreatic and breast cancers and mantle cell lymphomas (European Medicines
Agency, 2015b; European Medicines Agency, 2015d; Benjamin et al., 2011).
Multiple clinical trials are currently underway involving the rapalogues, Res and BEZ
for the treatment of autoimmune disease, epilepsy, organ transplant rejection and
a range of cancers (clinicaltrials.gov). Although mTOR inhibitors are a much studied
source of cancer treatment, the effects of mTOR inhibition have not yet been fully
realised. mTOR inhibition is likely to be most effective in subsets of malignancies
with mTOR aberrations and more work must be done to define the conditions in
which these inhibitors are likely to be most effective. We sought to elucidate the

116
effect that mTOR pathway inhibition has on cell growth, proliferation, apoptosis
and mTOR pathway activation in SKOV3 and MDAH-2774 cell lines.
4.2 Objectives
-To elucidate the effect that mTOR pathway inhibition has on migration and
proliferation of SKOV3 and MDAH-2774 cells.
-To assess the proliferative capacity of SKOV3 and MDAH-2774 cells after mTOR
inhibition.
-To investigate the effects that mTOR pathway inhibition has on mTOR pathway
activation (phosphorylation of p70S6 kinase) and cell death (cleavage of caspases 3
and 9).
4.3 Results
mTOR pathway inhibitors were used according to section 3.3.2.
4.3.1 Proliferation and migration of SKOV3 and MDAH-2774 cells in a wound
healing scenario
We initially investigated the proliferative and migratory capacity of SKOV3 and
MDAH-2774 cells after treatment with mTOR pathway inhibitors. As this was a
preliminary investigation, we used Rap to represent rapalogues, Res and BEZ.
Wound healing assays can give a visual indication of cells’ proliferative and
migratory capacity spatially in vitro. Wound healing assays were completed as
described previously (Section 2.4). Briefly, cells were seeded in 6-well plates
(~10cm2 growth area) and grown into a confluent monolayer. Three ‘wounds’ were
created in the cells with a p200 pipette tip immediately before treatment with Rap
(20 and 100nM), Res (25 and 50μM) and BEZ (10nM and 100nM) and images taken

117
at 0, 6, 12 and 18 hours after treatment. Three biological replicates were
performed per condition.
4.3.1.1 SKOV3
Figure 4.1 - A ‘wound’ was created in a confluent monolayer of SKOV3 cells which
were then treated with Rap (20 and 100nM), Res (25 and 50μM) and BEZ (10 and
100nM). Images were taken up to 18 hours after treatment. Figure shows cells at 0
and 18 hours after treatment.

118
4.3.1.2 MDAH-2774
Figure 4.2 - A ‘wound’ was created in a confluent monolayer of MDAH-2774 cells
which were then treated with Rap (20 and 100nM), Res (25 and 50 μM) and BEZ (10
and 100nM). Images were taken up to 18 hours after treatment. Figure shows cells
at 0 and 18 hours after treatment.
Untreated SKOV3 cells showed a marked growth into the wound (Figure 4.1, A1 and
A2) which was not shared by any of the inhibitor treated cells. Rap and Res treated
cells showed little growth at both concentrations (Figure 4.1, B1-4 and C1-4) 10nM
BEZ treatment showed a moderate change which was not shared by 100nM
treatment (Figure 4.1, D1-4). MDAH-2774 showed little proliferation under all

119
conditions; limited differences between control and treated cells were detected
(Figure 4.2). No decrease in cell number was visually detected, indicating that these
inhibitory treatments do not exert a cytotoxic effect.
4.3.2 Proliferative capacity of SKOV3 and MDAH-2774 cells after mTOR pathway
inhibition
To expand the investigation of the effects of mTOR pathway inhibition on cell
viability, a proliferation assay was performed using trypan blue staining to make an
assessment of the proliferative capacity of the SKOV3 and MDAH-2774 cells up to
72 hours after treatment with mTOR pathway inhibitors including the rapalogues
Eve, Def and Tem. Proliferation assays were performed as described previously
(Section 2.3). Briefly, cells were seeded in 6-well plates at a density of 100,000 cells
per well (~10cm2 growth area) and allowed to proliferate for 24 hours before
treatment with Rap (20 and 100nM), Eve (20 and 100nM), Def (100 and 1000nM),
Tem (10 and 100nM), Res (25 and 50), BEZ (10 and 100nM) or carrier (DMSO). Cells
were detached from the wells at 24, 48 and 72 hours by TrypLe™ Express (Life
Technologies) and resuspended in media. An equal volume of cell suspension was
mixed thoroughly with trypan blue stain (0.4%, Invitrogen) and viable and dead cells
were counted using a Countess® Automated Cell Counter (Life Technologies).
Biological and technical triplicates were performed for each condition.

120
4.3.2.1 SKOV3
Figure 4.3 - SKOV3 cells were treated with mTOR pathway inhibitors and carrier
(DMSO). Cell counts were performed 24, 48 and 72 hours after treatment. An F-
Test was performed to assess variance and two-tailed, unpaired Student’s t-tests
were performed with Welch’s correction for unequal variance to assess significance.
Error bars depict standard deviation and asterisks denote significant changes
between control and higher concentration treatments. Rap treatment induced a
non-dose dependent decrease in viable cells after 24, 48 and 72 hours (A, p=0.0081,
0.0067 and 0.0355 respectively). Eve treatment induced a non-dose dependent
decrease in viable cells after 48 and 72 hours (B, p=0.012 and 0.0047 respectively).
Def treatment induced a non-dose dependent decrease in viable cells after 48 hours
(C, p=0.005).

121
Figure 4.4 - SKOV3 cells were treated with mTOR pathway inhibitors and carrier
(DMSO). Cell counts were performed 24, 48 and 72 hours after treatment. An F-
Test was performed to assess variance and two-tailed, unpaired Student’s t-tests
were performed with Welch’s correction for unequal variance to assess significance.
Error bars depict standard deviation and asterisks denote significant changes
between control and higher concentration treatments. Tem showed a non-dose
dependent decrease in viable cells after 48 and 72 hours (A, p=0.0013 and 0.0446
respectively) whereas the decrease in Res and BEZ treated cells was dose dependent
and significant at 48 and 72 hours (B & C, p<0.0001 in all cases).

122
4.3.2.2 MDAH-2774
Figure 4.5 - MDAH-2774 cells were treated with mTOR pathway inhibitors and
carrier (DMSO). Cell counts were performed 24, 48 and 72 hours after treatment.
An F-Test was performed to assess variance and two-tailed, unpaired Student’s t-
tests were performed with Welch’s correction for unequal variance to assess
significance. Error bars depict standard deviation and asterisks denote significant
changes between control and higher concentration treatments. Rap and Def
showed a significant decrease in viable cells after 48 hours (A & C, p=0.0013 and
0.0004 respectively). No effect on viable cells was detected after Eve treatment (B).

123
Figure 4.6 - MDAH-2774 cells were treated with mTOR pathway inhibitors and
carrier (DMSO). Cell counts were performed 24, 48 and 72 hours after treatment.
An F-Test was performed to assess variance and two-tailed, unpaired Student’s t-
tests were performed with Welch’s correction for unequal variance to assess
significance. Error bars depict standard deviation and asterisks denote significant
changes between control and higher concentration treatments. Tem treatment
induced a non-dose dependent decrease in viable cells after 72 hours (A, p=0.0065).
BEZ treatment at 10nM showed no effect; however, 100nM treatment completely
halted proliferation (C, p=<0.0001 at both 48 and 72 hours).

124
Figure 4.7 - SKOV3 and MDAH-2774 cells were seeded at 100,000 cells per well and
treated with 5% DMSO for 72 hours. An F-Test was performed to assess variance
and an unpaired, two-tailed Student’s t-test with Welch’s correction for unequal
variance performed to assess significance. Error bars depict standard deviation and
asterisks denote significance. The average increase in control cell number was
significantly greater for MDAH-2774 cells than SKOV3 cells (p<0.0001).
MDAH-2774 cells have a greater proliferative capacity than SKOV3 cells, showing an
average increase in viable cells of 1,600,000 in comparison to 400,000 (Figure 4.7,
p<0.0001). Treatment of the SKOV3 cell line with Rap and the rapalogues showed a
non dose-dependent decrease in viable cells (Figure 4.3 A, B and C, Figure 4.4, A,
Rap 100nM: p=0.0355 at 72 hours, Eve 100nM: p=0.0047 at 72 hours, Tem 100nM:
p=0.0446 at 72 hours, Def 1000nM did not reach statistical significance: p=0.0597).
The decrease in viable cells shown by Res and BEZ was dose dependent (Figure 4.4,
B and C, Res 50μM: p<0.0001 at 72 hours, BEZ 100nM: p<0.0001 at 72 hours).
Viable cell count in MDAH-2774 cells was little affected by Rap, rapalogue or Res
treatment (Figure 4.5 A, B and C, Figure 4.6, A and B, Rap 100nM: p=0.0013 at 48
hours, Def 1000nM: p=0.0004 at 48 hours, Tem 100nM: p=0.0065 at 72 hours). BEZ
treatment at 10nM concentration also did not have an effect on viable cell count
but at 100nM, proliferation was almost entirely eliminated (Figure 4.6 C, p<0.0001
at 48 and 72 hours). Number of dead cells counted over the course of the
experiment did not change significantly (Figures 4.3, 4.4, 4.5 and 4.6), further
indicating that mTOR pathway inhibition induces a cytostatic and not cytotoxic
response.

125
4.3.3 Activity of mTOR and caspase pathways after mTOR pathway inhibition
To further elucidate the cytostatic effects that mTOR pathway inhibition has on
SKOV3 and MDAH-2774 cells, we investigated the activity of the mTOR and caspase
pathways. p70S6 kinase is a terminal kinase in the mTOR pathway responsible for
promoting protein synthesis (Laplante and Sabatini, 2012). It is active when
phosphorylated and can be used as evidence of an active mTOR pathway via the
mTORC1 complex (Isotani et al., 1999; Burnett et al., 1998). Caspases (cysteine-
dependent aspartate-directed proteases) are cysteine proteases involved in
apoptosis (programmed cell death). Caspase 9 is an initiator caspase whereas
caspase 3 is an effector caspase. Initiator caspases activate effector caspases by
cleaving their inactive (pro) form (Hao Chen et al., 2015).
Western Blot experiments were performed in order to assess the activation status
of the mTOR and caspase pathways after treatment with mTOR pathway inhibitors.
Western blots were performed in triplicate as previously described (Section 2.11)
on proteins extracted from treated and control cells (SKOV3 and MDAH-2774) using
antibodies for endogenous full length (35kDa) and cleaved large fragment
(17/19kDa) caspase 3, endogenous full length (47kDa) and cleaved large fragment
(35/37kDa) caspase 9 and phosphorylated (Thr389) p70S6 kinase. Analysis was
performed densitometrically using ImageJ software (National Institutes of Health)
as described previously (Section 2.11.1).
4.3.3.1 Caspase 9
Figure 4.8 - Western blots were performed on proteins extracted from SKOV3 and
MDAH-2774 cells treated with mTOR pathway inhibitors for 24, 48 and 72 hours.
Caspase 9 cleavage can be detected in all cases. Representative image shows
extractions after 72 hours.
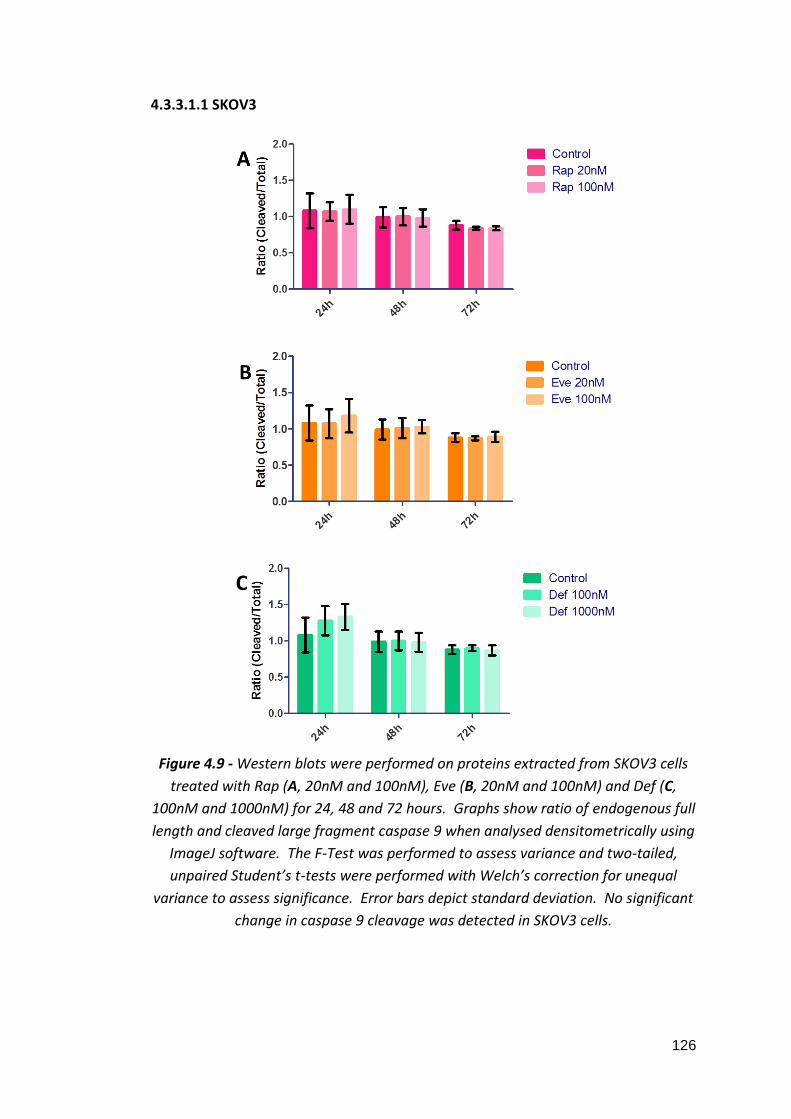
126
4.3.3.1.1 SKOV3
Figure 4.9 - Western blots were performed on proteins extracted from SKOV3 cells
treated with Rap (A, 20nM and 100nM), Eve (B, 20nM and 100nM) and Def (C,
100nM and 1000nM) for 24, 48 and 72 hours. Graphs show ratio of endogenous full
length and cleaved large fragment caspase 9 when analysed densitometrically using
ImageJ software. The F-Test was performed to assess variance and two-tailed,
unpaired Student’s t-tests were performed with Welch’s correction for unequal
variance to assess significance. Error bars depict standard deviation. No significant
change in caspase 9 cleavage was detected in SKOV3 cells.

127
Figure 4.10 - Western blots were performed on proteins extracted from SKOV3 cells
treated with Tem (A, 10nM and 100nM), Res (B, 25μM and 50μM) and BEZ (C, 10nM
and 100nM) for 24, 48 and 72 hours. Graphs show ratio of endogenous full length
and cleaved large fragment caspase 9 when analysed densitometrically using
ImageJ software. The F-Test was performed to assess variance and two-tailed,
unpaired Student’s t-tests were performed with Welch’s correction for unequal
variance to assess significance. Error bars depict standard deviation. No significant
change in caspase 9 cleavage was detected in SKOV3 cells.

128
4.3.3.1.2 MDAH-2774
Figure 4.11 - Western blots were performed on proteins extracted from MDAH-2774
cells treated with Rap (A, 20nM and 100nM), Eve (B, 20nM and 100nM) and Def (C,
100nM and 1000nM) for 24, 48 and 72 hours. Graphs show ratio of endogenous full
length and cleaved large fragment caspase 9 when analysed densitometrically using
ImageJ software. The F-Test was performed to assess variance and two-tailed,
unpaired Student’s t-tests were performed with Welch’s correction for unequal
variance to assess significance. Error bars depict standard deviation. No significant
change in caspase 9 cleavage was detected in MDAH-2774 cells.

129
Figure 4.12 - Western blots were performed on proteins extracted from MDAH-2774
cells treated with Tem (A, 10nM and 100nM), Res (B, 25μM and 50μM) and BEZ (C,
10nM and 100nM) for 24, 48 and 72 hours. Graphs show ratio of endogenous full
length and cleaved large fragment caspase 9 when analysed densitometrically using
ImageJ software. The F-Test was performed to assess variance and two-tailed,
unpaired Student’s t-tests were performed with Welch’s correction for unequal
variance to assess significance. Error bars depict standard deviation. No significant
change in caspase 9 cleavage was detected in MDAH-2774 cells.
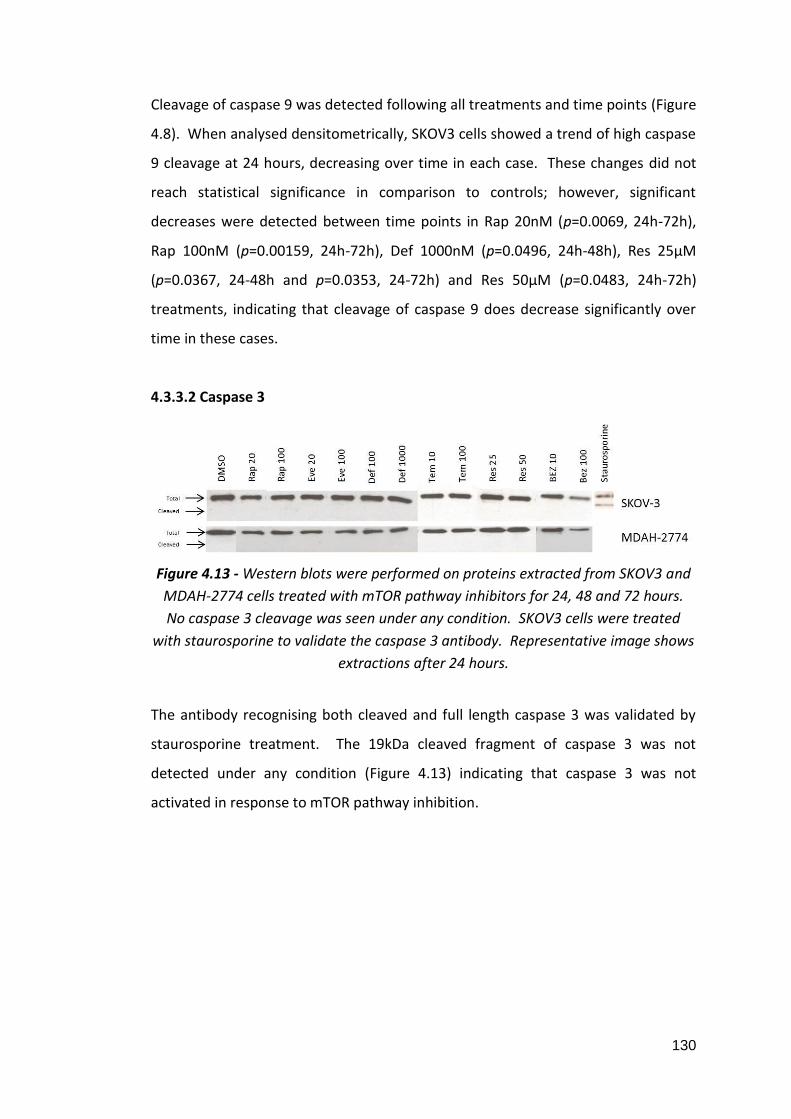
130
Cleavage of caspase 9 was detected following all treatments and time points (Figure
4.8). When analysed densitometrically, SKOV3 cells showed a trend of high caspase
9 cleavage at 24 hours, decreasing over time in each case. These changes did not
reach statistical significance in comparison to controls; however, significant
decreases were detected between time points in Rap 20nM (p=0.0069, 24h-72h),
Rap 100nM (p=0.00159, 24h-72h), Def 1000nM (p=0.0496, 24h-48h), Res 25μM
(p=0.0367, 24-48h and p=0.0353, 24-72h) and Res 50μM (p=0.0483, 24h-72h)
treatments, indicating that cleavage of caspase 9 does decrease significantly over
time in these cases.
4.3.3.2 Caspase 3
Figure 4.13 - Western blots were performed on proteins extracted from SKOV3 and
MDAH-2774 cells treated with mTOR pathway inhibitors for 24, 48 and 72 hours.
No caspase 3 cleavage was seen under any condition. SKOV3 cells were treated
with staurosporine to validate the caspase 3 antibody. Representative image shows
extractions after 24 hours.
The antibody recognising both cleaved and full length caspase 3 was validated by
staurosporine treatment. The 19kDa cleaved fragment of caspase 3 was not
detected under any condition (Figure 4.13) indicating that caspase 3 was not
activated in response to mTOR pathway inhibition.

131
4.3.3.3 p70S6 Kinase
Figure 4.14 - Western blots were performed on proteins extracted from SKOV3 (A)
and MDAH-2774 (B) cells treated with mTOR pathway inhibitors for 24, 48 and 72
hours. Rap and the rapalogues completely eliminated p70S6 kinase phosphorylation
in both SKOV3 and MDAH-2774 cells at 24, 48 and 72 hours. In Res treated SKOV3
cells, phosphorylated p70S6 kinase was seen at 25μM at all time points, at 50μM
after 72 hours and in 10nM BEZ treated cells after 72 hours but not in 100nM BEZ
treated cells. In MDAH-2774 cells, Res treatment at both 25 and 50μM and BEZ
treatment at 10nM did not eliminate p70S6 kinase phosphorylation.
Phosphorylation status of p70S6 kinase was examined to better understand the
activity of the mTOR pathway after inhibition. At 24, 48 and 72 hours, p70S6 kinase
was dephosphorylated in both SKOV3 and MDAH-2774 cells treated with Rap and
all of the rapalogues. In SKOV3 cells treated with Res, phosphorylation p70S6
kinase was abolished at 50μM concentration at 24 and 48 hours but
phosphorylated p70S6 kinase was detected after 72 hours. 25 or 50μM Res
treatment did not dephosphorylate p70S6 kinase in MDAH-2774 cells. In both

132
SKOV3 and MDAH-2774 cells, 100nM BEZ treatment dephophorylated p70S6 kinase
at all time points. No phosphorylated p70S6 kinase was detected after 24 and 48
hour treatment with 10nM BEZ but was detected after 72 hours in both cases
(Figure 4.14).
4.4 Discussion
This study investigated the effects of mTOR pathway inhibition on aspects of
cellular activity using two different ovarian cancer cell lines. SKOV3 (clear cell) and
MDAH-2774 (endometrioid) are models of the two types of ovarian cancer which
are most associated with endometriosis (Pearce et al., 2012; Brinton et al., 2005;
Merritt et al., 2008). Using a wound healing assay we were able to show that the
effects of mTOR pathway inhibition were cytostatic up to 18 hours.
When we investigated the effects of mTOR pathway inhibition up to 72 hours, we
were able to show that MDAH-2774 cells have an increased proliferative capacity in
comparison to SKOV3 cells under basal conditions and that mTOR pathway
inhibition was less effective in these cells. Previously we have shown that mTOR
and raptor are upregulated in MDAH-2774 cells in comparison to SKOV3 cells
suggesting higher levels of mTORC1 signalling in this cell line (Section 4.3.2). This
suggests that the effects of mTOR pathway inhibition may be diminished in cells
that are more readily able to undergo mitosis. Rap and rapalogue treatment
induced a non dose dependent decrease in viable cells in the SKOV3 cell line and
little to no decrease in the MDAH-2774 cell line. The non dose dependent effect
seen in SKOV3 cells is in agreement with previous work on Eve treatment on
neuroendocrine tumour cells (Zitzmann et al., 2010) and suggests that the effective
concentration range of these agents might be below the concentrations used for
this experiment. Res and BEZ treatment of SKOV3 cells showed a moderate dose
dependency and inhibitory effects were significantly greater for these dual
mTOR/PI3 kinase inhibitors than they were for sole mTOR inhibitors indicating that
additionally targeting PI3 kinase increases efficacy in these cells. In the more
proliferative MDAH-2774 cell line, Res treatment at 25 or 50μM or BEZ treatment at

133
10nM had no effect on number of viable cells; however, 100nM BEZ treatment
profoundly decreased the number of viable cells to almost basal level. Previous
research has shown that BEZ has a cytostatic effect and these data suggest that the
concentration at which this occurs in MDAH-2774 cells is above 10nM (Montero et
al., 2012). In agreement with the previous chapter, the differences in responses to
mTOR inhibition, particularly dual mTOR and PI3 kinase inhibition, in these cell lines
highlights how individual differences can play a role in reaction to drug treatments
and specifically how effective doses may change from patient to patient.
We further investigated the effects of mTOR pathway inhibition on apoptotic and
mTOR pathway activity. Western blot experiments demonstrated cleavage of
caspase 9 after 24 hour treatment which decreased by 48 and 72 hours in SKOV3
cells. This indicates that initial response to mTOR inhibitor treatment is to induce
apoptosis but this effect is rescued by 48 hours after treatment. No pattern of
change was seen in caspase 9 cleavage in MDAH-2774 cells and no caspase 3
cleavage was detected in either cell line. Caspase 9 is an initiator caspase which
cleaves the pro form of caspase 3 to induce apoptosis. That caspase 9 was
unaffected by treatment and no caspase 3 cleavage was detected indicates that the
effect of caspase 9 cleavage was not substantial enough to induce apoptosis in
these cells. Our findings are supported by proliferation assays showing no change
in dead cell number over 72 hours. These data further confirm that the effects of
mTOR pathway inhibition are cytostatic as opposed to cytotoxic. Previous reports
which show that Rapamycin and Temsirolimus cause cell cycle arrest at G0/G1 phase
(Fagone et al., 2013) and that rapalogue treatment is not able to induce apoptosis,
including Eve treatment in SKOV3 cells (Treeck et al., 2006; Avellino et al., 2005;
Hahn et al., 2005; Beuvink et al., 2005) confirm this. Evidence shows that apoptosis
is inhibited by mTORC2 signalling via SGK1 (Dudek et al., 1997; Peterson et al.,
2009; García-Martínez and Alessi, 2008) and the lack of an apoptotic effect induced
by the rapalogues may be explained by their ineffective inhibition of mTORC2. It
may be useful to study the effects of dual and single mTOR pathway inhibition on
SGK1 and NDRG9, downstream effectors of mTORC2 involved in the control of
apoptosis (García-Martínez and Alessi, 2008).

134
p70S6 kinase is a direct kinase target of mTORC1 signalling and modulates cellular
processes such as protein and lipid synthesis (Laplante and Sabatini, 2012).
Rapalogue treatment induced p70S6 kinase dephosphorylation at 24 hours, the
earliest time point measured, in agreement with previous data (Koo et al., 2015;
Leung et al., 2015; Xu et al., 2015). Although treatment with Res showed a dose
dependent decrease in viable cell count in SKOV3 cells and BEZ treatment inhibited
proliferation in both SKOV3 and MDAH-2774 cells, phosphorylated p70S6 kinase
was still detected in these cells by western blot. These data suggest that Res and
BEZ may not affect the phosphorylation status of p70S6 kinase to the same extent
as Rap and rapalogues and the inhibitory effects of these inhibitors may be
mediated through alternative pathways.
The non-apoptotic effects of the mTOR pathway inhibitors used in this study may
exclude them from being effective single agent therapies in the treatment of
malignancy. However, it has been shown that rapalogue treatment is able to
potentiate the apoptotic effects of Tamoxifen, Doxorubicin, UCN-01 and Cisplatin
treatment in vitro, indicating that mTOR pathway inhibitors may be useful in
combinatorial therapeutic approaches to cancer treatment (Treeck et al., 2006;
Avellino et al., 2005; Hahn et al., 2005; Beuvink et al., 2005). A mechanism by
which mTOR pathway inhibition enhances apoptosis whilst not inducing it as a
single agent treatment has been described by Beuvink et al.,. The authors have
shown Eve is a potent inhibitor of p21 protein expression, a protein that is activated
by p53 and causes cell cycle arrest and DNA damage repair. A reduction in p21
reduces cell cycle arrest and the potential for DNA damage repair therefore
initiating apoptosis in response to DNA damage (Beuvink et al., 2005). It would be
interesting to further elucidate the effects that mTOR pathway inhibitors have in
both p53-null and wild type p53 cell lines to fully understand the mechanisms by
which mTOR pathway inhibition enhances apoptosis whilst not inducing it.
Interestingly, Beuvink et al., also showed that Eve treatment was able to enhance
the effects of Cisplatin when at concentrations that would usually not induce a
decrease in cell viability, indicating that using mTOR pathway inhibitors may allow
for lower doses of cytotoxic chemotherapeutic agents in cancer treatment and

135
therefore a reduction in the harmful side-effects brought about by these drugs
(Beuvink et al., 2005).
Inhibiting mTOR and PI3 kinase in parallel proved to be more effective at reducing
viable cell number in SKOV3 but not MDAH-2774 cells. This may be due to a
negative feedback loop directed to PI3 kinase that is relieved on mTORC1 inhibition
and can induce PI3 kinase signalling via Akt to cause an upregulation in mTORC2
signalling (Peterson et al., 2009). Dual mTOR and PI3 kinase, or mTORC1 and
mTORC2 inhibitors are able to target both mTORC1 signalling and the aftereffect
mTORC2 signalling and therefore induce more effective repression of the mTOR
pathway (Zitzmann et al., 2010; Hisamatsu et al., 2013). Both SKOV3 and MDAH-
2774 cells carry mutation of the PIK3CA gene encoding the catalytic subunit of PI3
kinase; however, only MDAH-2774 cells have KRAS and BRAF mutations (Beaufort
et al., 2014; Nakayama et al., 2008). KRAS and BRAF are part of the MAP kinase
signalling pathway which has been shown to regulate the mTOR pathway by
inhibiting the TCS1/TSC2 complex (Ma and Blenis, 2009). Everolimus has been
shown to activate the MAP kinase pathway in breast and colon cancer and
melanoma, and cell lines with KRAS and BRAF mutation are particularly susceptible
to the growth inhibitory effects of MAP kinase inhibition (Carracedo and Pandolfi,
2008; Nakayama et al., 2008). This additional activation of the mTOR pathway in
MDAH-2774 cells which would not be affected by PI3 kinase inhibition by Res or BEZ
may contribute to the increased proliferative capacity and decreased response to
dual inhibitors seen in these cells. In support of this, inhibition of both the MAP
kinase and PI3 kinase pathways proved to be more effective than targeting solely
PI3 kinase in neuroendocrine tumour cell lines (Zitzmann et al., 2010).
mTORC2 was previously thought to be Rap insensitive but a more recent study has
shown that inhibition of mTOR by Rap may remove it as a component of both
mTORC1 and mTORC2 and so longer term treatment with Rap interrupts mTORC2
assembly. mTORC2 inhibition was shown with 100nM Rap treatment after 24 hours
(Sarbassov et al., 2006). In this study, SKOV3 and MDAH-2774 cells were treated
with 20 and 100nM Rap for up to 72 hours. According to previous research, which

136
showed a partial reduction in the mTOR association with rictor after 24 hour
treatment with 100nM Rap, the higher concentration of Rap used in this study
would have inhibited mTORC2 activity, at least in part. mTORC2 is known to
suppress apoptosis (Dudek et al., 1997; Peterson et al., 2009; García-Martínez and
Alessi, 2008); however, no dose dependent apoptotic or proliferative effect was
detected following Rap treatment of SKOV3 or MDAH-2774 cells, indicating that, if
present, mTORC2 inhibition is not affecting these mechanisms. mTORC2 signalling
via Akt is known to play a role in cell survival (Jacinto et al., 2006) and so it would be
interesting to further elucidate the effects of all the rapalogues used in this study
on mTOR and rictor association and activation of the mTORC2 signalling pathway.
The survival rate for ovarian cancer is uncharacteristically low and advances in
ovarian cancer therapeutics have not kept pace with other cancer types. mTOR
pathway inhibition presents an as yet unexploited treatment method for ovarian
cancer. In agreement with the previous chapter, mTOR pathway inhibition shows
differential effects in SKOV3 and MDAH-2774 cells, highlighting the need for
tumour specific therapies. Dual mTOR and PI3 kinase inhibition proved to be more
effective that mTOR inhibition alone and further inhibition of the MAP kinase
pathway in addition to effective mTORC2 downregulation may prove to be the key
to effective mTOR pathway inhibition that has thus far remained elusive.

137
Chapter 5
Mapping of mTOR, DEPTOR, rictor, raptor and
p70S6 kinase at gene and protein level in ovarian
cancer clinical samples
5.1 Introduction
Ovarian cancer, most often epithelial in origin (CRUK, 2014b), is the fifth most
common cancer to affect women in the UK and the most common cause of death
by gynaecological cancer, proving fatal for around 4300 women in 2012 (CRUK,
2015g). Ovarian cancer can be difficult to diagnose because symptoms are often
mild or ambiguous and it is often not identified until it has progressed into the
more advanced stages, at which chemotherapeutic treatment is less effective (Buys
et al., 2011). There is currently no reliable biomarker for ovarian cancer and no
general population screening programme available on the NHS.
Ovarian cancer has an increased incidence in patients with endometriosis (Stewart
et al., 2013; Pearce et al., 2012; Wu et al., 2009; Merritt et al., 2008; Borgfeldt and
Andolf, 2004; Brinton et al., 2005; Brinton et al., 2004) that has not been seen in
other gynaecological conditions such as pelvic inflammatory disease, borderline
ovarian cancers, fibroids and ovarian cysts (Stewart et al., 2013; Pearce et al., 2012;
Brinton et al., 2005; Borgfeldt and Andolf, 2004). It is particularly associated with
risk of clear cell and endometrioid ovarian cancers (Pearce et al., 2012; Brinton et
al., 2005; Merritt et al., 2008; Rossing et al., 2008). Endometriosis is a non-
malignant condition characterised by the explantation and growth of extraneous
endometrium in areas such as the ovaries, fallopian tubes, vagina, peritoneum and
bladder. Endometriosis is estimated to affect around 2 million women in the UK
(NHS Choices, 2015) causing dysmenorrhea, dyspareunia, dysuria, dyschezia,
infertility and chronic pelvic pain.

138
The mTOR pathway, a central regulator of growth and proliferation, has been
shown to play a role in both ovarian cancer and endometriosis (Leconte et al., 2011;
Mabuchi, Deborah A Altomare, et al., 2007). However, the deregulations of this
pathway in both conditions are currently poorly categorised. Due to the unique
relationship between endometriosis and ovarian cancer, we hypothesised that
mTOR components may be implicated in the pathogenesis of ovarian cancer and
endometriosis.
5.2 Objectives
-To elucidate the most stable reference gene(s) for use in qPCR for a set of ovarian
tissue sample cDNAs using a geNorm™ 12 gene kit (Primerdesign) in order to
achieve accurate qPCR normalisation.
-To assess gene expression of mTOR, DEPTOR, rictor and raptor in a range of
ovarian tissue samples from patients with ovarian cancer, endometriosis,
endometrial cancer, fibroids and control patients with no known gynaecological
conditions.
-To compare gene expression of mTOR components and survival using in silico
analyses of mRNA expression.
-To elucidate the expression of mTOR, DEPTOR, rictor, raptor and phosphorylated
p70S6 kinase in different stages, grades and pathologies of ovarian cancer at
protein level.
5.3 Results
Clinical samples were obtained from the University of Thessaloniki (Table 5.1,
detailed in 2.5.1); ethical approval was obtained by the local hospital authority and
by Brunel University ethics committee. Tissue samples were homogenised and RNA

139
extracted using the GenElute™ Mammalian Total RNA MiniPrep Kit (Sigma Aldrich)
as previously described in 2.6.1.1. cDNA was synthesised using the SuperScript® II
Reverse Transcriptase kit (Life Technologies, described in 2.7.1).
Pathology Number
Control 34
Endometriosis 24
Ovarian Cancer 13
Fibroids 4
Endometrial Cancer 4
Table 5.1 - A summary of the pathologies and numbers pertaining to the clinical
tissue samples used in this study.
5.3.1 Analysis of reference gene stability in ovarian clinical tissue samples using
the geNorm™ 12 gene kit
Commonly used reference genes for qPCR experiments can lack the expressional
stability that they were once thought to have (Gutierrez et al., 2008). A reference
gene’s stability is cell type and context dependent; it cannot be taken for granted
that interpatient variability will not affect expression. It is becoming more widely
accepted that an explorative test should be carried out for each set of samples to
determine a suitable reference gene in each case (Bustin et al., 2009; Jacob et al.,
2013). According to MIQE (Minimum Information for the Publication of
Quantitative Real-Time qPCR) guidelines, reference gene expression should be
stably and strongly correlated with total mRNA expression. As ovarian cancer is a
highly heterogeneous disease, it is particularly prudent to assess reference gene
stability in ovarian tumour tissue samples. geNorm™ (Primerdesign) is a
commercially available assessment kit for suitable reference genes within a sample
set. The geNorm™ human 12 gene kit assesses twelve different human reference
genes for average expression stability and the optimum number of reference genes
to use in qPCR experiments for each set of samples.

140
Eight clinical samples were selected to represent the whole cohort and were tested
in triplicate using the geNorm™ 12 gene kit (Primerdesign). An equal number of
samples were used from each group to eliminate bias towards any variable. The kit
contains primers for ATB5P, SDHA, B2M, UBC, ACTB, 18S RNA, GAPDH, TOP1, CYC1,
EIF4A2, YWHAZ and RPL13A (detailed in Section 2.9). 2X PrecisionPlus™ qPCR
MasterMix (Primerdesign) was used on a 7900HT Fast thermal cycler (Life
Technologies, described in Section 2.9). cDNA was used at a concentration of
5ng/µL as per manufacturer’s instruction. qPCR results were analysed using qBase+
software (Biogazelle).
Figure 5.1 - 12 genes from the geNorm™ 12 gene kit (Primerdesign) were assessed
for expressional stability in a selection of cDNAs from clinical samples representing
the whole cohort. Data were analysed with qBase+ software (Biogazelle). qBase+
provides a geNorm™ M value representing expressional stability; a low M value
indicates greater expressional stability. The graph shows genes in order of least
stable to most stable (left to right). The most stable genes were RPL13A and
YWHAZ.
geNorm™ M value (Figure 5.1) represents average gene expression stability within
the samples tested. A lower M value confers greater stability. The genes are
arranged on the graph in order of stability, the least stable being on the left and the
most stable on the right.

141
Figure 5.2 - 12 genes from the geNorm™ 12 gene kit (Primerdesign) were assessed
for expressional stability in a selection of cDNAs from clinical samples representing
the whole cohort. Data were analysed with qBase+ software (Biogazelle). qBase+
provides a geNorm™ V graph showing cumulative variability of successive genes
indicating how many must be used in each qPCR experiment for optimum
normalisation. Working from left to right, the first column to achieve a value below
0.15 represents the optimum number of reference genes to use with these samples.
In this case, 2-3 reference genes is acceptable.
The geNorm™ V graph (Figure 5.2) shows the optimal number of reference genes to
use for the samples tested, measured by the average variation in stability between
each successive gene. A V value of less than 0.15 is considered acceptable
(Primerdesign, 2014). The first column on the graph shows the V value of the three
most stably expressed genes (RPL13A, YWHAZ and EIF4A2). Each additional column
to the right shows the V value of the previous column plus the next stable gene.
The first column to achieve a value below 0.15 shows the optimum number of
reference genes to use. In this case, qBase+ recommends two to three reference
genes (MIQE guidelines suggest that at least two reference genes are used). In this
case, the two most stable genes are RPL13A (ribosomal protein L13A; a gene that
encodes a component of the 60S ribosomal subunit) and YWHAZ (a gene that
encodes a 14-3-3 signal transduction protein). Going forward, these reference
genes will be used in qPCR experiments involving these clinical samples as they
have been proven stable enough to provide robust normalisation.

142
5.3.2 Gene expression analysis of mTOR, DEPTOR, rictor and raptor in ovarian
tissue clinical samples from patients with ovarian cancer, endometrial cancer,
endometriosis and fibroids
We first sought to assess the gene expression of mTOR pathway components in
ovarian tumour tissue samples. qPCR was performed in triplicate on the ovarian
cDNAs for mTOR, DEPTOR, rictor and raptor using the reference genes RPL13A and
YWHAZ. Power SYBR® Master Mix (Life Technologies) was used on a 7900HT Fast
thermal cycler (Life Technologies, described in 2.10.3).
Figure 5.3 - qPCR for mTOR, DEPTOR, rictor and raptor was carried out using the
reference genes RPL13A and YWHAZ in triplicate on cDNA synthesised from the
extracted RNA from ovarian tissue of ovarian cancer patients and non-affected
controls. Data were analysed using the ΔCq method and an RQ value calculated by
2-ΔCq. An F-test was performed to assess variance between groups and two-tailed,
unpaired Student’s t-tests were performed to assess significance. Error bars depict
standard error and asterisks denote significance. Results show a significant increase
in DEPTOR expression (p=0.0007) and a significant decrease in rictor expression
(p=0.0388) in comparison to control.

143
Figure 5.4 - qPCR for mTOR, DEPTOR, rictor and raptor was carried out using the
reference genes RPL13A and YWHAZ in triplicate on cDNA synthesised from the
extracted RNA from ovarian tissue of Endometriosis patients and non-affected
controls. Data were analysed using the ΔCq method and an RQ value calculated by
2-ΔCq. An F-test was performed to assess variance between groups and two-tailed,
unpaired Student’s t-tests were performed to assess significance. Error bars depict
standard error and asterisks denote significance. mTOR and raptor showed a
significant increase in expression (A, p=<0.0001 for both groups). Rictor showed no
significant change over all but when segregated by age of patient (20-29 years and
30-39 years) and grade points (below 50 and above 50) significant changes were
seen. Rictor showed a significant increase in patients aged 20-29 years (p=0.0004)
but not in patients aged 30-39 years (B). There was also a significant increase in
rictor expression in patients with disease grade points above 50 (p=0.0004) but not
in those with a disease grade below 50 (C).
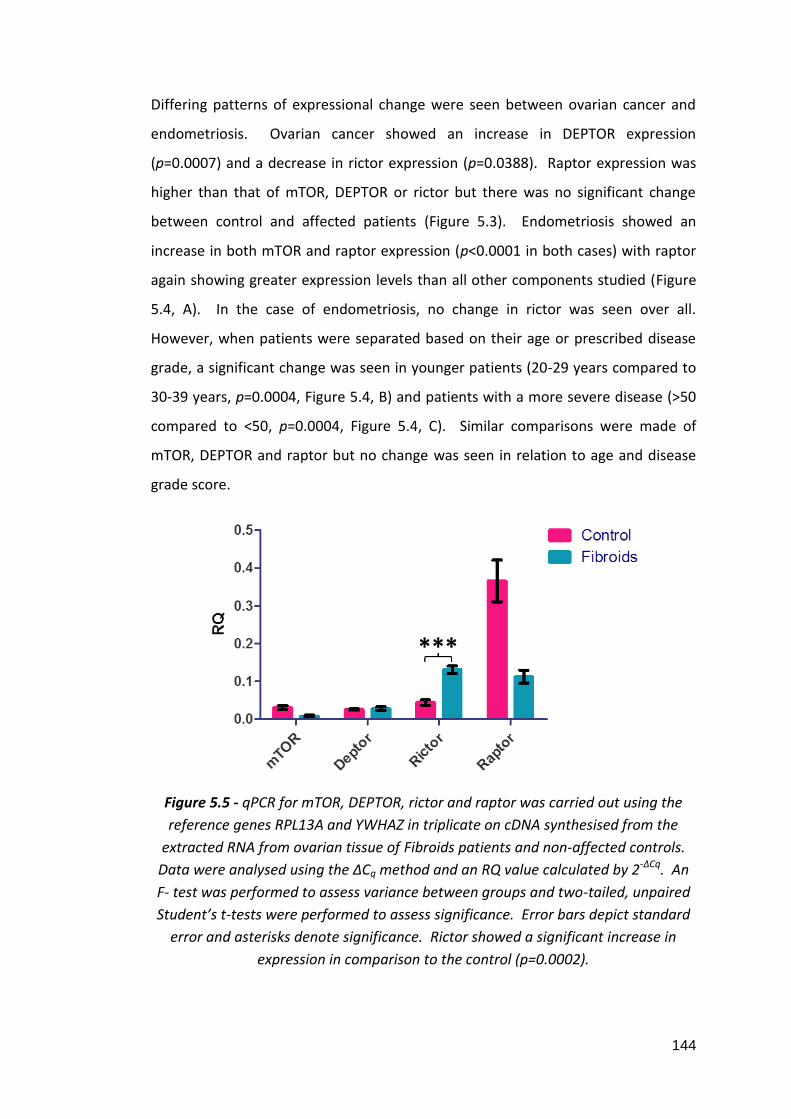
144
Differing patterns of expressional change were seen between ovarian cancer and
endometriosis. Ovarian cancer showed an increase in DEPTOR expression
(p=0.0007) and a decrease in rictor expression (p=0.0388). Raptor expression was
higher than that of mTOR, DEPTOR or rictor but there was no significant change
between control and affected patients (Figure 5.3). Endometriosis showed an
increase in both mTOR and raptor expression (p<0.0001 in both cases) with raptor
again showing greater expression levels than all other components studied (Figure
5.4, A). In the case of endometriosis, no change in rictor was seen over all.
However, when patients were separated based on their age or prescribed disease
grade, a significant change was seen in younger patients (20-29 years compared to
30-39 years, p=0.0004, Figure 5.4, B) and patients with a more severe disease (>50
compared to <50, p=0.0004, Figure 5.4, C). Similar comparisons were made of
mTOR, DEPTOR and raptor but no change was seen in relation to age and disease
grade score.
Figure 5.5 - qPCR for mTOR, DEPTOR, rictor and raptor was carried out using the
reference genes RPL13A and YWHAZ in triplicate on cDNA synthesised from the
extracted RNA from ovarian tissue of Fibroids patients and non-affected controls.
Data were analysed using the ΔCq method and an RQ value calculated by 2-ΔCq. An
F- test was performed to assess variance between groups and two-tailed, unpaired
Student’s t-tests were performed to assess significance. Error bars depict standard
error and asterisks denote significance. Rictor showed a significant increase in
expression in comparison to the control (p=0.0002).

145
Figure 5.6 - qPCR for mTOR, DEPTOR, rictor and raptor was carried out using the
reference genes RPL13A and YWHAZ in triplicate on cDNA synthesised from the
extracted RNA from ovarian tissue of Endometrial Cancer patients and non-affected
controls. Data were analysed using the ΔCq method and an RQ value calculated by
2-ΔCq. An F-test was performed to assess variance between groups and two-tailed,
unpaired Student’s t-tests were performed to assess significance. Error bars depict
standard error and asterisks denote significance. Rictor showed a significant
increase in expression in comparison to the control (p<0.0001).
Fibroids and Endometrial cancer showed very similar expression profiles for mTOR,
DEPTOR, rictor and raptor. The only component they both showed a significant
change in was an increase in rictor compared to control (p=0.0002 and <0.0001
respectively). In both cases, a marked reduction in raptor can be seen but these
results did not reach statistical significance (Figures 5.5 and 5.6).
5.3.3 In silico analysis of mTOR pathway component gene expression levels in
normal and ovarian cancer patients
In order to assess mTOR pathway component gene expression in a large cohort of
patients, we utilised the in silico analysis method Oncomine™. Oncomine™
(oncomine.org) is an online resource combining large DNA microarray datasets
(Rhodes et al., 2004). We used Oncomine™ to perform ‘Cancer vs. Normal’ analysis
in datasets with greater than 50 samples. mTOR, DEPTOR and raptor expression
was analysed but due to low sample size, rictor data was not suitable for analysis.

146
5.3.3.1 mTOR
Figure 5.7 - mTOR gene expression data from the Bonome et al., dataset plotted by
Oncomine showing the mean mTOR gene expression in control ovarian surface
epithelium (1, n=10) and ovarian carcinoma (2, n=185). Boxes represent the 25th-
75th percentile (with median line), bars show the 10th-90th percentile and dots
show the complete spread of data. A 1.166 fold increase in mTOR expression was
seen (p=0.002) (Bonome et al., 2008).
Figure 5.8 - mTOR gene expression data from the TCGA dataset plotted by
Oncomine showing the mean mTOR gene expression in control ovary (1, n=8) and
ovarian serous cystadenocarcinoma (2, n=586). Boxes represent the 25th-75th
percentile (with median line), bars show the 10th-90th percentile and dots show the
complete spread of data. A 1.122 fold increase in mTOR expression was seen
(p=0.034) (The Cancer Genome Atlas, 2015).
Oncomine analysis supports the mTOR gene expression data in this study. A small
increase in mTOR expression was seen in ovarian cancer in comparison to controls
(Figure 5.7, 1.166 fold increase, p=0.002 and Figure 5.8, 1.122 fold increase,
p=0.034)

147
5.3.3.2 DEPTOR
Figure 5.9 - DEPTOR gene expression data from the Yoshihara et al., dataset plotted
by Oncomine showing the mean DEPTOR gene expression in control peritoneum (1,
n=10) and ovarian serous adenocarcinoma (2, n=43). Boxes represent the 25th-75th
percentile (with median line), bars show the 10th-90th percentile and dots show the
complete spread of data. A 1.683 fold increase in DEPTOR expression was seen
(p=0.019) (Yoshihara et al., 2009).
Oncomine analysis supports the DEPTOR gene expression data in this study. A
significant increase in DEPTOR expression in comparison to control (Figure 5.9,
1.683 fold increase, p=0.019).
5.3.3.3 Raptor
Figure 5.10 - Raptor gene expression data from the Yoshihara et al., dataset plotted
by Oncomine showing the mean raptor gene expression in control peritoneum (1,
n=10) and ovarian serous adenocarcinoma (2, n=43). Boxes represent the 25th-75th
percentile (with median line), bars show the 10th-90th percentile and dots show the
complete spread of data. A non-significant 1.410 fold decrease in raptor expression
was seen (p=0.998) (Yoshihara et al., 2009).

148
In concurrence with the data in this study, a non-significant decrease in raptor
expression was seen in ovarian cancer in comparison to control (Figure 5.10, 1.410
fold decrease, p=0.998).
5.3.4 Protein expression analysis of mTOR, DEPTOR, rictor, raptor and p70S6
kinase in paraffin embedded ovarian tissue clinical samples from patients with
malignant cancer
We next sought to evaluate protein expression of mTOR pathway components in
different stages, grades and types of ovarian cancer. Tissue arrays (detailed in
Section 2.5.2) were probed for mTOR, DEPTOR, rictor, raptor and phosphorylated
p70S6 kinase by immunohistochemistry using the DAB method as described
previously (Section 2.13). Three areas of each tissue sample were selected at
random and total cells and total positive cells were counted in each area. An
average percentage of positive cells was calculated.

149
5.3.4.1 mTOR
Figure 5.11 - Immunohistochemistry for mTOR was performed on paraffin
embedded ovarian tissue clinical samples from epithelial and germ cell ovarian
tumours. F-Tests were performed to assess variance and unpaired, two-tailed
Student’s t-tests with Welch’s correction for unequal variance used to assess
significance. Error bars depict standard error. No significant change was detected
between epithelial and germ cell tumours (A). B and C show representative images
of clear cell carcinoma (epithelial) and dysgerminoma (germ) respectively.

150
Figure 5.12 - Immunohistochemistry for mTOR was performed on paraffin
embedded ovarian tissue clinical samples from grade I, grade II and grade III ovarian
tumours. F-Tests were performed to assess variance and unpaired, two-tailed
Student’s t-tests with Welch’s correction for unequal variance used to assess
significance. Error bars depict standard error. No significant change was detected
between grade of tumour (A). B and C show representative images of grade II and
grade III serous papillary carcinoma respectively.

151
Figure 5.13 - Immunohistochemistry for mTOR was performed on paraffin
embedded ovarian tissue clinical samples from stage I, stage II, stage III and stage
IV ovarian tumours. F-Tests were performed to assess variance and unpaired, two-
tailed Student’s t-tests with Welch’s correction for unequal variance used to assess
significance. Error bars depict standard error. No significant change was detected
between stage of disease (A). B and C show representative images of stage I and
stage IV serous papillary carcinoma respectively.

152
5.3.4.2 DEPTOR
Figure 5.14 - Immunohistochemistry for DEPTOR was performed on paraffin
embedded ovarian tissue clinical samples from epithelial and germ cell ovarian
tumours. F-Tests were performed to assess variance and unpaired, two-tailed
Student’s t-tests with Welch’s correction for unequal variance used to assess
significance. Error bars depict standard error. No significant change was seen
between epithelial and germ cell tumours (A). B and C show representative images
of serous papillary carcinoma (epithelial) and teratoma (germ) respectively.

153
Figure 5.15 - Immunohistochemistry for DEPTOR was performed on paraffin
embedded ovarian tissue clinical samples from grade I, grade II and grade III ovarian
tumours. F-Tests were performed to assess variance and unpaired, two-tailed
Student’s t-tests with Welch’s correction for unequal variance used to assess
significance. Error bars depict standard error. A significant decrease was seen
between grade II and grade III (A). B and C show representative images of grade II
and grade III serous papillary carcinoma respectively.
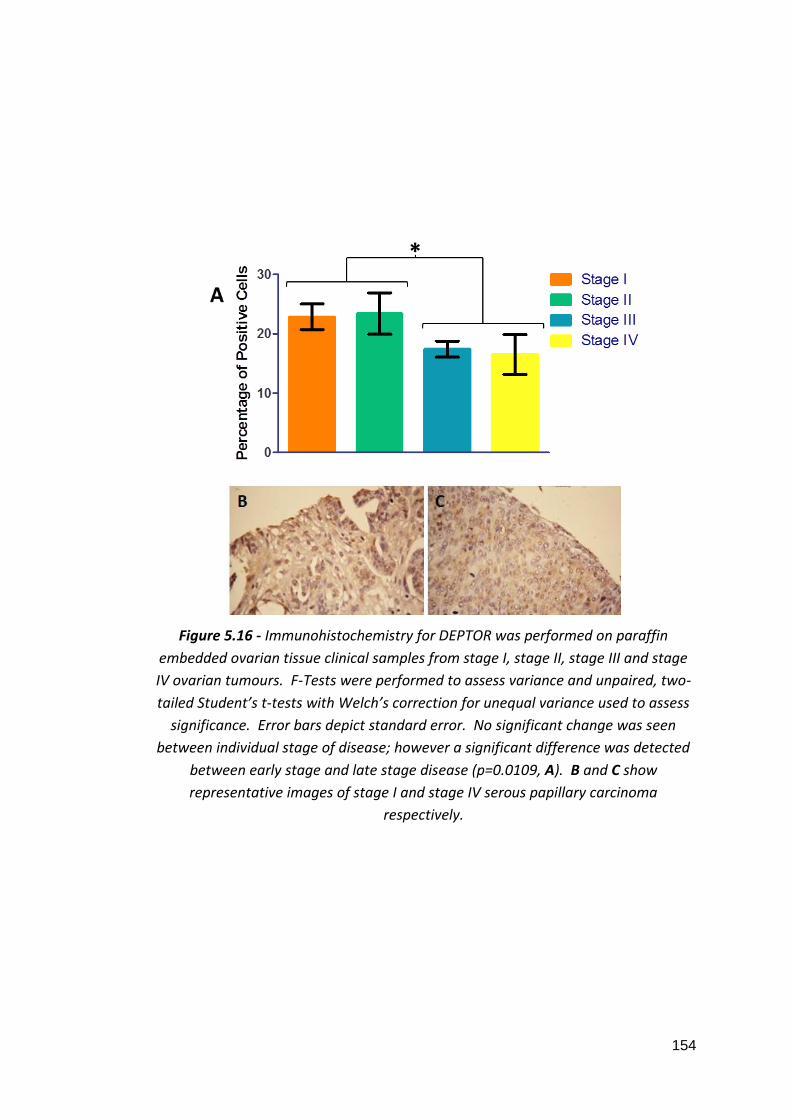
154
Figure 5.16 - Immunohistochemistry for DEPTOR was performed on paraffin
embedded ovarian tissue clinical samples from stage I, stage II, stage III and stage
IV ovarian tumours. F-Tests were performed to assess variance and unpaired, two-
tailed Student’s t-tests with Welch’s correction for unequal variance used to assess
significance. Error bars depict standard error. No significant change was seen
between individual stage of disease; however a significant difference was detected
between early stage and late stage disease (p=0.0109, A). B and C show
representative images of stage I and stage IV serous papillary carcinoma
respectively.

155
5.3.4.3 Rictor
Figure 5.17 - Immunohistochemistry for rictor was performed on paraffin embedded
ovarian tissue clinical samples from grade I, grade II and stage III ovarian tumours.
F-Tests were performed to assess variance and unpaired, two-tailed Student’s t-
tests with Welch’s correction for unequal variance used to assess significance. Error
bars depict standard error. No significant change was seen between grade of
tumour (A). B and C show representative images of grade I and grade III serous
papillary carcinoma respectively.

156
5.3.4.4 Raptor
Figure 5.18 - Immunohistochemistry for raptor was performed on paraffin
embedded ovarian tissue clinical samples from epithelial and germ cell ovarian
tumours. F-Tests were performed to assess variance and unpaired, two-tailed
Student’s t-tests with Welch’s correction for unequal variance used to assess
significance. Error bars depict standard error. No staining was seen in germ cell
tumours (A). B and C show representative images of clear cell carcinoma (epithelial)
and a germ cell tumour respectively.

157
Figure 5.19 - Immunohistochemistry for raptor was performed on paraffin
embedded ovarian tissue clinical samples from grade I, grade II, grade III and stage
I, stage II, stage III and stage IV ovarian tumours. F-Tests were performed to assess
variance and unpaired, two-tailed Student’s t-tests with Welch’s correction for
unequal variance used to assess significance. Error bars depict standard error. No
significant change was seen between grade (A) or stage (B) of tumour. C and D
show representative images of grade I/stage I and grade III/stage III serous papillary
carcinoma respectively.

158
5.3.4.5 p70S6 Kinase
Figure 5.20 - Immunohistochemistry for p70S6 kinase was performed on paraffin
embedded ovarian tissue clinical samples from epithelial and germ cell ovarian
tumours. F-Tests were performed to assess variance and unpaired, two-tailed
Student’s t-tests with Welch’s correction for unequal variance used to assess
significance. Error bars depict standard error. A significant decrease was seen in
germ cell tumours in comparison to epithelial tumours (A). B and C show
representative images of serous papillary carcinoma (epithelial) and a germ cell
tumour respectively.

159
Figure 5.21 - Immunohistochemistry for p70S6 kinase was performed on paraffin
embedded ovarian tissue clinical samples from grade I, grade II and grade III ovarian
tumours. F-Tests were performed to assess variance and unpaired, two-tailed
Student’s t-tests with Welch’s correction for unequal variance used to assess
significance. Error bars depict standard error. No significant change was seen
between grade of tumour (A). B and C show representative images of grade I and
grade III serous papillary carcinoma respectively.

160
Figure 5.22 - Immunohistochemistry for p70S6 kinase was performed on paraffin
embedded ovarian tissue clinical samples from stage I, stage II, stage III and stage
IV ovarian tumours. F-Tests were performed to assess variance and unpaired, two-
tailed Student’s t-tests with Welch’s correction for unequal variance used to assess
significance. Error bars depict standard error. No significant change was seen
between individual stage of disease; however a significant difference was detected
between early and late stage disease (p=0.0461, A). B and C show representative
images of stage I and stage IV serous papillary carcinoma respectively.

161
mTOR and raptor showed no significant changes between epithelial or germ cell
tumours or when comparing grade or stage of tumour (Figures 5.11, 5.12, 5.13,
5.18 and 5.19). Although not significant, raptor did show a trend towards
increasing protein expression with deteriorating stage of ovarian cancer (Figure
5.19, B). DEPTOR also showed no significant difference in protein expression
between epithelial and germ tumours (Figure 5.14); however, a significant but
subtle decrease was noted between grade II and grade III tumours (Figure 5.15,
p=0.05). A significant decrease in DEPTOR expression was detected in late stage
disease in comparison to early stage (Figure 5.16, p=0.0109). No significant change
in rictor expression was detected in different grades of disease (Figure 5.17). p70S6
kinase expression was significantly higher in epithelial tumours than in germ cell
tumours (Figure 5.20, p=0.0389) but showed no significant change between grades
(Figure 5.21, A). A significant increase in p70S6 kinase expression was detected in
late stage disease in comparison to early stage (Figure 5.22, p=0.0461).
5.3.5 In silico analysis of survival in relation to mTOR pathway component
biomarker expression
We used the Kaplan-Meier Plotter to assess how the expression of mTOR pathway
components mTOR and DEPTOR relate to patient survival. The Kaplan-Meier
Plotter (kmplot.com) is an online resource allowing for the assessment of biomarker
expression in relation to survival. The Kaplan-Meier Plotter combines Affymetrix
microarray data from the Gene Expression Omnibus (GEO), the European Genome-
phenome Archive (EGA) and The Cancer Genome Atlas (TCGA) to provide survival
data in relation to biomarkers in breast, ovarian, lung and gastric cancers (Győrffy
et al., 2013). Unfortunately rictor and raptor are not available for analysis on the
Kaplan-Meier Plotter.

162
5.3.5.1 mTOR Overall Survival
Figure 5.23 - Kaplan-Meier plot showing overall survival probability of ovarian
cancer patients. High (n=788) and low (n=794) expressors of mTOR are shown over
a 250 month (20 year) period. There is no significant difference in overall survival
between high and low expressors of mTOR (p=0.31).
Figure 5.24 - Kaplan-Meier plot showing overall survival probability of ovarian
cancer patients. High (n=219) and low (n=220) expressors of mTOR with TP53
mutation are shown over a 250 month (20 year) period. There is greater overall
survival in low mTOR expressors when TP53 is mutated (p=0.0083).
No correlation between mTOR expression and overall survival is seen (Figure 5.20).
However, patients with low expression of mTOR have a significantly greater chance
of overall survival when the TP53 gene is mutated (Figure 5.21, p=0.0083).

163
5.3.5.2 DEPTOR Overall Survival
Figure 5.25 - Kaplan-Meier plot showing overall survival probability of ovarian
cancer patients. High (n=791) and low (n=791) expressors of DEPTOR are shown
over a 250 month (20 year) period. High DEPTOR expressors show a significant
improval in survival than low DEPTOR expressors (p=0.011).
Figure 5.26 - Kaplan-Meier plot showing overall survival probability of stage III and
IV ovarian cancer patients. High (n=574) and low (n=574) expressors of DEPTOR are
shown over a 250 month (20 year) period. High DEPTOR expressors show a
significant improval in survival than low DEPTOR expressors (p=0.028).
Consistent with its role as an mTOR pathway inhibitor, high expression of DEPTOR
was related to greater overall survival (Figure 5.25, p=0.011). This was particularly
evident for stage III and IV ovarian cancer patients (Figure 5.26, p=0.028).

164
5.4 Discussion
In this chapter we studied the expression of mTOR components at gene and protein
level in clinical samples. No change was seen in mTOR expression in ovarian cancer,
fibroids or endometrial cancer by qPCR and Oncomine patient analysis showed a
small (1.122-1.166 fold) increase in mTOR expression in ovarian carcinoma in
comparison to normal ovarian surface epithelium. These data agree with previous
research which showed that mTOR gene expression levels did not change between
ovarian cancer, benign ovarian tumours and normal ovarian tissue (Laudański et al.,
2011). In addition, it has been shown that expression of phosphorylated mTOR has
no bearing on prognosis in epithelial ovarian cancer tissue (No et al., 2011). Kaplan-
Meier plots revealed that mTOR does not affect survival except in ovarian cancers
with TP53 mutation, where patients with low mTOR expression showed greater
survival. The TP53 gene product, p53, is a tumour suppressor protein which
controls the expression of PTEN, a lipid phosphatase that dephosphorylates PIP3 to
the inactive form PIP2 and thereby downregulates mTOR signalling via PI3 kinase
(Weng et al., 1999; Leslie et al., 2000; Sun et al., 1999; Thorpe et al., 2015). In the
absence of p53, the attenuating effects of PTEN on mTOR signalling is lost and it
may follow that increased mTOR expression would augment mTOR signalling and
result in an unfavourable prognosis in these cases. This is further supported by
data showing that phosphorylated S6, a target of p70S6 kinase, is increased in p53
knockout mice (Leontieva et al., 2013).
Ovarian cancer is most often epithelial in origin (CRUK, 2014b) but can also develop
from germ and stromal cells. We were able to compare mTOR, DEPTOR, raptor and
phosphorylated p70S6 kinase protein expression in ovarian cancers of both
epithelial and germ cell origin. In the cases of mTOR, DEPTOR and raptor, no
significant difference was detected between epithelial and germ cell tumours but
phosphorylated p70S6 kinase was significantly decreased in germ cell tumours in
comparison to epithelial cell tumours. Patients with germ cell tumours typically
have a better prognosis than those with epithelial tumours with five year survival
being up to 97.4% in comparison to 46% for epithelial ovarian cancer

165
(Chatchotikawong et al., 2015; Neeyalavira and Suprasert, 2014; Saber et al., 2014;
CRUK, 2015h). These data support this in showing that mTORC1 signalling is
decreased in germ cell tumours suggesting that the growth and proliferative effects
of mTORC1 signalling are decreased in these cases.
Ovarian cancer patients expressed increased DEPTOR in comparison to unaffected
controls and these data were supported by Oncomine analysis. DEPTOR is an mTOR
interacting protein that is inhibitory to both mTORC1 and mTORC2. DEPTOR loss
increases both mTORC1 (p70S6 kinase/4EBP1) and mTORC2 (Akt) signalling
consistent with its role as an mTOR inhibitor; however, overexpression of DEPTOR
causes overactivation of mTORC2 signalling (Peterson et al., 2009; Kazi et al., 2011).
This may be because inhibition of mTORC1 relieves a negative feedback loop
directed towards the upstream PI3 kinase. This then overcomes mTORC2 inhibition
by DEPTOR which in turn hyperactivates mTORC2 signalling (Peterson et al., 2009)
and suggests that inhibition of mTORC2 by DEPTOR is not as robust as that of
mTORC1. DEPTOR has been shown to be underexpressed in many cancers including
that of the prostate, bladder and cervix but it is overexpressed in multiple
myelomas, thyroid cancers and taxol resistant ovarian cancer cell lines (Peterson et
al., 2009; Foster et al., 2010; Pei et al., 2011). An increase in DEPTOR expression
may represent a transformation in the balance of signalling from mTORC1 to
mTORC2. The mTORC2 complex activates Akt which is known to promote cell
survival (Dudek et al., 1997) and mTORC2 dependent phosphorylation of Akt has
been shown to be increased in ovarian cancer tissue in comparison to control tissue
(De Marco et al., 2013). If ovarian cancer progression is driven predominantly by
mTORC2, mTORC1 targeting drug therapies would be ineffective in the treatment of
this disease. Indeed, rapalogues, which robustly inhibit mTORC1 signalling but have
little effect on mTORC2 signalling have not demonstrated the advance in cancer
treatment that was expected from them with only few licenced uses for malignancy
(Laplante and Sabatini, 2012).
An increase in phosphorylated p70S6 kinase expression was detected in later stages
of ovarian cancer. p70S6 kinase is a downstream effector of the mTOR pathway

166
which is active when phosphorylated by mTORC1 (Isotani et al., 1999; Burnett et al.,
1998). Phosphorylation of p70S6 kinase leads to activation of translation initiation
factors which cause protein translation and cell growth (Ma and Blenis, 2009; Holz
et al., 2005). These data show that phosphorylation of p70S6 kinase and therefore
the downstream growth effects of mTORC1 signalling are more active as ovarian
cancer progresses and that increased mTORC1 signalling, which is responsible for
p70S6 kinase activation, confers an unfavourable prognosis. These data support
previous findings that p70S6 kinase overexpression is related to an increase in
recurrence and metastasis in breast cancer and metastasis in ovarian cancer (van
der Hage et al., 2004; Ip et al., 2014). In addition, DEPTOR protein expression was
shown to decrease in higher grade and later stage ovarian cancers. Ovarian cancer
grading and staging is a method of classifying ovarian cancer based on its
differentiation, location and metastasis; higher grade and later stage ovarian
cancers are considered more severe as the degree of differentiation of cells
decreases and metastasis increases (CRUK, 2014a). This may suggest a switch in
mTOR mediated responses in ovarian cancer; initial malignancy is mediated by
mTORC2 and mTORC1 signalling predominates in later stages. However, it should
be noted that ovarian cancer is not a homogenous disease, therefore these changes
in signalling pathways may be subtype, stage or grade related.
In endometriosis, there was no significant change in rictor expression over all;
however, when patients were compared based on age and disease grade, a
significant increase was seen in younger patients (20-29 years compared to 30-39
years) and patients with higher disease grade score (>50 compared to <50).
Differential expression of mTOR, DEPTOR and raptor was not seen based on age or
disease grade in endometriosis. Endometriosis grade represents severity of disease
based on location and infiltration of adhesions (American Society for Reproductive
Medicine, 1997). Endometriosis is primarily a pre-menopausal condition as
endometrium proliferates in response to oestrogen. As women age and enter a
menopausal state, oestrogen is no longer produced by the ovaries and the
endometrium no longer proliferates and sheds with menstrual cycles. This
translates to a decrease in severity of endometriosis symptoms with increasing age.

167
A more pronounced expressional change seen in rictor in younger patients may be
related to the effect of oestrogen. Indeed, oestrogen has previously been shown to
interact with the mTOR pathway, with oestrogen treatment causing
phosphorylation of mTOR, p70S6 kinase and 4EBP1 (Sudhagar et al., 2011) and the
oestrogen receptor has been shown to bind to the P85α regulatory subunit of PI3
kinase in response to oestrogen stimulation (Simoncini et al., 2000). Because
oestrogen secretion decreases with menopause, higher rictor expression in younger
patients may be explained by increased levels of oestrogen in premenopausal
cases. Given that the influence of oestrogen on the development and progression
of ovarian cancer remains unclear, it will be of interest to study the impact of sex
hormones on mTOR signalling in ovarian cancer cells. Martin et al., found that
rictor expression was higher in oestrogen receptor positive breast cancers in
comparison to oestrogen receptor negative breast cancers (Martin et al., 2014). In
addition to this, mouse models of ovarian cancer which involve KRAS activation and
PTEN deletion and result in increased mTOR, Akt and p70S6 kinase phosphorylation
show high levels of oestrogen receptor expression (Dinulescu et al., 2005). There
was also an increase in raptor observed in endometriosis. An increase in mTOR
combined with raptor expression in endometriosis suggests that mTOR pathway
signalling is more heavily weighted to the mTORC1 complex in this condition as
raptor is a component unique to mTORC1 (Hara et al., 2002). An increase in
mTORC1 signalling has been observed in many conditions including intellectual
disability, tuberous sclerosis and diabetes (Troca-Marín et al., 2012; Wataya-
Kaneda, 2015; Nyman et al., 2014).
The data in this study present the differential regulation of mTOR signalling
components in malignancies and borderline conditions. Collectively, our data
suggests that a transformation from mTORC1 to mTORC2 signalling may occur in
the progression from endometriosis to ovarian cancer and that DEPTOR status may
be responsible for this. It may be useful to study the phosphorylation statuses of
Akt, NDRG1 or PKCα to determine if mTORC2 signalling is altered in different
disease states. More detailed analysis of mTORC1 and mTORC2 signalling must be
carried out to fully elucidate the extent to which each pathway is active in ovarian

168
cancer and endometriosis and provide appropriate druggable targets. Interpatient
variation as well as the alleviation of the negative feedback loop to PI3 kinase which
occurs with mTORC1 inhibition and the paradoxical effects of DEPTOR expression
makes predicting changes in mTOR pathway signalling difficult and this must be
fully understood to effectively develop methods of diagnosing and treating these
conditions.

169
Chapter 6 Development of a PoCT platform for ovarian
cancer
6.1 Introduction
PoCT is the implementation of a full suite of diagnostic procedures (obtaining a
sample, sample preparation, testing and diagnosis) in a single visit to a primary or
secondary health care provider (NHS, 2014). Many PoCTs are routinely used by the
National Health Service (NHS) in the UK. For example blood gas analysis, blood
glucose monitors and HIV tests (NHS, 2015c). Advantages of PoCT include
decreased wait time, improved and more rapid treatment, reduced visits to a
healthcare provider, reduced hospitalisation burden and decreased costs (NHS,
2015e). qPCR, a method of amplifying and quantifying genetic material, is a
fundamental procedure in both research and medical laboratories. qPCR allows for
accurate quantification of gene transcripts in real time and has eliminated the need
for end-point analysis with the addition of fluorescent probes or DNA binding dyes
(Tania Nolan, 2013; Stephen A. Bustin, 2014). qPCR is well established as a
diagnostic tool and a range of ‘off the shelf’ tests for pathogen detection are
available (Cepheid, 2015); however, a typical 40-cycle qPCR test can take up to two
hours to complete (Tania Nolan, 2013). In pathogen detection, for example, speed
is of critical importance, not only to isolate the pathogen but to ensure rapid
treatment, and could be the difference between life and death in some cases.
Historically, the limiting factors in the speed of qPCR experiments have been the
sample preparation time and the ‘ramping rate’ or time taken to move between the
required temperatures in a cycle (i.e. from 95°C to 60°C to 72°C). The length of a
qPCR test must be improved if it is to become a useful tool in PoCT.
qPCR machines, which function to cycle samples through temperatures 40 times or
more, have typically used a peltier and conductive block system; however, some

170
more recently developed products have attempted to overcome the speed and
accuracy limitations by using alternative methods of heating. Namely, heated air
(Rotor-Gene® Q, Qiagen) and resistive heating (xxpress®, BJS Biotechnologies).
However, increasing speed has the potential to compromise thermal uniformity, an
important factor affecting the accuracy and reproducibility of a qPCR test (Tania
Nolan, 2013). xxpress® by BJS Biotechnologies is a prototype thermal cycler that
claims to be the fastest and most thermally active available. The xxpress®
technology employs a technique known as resistive heating to achieve active and
multizonal thermal control over the sample area. In conventional peltier based
thermal cyclers the sample plate is a separate unit to the conductive block which is
heated and cooled to apply temperature changes to the samples. The xxpress®
system combines the conductive component and sample plate into one consumable
item, allowing for close contact (approximately 10μM) (BJS Biotechnologies, 2015a)
between the reagents and the heating source and therefore allowing the sample to
closely mimic the desired temperature (Figure 6.1) (BJS Biotechnologies, 2015b).
Figure 6.1 - An image of the three xxplate™ well configurations available (24, 54 and
96 wells) showing the unique design of the xxpress® consumable. Image courtesy of
BJS Biotechnologies.

171
The use of resistive heating as an alternative to peltiers translates to a significant
speed advantage for the xxpress® thermal cycler. Six electrical contact points allow
the passage of current through the element (Figure 6.2). The element is made of
very thin aluminium and so has reduced thermal mass in comparison to typical
blocks. Because of this, heat can be driven in at a much faster rate meaning a 40-
cycle qPCR experiment can be completed in less than 10 minutes (Tania Nolan,
2013). In addition to speed, accuracy is also important to provide reliable and
reproducible data. If the thermal uniformity across the sample plate is low,
samples will experience different thermal environments and, as important factors
such as primer binding are reliant on accuracy of temperature, the integrity of the
experiment is lost. The xxplate™ is designed so that thermal control of the sample
area can be multizonal to adjust for greater heat loss at the edges (Figure 6.3). The
software algorithm uses 12 different routes for current to travel through the
conductive component (Figure 6.3) to deliver heat to specific areas meaning that
the thermal uniformity across the sampling area can be within 0.3°C. The
temperature of the sample area is measured 100 times a second by nine non-
contact infra-red sensors resulting in temperature that is under active control and
can be rapidly adjusted to maintain uniformity (Tania Nolan, 2013).
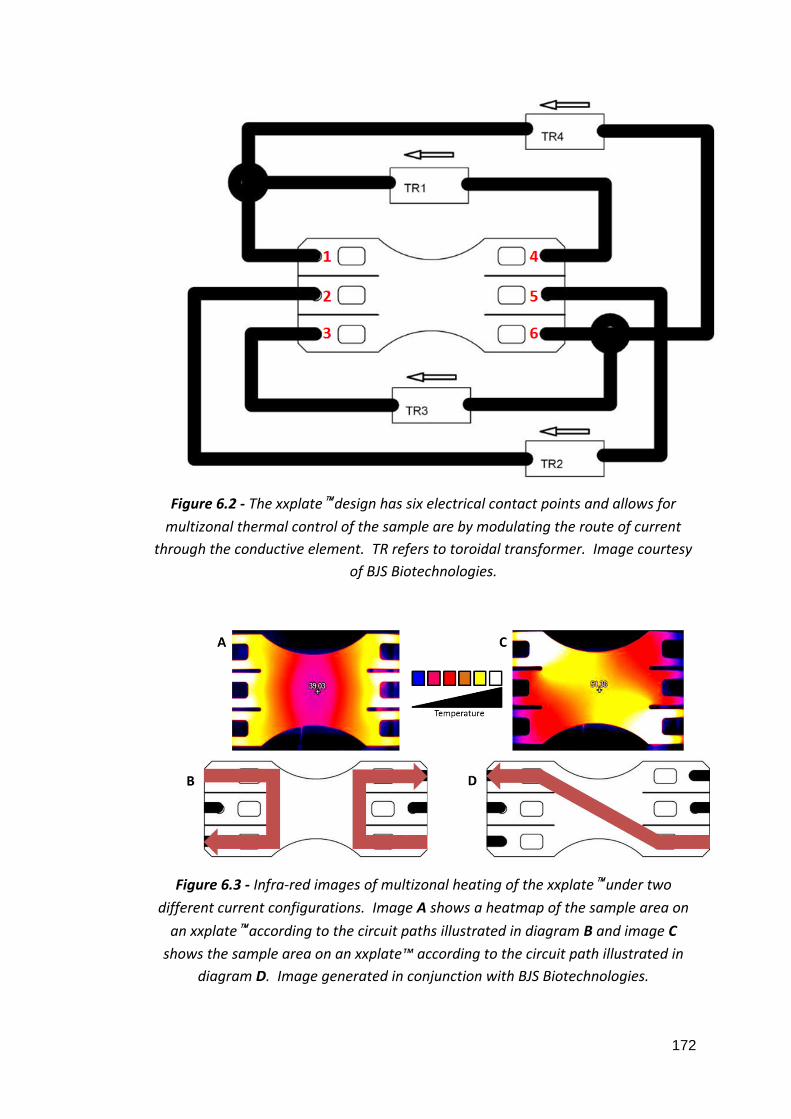
172
Figure 6.2 - The xxplate™ design has six electrical contact points and allows for
multizonal thermal control of the sample are by modulating the route of current
through the conductive element. TR refers to toroidal transformer. Image courtesy
of BJS Biotechnologies.
Figure 6.3 - Infra-red images of multizonal heating of the xxplate™ under two
different current configurations. Image A shows a heatmap of the sample area on
an xxplate™ according to the circuit paths illustrated in diagram B and image C
shows the sample area on an xxplate™ according to the circuit path illustrated in
diagram D. Image generated in conjunction with BJS Biotechnologies.

173
6.2 Objectives
-To compare speed, efficiency and variability of four current, commercially available
qPCR thermal cyclers, two of which use the industry standard peltier/block system
and two of which use novel heating systems.
-To assess how the xxpress® (BJS Biotechnologies) compares to industry standard
thermal cyclers and which, if any, are suitable for development into a platform for
rapid diagnostic clinical testing.
-To assess instrument usability in terms of level of training needed and adaptability
to a PoCT scenario.
-To develop a proof of principle assay to demonstrate PoC biomarker detection in
ovarian cancer for development on xxpress® technology.
6.3 Results
6.3.1 Reaction Efficiency and Time
Company qPCR Platform Thermal System Advertised
Fastest Ramp
Rate
Advertised
Thermal
Uniformity
Bio-Rad CFX96™ Block/Peltier 2.5°C per second ±0.4°C
BJS Biotechnologies xxpress® Resistive
heating/active
control
10°C per second ±0.3°C
Life Technologies 7900HT Fast Block Peltier 3°C per second ±0.5°C
Qiagen Rotor-Gene® Q Heated Air 15°C per second ±0.02°C
Table 6.1 - A summary of the qPCR thermal cyclers compared.

174
We first sought to assess qPCR reaction efficiency across four different thermal
cycler platforms. 18S rRNA amplification in commercially available human DNA was
assessed and compared by qPCR using CFX96™ (Bio-Rad), xxpress® (BJS
Biotechnologies), 7900HT Fast (Life Technologies) and Rotor-Gene® Q (Qiagen)
thermal cyclers (Table 6.1).
A dilution series of hgDNA was created to include 100, 10, 1, 0.1 and 0.01ng/μL
(final concentrations: 5, 0.5, 0.05, 0.005 and 0.0005ng/μL) in order to generate a
standard curve. Previously validated eukaryotic 18S rRNA gene primers (Foster et
al., 2010) were used (detailed in Section 2.10.1). KAPA Biosystems’ SYBR® FAST
qPCR master mix was used across all thermal cyclers (as described in Section 2.10.4)
using the following thermal profile:
Temperature Time Cycles
95°C 20 seconds 1
95°C 1 second 40
60°C 10 seconds
Table 6.2 - Thermal profile for qPCR experiments on hgDNA.
Ramping and cooling rates and all modifiable parameters were used at the
manufacturers’ pre-set levels. Each concentration of hgDNA was run in triplicate.
Speed of experiment was measured from the time the machine was initiated to the
time results were obtainable and rounded to the nearest minute.

175
Figure 6.4 - A dilution series of hgDNA was used to create a standard curve of 18S
RNA expression on CFX96™, xxpress®, 7900HT Fast and Rotor-Gene® Q thermal
cyclers. Correlation coefficient and efficiency were calculated in addition to protocol
run time. Correlation coefficient and efficiency varied between thermal cyclers. All
thermal cyclers were able to operate over the same linear dynamic range.
Figure 6.4 shows the amplification efficiency of each thermal cycler. In the Δ or ΔΔ
quantification cycle (Cq) qPCR analysis methods, amplification efficiency is assumed
to be equal across GOIs and reference genes. An amplification efficiency of 100%
indicates that the PCR product is doubling with every cycle. Efficiency is calculated
as follows (Kennedy and Oswald, 2011):
E = 10(1-slope)-1
An efficiency in the range of of 90-110% is considered acceptable (Kennedy and
Oswald, 2011). The only thermal cycler to achieve an efficiency within the
acceptable range was the xxpress® (BJS Biotechnologies) at 95.81%. Correlation
coefficient (R2), a measurement of linear correlation, depicts how well the
individual data points relate to their slope. An R2 value of 0.975 or higher is
considered acceptable for qPCR experiments (Kennedy and Oswald, 2011). The

176
only thermal cycler to not achieve an acceptable R2 value was the CFX96™ at 0.918.
The time to complete a 40-cycle experiment varied between machines. The fastest
machine by a marked amount was the xxpress® (BJS Biotechnologies) at 12
minutes. The rest of the cyclers ranged from 45 to 58 minutes (Table 6.3). Each
machine was able to operate over the same linear dynamic range.
Thermal Cycler Time to complete 40 cycles
(minutes)
Acceptable
efficiency
Acceptable
correlation
coefficient
CFX96™ 48 X X
xxpress® 12 ✔ ✔
7900HT 58 X ✔
Rotor-Gene® Q 45 X ✔
Table 6.3 - A summary of time, efficiency and correlation coefficients for 18S RNA
expression assay in human gDNA carried out on four thermal cyclers.
6.3.2 Reaction Uniformity
We next assessed the uniformity of qPCR reactions across the sample area of each
thermal cycler consumable. Reaction uniformity was assessed using qPCR by
measuring amplification of 18S rRNA in a selection of wells with covering all areas
of the sample plate on CFX96™ (Bio-Rad), xxpress® (BJS Biotechnologies), 7900HT
Fast (Life Technologies) and Rotor-Gene® Q (Qiagen) thermal cyclers. Human DNA
at 100ng/µL (final concentration of 5ng/µL) was used in all wells with the thermal
protocol detailed above.

177
Figure 6.5 - qPCR with a fixed template concentration of 5ng/μL hgDNA was carried
out for 18S RNA in a selection of wells covering all areas of the sample plate on each
thermal cycler to investigate if the sample location on the plate affects fluorescence
and Cq. Figure 6.5 demonstrates the fluorescence variability across the sampling
areas of the CFX96™ and 7900 HT Fast thermal cyclers at each cycle of the protocol.
The CFX96™ showed a doming effect over the well rows (A). The 7900HT Fast
appears to experience a substantial edge effect on the bottom row of the sample
plate (B).
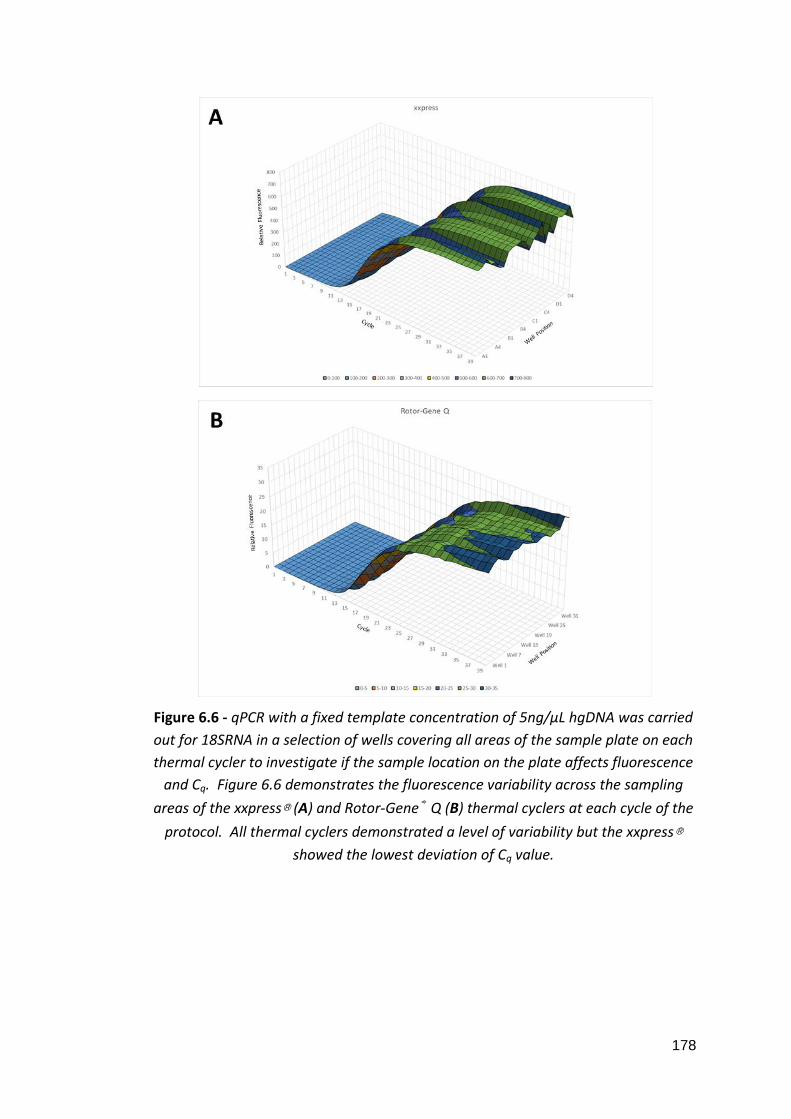
178
Figure 6.6 - qPCR with a fixed template concentration of 5ng/μL hgDNA was carried
out for 18SRNA in a selection of wells covering all areas of the sample plate on each
thermal cycler to investigate if the sample location on the plate affects fluorescence
and Cq. Figure 6.6 demonstrates the fluorescence variability across the sampling
areas of the xxpress® (A) and Rotor-Gene® Q (B) thermal cyclers at each cycle of the
protocol. All thermal cyclers demonstrated a level of variability but the xxpress®
showed the lowest deviation of Cq value.

179
Figure 6.7 - qPCR with a fixed template concentration of 5ng/μL hgDNA was carried
out for 18SRNA in a selection of wells covering all areas of the sample plate on each
thermal cycler to give an indication of how the sample location on the plate can
affect fluorescence and Cq. Figure 6.7 shows the average Cq value among technical
replicates for each of the thermal cyclers. Error bars depict standard deviation.
Figures 6.5 and 6.6 show the fluorescence uniformity across the sample area of
each sample plate. Each uniformity graph provides a visual representation of the
level of variation across each sample area. Figure 6.7 shows the average Cq value
for each of the thermal cyclers with error bars depicting standard deviation (SD).
The SD of Cq values within identical reactions on a sample plate indicates the
repeatability of an assay. Without extraneous variables the fluorescence for
technical replicates would be identical at each cycle; however thermal and optical
variation can cause fluorescence outputs to fluctuate. This fluctuation can cause Cq
variation in what should otherwise be stable values. In this experiment, the
7900HT Fast (Life Technologies) showed the greatest Cq variation with a value of
1.91 (Figure 6.7). xxpress® showed the least variation with a value of 0.29 (Figure
6.7). Although MIQE guidelines state that intra-assay variation as a measure of
repeatability should be reported for all qPCR experiments, no parameters of
acceptable variation have been described.

180
6.3.3 Biomarker Detection in Whole Blood
PoC detection of biomarkers is not currently a routine procedure in primary or
secondary healthcare. As we have previously demonstrated DEPTOR upregulation
in ovarian cancer, we investigated if DEPTOR gene expression changes could be
detected in whole blood of ovarian cancer patients in comparison to unaffected
controls. RNA was extracted from whole blood of 7 ovarian cancer patients and 6
unaffected controls using the QIAamp® RNA Blood Mini Kit (Qiagen, Section 2.6.3).
cDNA was synthesised from extracted RNA using the nanoScript™ 2 cDNA synthesis
kit (Primerdesign). qPCR was performed on cDNA using primers for DEPTOR and
18S RNA (section 2.10.1). Power SYBR® Master Mix was used on a 7900HT Fast
thermal cycler (Life Technologies, described in Section 2.10.3). Three technical
replicates were performed for each sample.
Figure 6.8 - Relative DEPTOR expression was measured by qPCR in the whole blood
of ovarian cancer patients and unaffected controls and ovarian tissue of ovarian
cancer patients and unaffected controls. cDNA was synthesised from extracted RNA
and data were analysed using the ΔCq method. An RQ value calculated by 2-ΔCq. An
F-test was performed to assess variance between groups and a two-tailed, unpaired
Student’s t-tests was performed to assess significance. Error bars depict standard
error and asterisks denote significance. DEPTOR expression was increased in
ovarian cancer patients in comparison to controls; this change did not achieve
significance (p=0.0817). As previously shown, DEPTOR expression was also
increased in ovarian cancer patients in comparison to controls (p=0.0007).

181
DEPTOR mRNA was detected in greater quantity in the whole blood of ovarian
cancer patients in comparison to unaffected controls although this change did not
reach statistical significance. These findings are in concordance with detection of
significantly greater levels of DEPTOR in ovarian tumour tissue in comparison to
unaffected controls (Figure 6.8).
6.4 Discussion
In this chapter we assessed the performance of qPCR instrumentation and
investigated if gene expression changes are detectable in whole blood by qPCR. As
rapid developments are made in PoCT, it is essential that the pitfalls and drawbacks
of this technique are understood. It is often the case that machinery operators
have a disconnected relationship with the equipment they are using and may not
fully understand the restraints on the data they have generated. In a healthcare
setting, it is not only speed and accuracy of qPCR that are of consideration.
Thought must be given to the operator of the test who is unlikely to have
laboratory training (NHS, 2015d). Ideally, the machine would be intuitive, recognise
samples (i.e. through barcodes or other means that avoid user input) and guide the
user through the set-up process with little chance of error. Many commercially
available pieces of laboratory instrumentation are unusable without at least some
level of training which, in a low resource environment, is not always practical.
The 7900HT Fast by Life Technologies is an industry standard machine, the sample
tray is placed in a metal block which is heated and cooled using a peltier
(ThermoFisher Scientific, 2015). The CFX96™ by Bio-Rad has improved the block
design by reducing its thermal mass to allow faster heat transfer and an improved
ramp rate (Bio-Rad, 2015). In addition to being a relatively slow method of heating
and cooling, block/sample tray methods have an added disadvantage of creating a
large thermal barrier between sample and heat source (caused, in part, by the thick
plastic sample tray). This can result in a disparity between temperature of block
and temperature of sample and can lead to discrepency between the desired

182
temperature and the actual temperature of the sample. Furthermore, block based
systems often experience what is known as the ‘edge effect’ in which the rate of
heat transfer is greatest around the edges of the block. This results in the lower
temperatures at the peripheral areas of the sample plate (Kennedy and Oswald,
2011). The Rotor-Gene® Q and xxpress® have made attempts to overcome these
issues with novel heating and cooling methods. The Rotor-Gene® Q by Qiagen uses
a centrifugal system by which samples are arranged in a ring formation and are
rotated through heated or cooled air (Qiagen, 2015). As samples are not fixed in
place, they are able to experience the same temperatures without variability arising
from the edge effect. xxpress® by BJS Biotechnologies employs a different heating
method again, resistive heating. The consumable in this case consists of both the
sample tray and the heat source with 10μm of polymer separating the two (BJS
Biotechnologies, 2015a). Electricity is passed through the block component of the
PCR plate whose temperature is monitored in real-time and is therefore under
active control. With this technology, any thermal uniformity issues can be quickly
corrected by passing more or less current through specific sample areas (BJS
Biotechnologies, 2015a). Despite xxpress® technology having a fixed, block-based
sampling area, the lack of thermal uniformity usually noted in these models should
be eliminated due to active control heating. This has been confirmed in this study;
xxpress® had lowest standard deviation in Cq value of all four machines studied.
An acceptable reaction efficiency was achieved only by the xxpress® thermal cycler.
Common methods of qPCR analysis do not account for variations in efficiency
between reactions (Bustin et al., 2009). In research settings where qPCR
experiments are designed by the user, efficiency is not always assessed prior to the
commencement of data generation. This assessment has shown that efficiency
cannot be assumed to be within acceptable limits and that optimisation may be
required; this may include adjusting thermal or time parameters, and template and
primer concentration. For the purpose of comparison, experimental design,
template and primer concentrations and thermal protocol were kept constant
between each thermal cycler; however, with optimisation, it may be possible to

183
achieve efficiency within acceptable parameters on each of the thermal cyclers
tested. This highlights the importance of instrument specific optimisation.
Variability in fluorescence may also be due to the optical system in place within the
thermal cycler (i.e. the excitation source and method of fluorescence detection). It
would be advantageous to design an experiment to distinguish between these two
variables. For example, a thermochromic material which will change colour at
different temperatures could be used to assess temperature variations across the
plate. In addition to this, measuring fluorescence from a fluorophore without
applying temperature will demonstrate optical fluctuations.
Despite using novel thermal techniques which stray from the industry standard, the
xxpress® and Rotor-Gene® Q thermal cyclers demonstrated that they can compete
with, and in some cases exceed, the CFX96™ and 7900HT Fast instruments. The
speed of the xxpress® instrument’s ramp rate, due to resistive heating, did not
compromise the efficiency of the reaction and the close contact between the
reaction and the heat source may have provided an improvement; making the
xxpress® thermal cycler a potential candidate for a PoCT system. Moreover, the
xxpress® user interface could be easily adapted to be operated by non-technical
users.
An accelerated qPCR test in the research lab is a useful improvement, but in
healthcare settings where an infectious pathogen may be present, the advantages
of a fast and reliable test can not be overstated. For example, in the case of sepsis,
a life threatening inflammatory condition caused by bacterial or fungal infection,
the time between onset of infection and serious illness can be short and over 50%
of sepsis patients die of their disease (Engel et al., 2007). Patients are often treated
for sepsis before a positive test result is returned; however, appropriate treatment
which covers the specific microbe can greatly improve survival in sepsis patients
(Hanon et al., 2002). A rapid diagnosis resulting in swift and appropriate treatment

184
can mean the difference between life and death for some and could save costs in
preemptive and erroneous treatment before a confirmed diagnosis.
As previously mentioned, there is currently no effective screening method available
for ovarian cancer. Ovarian cancer biomarkers such as CA125 have been proven to
be ineffective for many reasons including low specificity (Buys et al., 2011; Menon
et al., 2015). Current diagnostic methods for ovarian cancer are time consuming
and invasive; with the emergence of circulating tumour cells (CTCs), readily
available in the blood, there is renewed hope of developing a tool that may serve as
a surrogate biomarker. CTCs are cells that have detached from a primary or
metastatic tumour and migrated into the circulatory system (Azevedo et al., 2015).
We hypothesised therefore, that if CTCs have entered circulation from the primary
tumour, their gene profile would resemble the one of the tissue they came from.
Since we have shown that DEPTOR is upregulated in the tissue of ovarian cancer
patients, we sought to investigate if the same readout could be detected in RNA
extracted from whole blood. Upregulation of DEPTOR gene expression was evident
in the blood of ovarian cancer patients compared to unaffected controls, mimicking
our previous data obtained from ovarian cancer tissue. Detection of CTCs by blood
extraction (known as a liquid biopsy) holds potential as a minimally invasive method
of screening for ovarian cancer which could improve prognosis by detecting
malignancy at an earlier stage and prompting earlier commencement of treatment.

185
Chapter 7
General Discussion and Concluding Remarks
7.1 Why is this research important?
The advances made in cancer treatment have not mirrored other diseases;
chemotherapeutic treatments are often poorly tolerated and paradoxically
carcinogenic. Ovarian cancer is particularly lethal due to ambiguous symptoms and
lack of reliable biomarkers leading to late stage diagnosis and unfavourable
prognosis. To date, there is no discrete, non-invasive screening method to detect
ovarian cancer. Currently, CA125 and transvaginal ultrasound are used when
ovarian cancer is suspected, at which point the majority of cancers have reached
stages III or IV (Buys et al., 2011). In addition to this, using CA125 as a screening
marker has shown low specificity which increases the risk of screening related
harms such as unnecessary surgery and no improvement in survival (Buys et al.,
2011). Daily, nineteen women are diagnosed with ovarian cancer in the UK; more
than twelve of these are expected to have died of their disease after 10 years
(CRUK, 2015g). If improvements are to be made in the prognosis of ovarian cancer,
efforts must be focussed on the development of effective screening methods.
Disease detected at stage I benefits from a 98% survival rate (CRUK, 2015h) and an
effective and fast, single point screening assay would increase the amount of
ovarian cancers detected at this stage.
7.2 How is the mTOR pathway implicated in ovarian cancer?
The mTOR pathway is responsible for the control of growth and proliferation in
response to cellular and extracellular cues (Laplante and Sabatini, 2012). mTOR
pathway deregulation has been shown in patients as well as in vivo and in vitro
studies of ovarian cancer and the mTOR pathway represents a potential target in
the treatment of this disease (Castellvi et al., 2006; No et al., 2011; Zhang et al.,

186
2015; Masoumi-Moghaddam et al., 2015; De Marco et al., 2013; Zhou and Wong,
2006; Meng et al., 2006; Pon et al., 2008; Bian et al., 2010; Ip et al., 2014; Im-aram
et al., 2013; Foster et al., 2010). We showed that the mTOR pathway components
show differential patterns of expression in ovarian cancer and endometriosis. We
used fibroids and endometrial cancer as a benign and malignant comparison of
conditions unrelated to ovarian cancer and showed that neither condition
resembles ovarian cancer in terms of mTOR complex component expression profile.
We showed that mTOR complex inhibitor DEPTOR is increased in tumour tissue and
blood from ovarian cancer patients but decreased in later stage and higher grade
disease when phosphorylation of p70S6 kinase increases, indicating increased
mTORC1 signalling. In silico cancer survival analysis by Kaplan-Meier plot showed
that mTOR component expression plays a role in survival. High expression of
DEPTOR relates to improved overall survival. mTOR is not related to survival unless
the TP53 gene, encoding the p53 tumour suppressor gene is mutated. In these
cases, survival is improved for patients who express lower levels of mTOR.
Collectively, these data present strong evidence of DEPTOR modulation in the
progression of ovarian cancer.
7.3 What role does mTOR pathway inhibition play in the treatment of ovarian
cancer?
In this study we showed that SKOV3 and MDAH-2774 cells have no apoptotic
response to mTOR pathway inhibition by demonstrating no caspase pathway
activation and no increase in dead cell number in response to Rapamycin,
rapalogues, Resveratrol or NVP BEZ-235. However, we were able to show that
Rapamycin, rapalogues and dual inhibitors exert a cytostatic effect on these cells.
Previous studies have shown that rapalogues can potentiate the cytotoxic effects of
DNA damaging agents such as Tamoxifen, Doxorubicin, UCN-01 and Cisplatin, even
at levels below their usual efficacy (Treeck et al., 2006; Avellino et al., 2005; Hahn et
al., 2005; Beuvink et al., 2005), providing evidence that mTOR pathway inhibition is
an effective combinatorial approach to the treatment of ovarian cancer. At the
time of writing, a vast number of clinical trials investigating the use of combinatorial

187
mTOR pathway inhibitors in ovarian cancer are underway; a number of these are
detailed in Table 7.1.
mTOR Pathway
Inhibitor(s)
Title of Study
Rapamycin Vaccine Therapy With or Without Sirolimus in Treating
Patients With NY-ESO-1 Expressing Solid Tumors
Everolimus Single Arm Trial With Combination of Everolimus and
Letrozole in Treatment of Platinum Resistant Relapse or
Refractory or Persistent Ovarian Cancer/Endometrial
Cancer
Deforolimus Carboplatin/Taxol/Ridaforolimus in Endometrial, Ovarian
and Solids
Temsirolimus Temsirolimus, Carboplatin, and Paclitaxel as First-Line
Therapy in Treating Patients With Newly Diagnosed Stage
III-IV Clear Cell Ovarian Cancer
Table 7.1 - Examples of currently active clinical trials using rapalogues in the
treatment of ovarian cancer (Table adapted from clinicaltrials.gov).
Despite the vast heterogeneity detected in ovarian cancers, there is no divergence
in therapeutic techniques. In demonstrating that MDAH-2774 cells are more
resistant to mTOR pathway inhibition, we have highlighted the need for
personalised medicine in the treatment of different ovarian cancer subtypes.
Tumour heterogeneity must be accounted for in ovarian cancer therapeutics.
7.4 How could CTCs form the basis of a PoCT for ovarian cancer?
CTCs are tumour cells which have dissociated from a primary or metastatic tumour
and are present in the circulatory system (Azevedo et al., 2015). CTCs have been
detected in many cancers including breast, ovarian and prostate (Engel et al., 1999;
Lowes et al., 2015). CTCs are thought to be a major cause of metastasis although
little is known of the mechanism by which they enter the bloodstream or colonise

188
new locations (Azevedo et al., 2015). Despite this, CTCs represent a useful,
minimally invasive source of cancer RNA, known as a liquid biopsy, for biomarker
detection by qPCR. We have demonstrated a preliminary proof of principle assay
showing that DEPTOR RNA is upregulated in the blood of ovarian cancer patients
and can be detected by qPCR. Genetic analysis by liquid biopsy could provide a
window into a PoC diagnostic test for ovarian cancer. Further work needs to
expand this study with a larger cohort of patients in order to confirm our findings.
7.5 What are the limitations of this research?
Interpatient variation is likely to mask trends in gene and protein changes,
particularly if they are subtle, that may be seen in respective cancer types. In this
study, cDNA synthesised from clinical samples was used to assess the expressional
change of mTOR signalling component genes; paraffin embedded tissue samples
were used to visualise protein expression of these components. Samples were
taken from individual patient tumours (or unaffected tissue) and specific gene
aberrations are unlikely to be identical to any other patient in the cohort; ovarian
cancer is recognised as a strikingly heterogenous condition. The higher standard
deviation of RQ values and percentage of positively stained cells seen in this study
may be due to interpatient variation and may translate to a lack of statistical
significance in some of the changes seen. For example, in the cases of fibroids and
endometrial cancer, a marked decrease in raptor gene expression can be seen;
however, no statistical significance can be garnered from the change. High
interpatient variation in ovarian cancer, due to individual differences, provides an
additional hurdle in the quest for a suitable method of early diagnosis and
prognostic prediction (Jordan et al., 2003; Prado et al., 2014).
Tumour composition can also be highly heterogenous and recent developments in
single-cell analytics have shown that cells from the same tumour may be geno- and
phenotypically different from one another. Single cells taken from tumour tissue
have shown modulations in oncogenic, proliferative and immune signalling,
differential response to UVB irradiation and chemotherapeutics, differences in PI3

189
kinase mutation and gene expression of multiple transcripts including ERBB2,
growth factor receptors and KRAS (Miwa et al., 2015; Kim et al., 2015; Janiszewska
et al., 2015; Shalek et al., 2014; Patel et al., 2014). This type of heterogeneity has
also been noted in cultured cells (Shalek et al., 2013; Bai et al., 2015) and the
SKOV3 cell line has been shown to contain cells with high and low invasive and
migratory potential (Bai et al., 2015). SKOV3 cells with increased and decreased
invasive potential differ in their proliferative rate (higher in highly invasive cells),
apoptotic rate (lower in highly invasive cells), response to cisplatin and taxol (lower
in highly invasive cells) and tumourigenicity in nude mice (higher in highly invasive
cells) (Bai et al., 2015). SKOV3 cells also showed differential expression of mTOR
pathway components including higher gene and protein expression of PIK3CA and
mTOR and lower gene and protein expression of PTEN in highly invasive cells (Bai et
al., 2015). These data present evidence of previously uncharacterised diversity
between cells within the same culture. This may provide an explanation of the high
level of variability seen in experiments involving SKOV3 and MDAH-2774 cell lines.
In addition to inter-patient variation, another cause for increased variability in
immunohistochemical analysis is the variable nature of the analysis method. As
mentioned, ovarian tumours can be highly heterogenous and different cell types
within a tumour may express mTOR pathway components to different extents.
Each tissue sample was taken from an unspecified area of a tumour and may have
contained multiple tissue types that were phenotypically different. Three areas of
each tissue sample were selected at random and total and positive number of cells
were counted. The amount of positively stained cells may have varied from area to
area depending on the area of tumour being observed. Immunohistochemistry by
DAB staining is a semi-quantitative method of analysis; number of cells showing
expression are counted but expression levels cannot be determined using this
method as DAB does not follow Beer-Lambert’s law (there is not a direct
relationship between staining intensity and protein expression) (van der Loos,
2008). This may account for discrepancies between gene and protein expression.
RNA was extracted from a large tissue sample which was likely to contain multiple
tumour cell types; however, only three small areas of tissue were samples for

190
protein expression. It is less likely that analysis of protein expression would have
taken into account as many areas of the tumour as RNA expression analysis did and
therefore may have excluded areas containing cells expressing high or low levels of
mTOR, DEPTOR, rictor, raptor and phosphorylated p70S6 kinase, masking any
significant increases or decreases in expression.
On a wider scale, tumour heterogeneity may present a barrier to effective
treatment. Ovarian cancer has a low survival rate in part due to a high rate of
chemotherapy resistance. A tumour which appears primarily responsive to
chemotherapy often develops resistance and recurrence rate is high. This may be
due to a subpopulation of resistant cells which remain and continue to proliferate
after treatment.
7.6 What are the future directions of this work?
7.6.1 Increase sample size
We have investigated expression of mTOR pathway components in ovarian tumour
tissue samples (n=13) and whole blood (n=7) from ovarian cancer patients. In
future, these results must be expanded to include a larger clinical cohort in order to
confirm the changes seen in this study. The differences seen between stages,
grades and types of ovarian cancer should be further characterised in a larger
population of patients as this could be used to better understand prognostic
factors. As aspects such as ethnicity can affect gene expression (Knappskog et al.,
2014), patients from a wide range of backgrounds should be included. In addition
to this, immunohistochemical staining should also be performed on unaffected
control tissues in order to further dissect the changes that occur in mTOR, DEPTOR,
rictor, raptor and p70S6 kinase expression in ovarian cancer patients.

191
7.6.2 Optimise PoC blood assay
We were able to demonstrate an increase in DEPTOR mRNA in the blood of ovarian
cancer patients by qPCR. This assay should be optimised for use on a fast thermal
cycler such as xxpress® for development for use as a PoCT. Below is a flow diagram
depicting a proposed screening method for ovarian cancer patients. The majority
of ovarian cancers present over the age of 50 years (CRUK, 2012) however, patients
with familial BRCA mutation are at high risk of ovarian cancer under this age
(Ingham et al., 2013; Mavaddat et al., 2013). We propose that patients over 50 and
high risk patients are screened annually. A negative result should be accompanied
by information on the symptoms of ovarian cancer (i.e. abdominal distension, early
satiety, irritable bowel syndrome-like symptoms) for self-monitoring. A positive
result can initiate further testing such as transvaginal ultrasound to confirm
diagnosis and more prompt commencement of treatment (Figure 7.1).
Figure 7.1 - Suggested patient screening stream. Patients over 50 years of age and
high risk patients should be screened annually for ovarian cancer biomarkers such
as DEPTOR. A positive result prompts further confirmation such as transvaginal
ultrasound and earlier commencement of treatment.
7.6.3 Further elucidate the cytostatic effects of mTOR pathway inhibition
We observed cytostatic effects exerted by mTOR pathway inhibitors in SKOV3 and
MDAH-2774 cell lines. Future work should look at cell cycle progression markers

192
such as the expression of cyclin B1 and phosphorylation of cyclin dependent kinase
1 (CDK1) which are increased at G2/M transition (Porter and Donoghue, 2003) and
proliferating cell nuclear antigen (PCNA) which increases at the G1/S transition
(Stewart and Dell’orco, 1992) by qPCR and western blot in order to further examine
cell cycle arrest in these cells. Further understanding of how mTOR pathway
inhibitors cause cytostatic effects will allow greater exploitation of their benefits.
7.6.4 Use additional in vitro models to study the effects of mTOR pathway
inhibition
This study used two epithelial ovarian adenocarcinoma cell lines as in vitro models
of ovarian cancer. The cell lines differed in their cells of origin, SKOV3 cells are clear
cell derived and MDAH-2774 are endometrioid. Using these cell lines we were able
to study the two forms of malignancy most associated with endometriosis (Pearce
et al., 2012; Brinton et al., 2005; Merritt et al., 2008). However, a useful addition to
this comparison may have been a non-malignant ovarian surface epithelial cell line
such as the IOSE (immortalised ovarian surface epithelial) cell line or TIOSE
(telomerase immortalised ovarian surface epithelial) cell line (Lanitis et al., 2012;
Zorn et al., 2003). In addition to non-malignant ovarian surface epithelial cells, a
human endometriosis cell line such as FbEM-1 cell line (Bouquet de Jolinière et al.,
1997) would have provided a useful insight into how proliferation, mTOR pathway
activation, apoptosis and wound healing differ in endometriosis, a strong ovarian
cancer risk factor.
7.6.5 Investigate the role of MAP kinase signalling in ovarian cancer
We demonstrated that MDAH-2774 cells have a higher proliferative capacity,
increased mTOR and raptor expression and are less responsive to mTOR pathway
inhibition than SKOV3 cells and suggest that this may be due to MAP kinase
pathway upregulation. The MAP kinase pathway is an upstream regulator of mTOR
signalling (Ma and Blenis, 2009) and additional inhibition of this pathway may
provide a supplementary source of mTOR inhibition and anticancer therapy in the

193
subset of ovarian cancer patients with KRAS and BRAF mutation. The effects of
inhibitors such as UO126 (MEK1/2 inhibitor), 6H05 (K-Ras inhibitor) and AZ 628 (B-
Raf inhibitor) on proliferation should be studied in combination with mTOR and PI3
kinase inhibitors in cell lines both with and without MAP kinase pathway mutation
to determine if this is pathway does indeed play a role in increasing mTOR signalling
and if it could provide a target for anticancer therapy.
7.6.6 Elucidate the subcellular localisation of mTOR complexes
Currently, little is known of the location of mTOR complexes within cells and reports
have located it in mitochondria of mouse embryonic fibroblasts (3T3) (Desai et al.,
2002), at the cellular membranes of cervical cancer cells (HeLa) (Sabatini et al.,
1999), in the nuclei of rhabdomyosarcoma cell lines (Rh1, Rh30 and Rh41), colon
carcinoma cell lines (HCT8, HCT29 and HCT116) and normal human fibroblasts
(IMR90) and in the cytoplasm of human embryonic kidney (HEK293) and ovarian
cancer (SKOV3) cells (Zhang et al., 2002; Foster et al., 2010). One report has
suggested that mTOR may migrate between the cytoplasm and nucleus and that
this shuttling is required for activation of mTOR downstream effectors p70S6 kinase
and 4EBP1 (Kim and Chen, 2000). Given the wide functional range of the mTOR
pathway, it is unsurprising that the subcellular localisation of mTOR complexes
varies. The localisation of mTOR is likely to be cell and context specific and may
have implications in therapeutic targeting of the mTOR pathway. Future work
should focus on clarifying mTOR location in ovarian cancer cell lines in order to
further understand how this affects mTOR pathway function. It would also be
interesting to investigate if mTOR localisation or shuttling behaviour is changed in
response to treatment with pathway inhibitors. Further understanding of this may
allow us to fully discern how mTOR inhibition exerts downstream effects.
7.6.7 Investigate the stoichiometry of the DEPTOR/mTOR interaction
DEPTOR interacts with mTOR and is an mTORC1 and mTORC2 inhibitor which can
be down or upregulated in cancer. We have shown that DEPTOR expression is a
194
positive prognostic marker in ovarian cancer and is increased in response to mTOR
pathway inhibition, indicating that it functions as a tumour suppressor gene.
Conversely, we have also shown that DEPTOR expression is upregulated in the
tumour tissue and blood of ovarian cancer patients and decreased in higher grade
disease, suggesting oncogenic properties. As described previously, DEPTOR
depletion activates both mTORC1 and mTORC2 activity but paradoxically, DEPTOR
overexpression can upregulate mTORC2 activity in a range of cell lines (Peterson et
al., 2009). This suggests that inhibition of mTORC2 by DEPTOR is not as robust as
that of mTORC1 and indicates that DEPTOR does not interact with each mTOR
complex identically. By modifying DEPTOR expression in ovarian cancer cell lines
and assessing activation of mTORC1 (p70S6 kinase Thr389, 4EBP1 Thr37/46) or
mTORC2 (Akt Ser473) specific downstream effectors, the specific effects of DEPTOR
in ovarian cancer cells can be studied. In addition, performing colocalisation
experiments on DEPTOR with mTORC1 and mTORC2 components under basal
conditions and in the presence of mTOR inhibitors will allow us to further
understand the stoichiometry of DEPTOR within the mTOR complexes.
The mTOR complexes differ in their accessory components and there is evidence
mTORC1 and mTORC2 signalling is in competition (Martin et al., 2014). We have
demonstrated evidence that components specific to each complex are deregulated
in gynaecological disease. It would be useful to further elucidate the process by
which the cell selects for mTOR complexes to increase understanding of the balance
of mTORC1 and mTORC2 signalling in order to discern how these pathways are
affected in disease states.
7.7 Concluding Remarks
The exact causes of both ovarian cancer and endometriosis remains elusive with
often conflicting data. The mTOR pathway represents a potential connection
between endometriosis and ovarian cancer and a possible indication as to the high
incidence of ovarian cancer in endometriosis patients. In addition, the mTOR
pathway may represent a druggable target in the treatment of ovarian cancer and

195
endometriosis. Efficacy of mTOR pathway inhibition has thus far been low, in part
due to lack of knowledge of the feedback mechanisms present within the mTOR
pathway which serve to overcome inhibition. More work must be done to elucidate
the activity of the mTOR pathway within ovarian cancer and endometriosis and to
understand in full the effects of mTOR pathway component inhibition on overall
activity.
PoCT is the ultimate goal in the development of diagnostics. Due to the
inefficacious diagnosis of ovarian cancer resulting from a lack of early physical
symptoms, and the invasive procedures currently used to diagnose endometriosis,
it is crucial to determine detectable biomarkers in both conditions with a view to
better detecting and treating them. Both conditions would benefit greatly from
PoCT.

196
Chapter 8
Bibliography
Acién, P., Velasco, I., Acién, M., Capello, C., Vela, P. (2015) Epithelial ovarian cancers and endometriosis. Gynecologic and Obstetric Investigation. 79(2), 126–135.
AddexBio (2015) MDAH-2774 Cells. AddexBio. [online]. Available from: http://www.addexbio.com/productdetail?pid=57.
Afshar, Y., Hastings, J., Roqueiro, D., Jeong, J.-W., Giudice, L.C., Fazleabas, A.T. (2013) Changes in eutopic endometrial gene expression during the progression of experimental endometriosis in the baboon, Papio anubis. Biology of Reproduction. 88(2), 44.
Akane, A., Matsubara, K., Nakamura, H., Takahashi, S., Kimura, K. (1994) Identification of the heme compound copurified with deoxyribonucleic acid (DNA) from bloodstains, a major inhibitor of polymerase chain reaction (PCR) amplification. Journal of Forensic Sciences. 39(2), 362–372.
Alessi, D.R., James, S.R., Downes, C.P., Holmes, A.B., Gaffney, P.R., Reese, C.B., Cohen, P. (1997) Characterization of a 3-phosphoinositide-dependent protein kinase which phosphorylates and activates protein kinase Balpha. Current Biology. 7(4), 261–269.
Alexandre, J., Ray-Coquard, I., Selle, F., Floquet, A., Cottu, P., Weber, B., Falandry, C., Lebrun, D., Pujade-Lauraine, E., GINECO (2010) Mucinous advanced epithelial ovarian carcinoma: clinical presentation and sensitivity to platinum–paclitaxel-based chemotherapy, the GINECO experience. Annals of Oncology. 21(12), 2377–2381.
Amato, R., Menniti, M., Agosti, V., Boito, R., Costa, N., Bond, H.M., Barbieri, V., Tagliaferri, P., Venuta, S., Perrotti, N. (2007) IL-2 signals through Sgk1 and inhibits proliferation and apoptosis in kidney cancer cells. Journal of Molecular Medicine. 85(7), 707–721.
Amemiya, S., Sekizawa, A., Otsuka, J., Tachikawa, T., Saito, H., Okai, T. (2004) Malignant transformation of endometriosis and genetic alterations of K-ras and microsatellite instability. International Journal of Gynecology & Obstetrics. 86(3), 371–376.
American Society for Reproductive Medicine (1997) Revised American Society for Reproductive Medicine classification of endometriosis: 1996. Fertility and Sterility. 67(5), 817–821.

197
Aoyama, T., Matsui, T., Novikov, M., Park, J., Hemmings, B., Rosenzweig, A. (2005) Serum and glucocorticoid-responsive kinase-1 regulates cardiomyocyte survival and hypertrophic response. Circulation. 111(13), 1652–1659.
Arumugam, A., Parada, J., Rajkumar, L. (2012) Mammary cancer promotion by ovarian hormones involves IGFR/AKT/mTOR signaling. Steroids. 77(7), 791–797.
ATCC (2014) SK-OV-3 [SKOV-3; SKOV3] (ATCC® HTB-77TM). ATCC. [online]. Available from: http://www.lgcstandards-atcc.org/Products/All/HTB-77.aspx.
Avellino, R., Romano, S., Parasole, R., Bisogni, R., Lamberti, A., Poggi, V., Venuta, S., Romano, M.F. (2005) Rapamycin stimulates apoptosis of childhood acute lymphoblastic leukemia cells. Blood. 106(4), 1400–1406.
Azevedo, S., Follain, G., Patthabhiraman, S., Harlepp, S., Goetz, J.G. (2015) Metastasis of circulating tumor cells: favorable soil or suitable biomechanics, or both? Cell Adhesion & Migration. 9(5), 345–356.
Bai, H., Li, H., Li, W., Gui, T., Yang, J., Cao, D., Shen, K. (2015) The PI3K/AKT/mTOR pathway is a potential predictor of distinct invasive and migratory capacities in human ovarian cancer cell lines. Oncotarget. 6(28), 25520–25532.
Baskin, R., Sayeski, P.P. (2012) Angiotensin II mediates cell survival through upregulation and activation of the serum and glucocorticoid inducible kinase 1. Cellular Signalling. 24(2), 435–442.
Beaufort, C.M., Helmijr, J.C.A., Piskorz, A.M., Hoogstraat, M., Ruigrok-Ritstier, K., Besselink, N., Murtaza, M., van IJcken, W.F.J., Heine, A.A.J., Smid, M., Koudijs, M.J., Brenton, J.D., Berns, E.M.J.J., Helleman, J. (2014) Ovarian Cancer Cell Line Panel (OCCP): Clinical Importance of In Vitro Morphological Subtypes. PLoS ONE. 9(9), e103988.
Benjamin, D., Colombi, M., Moroni, C., Hall, M.N. (2011) Rapamycin passes the torch: a new generation of mTOR inhibitors. Nature Reviews. Drug Discovery. 10(11), 868–880.
Beral, V., Million Women Study Collaborators, Bull, D., Green, J., Reeves, G. (2007) Ovarian cancer and hormone replacement therapy in the Million Women Study. Lancet. 369(9574), 1703–1710.
Berek, J.S. (2007) Berek & Novak’s Gynecology. Lippincott Williams & Wilkins.
Beuvink, I., Boulay, A., Fumagalli, S., Zilbermann, F., Ruetz, S., O’Reilly, T., Natt, F., Hall, J., Lane, H.A., Thomas, G. (2005) The mTOR inhibitor RAD001 sensitizes tumor cells to DNA-damaged induced apoptosis through inhibition of p21 translation. Cell. 120(6), 747–759.

198
Bian, C.-X., Shi, Z., Meng, Q., Jiang, Y., Liu, L.-Z., Jiang, B.-H. (2010) P70S6K 1 regulation of angiogenesis through VEGF and HIF-1alpha expression. Biochemical and Biophysical Research Communications. 398(3), 395–399.
Bio-Rad (2015) CFX96 Real-Time PCR Detection System. [online]. Available from: http://www.bio-rad.com/webroot/web/pdf/lsr/literature/Bulletin_5589.pdf.
BJS Biotechnologies (2015a) The xxpress direct resistive heating system. [online]. Available from: http://xxpresspcr.com/technology/.
BJS Biotechnologies (2015b) xxpress PCR. xxpress. [online]. Available from: http://xxpresspcr.com/.
Blommaart, E.F., Luiken, J.J., Blommaart, P.J., van Woerkom, G.M., Meijer, A.J. (1995) Phosphorylation of ribosomal protein S6 is inhibitory for autophagy in isolated rat hepatocytes. The Journal of Biological Chemistry. 270(5), 2320–2326.
Böhm, A., Aichberger, K.J., Mayerhofer, M., Herrmann, H., Florian, S., Krauth, M.-T., Derdak, S., Samorapoompichit, P., Sonneck, K., Vales, A., Gleixner, K.V., Pickl, W.F., Sperr, W.R., Valent, P. (2009) Targeting of mTOR is associated with decreased growth and decreased VEGF expression in acute myeloid leukaemia cells. European Journal of Clinical Investigation. 39(5), 395–405.
Bonome, T., Levine, D.A., Shih, J., Randonovich, M., Pise-Masison, C.A., Bogomolniy, F., Ozbun, L., Brady, J., Barrett, J.C., Boyd, J., Birrer, M.J. (2008) A gene signature predicting for survival in suboptimally debulked patients with ovarian cancer. Cancer Research. 68(13), 5478–5486.
Borgfeldt, C., Andolf, E. (2004) Cancer risk after hospital discharge diagnosis of benign ovarian cysts and endometriosis. Acta Obstetricia Et Gynecologica Scandinavica. 83(4), 395–400.
Bouquet de Jolinière, J., Validire, P., Canis, M., Doussau, M., Levardon, M., Gogusev, J. (1997) Human endometriosis-derived permanent cell line (FbEM-1): establishment and characterization. Human Reproduction Update. 3(2), 117–123.
Brana, I., Berger, R., Golan, T., Haluska, P., Edenfield, J., Fiorica, J., Stephenson, J., Martin, L.P., Westin, S., Hanjani, P., Jones, M.B., Almhanna, K., Wenham, R.M., Sullivan, D.M., Dalton, W.S., Gunchenko, A., Cheng, J.D., Siu, L.L., Gray, J.E. (2014) A parallel-arm phase I trial of the humanised anti-IGF-1R antibody dalotuzumab in combination with the AKT inhibitor MK-2206, the mTOR inhibitor ridaforolimus, or the NOTCH inhibitor MK-0752, in patients with advanced solid tumours. British Journal of Cancer. 111(10), 1932–1944.
Brinton, L.A., Gridley, G., Persson, I., Baron, J., Bergqvist, A. (1997) Cancer risk after a hospital discharge diagnosis of endometriosis. American Journal of Obstetrics and Gynecology. 176(3), 572–579.

199
Brinton, L.A., Lamb, E.J., Moghissi, K.S., Scoccia, B., Althuis, M.D., Mabie, J.E., Westhoff, C.L. (2004) Ovarian cancer risk associated with varying causes of infertility. Fertility and Sterility. 82(2), 405–414.
Brinton, L.A., Sakoda, L.C., Sherman, M.E., Frederiksen, K., Kjaer, S.K., Graubard, B.I., Olsen, J.H., Mellemkjaer, L. (2005) Relationship of benign gynecologic diseases to subsequent risk of ovarian and uterine tumors. Cancer Epidemiology, Biomarkers & Prevention. 14(12), 2929–2935.
Brock, T.D., Freeze, H. (1969) Thermus aquaticus gen. n. and sp. n., a Nonsporulating Extreme Thermophile. Journal of Bacteriology. 98(1), 289–297.
Brown, E.J., Albers, M.W., Shin, T.B., Ichikawa, K., Keith, C.T., Lane, W.S., Schreiber, S.L. (1994) A mammalian protein targeted by G1-arresting rapamycin-receptor complex. Nature. 369(6483), 756–758.
Brown, E.J., Beal, P.A., Keith, C.T., Chen, J., Shin, T.B., Schreiber, S.L. (1995) Control of p70 s6 kinase by kinase activity of FRAP in vivo. Nature. 377(6548), 441–446.
Brugarolas, J., Lei, K., Hurley, R.L., Manning, B.D., Reiling, J.H., Hafen, E., Witters, L.A., Ellisen, L.W., Kaelin, W.G. (2004) Regulation of mTOR function in response to hypoxia by REDD1 and the TSC1/TSC2 tumor suppressor complex. Genes & Development. 18(23), 2893–2904.
Brünner-Kubath, C., Shabbir, W., Saferding, V., Wagner, R., Singer, C.F., Valent, P., Berger, W., Marian, B., Zielinski, C.C., Grusch, M., Grunt, T.W. (2011) The PI3 kinase/mTOR blocker NVP-BEZ235 overrides resistance against irreversible ErbB inhibitors in breast cancer cells. Breast Cancer Research and Treatment. 129(2), 387–400.
Budanov, A.V., Karin, M. (2008) p53 target genes sestrin1 and sestrin2 connect genotoxic stress and mTOR signaling. Cell. 134(3), 451–460.
Burnett, P.E., Barrow, R.K., Cohen, N.A., Snyder, S.H., Sabatini, D.M. (1998) RAFT1 phosphorylation of the translational regulators p70 S6 kinase and 4E-BP1. Proceedings of the National Academy of Sciences of the United States of America. 95(4), 1432–1437.
Burney, R.O., Lathi, R.B. (2009) Menstrual bleeding from an endometriotic lesion. Fertility and Sterility. 91(5), 1926–1927.
Bustin, S.A., Benes, V., Garson, J.A., Hellemans, J., Huggett, J., Kubista, M., Mueller, R., Nolan, T., Pfaffl, M.W., Shipley, G.L., Vandesompele, J., Wittwer, C.T. (2009) The MIQE guidelines: minimum information for publication of quantitative real-time PCR experiments. Clinical Chemistry. 55(4), 611–622.
Buys, S.S., Partridge, E., Black, A., Johnson, C.C., Lamerato, L., Isaacs, C., Reding, D.J., Greenlee, R.T., Yokochi, L.A., Kessel, B., Crawford, E.D., Church, T.R., Andriole, G.L., Weissfeld, J.L., Fouad, M.N., Chia, D., O’Brien, B., Ragard, L.R., Clapp, J.D., Rathmell,

200
J.M., Riley, T.L., Hartge, P., Pinsky, P.F., Zhu, C.S., Izmirlian, G., Kramer, B.S., Miller, A.B., Xu, J.-L., Prorok, P.C., Gohagan, J.K., Berg, C.D., PLCO Project Team (2011) Effect of screening on ovarian cancer mortality: the Prostate, Lung, Colorectal and Ovarian (PLCO) Cancer Screening Randomized Controlled Trial. JAMA. 305(22), 2295–2303.
Cafferkey, R., Young, P.R., McLaughlin, M.M., Bergsma, D.J., Koltin, Y., Sathe, G.M., Faucette, L., Eng, W.K., Johnson, R.K., Livi, G.P. (1993) Dominant missense mutations in a novel yeast protein related to mammalian phosphatidylinositol 3-kinase and VPS34 abrogate rapamycin cytotoxicity. Molecular and Cellular Biology. 13(10), 6012–6023.
Callahan, M.J., Crum, C.P., Medeiros, F., Kindelberger, D.W., Elvin, J.A., Garber, J.E., Feltmate, C.M., Berkowitz, R.S., Muto, M.G. (2007) Primary Fallopian Tube Malignancies in BRCA-Positive Women Undergoing Surgery for Ovarian Cancer Risk Reduction. Journal of Clinical Oncology. 25(25), 3985–3990.
Campbell, I.G., Russell, S.E., Choong, D.Y.H., Montgomery, K.G., Ciavarella, M.L., Hooi, C.S.F., Cristiano, B.E., Pearson, R.B., Phillips, W.A. (2004) Mutation of the PIK3CA gene in ovarian and breast cancer. Cancer Research. 64(21), 7678–7681.
Campbell, L., Jasani, B., Edwards, K., Gumbleton, M., Griffiths, D.F.R. (2008) Combined expression of caveolin-1 and an activated AKT/mTOR pathway predicts reduced disease-free survival in clinically confined renal cell carcinoma. British Journal of Cancer. 98(5), 931–940.
Carpenter, C.L., Duckworth, B.C., Auger, K.R., Cohen, B., Schaffhausen, B.S., Cantley, L.C. (1990) Purification and characterization of phosphoinositide 3-kinase from rat liver. The Journal of Biological Chemistry. 265(32), 19704–19711.
Carpten, J.D., Faber, A.L., Horn, C., Donoho, G.P., Briggs, S.L., Robbins, C.M., Hostetter, G., Boguslawski, S., Moses, T.Y., Savage, S., Uhlik, M., Lin, A., Du, J., Qian, Y.-W., Zeckner, D.J., Tucker-Kellogg, G., Touchman, J., Patel, K., Mousses, S., Bittner, M., Schevitz, R., Lai, M.-H.T., Blanchard, K.L., Thomas, J.E. (2007) A transforming mutation in the pleckstrin homology domain of AKT1 in cancer. Nature. 448(7152), 439–444.
Carracedo, A., Ma, L., Teruya-Feldstein, J., Rojo, F., Salmena, L., Alimonti, A., Egia, A., Sasaki, A.T., Thomas, G., Kozma, S.C., Papa, A., Nardella, C., Cantley, L.C., Baselga, J., Pandolfi, P.P. (2008) Inhibition of mTORC1 leads to MAPK pathway activation through a PI3K-dependent feedback loop in human cancer. The Journal of Clinical Investigation. 118(9), 3065–3074.
Carracedo, A., Pandolfi, P.P. (2008) The PTEN-PI3K pathway: of feedbacks and cross-talks. Oncogene. 27(41), 5527–5541.
Castellvi, J., Garcia, A., Rojo, F., Ruiz-Marcellan, C., Gil, A., Baselga, J., Ramon y Cajal, S. (2006) Phosphorylated 4E binding protein 1: a hallmark of cell signaling that correlates with survival in ovarian cancer. Cancer. 107(8), 1801–1811.

201
Cepheid (2015) Cepheid | Healthcare Associated Infections. Cepheid. [online]. Available from: http://www.cepheid.com/us/cepheid-solutions/clinical-ivd-tests/healthcare-associated-infections [Accessed August 30, 2015].
Chatchotikawong, U., Ruengkhachorn, I., Leelaphatanadit, C., Phithakwatchara, N. (2015) 8-year analysis of the prevalence of lymph nodes metastasis, oncologic and pregnancy outcomes in apparent early-stage malignant ovarian germ cell tumors. Asian Pacific journal of cancer prevention: APJCP. 16(4), 1609–1613.
Chen, H., Yang, X., Feng, Z., Tang, R., Ren, F., Wei, K., Chen, G. (2015) Prognostic value of Caspase-3 expression in cancers of digestive tract: a meta-analysis and systematic review. International Journal of Clinical and Experimental Medicine. 8(7), 10225–10234.
Chen, J., Holguin, N., Shi, Y., Silva, M.J., Long, F. (2015) mTORC2 Signaling Promotes Skeletal Growth and Bone Formation in Mice. Journal of bone and mineral research : the official journal of the American Society for Bone and Mineral Research. 30(2), 369–378.
Chen, J., Zheng, X.F., Brown, E.J., Schreiber, S.L. (1995) Identification of an 11-kDa FKBP12-rapamycin-binding domain within the 289-kDa FKBP12-rapamycin-associated protein and characterization of a critical serine residue. Proceedings of the National Academy of Sciences of the United States of America. 92(11), 4947–4951.
Chiaffarino, F., Parazzini, F., Bosetti, C., Franceschi, S., Talamini, R., Canzonieri, V., Montella, M., Ramazzotti, V., Franceschi, S., La Vecchia, C. (2007) Risk factors for ovarian cancer histotypes. European Journal of Cancer. 43(7), 1208–1213.
Cho, K.R. (2009) Ovarian cancer update: lessons from morphology, molecules, and mice. Archives of Pathology & Laboratory Medicine. 133(11), 1775–1781.
Claffey, K.P., Robinson, G.S. (1996) Regulation of VEGF/VPF expression in tumor cells: consequences for tumor growth and metastasis. Cancer Metastasis Reviews. 15(2), 165–176.
Collaborative Group on Epidemiological Studies of Ovarian Cancer (2012) Ovarian cancer and body size: individual participant meta-analysis including 25,157 women with ovarian cancer from 47 epidemiological studies. PLoS medicine. 9(4), e1001200.
COSMIC (2015) COSMIC. COSMIC: Cancer Browser. [online]. Available from: http://cancer.sanger.ac.uk/cosmic/browse/tissue.
CRUK (2015a) Bevacizumab (Avastin). Cancer Research UK. [online]. Available from: http://www.cancerresearchuk.org/about-cancer/cancers-in-general/treatment/cancer-drugs/bevacizumab [Accessed August 18, 2015].

202
CRUK (2015b) Bowel cancer survival statistics. Cancer Research UK. [online]. Available from: http://www.cancerresearchuk.org/health-professional/cancer-statistics/statistics-by-cancer-type/bowel-cancer/survival [Accessed September 23, 2015].
CRUK (2015c) Breast cancer survival statistics. Cancer Research UK. [online]. Available from: http://www.cancerresearchuk.org/health-professional/cancer-statistics/statistics-by-cancer-type/breast-cancer/survival [Accessed August 18, 2015].
CRUK (2015d) Cervical cancer survival statistics. Cancer Research UK. [online]. Available from: http://www.cancerresearchuk.org/health-professional/cancer-statistics/statistics-by-cancer-type/cervical-cancer/survival [Accessed September 23, 2015].
CRUK (2015e) Drugs used for ovarian cancer. Cancer Research UK. [online]. Available from: http://www.cancerresearchuk.org/about-cancer/type/ovarian-cancer/treatment/drugs-used-for-ovarian-cancer [Accessed August 18, 2015].
CRUK (2012) Ovarian cancer incidence statistics. Cancer Research UK. [online]. Available from: http://www.cancerresearchuk.org/cancer-info/cancerstats/types/ovary/incidence/uk-ovarian-cancer-incidence-statistics#source12 [Accessed November 30, 2012].
CRUK (2015f) Ovarian cancer risk factors. Cancer Research UK. [online]. Available from: http://www.cancerresearchuk.org/health-professional/cancer-statistics/statistics-by-cancer-type/ovarian-cancer/risk-factors [Accessed August 24, 2015].
CRUK (2015g) Ovarian cancer statistics. Cancer Research UK. [online]. Available from: http://www.cancerresearchuk.org/health-professional/cancer-statistics/statistics-by-cancer-type/ovarian-cancer [Accessed September 23, 2015].
CRUK (2015h) Ovarian cancer survival statistics. Cancer Research UK. [online]. Available from: http://www.cancerresearchuk.org/health-professional/cancer-statistics/statistics-by-cancer-type/ovarian-cancer/survival [Accessed August 16, 2015].
CRUK (2015i) Prostate cancer survival statistics. Cancer Research UK. [online]. Available from: http://www.cancerresearchuk.org/health-professional/cancer-statistics/statistics-by-cancer-type/prostate-cancer/survival [Accessed September 23, 2015].
CRUK (2014a) Stages of ovarian cancer. Cancer Research UK. [online]. Available from: http://www.cancerresearchuk.org/about-cancer/type/ovarian-cancer/treatment/stages-of-ovarian-cancer [Accessed July 26, 2015].

203
CRUK (2014b) Types of ovarian cancer. Cancer Research UK. [online]. Available from: http://www.cancerresearchuk.org/about-cancer/type/ovarian-cancer/about/types-of-ovarian-cancer [Accessed July 25, 2015].
CRUK (2015j) Types of treatment for ovarian cancer. Cancer Research UK. [online]. Available from: http://www.cancerresearchuk.org/about-cancer/type/ovarian-cancer/treatment/which-treatment-for-ovarian-cancer [Accessed August 18, 2015].
CRUK (2015k) Uterine cancer survival statistics. Cancer Research UK. [online]. Available from: http://www.cancerresearchuk.org/health-professional/cancer-statistics/statistics-by-cancer-type/uterine-cancer/survival [Accessed September 23, 2015].
Das, F., Ghosh-Choudhury, N., Bera, A., Dey, N., Abboud, H.E., Kasinath, B.S., Choudhury, G.G. (2013) Transforming Growth Factor β Integrates Smad 3 to Mechanistic Target of Rapamycin Complexes to Arrest Deptor Abundance for Glomerular Mesangial Cell Hypertrophy. The Journal of Biological Chemistry. 288(11), 7756–7768.
Datta, K., Bellacosa, A., Chan, T.O., Tsichlis, P.N. (1996) Akt Is a Direct Target of the Phosphatidylinositol 3-Kinase ACTIVATION BY GROWTH FACTORS, v-src and v-Ha-ras, IN Sf9 AND MAMMALIAN CELLS. Journal of Biological Chemistry. 271(48), 30835–30839.
De Brabander, M., Geuens, G., Nuydens, R., Willebrords, R., De Mey, J. (1981) Taxol induces the assembly of free microtubules in living cells and blocks the organizing capacity of the centrosomes and kinetochores. Proceedings of the National Academy of Sciences of the United States of America. 78(9), 5608–5612.
De Marco, C., Rinaldo, N., Bruni, P., Malzoni, C., Zullo, F., Fabiani, F., Losito, S., Scrima, M., Marino, F.Z., Franco, R., Quintiero, A., Agosti, V., Viglietto, G. (2013) Multiple genetic alterations within the PI3K pathway are responsible for AKT activation in patients with ovarian carcinoma. PloS One. 8(2), e55362.
Demir Weusten, A.Y., Groothuis, P.G., Dunselman, G.A., de Goeij, A.F., Arends, J.W., Evers, J.L. (2000) Morphological changes in mesothelial cells induced by shed menstrual endometrium in vitro are not primarily due to apoptosis or necrosis. Human Reproduction. 15(7), 1462–1468.
Desai, B.N., Myers, B.R., Schreiber, S.L. (2002) FKBP12-rapamycin-associated protein associates with mitochondria and senses osmotic stress via mitochondrial dysfunction. Proceedings of the National Academy of Sciences of the United States of America. 99(7), 4319–4324.
DeYoung, M.P., Horak, P., Sofer, A., Sgroi, D., Ellisen, L.W. (2008) Hypoxia regulates TSC1/2-mTOR signaling and tumor suppression through REDD1-mediated 14-3-3 shuttling. Genes & Development. 22(2), 239–251.

204
D’Hooghe, T.M., Debrock, S. (2002) Endometriosis, retrograde menstruation and peritoneal inflammation in women and in baboons. Human Reproduction Update. 8(1), 84–88.
Di Cosimo, S., Sathyanarayanan, S., Bendell, J.C., Cervantes, A., Stein, M.N., Braña, I., Roda, D., Haines, B.B., Zhang, T., Winter, C.G., Jha, S., Xu, Y., Frazier, J., Klinghoffer, R.A., Leighton-Swayze, A., Song, Y., Ebbinghaus, S., Baselga, J. (2015) Combination of the mTOR inhibitor ridaforolimus and the anti-IGF1R monoclonal antibody dalotuzumab: preclinical characterization and phase I clinical trial. Clinical Cancer Research. 21(1), 49–59.
Dinulescu, D.M., Ince, T.A., Quade, B.J., Shafer, S.A., Crowley, D., Jacks, T. (2005) Role of K-ras and Pten in the development of mouse models of endometriosis and endometrioid ovarian cancer. Nature Medicine. 11(1), 63–70.
Dong, Q., Zheng, S., Hu, Y., Chen, G., Ding, J.-Y. (2005) Evaluation of ST13 gene expression in colorectal cancer patients. Journal of Zhejiang University. Science. B. 6(12), 1170–1175.
Dowling, R.J.O., Topisirovic, I., Alain, T., Bidinosti, M., Fonseca, B.D., Petroulakis, E., Wang, X., Larsson, O., Selvaraj, A., Liu, Y., Kozma, S.C., Thomas, G., Sonenberg, N. (2010) mTORC1-mediated cell proliferation, but not cell growth, controlled by the 4E-BPs. Science. 328(5982), 1172–1176.
Dudek, H., Datta, S.R., Franke, T.F., Birnbaum, M.J., Yao, R., Cooper, G.M., Segal, R.A., Kaplan, D.R., Greenberg, M.E. (1997) Regulation of neuronal survival by the serine-threonine protein kinase Akt. Science. 275(5300), 661–665.
Dumont, F.J., Staruch, M.J., Koprak, S.L., Melino, M.R., Sigal, N.H. (1990) Distinct mechanisms of suppression of murine T cell activation by the related macrolides FK-506 and rapamycin. Journal of Immunology. 144(1), 251–258.
Dun, E.C., Taylor, R.N., Wieser, F. (2010) Advances in the genetics of endometriosis. Genome medicine. 2(10), 75.
Engel, C., Brunkhorst, F.M., Bone, H.-G., Brunkhorst, R., Gerlach, H., Grond, S., Gruendling, M., Huhle, G., Jaschinski, U., John, S., Mayer, K., Oppert, M., Olthoff, D., Quintel, M., Ragaller, M., Rossaint, R., Stuber, F., Weiler, N., Welte, T., Bogatsch, H., Hartog, C., Loeffler, M., Reinhart, K. (2007) Epidemiology of sepsis in Germany: results from a national prospective multicenter study. Intensive Care Medicine. 33(4), 606–618.
Engel, H., Kleespies, C., Friedrich, J., Breidenbach, M., Kallenborn, A., Schöndorf, T., Kolhagen, H., Mallmann, P. (1999) Detection of circulating tumour cells in patients with breast or ovarian cancer by molecular cytogenetics. British Journal of Cancer. 81(7), 1165–1173.
European Medicines Agency (2015a) European Medicines Agency - Abraxane. European Medicines Agency. [online]. Available from:

205
http://www.ema.europa.eu/ema/index.jsp?curl=pages/medicines/human/medicines/000778/human_med_000620.jsp&mid=WC0b01ac058001d124.
European Medicines Agency (2015b) European Medicines Agency - Afinitor. [online]. Available from: http://www.ema.europa.eu/ema/index.jsp?curl=pages/medicines/human/medicines/001038/human_med_000633.jsp&mid=WC0b01ac058001d124.
European Medicines Agency (2015c) European Medicines Agency - Rapamune. European Medicines Agency - Rapamune. [online]. Available from: http://www.ema.europa.eu/ema/index.jsp?curl=pages/medicines/human/medicines/000273/human_med_001010.jsp&mid=WC0b01ac058001d124.
European Medicines Agency (2015d) European Medicines Agency - Torisel. [online]. Available from: http://www.ema.europa.eu/ema/index.jsp?curl=pages/medicines/human/medicines/000799/human_med_001098.jsp&mid=WC0b01ac058001d124.
Faber, M.T., Kjær, S.K., Dehlendorff, C., Chang-Claude, J., Andersen, K.K., Høgdall, E., Webb, P.M., Jordan, S.J., Australian Cancer Study (Ovarian Cancer), Australian Ovarian Cancer Study Group, Rossing, M.A., Doherty, J.A., Lurie, G., Thompson, P.J., Carney, M.E., Goodman, M.T., Ness, R.B., Modugno, F., Edwards, R.P., Bunker, C.H., Goode, E.L., Fridley, B.L., Vierkant, R.A., Larson, M.C., Schildkraut, J., Cramer, D.W., Terry, K.L., Vitonis, A.F., Bandera, E.V., Olson, S.H., King, M., Chandran, U., Kiemeney, L.A., Massuger, L.F.A.G., van Altena, A.M., Vermeulen, S.H., Brinton, L., Wentzensen, N., Lissowska, J., Yang, H.P., Moysich, K.B., Odunsi, K., Kasza, K., Odunsi-Akanji, O., Song, H., Pharaoh, P., Shah, M., Whittemore, A.S., McGuire, V., Sieh, W., Sutphen, R., Menon, U., Gayther, S.A., Ramus, S.J., Gentry-Maharaj, A., Pearce, C.L., Wu, A.H., Pike, M.C., Risch, H.A., Jensen, A., Ovarian Cancer Association Consortium (2013) Cigarette smoking and risk of ovarian cancer: a pooled analysis of 21 case-control studies. Cancer causes & control. 24(5), 989–1004.
Faghihzadeh, F., Adibi, P., Rafiei, R., Hekmatdoost, A. (2014) Resveratrol supplementation improves inflammatory biomarkers in patients with nonalcoholic fatty liver disease. Nutrition Research. 34(10), 837–843.
Fagone, P., Donia, M., Mangano, K., Quattrocchi, C., Mammana, S., Coco, M., Libra, M., McCubrey, J.A., Nicoletti, F. (2013) Comparative study of rapamycin and temsirolimus demonstrates superimposable anti-tumour potency on prostate cancer cells. Basic & Clinical Pharmacology & Toxicology. 112(1), 63–69.
Fan, W., Yang, H., Xue, H., Sun, Y., Zhang, J. (2015) ELMO3 is a novel biomarker for diagnosis and prognosis of non-small cell lung cancer. International Journal of Clinical and Experimental Pathology. 8(5), 5503–5508.
Feng, Z., Zhang, H., Levine, A.J., Jin, S. (2005) The coordinate regulation of the p53 and mTOR pathways in cells. Proceedings of the National Academy of Sciences of the United States of America. 102(23), 8204–8209.

206
Ferrero, S., Alessandri, F., Racca, A., Leone Roberti Maggiore, U. (2015) Treatment of pain associated with deep endometriosis: alternatives and evidence. Fertility and Sterility. 104(4), 771–792.
Fingar, D.C., Richardson, C.J., Tee, A.R., Cheatham, L., Tsou, C., Blenis, J. (2004) mTOR controls cell cycle progression through its cell growth effectors S6K1 and 4E-BP1/eukaryotic translation initiation factor 4E. Molecular and Cellular Biology. 24(1), 200–216.
Folga, A., Filipiak, K.J., Mamcarz, A., Obrebska-Tabaczka, E., Opolski, G. (2012) Simultaneous predictive value of NT-proBNP and CA-125 in patients newly diagnosed with advanced heart failure: preliminary results. Archives of Medical Science. 8(4), 637–643.
Forbes, S.A., Beare, D., Gunasekaran, P., Leung, K., Bindal, N., Boutselakis, H., Ding, M., Bamford, S., Cole, C., Ward, S., Kok, C.Y., Jia, M., De, T., Teague, J.W., Stratton, M.R., McDermott, U., Campbell, P.J. (2015) COSMIC: exploring the world’s knowledge of somatic mutations in human cancer. Nucleic Acids Research. 43(D1), D805–D811.
Foster, H., Coley, H.M., Goumenou, A., Pados, G., Harvey, A., Karteris, E. (2010) Differential Expression of mTOR Signalling Components in Drug Resistance in Ovarian Cancer. Anticancer Research. 30(9), 3529–3534.
Fox, H.L., Kimball, S.R., Jefferson, L.S., Lynch, C.J. (1998) Amino acids stimulate phosphorylation of p70S6k and organization of rat adipocytes into multicellular clusters. The American Journal of Physiology. 274(1 Pt 1), C206–213.
Franke, T.F., Yang, S.-I., Chan, T.O., Datta, K., Kazlauskas, A., Morrison, D.K., Kaplan, D.R., Tsichlis, P.N. (1995) The protein kinase encoded by the Akt proto-oncogene is a target of the PDGF-activated phosphatidylinositol 3-kinase. Cell. 81(5), 727–736.
Freedman, R.S., Pihl, E., Kusyk, C., Gallager, H.S., Rutledge, F. (1978) Characterization of an ovarian carcinoma cell line. Cancer. 42(5), 2352–2359.
Fröjdö, S., Cozzone, D., Vidal, H., Pirola, L. (2007) Resveratrol is a class IA phosphoinositide 3-kinase inhibitor. The Biochemical Journal. 406(3), 511–518.
Gaetje, R., Winnekendonk, D.W., Ahr, A., Kaufmann, M. (2002) Ovarian cancer antigen CA 125 influences adhesion of human and mammalian cell lines in vitro. Clinical and Experimental Obstetrics & Gynecology. 29(1), 34–36.
Gaetje, R., Winnekendonk, D.W., Scharl, A., Kaufmann, M. (1999) Ovarian cancer antigen CA 125 enhances the invasiveness of the endometriotic cell line EEC 145. Journal of the Society for Gynecologic Investigation. 6(5), 278–281.
Ganley, I.G., Lam, D.H., Wang, J., Ding, X., Chen, S., Jiang, X. (2009) ULK1.ATG13.FIP200 complex mediates mTOR signaling and is essential for autophagy. The Journal of Biological Chemistry. 284(18), 12297–12305.

207
Gao, D., Inuzuka, H., Tan, M.-K.M., Fukushima, H., Locasale, J.W., Liu, P., Wan, L., Zhai, B., Chin, Y.R., Shaik, S., Lyssiotis, C.A., Gygi, S.P., Toker, A., Cantley, L.C., Asara, J.M., Harper, J.W., Wei, W. (2011) mTOR drives its own activation via SCFβ-TRCP-dependent degradation of the mTOR inhibitor DEPTOR. Molecular cell. 44(2), 290–303.
García-Martínez, J.M., Alessi, D.R. (2008) mTOR complex 2 (mTORC2) controls hydrophobic motif phosphorylation and activation of serum- and glucocorticoid-induced protein kinase 1 (SGK1). The Biochemical Journal. 416(3), 375–385.
Gebauer, F., Hentze, M.W. (2004) Molecular mechanisms of translational control. Nature Reviews. Molecular Cell Biology. 5(10), 827–835.
Giannakouros, P., Comamala, M., Matte, I., Rancourt, C., Piché, A. (2014) MUC16 mucin (CA125) regulates the formation of multicellular aggregates by altering β-catenin signaling. American Journal of Cancer Research. 5(1), 219–230.
Groothuis, P.G., Koks, C.A., de Goeij, A.F., Dunselman, G.A., Arends, J.W., Evers, J.L. (1999) Adhesion of human endometrial fragments to peritoneum in vitro. Fertility and Sterility. 71(6), 1119–1124.
Grunt, T.W., Mariani, G.L. (2013) Novel approaches for molecular targeted therapy of breast cancer: interfering with PI3K/AKT/mTOR signaling. Current Cancer Drug Targets. 13(2), 188–204.
Guertin, D.A., Stevens, D.M., Saitoh, M., Kinkel, S., Crosby, K., Sheen, J.-H., Mullholland, D.J., Magnuson, M.A., Wu, H., Sabatini, D.M. (2009) mTOR complex 2 is required for the development of prostate cancer induced by Pten loss in mice. Cancer Cell. 15(2), 148–159.
Guertin, D.A., Stevens, D.M., Thoreen, C.C., Burds, A.A., Kalaany, N.Y., Moffat, J., Brown, M., Fitzgerald, K.J., Sabatini, D.M. (2006) Ablation in mice of the mTORC components raptor, rictor, or mLST8 reveals that mTORC2 is required for signaling to Akt-FOXO and PKCalpha, but not S6K1. Developmental cell. 11(6), 859–871.
Guo, J., Gao, J., Yu, X., Luo, H., Xiong, X., Huang, O. (2015) Expression of DJ-1 and mTOR in eutopic and ectopic endometria of patients with endometriosis and adenomyosis. Gynecologic and Obstetric Investigation. 79(3), 195–200.
Guseh, S.H., Rauh-Hain, J.A., Tambouret, R.H., Davis, M., Clark, R.M., Boruta, D.M., Goodman, A., Growdon, W.B., Schorge, J.O., del Carmen, M.G. (2014) Transitional cell carcinoma of the ovary: A case–control study. Gynecologic Oncology. 132(3), 649–653.
Gutierrez, L., Mauriat, M., Guénin, S., Pelloux, J., Lefebvre, J.-F., Louvet, R., Rusterucci, C., Moritz, T., Guerineau, F., Bellini, C., Van Wuytswinkel, O. (2008) The lack of a systematic validation of reference genes: a serious pitfall undervalued in reverse transcription-polymerase chain reaction (RT-PCR) analysis in plants. Plant Biotechnology Journal. 6(6), 609–618.

208
Gwinn, D.M., Shackelford, D.B., Egan, D.F., Mihaylova, M.M., Mery, A., Vasquez, D.S., Turk, B.E., Shaw, R.J. (2008) AMPK phosphorylation of raptor mediates a metabolic checkpoint. Molecular Cell. 30(2), 214–226.
Győrffy, B., Surowiak, P., Budczies, J., Lánczky, A. (2013) Online survival analysis software to assess the prognostic value of biomarkers using transcriptomic data in non-small-cell lung cancer. PloS One. 8(12), e82241.
van der Hage, J.A., van den Broek, L.J.C.M., Legrand, C., Clahsen, P.C., Bosch, C.J.A., Robanus-Maandag, E.C., van de Velde, C.J.H., van de Vijver, M.J. (2004) Overexpression of P70 S6 kinase protein is associated with increased risk of locoregional recurrence in node-negative premenopausal early breast cancer patients. British Journal of Cancer. 90(8), 1543–1550.
Hahn, M., Li, W., Yu, C., Rahmani, M., Dent, P., Grant, S. (2005) Rapamycin and UCN-01 synergistically induce apoptosis in human leukemia cells through a process that is regulated by the Raf-1/MEK/ERK, Akt, and JNK signal transduction pathways. Molecular Cancer Therapeutics. 4(3), 457–470.
Hamada, Y., Mizoguchi, M., Suzuki, S.O., Iwaki, T. (1998) Accumulation of class I mutant p53 and apoptosis induced by carboplatin in a human glioma cell line. Brain Tumor Pathology. 15(2), 77–82.
Hanon, F.-X., Monnet, D.L., Sørensen, T.L., Mølbak, K., Pedersen, G., Schønheyder, H. (2002) Survival of patients with bacteraemia in relation to initial empirical antimicrobial treatment. Scandinavian Journal of Infectious Diseases. 34(7), 520–528.
Hara, K., Maruki, Y., Long, X., Yoshino, K., Oshiro, N., Hidayat, S., Tokunaga, C., Avruch, J., Yonezawa, K. (2002) Raptor, a binding partner of target of rapamycin (TOR), mediates TOR action. Cell. 110(2), 177–189.
Hara, K., Yonezawa, K., Weng, Q.P., Kozlowski, M.T., Belham, C., Avruch, J. (1998) Amino acid sufficiency and mTOR regulate p70 S6 kinase and eIF-4E BP1 through a common effector mechanism. The Journal of Biological Chemistry. 273(23), 14484–14494.
Harrington, L.S., Findlay, G.M., Gray, A., Tolkacheva, T., Wigfield, S., Rebholz, H., Barnett, J., Leslie, N.R., Cheng, S., Shepherd, P.R., Gout, I., Downes, C.P., Lamb, R.F. (2004) The TSC1-2 tumor suppressor controls insulin-PI3K signaling via regulation of IRS proteins. The Journal of Cell Biology. 166(2), 213–223.
Havrilesky, L.J., Elbendary, A., Hurteau, J.A., Whitaker, R.S., Rodriguez, G.C., Berchuck, A. (1995) Chemotherapy-induced apoptosis in epithelial ovarian cancers. Obstetrics and Gynecology. 85(6), 1007–1010.
Heitman, J., Movva, N.R., Hall, M.N. (1991) Targets for cell cycle arrest by the immunosuppressant rapamycin in yeast. Science. 253(5022), 905–909.

209
Hemminki, K., Sundquist, J., Brandt, A. (2011) Incidence and mortality in epithelial ovarian cancer by family history of any cancer. Cancer. 117(17), 3972–3980.
Hisamatsu, T., Mabuchi, S., Matsumoto, Y., Kawano, M., Sasano, T., Takahashi, R., Sawada, K., Ito, K., Kurachi, H., Schilder, R.J., Testa, J.R., Kimura, T. (2013) Potential Role of mTORC2 as a Therapeutic Target in Clear Cell Carcinoma of the Ovary. Molecular cancer therapeutics. 12(7), 1367–1377.
Holz, M.K., Ballif, B.A., Gygi, S.P., Blenis, J. (2005) mTOR and S6K1 mediate assembly of the translation preinitiation complex through dynamic protein interchange and ordered phosphorylation events. Cell. 123(4), 569–580.
Hosokawa, N., Hara, T., Kaizuka, T., Kishi, C., Takamura, A., Miura, Y., Iemura, S., Natsume, T., Takehana, K., Yamada, N., Guan, J.-L., Oshiro, N., Mizushima, N. (2009) Nutrient-dependent mTORC1 association with the ULK1-Atg13-FIP200 complex required for autophagy. Molecular Biology of the Cell. 20(7), 1981–1991.
Hsu, C.-Y., Bristow, R., Cha, M.S., Wang, B.G., Ho, C.-L., Kurman, R.J., Wang, T.-L., Shih, I.-M. (2004) Characterization of Active Mitogen-Activated Protein Kinase in Ovarian Serous Carcinomas. Clinical Cancer Research. 10(19), 6432–6436.
Hsu, P.P., Kang, S.A., Rameseder, J., Zhang, Y., Ottina, K.A., Lim, D., Peterson, T.R., Choi, Y., Gray, N.S., Yaffe, M.B., Marto, J.A., Sabatini, D.M. (2011) The mTOR-regulated phosphoproteome reveals a mechanism of mTORC1-mediated inhibition of growth factor signaling. Science. 332(6035), 1317–1322.
Hudson, C.C., Liu, M., Chiang, G.G., Otterness, D.M., Loomis, D.C., Kaper, F., Giaccia, A.J., Abraham, R.T. (2002) Regulation of hypoxia-inducible factor 1alpha expression and function by the mammalian target of rapamycin. Molecular and Cellular Biology. 22(20), 7004–7014.
Im-aram, A., Farrand, L., Bae, S.-M., Song, G., Song, Y.S., Han, J.Y., Tsang, B.K. (2013) The mTORC2 component rictor contributes to cisplatin resistance in human ovarian cancer cells. PloS One. 8(9), e75455.
Ingham, S.L., Warwick, J., Buchan, I., Sahin, S., O’Hara, C., Moran, A., Howell, A., Evans, D.G. (2013) Ovarian cancer among 8,005 women from a breast cancer family history clinic: no increased risk of invasive ovarian cancer in families testing negative for BRCA1 and BRCA2. Journal of Medical Genetics. 50(6), 368–372.
Inoki, K., Li, Y., Zhu, T., Wu, J., Guan, K.-L. (2002) TSC2 is phosphorylated and inhibited by Akt and suppresses mTOR signalling. Nature Cell Biology. 4(9), 648–657.
Inoki, K., Zhu, T., Guan, K.-L. (2003) TSC2 mediates cellular energy response to control cell growth and survival. Cell. 115(5), 577–590.
Ip, C.K.M., Yung, S., Chan, T.-M., Tsao, S.-W., Wong, A.S.T. (2014) p70 S6 kinase drives ovarian cancer metastasis through multicellular spheroid-peritoneum

210
interaction and P-cadherin/b1 integrin signaling activation. Oncotarget. 5(19), 9133–9149.
Ireland, C.M., Pittman, S.M. (1995) Tubulin alterations in taxol-induced apoptosis parallel those observed with other drugs. Biochemical Pharmacology. 49(10), 1491–1499.
Isotani, S., Hara, K., Tokunaga, C., Inoue, H., Avruch, J., Yonezawa, K. (1999) Immunopurified mammalian target of rapamycin phosphorylates and activates p70 S6 kinase alpha in vitro. The Journal of Biological Chemistry. 274(48), 34493–34498.
Jacinto, E., Facchinetti, V., Liu, D., Soto, N., Wei, S., Jung, S.Y., Huang, Q., Qin, J., Su, B. (2006) SIN1/MIP1 maintains rictor-mTOR complex integrity and regulates Akt phosphorylation and substrate specificity. Cell. 127(1), 125–137.
Jacinto, E., Loewith, R., Schmidt, A., Lin, S., Rüegg, M.A., Hall, A., Hall, M.N. (2004) Mammalian TOR complex 2 controls the actin cytoskeleton and is rapamycin insensitive. Nature Cell Biology. 6(11), 1122–1128.
Jacob, F., Guertler, R., Naim, S., Nixdorf, S., Fedier, A., Hacker, N.F., Heinzelmann-Schwarz, V. (2013) Careful selection of reference genes is required for reliable performance of RT-qPCR in human normal and cancer cell lines. PloS One. 8(3), e59180.
Janiszewska, M., Liu, L., Almendro, V., Kuang, Y., Paweletz, C., Sakr, R.A., Weigelt, B., Hanker, A.B., Chandarlapaty, S., King, T.A., Reis-Filho, J.S., Arteaga, C.L., Park, S.Y., Michor, F., Polyak, K. (2015) In situ single-cell analysis identifies heterogeneity for PIK3CA mutation and HER2 amplification in HER2-positive breast cancer. Nature Genetics. 47(10), 1212–1219.
Jervis, S., Song, H., Lee, A., Dicks, E., Tyrer, J., Harrington, P., Easton, D.F., Jacobs, I.J., Pharoah, P.P.D., Antoniou, A.C. (2014) Ovarian cancer familial relative risks by tumour subtypes and by known ovarian cancer genetic susceptibility variants. Journal of Medical Genetics. 51(2), 108–113.
Jiang, H., Shang, X., Wu, H., Gautam, S.C., Al-Holou, S., Li, C., Kuo, J., Zhang, L., Chopp, M. (2009) Resveratrol downregulates PI3K/Akt/mTOR signaling pathways in human U251 glioma cells. Journal of experimental therapeutics & oncology. 8(1), 25–33.
Jiang, S., Zou, Z., Nie, P., Wen, R., Xiao, Y., Tang, J. (2015) Synergistic Effects between mTOR Complex 1/2 and Glycolysis Inhibitors in Non-Small-Cell Lung Carcinoma Cells. PloS One. 10(7), e0132880.
Jia, W., Wu, Y., Zhang, Q., Gao, G.E., Zhang, C., Xiang, Y. (2015) Expression profile of circulating microRNAs as a promising fingerprint for cervical cancer diagnosis and monitoring. Molecular and Clinical Oncology. 3(4), 851–858.

211
Johnson, C.C., Kessel, B., Riley, T.L., Ragard, L.R., Williams, C.R., Xu, J.-L., Buys, S.S., Prostate, Lung, Colorectal and Ovarian Cancer Project Team (2008) The epidemiology of CA-125 in women without evidence of ovarian cancer in the Prostate, Lung, Colorectal and Ovarian Cancer (PLCO) Screening Trial. Gynecologic oncology. 110(3), 383–389.
Jordan, S.D., Poole, C.J., Archer, V.R., Steven, N.M., Burton, A. (2003) A retrospective evaluation of the feasibility of intrapatient dose escalation as appropriate methodology for dose-ranging studies for combination cytotoxic regimens. Cancer Chemotherapy and Pharmacology. 52(2), 113–118.
Jung, C.H., Jun, C.B., Ro, S.-H., Kim, Y.-M., Otto, N.M., Cao, J., Kundu, M., Kim, D.-H. (2009) ULK-Atg13-FIP200 complexes mediate mTOR signaling to the autophagy machinery. Molecular Biology of the Cell. 20(7), 1992–2003.
Karthik, G.-M., Ma, R., Lövrot, J., Kis, L.L., Lindh, C., Blomquist, L., Fredriksson, I., Bergh, J., Hartman, J. (2015) mTOR inhibitors counteract tamoxifen-induced activation of breast cancer stem cells. Cancer Letters. 367(1), 76–87.
Kastan, M.B., Onyekwere, O., Sidransky, D., Vogelstein, B., Craig, R.W. (1991) Participation of p53 protein in the cellular response to DNA damage. Cancer Research. 51(23 Pt 1), 6304–6311.
Kawada, J., Ito, Y., Iwata, S., Suzuki, M., Kawano, Y., Kanazawa, T., Siddiquey, M.N.A., Kimura, H. (2014) mTOR inhibitors induce cell-cycle arrest and inhibit tumor growth in Epstein-Barr virus-associated T and natural killer cell lymphoma cells. Clinical Cancer Research. 20(21), 5412–5422.
Kay, J.E., Kromwel, L., Doe, S.E., Denyer, M. (1991) Inhibition of T and B lymphocyte proliferation by rapamycin. Immunology. 72(4), 544–549.
Kazi, A.A., Hong-Brown, L., Lang, S.M., Lang, C.H. (2011) Deptor knockdown enhances mTOR Activity and protein synthesis in myocytes and ameliorates disuse muscle atrophy. Molecular Medicine. 17(9-10), 925–936.
Kenerson, H.L., Aicher, L.D., True, L.D., Yeung, R.S. (2002) Activated mammalian target of rapamycin pathway in the pathogenesis of tuberous sclerosis complex renal tumors. Cancer Research. 62(20), 5645–5650.
Kennedy, A.W., Markman, M., Biscotti, C.V., Emery, J.D., Rybicki, L.A. (1999) Survival Probability in Ovarian Clear Cell Adenocarcinoma. Gynecologic Oncology. 74(1), 108–114.
Kennedy, S., Oswald, N. eds. (2011) PCR Troubleshooting and Optimization: The Essential Guide. Norfolk, UK: Caister Academic Press.
Kim, D.-H., Sarbassov, D.D., Ali, S.M., King, J.E., Latek, R.R., Erdjument-Bromage, H., Tempst, P., Sabatini, D.M. (2002) mTOR interacts with raptor to form a nutrient-sensitive complex that signals to the cell growth machinery. Cell. 110(2), 163–175.

212
Kim, D.-H., Sarbassov, D.D., Ali, S.M., Latek, R.R., Guntur, K.V.., Erdjument-Bromage, H., Tempst, P., Sabatini, D.M. (2003) GβL, a Positive Regulator of the Rapamycin-Sensitive Pathway Required for the Nutrient-Sensitive Interaction between Raptor and mTOR. Molecular Cell. 11(4), 895–904.
Kim, E., Goraksha-Hicks, P., Li, L., Neufeld, T.P., Guan, K.-L. (2008) Regulation of TORC1 by Rag GTPases in nutrient response. Nature Cell Biology. 10(8), 935–945.
Kim, J.E., Chen, J. (2000) Cytoplasmic-nuclear shuttling of FKBP12-rapamycin-associated protein is involved in rapamycin-sensitive signaling and translation initiation. Proceedings of the National Academy of Sciences of the United States of America. 97(26), 14340–14345.
Kim, J.E., Chen, J. (2004) Regulation of peroxisome proliferator-activated receptor-gamma activity by mammalian target of rapamycin and amino acids in adipogenesis. Diabetes. 53(11), 2748–2756.
Kim, K.-T., Lee, H.W., Lee, H.-O., Kim, S.C., Seo, Y.J., Chung, W., Eum, H.H., Nam, D.-H., Kim, J., Joo, K.M., Park, W.-Y. (2015) Single-cell mRNA sequencing identifies subclonal heterogeneity in anti-cancer drug responses of lung adenocarcinoma cells. Genome Biology. 16, 127.
Kjaer, T.N., Ornstrup, M.J., Poulsen, M.M., Jørgensen, J.O.L., Hougaard, D.M., Cohen, A.S., Neghabat, S., Richelsen, B., Pedersen, S.B. (2015) Resveratrol reduces the levels of circulating androgen precursors but has no effect on, testosterone, dihydrotestosterone, PSA levels or prostate volume. A 4-month randomised trial in middle-aged men. The Prostate. 75(12), 1255–1263.
Knappskog, S., Gansmo, L.B., Dibirova, K., Metspalu, A., Cybulski, C., Peterlongo, P., Aaltonen, L., Vatten, L., Romundstad, P., Hveem, K., Devilee, P., Evans, G.D., Lin, D., Van Camp, G., Manolopoulos, V.G., Osorio, A., Milani, L., Ozcelik, T., Zalloua, P., Mouzaya, F., Bliznetz, E., Balanovska, E., Pocheshkova, E., Kučinskas, V., Atramentova, L., Nymadawa, P., Titov, K., Lavryashina, M., Yusupov, Y., Bogdanova, N., Koshel, S., Zamora, J., Wedge, D.C., Charlesworth, D., Dörk, T., Balanovsky, O., Lønning, P.E. (2014) Population distribution and ancestry of the cancer protective MDM2 SNP285 (rs117039649). Oncotarget. 5(18), 8223–8234.
Kodaman, P.H. (2015) Current strategies for endometriosis management. Obstetrics and Gynecology Clinics of North America. 42(1), 87–101.
Koks, C.A., Dunselman, G.A., de Goeij, A.F., Arends, J.W., Evers, J.L. (1997) Evaluation of a menstrual cup to collect shed endometrium for in vitro studies. Fertility and Sterility. 68(3), 560–564.
Koks, C.A., Groothuis, P.G., Dunselman, G.A., de Goeij, A.F., Evers, J.L. (1999) Adhesion of shed menstrual tissue in an in-vitro model using amnion and peritoneum: a light and electron microscopic study. Human Reproduction. 14(3), 816–822.

213
Koo, J., Wang, X., Owonikoko, T.K., Ramalingam, S.S., Khuri, F.R., Sun, S.-Y. (2015) GSK3 is required for rapalogs to induce degradation of some oncogenic proteins and to suppress cancer cell growth. Oncotarget. 6(11), 8974–8987.
Kovacina, K.S., Park, G.Y., Bae, S.S., Guzzetta, A.W., Schaefer, E., Birnbaum, M.J., Roth, R.A. (2003) Identification of a Proline-rich Akt Substrate as a 14-3-3 Binding Partner. Journal of Biological Chemistry. 278(12), 10189–10194.
Kumar, N. (1981) Taxol-induced polymerization of purified tubulin. Mechanism of action. The Journal of Biological Chemistry. 256(20), 10435–10441.
Kurian, A.W., Balise, R.R., McGuire, V., Whittemore, A.S. (2005) Histologic types of epithelial ovarian cancer: have they different risk factors? Gynecologic Oncology. 96(2), 520–530.
Lalwani, N., Prasad, S.R., Vikram, R., Shanbhogue, A.K., Huettner, P.C., Fasih, N. (2011) Histologic, molecular, and cytogenetic features of ovarian cancers: implications for diagnosis and treatment. Radiographics. 31(3), 625–646.
Lamouille, S., Connolly, E., Smyth, J.W., Akhurst, R.J., Derynck, R. (2012) TGF-β-induced activation of mTOR complex 2 drives epithelial–mesenchymal transition and cell invasion. Journal of Cell Science. 125(5), 1259–1273.
Lanitis, E., Dangaj, D., Hagemann, I.S., Song, D.-G., Best, A., Sandaltzopoulos, R., Coukos, G., Powell, D.J., Jr (2012) Primary Human Ovarian Epithelial Cancer Cells Broadly Express HER2 at Immunologically-Detectable Levels. PLoS ONE. 7(11), e49829.
Laplante, M., Sabatini, D.M. (2012) mTOR Signaling in Growth Control and Disease. Cell. 149(2), 274–293.
Laudański, P., Kowalczuk, O., Klasa-Mazurkiewicz, D., Milczek, T., Rysak-Luberowicz, D., Garbowicz, M., Baranowski, W., Charkiewicz, R., Szamatowicz, J., Chyczewski, L. (2011) Selective gene expression profiling of mTOR-associated tumor suppressor and oncogenes in ovarian cancer. Folia Histochemica Et Cytobiologica. 49(2), 317–324.
Leconte, M., Nicco, C., Ngô, C., Chéreau, C., Chouzenoux, S., Marut, W., Guibourdenche, J., Arkwright, S., Weill, B., Chapron, C., Dousset, B., Batteux, F. (2011) The mTOR/AKT inhibitor temsirolimus prevents deep infiltrating endometriosis in mice. The American journal of pathology. 179(2), 880–889.
Lee, L.G., Connell, C.R., Bloch, W. (1993) Allelic discrimination by nick-translation PCR with fluorogenic probes. Nucleic Acids Research. 21(16), 3761–3766.
Lee, M., Wiedemann, T., Gross, C., Leinhäuser, I., Roncaroli, F., Braren, R., Pellegata, N.S. (2015) Targeting PI3K/mTOR Signaling Displays Potent Antitumor Efficacy against Nonfunctioning Pituitary Adenomas. Clinical Cancer Research. 21(14), 3204–3215.

214
Leontieva, O.V., Novototskaya, L.R., Paszkiewicz, G.M., Komarova, E.A., Gudkov, A.V., Blagosklonny, M.V. (2013) Dysregulation of the mTOR pathway in p53-deficient mice. Cancer Biology & Therapy. 14(12), 1182–1188.
Leslie, N.R., Gray, A., Pass, I., Orchiston, E.A., Downes, C.P. (2000) Analysis of the cellular functions of PTEN using catalytic domain and C-terminal mutations: differential effects of C-terminal deletion on signalling pathways downstream of phosphoinositide 3-kinase. Biochemical Journal. 346(Pt 3), 827–833.
Leung, E.Y., Askarian-Amiri, M., Finlay, G.J., Rewcastle, G.W., Baguley, B.C. (2015) Potentiation of Growth Inhibitory Responses of the mTOR Inhibitor Everolimus by Dual mTORC1/2 Inhibitors in Cultured Breast Cancer Cell Lines. PLoS ONE. 10(7), e0131400.
Levine, D.A., Bogomolniy, F., Yee, C.J., Lash, A., Barakat, R.R., Borgen, P.I., Boyd, J. (2005) Frequent mutation of the PIK3CA gene in ovarian and breast cancers. Clinical Cancer Research: An Official Journal of the American Association for Cancer Research. 11(8), 2875–2878.
Liang, X.H., Jackson, S., Seaman, M., Brown, K., Kempkes, B., Hibshoosh, H., Levine, B. (1999) Induction of autophagy and inhibition of tumorigenesis by beclin 1. Nature. 402(6762), 672–676.
Liedtke, C., Rody, A., Gluz, O., Baumann, K., Beyer, D., Kohls, E.-B., Lausen, K., Hanker, L., Holtrich, U., Becker, S., Karn, T. (2015) The prognostic impact of age in different molecular subtypes of breast cancer. Breast Cancer Research and Treatment. 152(3), 667–673.
Li, S., Brown, M.S., Goldstein, J.L. (2010) Bifurcation of insulin signaling pathway in rat liver: mTORC1 required for stimulation of lipogenesis, but not inhibition of gluconeogenesis. Proceedings of the National Academy of Sciences of the United States of America. 107(8), 3441–3446.
Li, S., Ogawa, W., Emi, A., Hayashi, K., Senga, Y., Nomura, K., Hara, K., Yu, D., Kasuga, M. (2011) Role of S6K1 in regulation of SREBP1c expression in the liver. Biochemical and Biophysical Research Communications. 412(2), 197–202.
Liu, K., Zhou, R., Wang, B., Mi, M.-T. (2014) Effect of resveratrol on glucose control and insulin sensitivity: a meta-analysis of 11 randomized controlled trials. The American Journal of Clinical Nutrition. 99(6), 1510–1519.
Liu, L., Das, S., Losert, W., Parent, C.A. (2010) mTORC2 regulates neutrophil chemotaxis in a cAMP- and RhoA-dependent fashion. Developmental Cell. 19(6), 845–857.
Liu, L., Sun, Y., Kargbo, B., Zhang, C., Feng, H., Lu, H., Liu, W., Wang, C., Hu, Y., Deng, Y., Jiang, J., Kang, X., Yang, H., Jiang, Y., Yang, Y., Kargbo, D., Qian, J., Chen, W. (2015) Detection of Zaire Ebola virus by real-time reverse transcription-polymerase chain reaction, Sierra Leone, 2014. Journal of Virological Methods. 222, 62–65.

215
Liu, M., Wilk, S.A., Wang, A., Zhou, L., Wang, R.-H., Ogawa, W., Deng, C., Dong, L.Q., Liu, F. (2010) Resveratrol inhibits mTOR signaling by promoting the interaction between mTOR and DEPTOR. The Journal of biological chemistry. 285(47), 36387–36394.
Livak, K.J., Flood, S.J., Marmaro, J., Giusti, W., Deetz, K. (1995) Oligonucleotides with fluorescent dyes at opposite ends provide a quenched probe system useful for detecting PCR product and nucleic acid hybridization. PCR methods and applications. 4(6), 357–362.
Li, X., Zhang, Y., Zhao, L., Wang, L., Wu, Z., Mei, Q., Nie, J., Li, X., Li, Y., Fu, X., Wang, X., Meng, Y., Han, W. (2014) Whole-exome sequencing of endometriosis identifies frequent alterations in genes involved in cell adhesion and chromatin-remodeling complexes. Human Molecular Genetics. 23(22), 6008–6021.
van der Loos, C.M. (2008) Multiple Immunoenzyme Staining: Methods and Visualizations for the Observation With Spectral Imaging. Journal of Histochemistry and Cytochemistry. 56(4), 313–328.
Lowes, L.E., Lock, M., Rodrigues, G., D’Souza, D., Bauman, G., Ahmad, B., Venkatesan, V., Allan, A.L., Sexton, T. (2015) The significance of circulating tumor cells in prostate cancer patients undergoing adjuvant or salvage radiation therapy. Prostate Cancer and Prostatic Diseases.
Lu, Q., Wang, J., Yu, G., Guo, T., Hu, C., Ren, P. (2015) Expression and clinical significance of mammalian target of rapamycin/P70 ribosomal protein S6 kinase signaling pathway in human colorectal carcinoma tissue. Oncology Letters. 10(1), 277–282.
Mabuchi, S., Altomare, D.A., Cheung, M., Zhang, L., Poulikakos, P.I., Hensley, H.H., Schilder, R.J., Ozols, R.F., Testa, J.R. (2007) RAD001 inhibits human ovarian cancer cell proliferation, enhances cisplatin-induced apoptosis, and prolongs survival in an ovarian cancer model. Clinical Cancer Research: An Official Journal of the American Association for Cancer Research. 13(14), 4261–4270.
Mabuchi, S., Altomare, D.A., Connolly, D.C., Klein-Szanto, A., Litwin, S., Hoelzle, M.K., Hensley, H.H., Hamilton, T.C., Testa, J.R. (2007) RAD001 (Everolimus) delays tumor onset and progression in a transgenic mouse model of ovarian cancer. Cancer Research. 67(6), 2408–2413.
Machado-Linde, F., Sánchez-Ferrer, M.L., Cascales, P., Torroba, A., Orozco, R., Silva Sánchez, Y., Nieto, A., Fiol, G. (2015) Prevalence of endometriosis in epithelial ovarian cancer. Analysis of the associated clinical features and study on molecular mechanisms involved in the possible causality. European Journal of Gynaecological Oncology. 36(1), 21–24.
Magrina, J.F., Espada, M., Kho, R.M., Cetta, R., Chang, Y.-H.H., Magtibay, P.M. (2015) Surgical Excision of Advanced Endometriosis: Perioperative Outcomes and Impacting Factors. Journal of Minimally Invasive Gynecology. 22(6), 944–950.

216
Maira, S.-M., Stauffer, F., Brueggen, J., Furet, P., Schnell, C., Fritsch, C., Brachmann, S., Chène, P., De Pover, A., Schoemaker, K., Fabbro, D., Gabriel, D., Simonen, M., Murphy, L., Finan, P., Sellers, W., García-Echeverría, C. (2008) Identification and characterization of NVP-BEZ235, a new orally available dual phosphatidylinositol 3-kinase/mammalian target of rapamycin inhibitor with potent in vivo antitumor activity. Molecular Cancer Therapeutics. 7(7), 1851–1863.
Majumder, P.K., Febbo, P.G., Bikoff, R., Berger, R., Xue, Q., McMahon, L.M., Manola, J., Brugarolas, J., McDonnell, T.J., Golub, T.R., Loda, M., Lane, H.A., Sellers, W.R. (2004) mTOR inhibition reverses Akt-dependent prostate intraepithelial neoplasia through regulation of apoptotic and HIF-1-dependent pathways. Nature Medicine. 10(6), 594–601.
Malcolm Coppleson, J.M.M., C. Paul Morrow, M.H.N.T. eds. (1992) Tumors of ovary. In Gynecologic Oncology. Churchill Livingstone.
Malpica, A., Deavers, M.T., Lu, K., Bodurka, D.C., Atkinson, E.N., Gershenson, D.M., Silva, E.G. (2004) Grading ovarian serous carcinoma using a two-tier system. The American Journal of Surgical Pathology. 28(4), 496–504.
Manning, B.D., Tee, A.R., Logsdon, M.N., Blenis, J., Cantley, L.C. (2002) Identification of the tuberous sclerosis complex-2 tumor suppressor gene product tuberin as a target of the phosphoinositide 3-kinase/akt pathway. Molecular Cell. 10(1), 151–162.
Martin, E.C., Rhodes, L.V., Elliott, S., Krebs, A.E., Nephew, K.P., Flemington, E.K., Collins-Burow, B.M., Burow, M.E. (2014) microRNA regulation of mammalian target of rapamycin expression and activity controls estrogen receptor function and RAD001 sensitivity. Molecular Cancer. 13, 229.
Masoumi-Moghaddam, S., Amini, A., Wei, A.-Q., Robertson, G., Morris, D.L. (2015) Vascular endothelial growth factor expression correlates with serum CA125 and represents a useful tool in prediction of refractoriness to platinum-based chemotherapy and ascites formation in epithelial ovarian cancer. Oncotarget. 6(29), 28491–28501.
Masri, J., Bernath, A., Martin, J., Jo, O.D., Vartanian, R., Funk, A., Gera, J. (2007) mTORC2 activity is elevated in gliomas and promotes growth and cell motility via overexpression of rictor. Cancer Research. 67(24), 11712–11720.
Mavaddat, N., Peock, S., Frost, D., Ellis, S., Platte, R., Fineberg, E., Evans, D.G., Izatt, L., Eeles, R.A., Adlard, J., Davidson, R., Eccles, D., Cole, T., Cook, J., Brewer, C., Tischkowitz, M., Douglas, F., Hodgson, S., Walker, L., Porteous, M.E., Morrison, P.J., Side, L.E., Kennedy, M.J., Houghton, C., Donaldson, A., Rogers, M.T., Dorkins, H., Miedzybrodzka, Z., Gregory, H., Eason, J., Barwell, J., McCann, E., Murray, A., Antoniou, A.C., Easton, D.F., EMBRACE (2013) Cancer risks for BRCA1 and BRCA2 mutation carriers: results from prospective analysis of EMBRACE. Journal of the National Cancer Institute. 105(11), 812–822.

217
Ma, X.M., Blenis, J. (2009) Molecular mechanisms of mTOR-mediated translational control. Nature Reviews. Molecular Cell Biology. 10(5), 307–318.
Maxwell, P.H., Dachs, G.U., Gleadle, J.M., Nicholls, L.G., Harris, A.L., Stratford, I.J., Hankinson, O., Pugh, C.W., Ratcliffe, P.J. (1997) Hypoxia-inducible factor-1 modulates gene expression in solid tumors and influences both angiogenesis and tumor growth. Proceedings of the National Academy of Sciences of the United States of America. 94(15), 8104–8109.
McConechy, M.K., Ding, J., Senz, J., Yang, W., Melnyk, N., Tone, A.A., Prentice, L.M., Wiegand, K., McAlpine, J.N., Shah, S.P., Lee, C.-H., Goodfellow, P.J., Gilks, C.B., Huntsman, D.G. (2014) Ovarian and endometrial endometrioid carcinomas have distinct CTNNB1 and PTEN mutation profiles. Modern pathology. 27(1), 128–134.
Melin, A., Sparén, P., Persson, I., Bergqvist, A. (2006) Endometriosis and the risk of cancer with special emphasis on ovarian cancer. Human Reproduction. 21(5), 1237–1242.
Meng, Q., Xia, C., Fang, J., Rojanasakul, Y., Jiang, B.-H. (2006) Role of PI3K and AKT specific isoforms in ovarian cancer cell migration, invasion and proliferation through the p70S6K1 pathway. Cellular Signalling. 18(12), 2262–2271.
Menon, U., Ryan, A., Kalsi, J., Gentry-Maharaj, A., Dawnay, A., Habib, M., Apostolidou, S., Singh, N., Benjamin, E., Burnell, M., Davies, S., Sharma, A., Gunu, R., Godfrey, K., Lopes, A., Oram, D., Herod, J., Williamson, K., Seif, M.W., Jenkins, H., Mould, T., Woolas, R., Murdoch, J.B., Dobbs, S., Amso, N.N., Leeson, S., Cruickshank, D., Scott, I., Fallowfield, L., Widschwendter, M., Reynolds, K., McGuire, A., Campbell, S., Parmar, M., Skates, S.J., Jacobs, I. (2015) Risk Algorithm Using Serial Biomarker Measurements Doubles the Number of Screen-Detected Cancers Compared With a Single-Threshold Rule in the United Kingdom Collaborative Trial of Ovarian Cancer Screening. Journal of Clinical Oncology. 33(18), 2062–2071.
Merritt, M.A., Green, A.C., Nagle, C.M., Webb, P.M., Australian Cancer Study (Ovarian Cancer), Australian Ovarian Cancer Study Group (2008) Talcum powder, chronic pelvic inflammation and NSAIDs in relation to risk of epithelial ovarian cancer. International Journal of Cancer. Journal International Du Cancer. 122(1), 170–176.
Misra, U.K., Pizzo, S.V. (2014) Activated α2-Macroglobulin Binding to Cell Surface GRP78 Induces T-Loop Phosphorylation of Akt1 by PDK1 in Association with Raptor. PLoS ONE. 9(2), e88373.
Miwa, S., Yano, S., Kimura, H., Yamamoto, M., Toneri, M., Murakami, T., Hayashi, K., Yamamoto, N., Fujiwara, T., Tsuchiya, H., Hoffman, R.M. (2015) Heterogeneous cell-cycle behavior in response to UVB irradiation by a population of single cancer cells visualized by time-lapse FUCCI imaging. Cell Cycle. 14(12), 1932–1937.

218
Mol, B.W., Bayram, N., Lijmer, J.G., Wiegerinck, M.A., Bongers, M.Y., van der Veen, F., Bossuyt, P.M. (1998) The performance of CA-125 measurement in the detection of endometriosis: a meta-analysis. Fertility and sterility. 70(6), 1101–1108.
Montero, J.C., Chen, X., Ocaña, A., Pandiella, A. (2012) Predominance of mTORC1 over mTORC2 in the regulation of proliferation of ovarian cancer cells: therapeutic implications. Molecular Cancer Therapeutics. 11(6), 1342–1352.
Moraitis, D., Karanikou, M., Liakou, C., Dimas, K., Tzimas, G., Tseleni-Balafouta, S., Patsouris, E., Rassidakis, G.Z., Kouvaraki, M.A. (2014) SIN1, a critical component of the mTOR-Rictor complex, is overexpressed and associated with AKT activation in medullary and aggressive papillary thyroid carcinomas. Surgery. 156(6), 1542–1548; discussion 1548–1549.
Morelon, E., Mamzer-Bruneel, M.F., Peraldi, M.N., Kreis, H. (2001) Sirolimus: a new promising immunosuppressive drug. Towards a rationale for its use in renal transplantation. Nephrology, Dialysis, Transplantation. 16(1), 18–20.
Morotti, M., Remorgida, V., Venturini, P.L., Ferrero, S. (2014) Progestogen-only contraceptive pill compared with combined oral contraceptive in the treatment of pain symptoms caused by endometriosis in patients with migraine without aura. European Journal of Obstetrics, Gynecology, and Reproductive Biology. 179, 63–68.
Nakayama, N., Nakayama, K., Yeasmin, S., Ishibashi, M., Katagiri, A., Iida, K., Fukumoto, M., Miyazaki, K. (2008) KRAS or BRAF mutation status is a useful predictor of sensitivity to MEK inhibition in ovarian cancer. British Journal of Cancer. 99(12), 2020–2028.
Neeyalavira, V., Suprasert, P. (2014) Outcomes of malignant ovarian germ-cell tumors treated in Chiang Mai University Hospital over a nine year period. Asian Pacific journal of cancer prevention. 15(12), 4909–4913.
Neuhaus, P., Klupp, J., Langrehr, J.M. (2001) mTOR inhibitors: An overview. Liver Transplantation. 7(6), 473–484.
NHS (2014) Introduction to Point of Care. Leeds Pathology. [online]. Available from: http://www.pathology.leedsth.nhs.uk/pathology/Departments/BloodSciences/ClinicalBiochemistry/PointofCareTesting.aspx.
NHS (2015a) NHS Diagnostic Waiting Times and Activity Data, May 2015 Monthly Report.
NHS (2015b) Ovarian Cancer Treatment. Royal Marsden. [online]. Available from: http://www.royalmarsden.nhs.uk/cancer-information/types/ovarian-cancer/pages/treatment.aspx.
NHS (2015c) Point of Care Testing Devices. Central Manchester University Hospitals. [online]. Available from: http://www.cmft.nhs.uk/info-for-health-

219
professionals/laboratory-medicine/point-of-care-testing/point-of-care-testing-devices.
NHS (2015d) Point of Care Testing (POCT). Central Manchester University Hospitals. [online]. Available from: http://www.cmft.nhs.uk/info-for-health-professionals/laboratory-medicine/point-of-care-testing.
NHS (2015e) Point of Care Testing Systems. [online]. Available from: https://www.supplychain.nhs.uk/product-news/contract-launch-briefs/2013/september/point-of-care-testing-systems/.
NHS Choices (2015) Endometriosis - NHS Choices. [online]. Available from: http://www.nhs.uk/conditions/endometriosis/pages/introduction.aspx [Accessed August 31, 2015].
NHS Choices (2014) Endometriosis - Treatment - NHS Choices. [online]. Available from: http://www.nhs.uk/Conditions/Endometriosis/Pages/Treatment.aspx [Accessed August 25, 2015].
NHS Choices (2013) Ovarian cancer - NHS Choices. [online]. Available from: http://www.nhs.uk/conditions/cancer-of-the-ovary/pages/introduction.aspx [Accessed July 4, 2013].
NICE (2013) NICE finds advanced ovarian cancer treatment too expensive with not enough benefit | Press and media | News | NICE. [online]. Available from: https://www.nice.org.uk/news/press-and-media/nice-finds-advanced-ovarian-cancer-treatment-too-expensive-with-not-enough-benefit [Accessed July 26, 2015].
NICE (2011) Ovarian cancer: The recognition and initial management of ovarian cancer. Ovarian cancer: The recognition and initial management of ovarian cancer. [online]. Available from: https://www.nice.org.uk/guidance/cg122/chapter/guidance [Accessed August 18, 2015].
No, J.H., Jeon, Y.-T., Park, I.-A., Kim, Y.-B., Kim, J.W., Park, N.-H., Kang, S.-B., Han, J.Y., Lim, J.M., Song, Y.-S. (2011) Activation of mTOR signaling pathway associated with adverse prognostic factors of epithelial ovarian cancer. Gynecologic Oncology. 121(1), 8–12.
Nyman, E., Rajan, M.R., Fagerholm, S., Brännmark, C., Cedersund, G., Strålfors, P. (2014) A single mechanism can explain network-wide insulin resistance in adipocytes from obese patients with type 2 diabetes. The Journal of Biological Chemistry. 289(48), 33215–33230.
Obata, K., Morland, S.J., Watson, R.H., Hitchcock, A., Chenevix-Trench, G., Thomas, E.J., Campbell, I.G. (1998) Frequent PTEN/MMAC mutations in endometrioid but not serous or mucinous epithelial ovarian tumors. Cancer Research. 58(10), 2095–2097.

220
Orezzoli, J.P., Russell, A.H., Oliva, E., Del Carmen, M.G., Eichhorn, J., Fuller, A.F. (2008) Prognostic implication of endometriosis in clear cell carcinoma of the ovary. Gynecologic Oncology. 110(3), 336–344.
Parness, J., Horwitz, S.B. (1981) Taxol binds to polymerized tubulin in vitro. The Journal of Cell Biology. 91(2 Pt 1), 479–487.
Patel, A.P., Tirosh, I., Trombetta, J.J., Shalek, A.K., Gillespie, S.M., Wakimoto, H., Cahill, D.P., Nahed, B.V., Curry, W.T., Martuza, R.L., Louis, D.N., Rozenblatt-Rosen, O., Suvà, M.L., Regev, A., Bernstein, B.E. (2014) Single-cell RNA-seq highlights intratumoral heterogeneity in primary glioblastoma. Science. 344(6190), 1396–1401.
Pause, A., Belsham, G.J., Gingras, A.C., Donzé, O., Lin, T.A., Lawrence, J.C., Sonenberg, N. (1994) Insulin-dependent stimulation of protein synthesis by phosphorylation of a regulator of 5’-cap function. Nature. 371(6500), 762–767.
Pause, A., Methot, N., Svitkin, Y., Merrick, W.C., Sonenberg, N. (1994) Dominant negative mutants of mammalian translation initiation factor eIF-4A define a critical role for eIF-4F in cap-dependent and cap-independent initiation of translation. The EMBO Journal. 13(5), 1205–1215.
Pearce, C.L., Templeman, C., Rossing, M.A., Lee, A., Near, A.M., Webb, P.M., Nagle, C.M., Doherty, J.A., Cushing-Haugen, K.L., Wicklund, K.G., Chang-Claude, J., Hein, R., Lurie, G., Wilkens, L.R., Carney, M.E., Goodman, M.T., Moysich, K., Kjaer, S.K., Hogdall, E., Jensen, A., Goode, E.L., Fridley, B.L., Larson, M.C., Schildkraut, J.M., Palmieri, R.T., Cramer, D.W., Terry, K.L., Vitonis, A.F., Titus, L.J., Ziogas, A., Brewster, W., Anton-Culver, H., Gentry-Maharaj, A., Ramus, S.J., Anderson, A.R., Brueggmann, D., Fasching, P.A., Gayther, S.A., Huntsman, D.G., Menon, U., Ness, R.B., Pike, M.C., Risch, H., Wu, A.H., Berchuck, A. (2012) Association between endometriosis and risk of histological subtypes of ovarian cancer: a pooled analysis of case-control studies. The Lancet Oncology. 13(4), 385–394.
Pearce, L.R., Huang, X., Boudeau, J., Pawłowski, R., Wullschleger, S., Deak, M., Ibrahim, A.F.M., Gourlay, R., Magnuson, M.A., Alessi, D.R. (2007) Identification of Protor as a novel Rictor-binding component of mTOR complex-2. The Biochemical journal. 405(3), 513–522.
Pecorino, L. (2008) Molecular Biology of Cancer: Mechanisms, Targets, and Therapeutics. 2 edition. Oxford ; New York: OUP Oxford.
Pei, L., Xie, P., Zhou, E., Yang, Q., Luo, Y., Tang, Z. (2011) Overexpression of DEP domain containing mTOR-interacting protein correlates with poor prognosis in differentiated thyroid carcinoma. Molecular Medicine Reports. 4(5), 817–823.
Peterson, T.R., Laplante, M., Thoreen, C.C., Sancak, Y., Kang, S.A., Kuehl, W.M., Gray, N.S., Sabatini, D.M. (2009) DEPTOR is an mTOR inhibitor frequently overexpressed in multiple myeloma cells and required for their survival. Cell. 137(5), 873–886.

221
Peterson, T.R., Sengupta, S.S., Harris, T.E., Carmack, A.E., Kang, S.A., Balderas, E., Guertin, D.A., Madden, K.L., Carpenter, A.E., Finck, B.N., Sabatini, D.M. (2011) mTOR complex 1 regulates lipin 1 localization to control the SREBP pathway. Cell. 146(3), 408–420.
Petrillo, M., Paris, I., Vizzielli, G., Amadio, G., Cosentino, F., Salutari, V., Scambia, G., Fagotti, A. (2015) Neoadjuvant Chemotherapy Followed by Maintenance Therapy With or Without Bevacizumab in Unresectable High-Grade Serous Ovarian Cancer: A Case-Control Study. Annals of Surgical Oncology.
Phillips, R.J., Mestas, J., Gharaee-Kermani, M., Burdick, M.D., Sica, A., Belperio, J.A., Keane, M.P., Strieter, R.M. (2005) Epidermal growth factor and hypoxia-induced expression of CXC chemokine receptor 4 on non-small cell lung cancer cells is regulated by the phosphatidylinositol 3-kinase/PTEN/AKT/mammalian target of rapamycin signaling pathway and activation of hypoxia inducible factor-1alpha. The Journal of Biological Chemistry. 280(23), 22473–22481.
Philp, A.J., Campbell, I.G., Leet, C., Vincan, E., Rockman, S.P., Whitehead, R.H., Thomas, R.J., Phillips, W.A. (2001) The phosphatidylinositol 3’-kinase p85alpha gene is an oncogene in human ovarian and colon tumors. Cancer Research. 61(20), 7426–7429.
Plaxe, S.C. (2008) Epidemiology of low-grade serous ovarian cancer. American Journal of Obstetrics and Gynecology. 198(4), 459.e1–459.e9.
Pon, Y.L., Zhou, H.Y., Cheung, A.N.Y., Ngan, H.Y.S., Wong, A.S.T. (2008) p70 S6 kinase promotes epithelial to mesenchymal transition through snail induction in ovarian cancer cells. Cancer Research. 68(16), 6524–6532.
Porstmann, T., Santos, C.R., Griffiths, B., Cully, M., Wu, M., Leevers, S., Griffiths, J.R., Chung, Y.-L., Schulze, A. (2008) SREBP activity is regulated by mTORC1 and contributes to Akt-dependent cell growth. Cell Metabolism. 8(3), 224–236.
Porter, L.A., Donoghue, D.J. (2003) Cyclin B1 and CDK1: nuclear localization and upstream regulators. Progress in Cell Cycle Research. 5, 335–347.
Potter, C.J., Pedraza, L.G., Xu, T. (2002) Akt regulates growth by directly phosphorylating Tsc2. Nature Cell Biology. 4(9), 658–665.
Prado, C.M.M., Baracos, V.E., Xiao, J., Birdsell, L., Stuyckens, K., Park, Y.C., Parekh, T., Sawyer, M.B. (2014) The association between body composition and toxicities from the combination of Doxil and trabectedin in patients with advanced relapsed ovarian cancer. Applied Physiology, Nutrition, and Metabolism. 39(6), 693–698.
Presta, L.G., Chen, H., O’Connor, S.J., Chisholm, V., Meng, Y.G., Krummen, L., Winkler, M., Ferrara, N. (1997) Humanization of an anti-vascular endothelial growth factor monoclonal antibody for the therapy of solid tumors and other disorders. Cancer Research. 57(20), 4593–4599.

222
Prevot, N., Pyaram, K., Bischoff, E., Sen, J.M., Powell, J.D., Chang, C.-H. (2015) Mammalian Target of Rapamycin Complex 2 Regulates Invariant NKT Cell Development and Function Independent of Promyelocytic Leukemia Zinc-Finger. The Journal of Immunology. 194(1), 223–230.
Primerdesign (2014) geNorm Reference Gene Selection Kit. [online]. Available from: http://www.primerdesign.co.uk/assets/files/genorm_sybrgreen_handbook.pdf?timestamp=1439572558.
Qiagen (2015) Rotor-Gene Q. Qiagen. [online]. Available from: https://www.qiagen.com/gb/shop/automated-solutions/detection-and-analysis/rotor-gene-q/#productdetails.
Quirk, J.T., Natarajan, N. (2005) Ovarian cancer incidence in the United States, 1992–1999. Gynecologic Oncology. 97(2), 519–523.
Qu, X., Yu, J., Bhagat, G., Furuya, N., Hibshoosh, H., Troxel, A., Rosen, J., Eskelinen, E.-L., Mizushima, N., Ohsumi, Y., Cattoretti, G., Levine, B. (2003) Promotion of tumorigenesis by heterozygous disruption of the beclin 1 autophagy gene. The Journal of Clinical Investigation. 112(12), 1809–1820.
Reade, C.J., McVey, R.M., Tone, A.A., Finlayson, S.J., McAlpine, J.N., Fung-Kee-Fung, M., Ferguson, S.E. (2014) The fallopian tube as the origin of high grade serous ovarian cancer: review of a paradigm shift. Journal of obstetrics and gynaecology. 36(2), 133–140.
Reed, E., Ozols, R.F., Tarone, R., Yuspa, S.H., Poirier, M.C. (1987) Platinum-DNA adducts in leukocyte DNA correlate with disease response in ovarian cancer patients receiving platinum-based chemotherapy. Proceedings of the National Academy of Sciences of the United States of America. 84(14), 5024–5028.
Reinartz, S., Failer, S., Schuell, T., Wagner, U. (2012) CA125 (MUC16) gene silencing suppresses growth properties of ovarian and breast cancer cells. European Journal of Cancer. 48(10), 1558–1569.
Rhodes, D.R., Yu, J., Shanker, K., Deshpande, N., Varambally, R., Ghosh, D., Barrette, T., Pandey, A., Chinnaiyan, A.M. (2004) ONCOMINE: A Cancer Microarray Database and Integrated Data-Mining Platform. Neoplasia. 6(1), 1–6.
Risch, H.A., Marrett, L.D., Jain, M., Howe, G.R. (1996) Differences in risk factors for epithelial ovarian cancer by histologic type. Results of a case-control study. American Journal of Epidemiology. 144(4), 363–372.
Rizk, B., Fischer, A.S., Lotfy, H.A., Turki, R., Zahed, H.A., Malik, R., Holliday, C.P., Glass, A., Fishel, H., Soliman, M.Y., Herrera, D. (2014) Recurrence of endometriosis after hysterectomy. Facts, Views & Vision in ObGyn. 6(4), 219–227.
Roos, S., Jansson, N., Palmberg, I., Säljö, K., Powell, T.L., Jansson, T. (2007) Mammalian target of rapamycin in the human placenta regulates leucine transport

223
and is down-regulated in restricted fetal growth. The Journal of Physiology. 582(Pt 1), 449–459.
Rose, P.G., Piver, M.S., Tsukada, Y., Lau, T. (1989) Metastatic patterns in histologic variants of ovarian cancer. An autopsy study. Cancer. 64(7), 1508–1513.
Rossing, M.A., Cushing-Haugen, K.L., Wicklund, K.G., Doherty, J.A., Weiss, N.S. (2008) Risk of epithelial ovarian cancer in relation to benign ovarian conditions and ovarian surgery. Cancer causes & control. 19(10), 1357–1364.
Rozen-Zvi, B., Hayashida, T., Hubchak, S.C., Hanna, C., Platanias, L.C., William Schnaper, H. (2013) TGF-β/Smad3 activates mammalian target of rapamycin complex-1 to promote collagen production by increasing HIF-1α expression. American Journal of Physiology - Renal Physiology. 305(4), F485–F494.
Rump, A., Morikawa, Y., Tanaka, M., Minami, S., Umesaki, N., Takeuchi, M., Miyajima, A. (2004) Binding of Ovarian Cancer Antigen CA125/MUC16 to Mesothelin Mediates Cell Adhesion. Journal of Biological Chemistry. 279(10), 9190–9198.
Russo, E., Citraro, R., Constanti, A., De Sarro, G. (2012) The mTOR Signaling Pathway in the Brain: Focus on Epilepsy and Epileptogenesis. Molecular neurobiology. 46(3), 662–681.
Sabatini, D.M., Barrow, R.K., Blackshaw, S., Burnett, P.E., Lai, M.M., Field, M.E., Bahr, B.A., Kirsch, J., Betz, H., Snyder, S.H. (1999) Interaction of RAFT1 with gephyrin required for rapamycin-sensitive signaling. Science. 284(5417), 1161–1164.
Saber, M.M., Zeeneldin, A.A., El Gammal, M.M., Salem, S.E., Darweesh, A.D., Abdelaziz, A.A., Monir, M. (2014) Treatment outcomes of female germ cell tumors: the Egyptian National Cancer Institute experience. Journal of the Egyptian National Cancer Institute. 26(2), 103–108.
Sabers, C.J., Martin, M.M., Brunn, G.J., Williams, J.M., Dumont, F.J., Wiederrecht, G., Abraham, R.T. (1995) Isolation of a protein target of the FKBP12-rapamycin complex in mammalian cells. The Journal of biological chemistry. 270(2), 815–822.
Sablina, A.A., Budanov, A.V., Ilyinskaya, G.V., Agapova, L.S., Kravchenko, J.E., Chumakov, P.M. (2005) The antioxidant function of the p53 tumor suppressor. Nature medicine. 11(12), 1306–1313.
Saeed, A.A., Sims, A.H., Prime, S.S., Paterson, I., Murray, P.G., Lopes, V.R. (2015) Gene expression profiling reveals biological pathways responsible for phenotypic heterogeneity between UK and Sri Lankan oral squamous cell carcinomas. Oral Oncology. 51(3), 237–246.
Sainz de la Cuesta, R., Eichhorn, J.H., Rice, L.W., Fuller, A.F., Nikrui, N., Goff, B.A. (1996) Histologic transformation of benign endometriosis to early epithelial ovarian cancer. Gynecologic Oncology. 60(2), 238–244.

224
Salani, R., Kurman, R.J., Giuntoli, R., Gardner, G., Bristow, R., Wang, T.-L., Shih, I.-M. (2008) Assessment of TP53 mutation using purified tissue samples of ovarian serous carcinomas reveals a higher mutation rate than previously reported and does not correlate with drug resistance. International Journal of Gynecological Cancer: Official Journal of the International Gynecological Cancer Society. 18(3), 487–491.
Samaan, M.C., Anand, S.S., Sharma, A.M., Samjoo, I.A., Tarnopolsky, M.A. (2015) Sex differences in skeletal muscle phosphatase and tensin homolog deleted on chromosome 10 (PTEN) levels: a cross-sectional study. Scientific Reports. 5, 9154.
Sampson, J.A. (1927) Metastatic or Embolic Endometriosis, due to the Menstrual Dissemination of Endometrial Tissue into the Venous Circulation. The American Journal of Pathology. 3(2), 93–110.43.
Sancak, Y., Bar-Peled, L., Zoncu, R., Markhard, A.L., Nada, S., Sabatini, D.M. (2010) Ragulator-Rag complex targets mTORC1 to the lysosomal surface and is necessary for its activation by amino acids. Cell. 141(2), 290–303.
Sancak, Y., Thoreen, C.C., Peterson, T.R., Lindquist, R.A., Kang, S.A., Spooner, E., Carr, S.A., Sabatini, D.M. (2007) PRAS40 is an insulin-regulated inhibitor of the mTORC1 protein kinase. Molecular cell. 25(6), 903–915.
Santillan, A., Kim, Y.W., Zahurak, M.L., Gardner, G.J., Giuntoli, R.L., Shih, I.M., Bristow, R.E. (2007) Differences of chemoresistance assay between invasive micropapillary/low-grade serous ovarian carcinoma and high-grade serous ovarian carcinoma. International Journal of Gynecological Cancer. 17(3), 601–606.
Sarbassov, D.D., Ali, S.M., Kim, D.-H., Guertin, D.A., Latek, R.R., Erdjument-Bromage, H., Tempst, P., Sabatini, D.M. (2004) Rictor, a novel binding partner of mTOR, defines a rapamycin-insensitive and raptor-independent pathway that regulates the cytoskeleton. Current biology. 14(14), 1296–1302.
Sarbassov, D.D., Ali, S.M., Sengupta, S., Sheen, J.-H., Hsu, P.P., Bagley, A.F., Markhard, A.L., Sabatini, D.M. (2006) Prolonged rapamycin treatment inhibits mTORC2 assembly and Akt/PKB. Molecular cell. 22(2), 159–168.
Sarbassov, D.D., Guertin, D.A., Ali, S.M., Sabatini, D.M. (2005) Phosphorylation and regulation of Akt/PKB by the rictor-mTOR complex. Science. 307(5712), 1098–1101.
Sarwar, S., Siddiqui, N., Ather, S., Hannan, A., Ali Syed, A., Zafar, W. (2014) Outcomes among patients with sex cord stromal tumour of ovary: experience from Pakistan. Journal of Ayub Medical College. 26(3), 389–392.
Schiff, P.B., Horwitz, S.B. (1980) Taxol stabilizes microtubules in mouse fibroblast cells. Proceedings of the National Academy of Sciences of the United States of America. 77(3), 1561–1565.
Schmeler, K.M., Sun, C.C., Bodurka, D.C., T. Deavers, M., Malpica, A., Coleman, R.L., Ramirez, P.T., Gershenson, D.M. (2008) Neoadjuvant chemotherapy for low-grade

225
serous carcinoma of the ovary or peritoneum. Gynecologic Oncology. 108(3), 510–514.
Schneeberger, C., Speiser, P., Kury, F., Zeillinger, R. (1995) Quantitative detection of reverse transcriptase-PCR products by means of a novel and sensitive DNA stain. PCR methods and applications. 4(4), 234–238.
Schrauwen, S., Depreeuw, J., Coenegrachts, L., Hermans, E., Lambrechts, D., Amant, F. (2015) Dual blockade of PI3K/AKT/mTOR (NVP-BEZ235) and Ras/Raf/MEK (AZD6244) pathways synergistically inhibit growth of primary endometrioid endometrial carcinoma cultures, whereas NVP-BEZ235 reduces tumor growth in the corresponding xenograft models. Gynecologic Oncology. 138(1), 165–173.
Sedrani, R., Cottens, S., Kallen, J., Schuler, W. (1998) Chemical modification of rapamycin: the discovery of SDZ RAD. Transplantation Proceedings. 30(5), 2192–2194.
SEER (2015a) SEER Stat Fact Sheets: Breast Cancer. Surveillance, Epidemiology, and End Results Program. [online]. Available from: http://seer.cancer.gov/statfacts/html/breast.html.
SEER (2015b) SEER Stat Fact Sheets: Colon and Rectum Cancer. Surveillance, Epidemiology, and End Results Program. [online]. Available from: http://seer.cancer.gov/statfacts/html/colorect.html.
SEER (2015c) SEER Stat Fact Sheets: Ovary Cancer. Surveillance, Epidemiology, and End Results Program. [online]. Available from: http://seer.cancer.gov/statfacts/html/ovary.html.
SEER (2015d) SEER Stat Fact Sheets: Prostate Cancer. Surveillance, Epidemiology, and End Results Program. [online]. Available from: http://seer.cancer.gov/statfacts/html/prost.html.
Sehgal, S.N., Baker, H., Vézina, C. (1975) Rapamycin (AY-22,989), a new antifungal antibiotic. II. Fermentation, isolation and characterization. The Journal of antibiotics. 28(10), 727–732.
Seidman, J.D., Horkayne-Szakaly, I., Haiba, M., Boice, C.R., Kurman, R.J., Ronnett, B.M. (2004) The histologic type and stage distribution of ovarian carcinomas of surface epithelial origin. International Journal of Gynecological Pathology. 23(1), 41–44.
Serra, V., Markman, B., Scaltriti, M., Eichhorn, P.J.A., Valero, V., Guzman, M., Botero, M.L., Llonch, E., Atzori, F., Di Cosimo, S., Maira, M., Garcia-Echeverria, C., Parra, J.L., Arribas, J., Baselga, J. (2008) NVP-BEZ235, a dual PI3K/mTOR inhibitor, prevents PI3K signaling and inhibits the growth of cancer cells with activating PI3K mutations. Cancer Research. 68(19), 8022–8030.

226
Servier (2014) Servier Medical Art. Servier. [online]. Available from: http://www.servier.co.uk/content/servier-medical-art.
Shahrabi-Farahani, M., Shahbazi, S., Mahdian, R., Amini-Moghaddam, S. (2014) K-Ras 4A Transcript variant is up-regulated in eutopic endometrium of endometriosis patients during proliferative phase of menstrual cycle. Archives of Gynecology and Obstetrics. 292(1), 225–229.
Shalek, A.K., Satija, R., Adiconis, X., Gertner, R.S., Gaublomme, J.T., Raychowdhury, R., Schwartz, S., Yosef, N., Malboeuf, C., Lu, D., Trombetta, J.J., Gennert, D., Gnirke, A., Goren, A., Hacohen, N., Levin, J.Z., Park, H., Regev, A. (2013) Single-cell transcriptomics reveals bimodality in expression and splicing in immune cells. Nature. 498(7453), 236–240.
Shalek, A.K., Satija, R., Shuga, J., Trombetta, J.J., Gennert, D., Lu, D., Chen, P., Gertner, R.S., Gaublomme, J.T., Yosef, N., Schwartz, S., Fowler, B., Weaver, S., Wang, J., Wang, X., Ding, R., Raychowdhury, R., Friedman, N., Hacohen, N., Park, H., May, A.P., Regev, A. (2014) Single-cell RNA-seq reveals dynamic paracrine control of cellular variation. Nature. 510(7505), 363–369.
Shao, Z., Bao, Q., Jiang, F., Qian, H., Fang, Q., Hu, X. (2015) VS-5584, a Novel PI3K-mTOR Dual Inhibitor, Inhibits Melanoma Cell Growth In Vitro and In Vivo. PLoS ONE. 10(7), e0132655.
Shaw, R.J., Kosmatka, M., Bardeesy, N., Hurley, R.L., Witters, L.A., DePinho, R.A., Cantley, L.C. (2004) The tumor suppressor LKB1 kinase directly activates AMP-activated kinase and regulates apoptosis in response to energy stress. Proceedings of the National Academy of Sciences of the United States of America. 101(10), 3329–3335.
Shin, E., Choi, C.M., Kim, H.R., Jang, S.J., Park, Y.S. (2015) Immunohistochemical characterization of the mTOR pathway in stage-I non-small-cell lung carcinoma. Lung Cancer. 89(1), 13–18.
Shu, J., Huang, M., Tian, Q., Shui, Q., Zhou, Y., Chen, J. (2015) Downregulation of angiogenin inhibits the growth and induces apoptosis in human bladder cancer cells through regulating AKT/mTOR signaling pathway. Journal of Molecular Histology. 46(2), 157–171.
Siemer, S., Ørnskov, D., Guerra, B., Boldyreff, B., Issinger, O.-G. (1999) Determination of mRNA, and protein levels of p53, MDM2 and protein kinase CK2 subunits in F9 cells after treatment with the apoptosis-inducing drugs cisplatin and carboplatin. The International Journal of Biochemistry & Cell Biology. 31(6), 661–670.
Simoncini, T., Hafezi-Moghadam, A., Brazil, D.P., Ley, K., Chin, W.W., Liao, J.K. (2000) Interaction of oestrogen receptor with the regulatory subunit of phosphatidylinositol-3-OH kinase. Nature. 407(6803), 538–541.

227
Sinaii, N., Cleary, S.D., Ballweg, M.L., Nieman, L.K., Stratton, P. (2002) High rates of autoimmune and endocrine disorders, fibromyalgia, chronic fatigue syndrome and atopic diseases among women with endometriosis: a survey analysis. Human Reproduction. 17(10), 2715–2724.
Smith, E.M., Finn, S.G., Tee, A.R., Browne, G.J., Proud, C.G. (2005) The tuberous sclerosis protein TSC2 is not required for the regulation of the mammalian target of rapamycin by amino acids and certain cellular stresses. The Journal of Biological Chemistry. 280(19), 18717–18727.
Smith, H.O., Berwick, M., Verschraegen, C.F., Wiggins, C., Lansing, L., Muller, C.Y., Qualls, C.R. (2006) Incidence and survival rates for female malignant germ cell tumors. Obstetrics and Gynecology. 107(5), 1075–1085.
Smolle, E., Taucher, V., Pichler, M., Petru, E., Lax, S., Haybaeck, J. (2013) Targeting Signaling Pathways in Epithelial Ovarian Cancer. International Journal of Molecular Sciences. 14(5), 9536–9555.
Society for Gynecologic Oncology (2014) FIGO Ovarian Cancer Staging. Society for Gynecologic Oncology. [online]. Available from: https://www.sgo.org/wp-content/uploads/2012/09/FIGO-Ovarian-Cancer-Staging_1.10.14.pdf.
Song, R., Tian, K., Wang, W., Wang, L. (2015) P53 suppresses cell proliferation, metastasis, and angiogenesis of osteosarcoma through inhibition of the PI3K/AKT/mTOR pathway. International Journal of Surgery. 20, 80–87.
Squillace, R.M., Miller, D., Cookson, M., Wardwell, S.D., Moran, L., Clapham, D., Wang, F., Clackson, T., Rivera, V.M. (2011) Antitumor activity of ridaforolimus and potential cell-cycle determinants of sensitivity in sarcoma and endometrial cancer models. Molecular Cancer Therapeutics. 10(10), 1959–1968.
Stambolic, V., MacPherson, D., Sas, D., Lin, Y., Snow, B., Jang, Y., Benchimol, S., Mak, T.W. (2001) Regulation of PTEN transcription by p53. Molecular Cell. 8(2), 317–325.
Starup-Linde, J., Karlstad, O., Eriksen, S.A., Vestergaard, P., Bronsveld, H.K., de Vries, F., Andersen, M., Auvinen, A., Haukka, J., Hjellvik, V., Bazelier, M.T., Boer, A. de, Furu, K., De Bruin, M.L. (2013) CARING (CAncer Risk and INsulin analoGues): the association of diabetes mellitus and cancer risk with focus on possible determinants - a systematic review and a meta-analysis. Current Drug Safety. 8(5), 296–332.
Stephen A. Bustin ed. (2014) The PCR Revolution. 1st ed.
Stewart, C.A., Dell’orco, R.T. (1992) Expression of proliferationg cell nuclear antigen during the cell cycle of human diploid fibroblasts. In Vitro Cellular & Developmental Biology - Animal. 28(3), 211–214.
Stewart, L.M., Holman, C.D.J., Aboagye-Sarfo, P., Finn, J.C., Preen, D.B., Hart, R. (2013) In vitro fertilization, endometriosis, nulliparity and ovarian cancer risk. Gynecologic oncology. 128(2), 260–264.

228
Stokoe, D., Stephens, L.R., Copeland, T., Gaffney, P.R., Reese, C.B., Painter, G.F., Holmes, A.B., McCormick, F., Hawkins, P.T. (1997) Dual role of phosphatidylinositol-3,4,5-trisphosphate in the activation of protein kinase B. Science. 277(5325), 567–570.
Sudhagar, S., Sathya, S., Lakshmi, B.S. (2011) Rapid non-genomic signalling by 17β-oestradiol through c-Src involves mTOR-dependent expression of HIF-1α in breast cancer cells. British Journal of Cancer. 105(7), 953–960.
Sun, H., Lesche, R., Li, D.-M., Liliental, J., Zhang, H., Gao, J., Gavrilova, N., Mueller, B., Liu, X., Wu, H. (1999) PTEN modulates cell cycle progression and cell survival by regulating phosphatidylinositol 3,4,5,-trisphosphate and Akt/protein kinase B signaling pathway. Proceedings of the National Academy of Sciences of the United States of America. 96(11), 6199–6204.
Tania Nolan, S.A.B. ed. (2013) PCR Technology: Current Innovations, Third Edition.
Tee, A.R., Blenis, J. (2005) mTOR, translational control and human disease. Seminars in Cell & Developmental Biology. 16(1), 29–37.
Tee, A.R., Manning, B.D., Roux, P.P., Cantley, L.C., Blenis, J. (2003) Tuberous sclerosis complex gene products, Tuberin and Hamartin, control mTOR signaling by acting as a GTPase-activating protein complex toward Rheb. Current biology. 13(15), 1259–1268.
Tenti, P., Aguzzi, A., Riva, C., Usellini, L., Zappatore, R., Bara, J., Samloff, I.M., Solcia, E. (1992) Ovarian mucinous tumors frequently express markers of gastric, intestinal, and pancreatobiliary epithelial cells. Cancer. 69(8), 2131–2142.
Terry, K.L., Karageorgi, S., Shvetsov, Y.B., Merritt, M.A., Lurie, G., Thompson, P.J., Carney, M.E., Weber, R.P., Akushevich, L., Lo-Ciganic, W.-H., Cushing-Haugen, K., Sieh, W., Moysich, K., Doherty, J.A., Nagle, C.M., Berchuck, A., Pearce, C.L., Pike, M., Ness, R.B., Webb, P.M., Australian Cancer Study (Ovarian Cancer), Australian Ovarian Cancer Study Group, Rossing, M.A., Schildkraut, J., Risch, H., Goodman, M.T., Ovarian Cancer Association Consortium (2013) Genital powder use and risk of ovarian cancer: a pooled analysis of 8,525 cases and 9,859 controls. Cancer Prevention Research. 6(8), 811–821.
The Cancer Genome Atlas (2015) The Cancer Genome Atlas Home Page. The Cancer Genome Atlas - National Cancer Institute. [online]. Available from: http://cancergenome.nih.gov/ [Accessed August 14, 2015].
Thedieck, K., Polak, P., Kim, M.L., Molle, K.D., Cohen, A., Jenö, P., Arrieumerlou, C., Hall, M.N. (2007) PRAS40 and PRR5-like protein are new mTOR interactors that regulate apoptosis. PloS One. 2(11), e1217.
ThermoFisher Scientific (2015) 7900HT Fast Real-Time PCR System with Fast 96-Well Block Module. ThermoFisher Scientific. [online]. Available from: http://www.thermofisher.com/order/catalog/product/4351405.

229
Thorpe, L.M., Yuzugullu, H., Zhao, J.J. (2015) PI3K in cancer: divergent roles of isoforms, modes of activation and therapeutic targeting. Nature Reviews. Cancer. 15(1), 7–24.
Tortora, G.J., Derrickson, B. (2005) Principles of Anatomy and Physiology. 11th Edition. Hoboken, NJ: John Wiley & Sons.
Treeck, O., Wackwitz, B., Haus, U., Ortmann, O. (2006) Effects of a combined treatment with mTOR inhibitor RAD001 and tamoxifen in vitro on growth and apoptosis of human cancer cells. Gynecologic Oncology. 102(2), 292–299.
Treins, C., Giorgetti-Peraldi, S., Murdaca, J., Semenza, G.L., Van Obberghen, E. (2002) Insulin stimulates hypoxia-inducible factor 1 through a phosphatidylinositol 3-kinase/target of rapamycin-dependent signaling pathway. The Journal of Biological Chemistry. 277(31), 27975–27981.
Trimbos, J.B., Vergote, I., Bolis, G., Vermorken, J.B., Mangioni, C., Madronal, C., Franchi, M., Tateo, S., Zanetta, G., Scarfone, G., Giurgea, L., Timmers, P., Coens, C., Pecorelli, S., Collaborators, F. the E.-A. (2003) Impact of Adjuvant Chemotherapy and Surgical Staging in Early-Stage Ovarian Carcinoma: European Organisation for Research and Treatment of Cancer–Adjuvant ChemoTherapy in Ovarian Neoplasm Trial. Journal of the National Cancer Institute. 95(2), 113–125.
Troca-Marín, J.A., Alves-Sampaio, A., Montesinos, M.L. (2012) Deregulated mTOR-mediated translation in intellectual disability. Progress in neurobiology. 96(2), 268–282.
Truong, M., Cook, M.R., Pinchot, S.N., Kunnimalaiyaan, M., Chen, H. (2011) Resveratrol induces Notch2-mediated apoptosis and suppression of neuroendocrine markers in medullary thyroid cancer. Annals of Surgical Oncology. 18(5), 1506–1511.
Tsoref, D., Welch, S., Lau, S., Biagi, J., Tonkin, K., Martin, L.A., Ellard, S., Ghatage, P., Elit, L., Mackay, H.J., Allo, G., Tsao, M.-S., Kamel-Reid, S., Eisenhauer, E.A., Oza, A.M. (2014) Phase II study of oral ridaforolimus in women with recurrent or metastatic endometrial cancer. Gynecologic Oncology. 135(2), 184–189.
Tung, K.-H., Goodman, M.T., Wu, A.H., McDuffie, K., Wilkens, L.R., Kolonel, L.N., Nomura, A.M.Y., Terada, K.Y., Carney, M.E., Sobin, L.H. (2003) Reproductive factors and epithelial ovarian cancer risk by histologic type: a multiethnic case-control study. American Journal of Epidemiology. 158(7), 629–638.
Tzatsos, A., Kandror, K.V. (2006) Nutrients suppress phosphatidylinositol 3-kinase/Akt signaling via raptor-dependent mTOR-mediated insulin receptor substrate 1 phosphorylation. Molecular and Cellular Biology. 26(1), 63–76.
Um, S.H., Frigerio, F., Watanabe, M., Picard, F., Joaquin, M., Sticker, M., Fumagalli, S., Allegrini, P.R., Kozma, S.C., Auwerx, J., Thomas, G. (2004) Absence of S6K1

230
protects against age- and diet-induced obesity while enhancing insulin sensitivity. Nature. 431(7005), 200–205.
Unger, F.T., Klasen, H.A., Tchartchian, G., de Wilde, R.L., Witte, I. (2009) DNA damage induced by cis- and carboplatin as indicator for in vitro sensitivity of ovarian carcinoma cells. BMC cancer. 9, 359.
Vang, R., Shih, I.-M., Kurman, R.J. (2009) OVARIAN LOW-GRADE AND HIGH-GRADE SEROUS CARCINOMA: Pathogenesis, Clinicopathologic and Molecular Biologic Features, and Diagnostic Problems. Advances in anatomic pathology. 16(5), 267–282.
Veras, E., Mao, T.-L., Ayhan, A., Ueda, S., Lai, H., Hayran, M., Shih, I.-M., Kurman, R.J. (2009) Cystic and adenofibromatous clear cell carcinomas of the ovary: distinctive tumors that differ in their pathogenesis and behavior: a clinicopathologic analysis of 122 cases. The American Journal of Surgical Pathology. 33(6), 844–853.
Vézina, C., Kudelski, A., Sehgal, S.N. (1975) Rapamycin (AY-22,989), a new antifungal antibiotic. I. Taxonomy of the producing streptomycete and isolation of the active principle. The Journal of antibiotics. 28(10), 721–726.
Wang, G.L., Jiang, B.H., Rue, E.A., Semenza, G.L. (1995) Hypoxia-inducible factor 1 is a basic-helix-loop-helix-PAS heterodimer regulated by cellular O2 tension. Proceedings of the National Academy of Sciences of the United States of America. 92(12), 5510–5514.
Wang, Y., Fei, D., Vanderlaan, M., Song, A. (2004) Biological activity of bevacizumab, a humanized anti-VEGF antibody in vitro. Angiogenesis. 7(4), 335–345.
Wataya-Kaneda, M. (2015) Mammalian target of rapamycin and tuberous sclerosis complex. Journal of Dermatological Science. 79(2), 93–100.
Weiss, N.S., Homonchuk, T., Young, J.L. (1977) Incidence of the histologic types of ovarian cancer: the U.S. Third National Cancer Survey, 1969-1971. Gynecologic Oncology. 5(2), 161–167.
Weng, L.-P., Smith, W.M., Dahia, P.L.M., Ziebold, U., Gil, E., Lees, J.A., Eng, C. (1999) PTEN Suppresses Breast Cancer Cell Growth by Phosphatase Activity-dependent G1 Arrest followed by Cell Death. Cancer Research. 59(22), 5808–5814.
Wilson, M.A., Zhao, F., Khare, S., D’Andrea, K., Wubbenhorst, B., Roszik, J., Woodman, S.E., Rimm, D.L., Kirkwood, J.M., Kluger, H.M., Schuchter, L.M., Lee, S.J., Flaherty, K.T., Nathanson, K.L. (2015) Copy number changes are associated with response to treatment with carboplatin, paclitaxel, and sorafenib in melanoma. Clinical Cancer Research.
Wu, A.H., Pearce, C.L., Tseng, C.-C., Templeman, C., Pike, M.C. (2009) Markers of inflammation and risk of ovarian cancer in Los Angeles County. International Journal of Cancer. 124(6), 1409–1415.

231
Wu, J., Yin, R.-X., Guo, T., Lin, Q.-Z., Shen, S.-W., Sun, J.-Q., Shi, G.-Y., Wu, J.-Z., Yang, D.-Z., Lin, W.-X. (2015) Gender-specific association between the cytoplasmic poly(A) binding protein 4 rs4660293 single nucleotide polymorphism and serum lipid levels. Molecular Medicine Reports. 12(3), 3476–3486.
Xu, M., Bu, L.-M., Wu, K., Lu, L.-G., Wang, X.-P. (2015) Rapamycin inhibits the proliferation of SW1990 pancreatic cancer cell. European Review for Medical and Pharmacological Sciences. 19(16), 3072–3079.
Yang, H.-J., Liu, V.W.S., Wang, Y., Tsang, P.C.K., Ngan, H.Y.S. (2006) Differential DNA methylation profiles in gynecological cancers and correlation with clinico-pathological data. BMC cancer. 6, 212.
Yip, C.K., Murata, K., Walz, T., Sabatini, D.M., Kang, S.A. (2010) Structure of the human mTOR complex I and its implications for rapamycin inhibition. Molecular Cell. 38(5), 768–774.
Yoon, D., Pastore, Y.D., Divoky, V., Liu, E., Mlodnicka, A.E., Rainey, K., Ponka, P., Semenza, G.L., Schumacher, A., Prchal, J.T. (2006) Hypoxia-inducible factor-1 deficiency results in dysregulated erythropoiesis signaling and iron homeostasis in mouse development. The Journal of Biological Chemistry. 281(35), 25703–25711.
Yoshihara, K., Tajima, A., Komata, D., Yamamoto, T., Kodama, S., Fujiwara, H., Suzuki, M., Onishi, Y., Hatae, M., Sueyoshi, K., Fujiwara, H., Kudo, Y., Inoue, I., Tanaka, K. (2009) Gene expression profiling of advanced-stage serous ovarian cancers distinguishes novel subclasses and implicates ZEB2 in tumor progression and prognosis. Cancer Science. 100(8), 1421–1428.
Young, J., Povey, S. (1998) The genetic basis of tuberous sclerosis. Molecular Medicine Today. 4(7), 313–319.
Yue, Z., Jin, S., Yang, C., Levine, A.J., Heintz, N. (2003) Beclin 1, an autophagy gene essential for early embryonic development, is a haploinsufficient tumor suppressor. Proceedings of the National Academy of Sciences of the United States of America. 100(25), 15077–15082.
Zhang, G.Y., Ahmed, N., Riley, C., Oliva, K., Barker, G., Quinn, M.A., Rice, G.E. (2005) Enhanced expression of peroxisome proliferator-activated receptor gamma in epithelial ovarian carcinoma. British Journal of Cancer. 92(1), 113–119.
Zhang, X., Shu, L., Hosoi, H., Murti, K.G., Houghton, P.J. (2002) Predominant nuclear localization of mammalian target of rapamycin in normal and malignant cells in culture. The Journal of Biological Chemistry. 277(31), 28127–28134.
Zhang, X., Wang, X., Xu, T., Zhong, S., Shen, Z. (2015) Targeting of mTORC2 may have advantages over selective targeting of mTORC1 in the treatment of malignant pheochromocytoma. Tumour Biology. 36(7), 5273–5281.

232
Zhong, H., Chiles, K., Feldser, D., Laughner, E., Hanrahan, C., Georgescu, M.M., Simons, J.W., Semenza, G.L. (2000) Modulation of hypoxia-inducible factor 1alpha expression by the epidermal growth factor/phosphatidylinositol 3-kinase/PTEN/AKT/FRAP pathway in human prostate cancer cells: implications for tumor angiogenesis and therapeutics. Cancer Research. 60(6), 1541–1545.
Zhou, C., Chen, Z., Dong, J., Li, J., Shi, X., Sun, N., Luo, M., Zhou, F., Tan, F., He, J. (2015) Combination of serum miRNAs with Cyfra21-1 for the diagnosis of non-small cell lung cancer. Cancer Letters. 367(2), 138–146.
Zhou, H.Y., Wong, A.S.T. (2006) Activation of p70S6K induces expression of matrix metalloproteinase 9 associated with hepatocyte growth factor-mediated invasion in human ovarian cancer cells. Endocrinology. 147(5), 2557–2566.
Zinzalla, V., Stracka, D., Oppliger, W., Hall, M.N. (2011) Activation of mTORC2 by association with the ribosome. Cell. 144(5), 757–768.
Zipper, H., Brunner, H., Bernhagen, J., Vitzthum, F. (2004) Investigations on DNA intercalation and surface binding by SYBR Green I, its structure determination and methodological implications. Nucleic Acids Research. 32(12), e103.
Zito, G., Luppi, S., Giolo, E., Martinelli, M., Venturin, I., Di Lorenzo, G., Ricci, G. (2014) Medical treatments for endometriosis-associated pelvic pain. BioMed Research International. 2014, 191967.
Zitzmann, K., Rüden, J. von, Brand, S., Göke, B., Lichtl, J., Spöttl, G., Auernhammer, C.J. (2010) Compensatory activation of Akt in response to mTOR and Raf inhibitors - a rationale for dual-targeted therapy approaches in neuroendocrine tumor disease. Cancer Letters. 295(1), 100–109.
Zorn, K.K., Jazaeri, A.A., Awtrey, C.S., Gardner, G.J., Mok, S.C., Boyd, J., Birrer, M.J. (2003) Choice of Normal Ovarian Control Influences Determination of Differentially Expressed Genes in Ovarian Cancer Expression Profiling Studies. Clinical Cancer Research. 9(13), 4811–4818.
Zwart, J., Geisler, J.P., Geisler, H.E. (1998) Five-year survival in patients with endometrioid carcinoma of the ovary versus those with serous carcinoma. European Journal of Gynaecological Oncology. 19(3), 225–228.

233
Chapter 9
Appendix
9.1 qPCR
qPCR (quantitative polymerase chain reaction) is a method of amplifying and
quantifying genetic material in real-time using gene-specific primers, DNA
polymerase and fluorescent reporter dyes. The following section describes qPCR
methods and chemistry including experimental design and post-amplification
controls.
9.2 Experimental Design
Prior to a qPCR experiment, a number of preliminary procedures are required.
Sources of amplicon, the template DNA used in a qPCR experiment, are wide and
varied, whether it be animal or plant, from tissue, blood or cultured cells, the
nucleic acid must be prepared before it is suitable for use in a qPCR experiment.
The nucleic acid must first be extracted from its source. There are a number of
ways to do this including phenol-chloroform extraction by TRI reagent and silica
membrane extraction by spin column. The method chosen will depend on type and
amount of starting material.
One of the most common applications of qPCR is examining gene expression by the
amount of messenger ribonucleic acid (mRNA) transcript. mRNA is transcribed
from a specific gene and is responsible for providing a template by which to make
proteins. mRNA may be extracted under basal conditions or following different
treatment variables. As RNA is single stranded, it is not possible to use it directly in
a qPCR reaction. Due to this, mRNA is converted into cDNA using a process called
reverse transcription. Reverse transcription creates a DNA molecule copy of the
mRNA sequence which can be directly used in a qPCR reaction.

234
qPCR primers are short (~20 base pairs) sequences of nucleotides designed to be
complementary to the 5’ end of the gene of interest (GOI) on the sense (forward)
and antisense (reverse) strands of DNA. Primers provide a base from which the
polymerase enzyme can begin synthesising the complementary strand of DNA.
qPCR experiments may utilise probes or SYBR® Green as methods of reporting DNA
amplification by fluorescence. Non-probe based qPCR includes the addition of
SYBR® Green ([2-[N-(3-dimethylaminopropyl)-N-propylamino]-4-[2,3-dihydro-3-
methyl-(benzo-1,3-thiazol-2-yl)-methylidene]-1-phenyl-quinolinium]+) cyanine
reporter dye, an intercalating DNA dye which fluoresces when bound to double
stranded DNA (Zipper et al., 2004; Schneeberger et al., 1995). qPCR probes are
short (~20 base pairs) sequences of nucleic acids designed to be complementary to
an area between the primer and the end of the GOI and which are conjugated to a
fluorophore. The probe also usually contains a quencher which absorbs emitted
fluorescence when in close contact with the fluorophore. Probe based qPCR can
use a number of methods to dissociate the fluorophore from the quencher,
allowing it to fluoresce. Some probes, known as TaqMan probes, take advantage of
the nucleolytic activity of DNA polymerase which cleaves and disassembles
nucleotides as it is creating a new strand. The probe is cleaved in the process of the
reaction, separating the fluorophore from the quencher and allowing its emitted
fluorescence to be detected (Lee et al., 1993; Livak et al., 1995).
SYBR® Green will bind to all double stranded DNA, whether or not it is the amplified
GOI and so is less specific than using probe based chemistries which can only
fluoresce when bound to the sequence they were designed for. Probes, however,
are costly and a number of methods designed to ensure that SYBR® Green
fluorescence measured is as a result of GOI amplification will be described later. In
addition to SYBR® Green or probes, qPCR experiments involve three main reagents:
target genetic material to be amplified (amplicon), the enzyme, usually a derivative
of Taq polymerase, and dNTPs. Commercially available reagent master mixes such
as Power SYBR® Master Mix (Life Technologies) or KAPA SYBR® FAST Master Mix

235
(KAPA) usually contains ready optimised concentrations of polymerase enzyme,
Mg2+ to maintain efficient enzyme activity and dNTPs. In addition to this, master
mixes may also contain a passive ROX™ dye for fluorescence normalisation. Master
mixes designed for primer, as opposed to probe, based qPCR experiments will also
contain the reporter dye SYBR® Green. qPCR reactions are formulated to contain
the optimal concentrations of reagents and should be developed to account for the
specific conditions of the experiment; however a typical formulation for one 20μL
reaction may be as follows (Table 8.1):
Reagent Volume
2X qPCR master mix 10μL
Primer (forward and reverse) 2μL
Template 1μL
Pure H2O 7μL
Total 20μL
Table 9.1 - An example of a typical qPCR reaction formulation.
9.3 Amplification
In recent years, Taq polymerase derivatives have been modified to improve
stability. Enzymes are usually conjugated to an inhibitor, such as an antibody,
which blocks activity until heated. This type of enzyme developed the ‘hot start’
method of qPCR which requires an extended incubation of around 95°C before
thermal cycling begins. Enzyme inactivity at low temperatures allows for ambient
set up of qPCR experiments and greater specificity of results.
After a hot start incubation for a time and temperature specific to the enzyme
within the master mix, qPCR reactions are subjected to rounds of thermal cycling.
Each cycle is completed in three steps: dissociation of amplicon strands, primer
annealing and extension (Figure 8.1). Dissociation happens at around 95°C and
separates the double stranded amplicon into single strands. This makes way for

236
primer binding which is optimised for the specific primers or probes in use (usually
55-60°C). dNTPs then build onwards from the primers, adding complementary
nucleosides and creating two new double stranded copies of the gene, each copy
containing one strand of the original template (Figure 8.2).
The efficiency of a qPCR reaction is an important determinant when comparing
results. An efficiency of 100% implies that the amplicon is doubled with each
thermal cycle. If the efficiencies of two reactions are dissimilar, results cannot be
compared. Efficiency is assessed by creating a standard curve graph using a dilution
series of the nucleic acid input and plotting log concentration against Cq. The
gradient of the trend line can be used to calculate efficiency. The correlation
coefficient (R2) of the data points must also be taken into account with an R2 value
of ≥0.975 considered acceptable (Kennedy and Oswald, 2011). The commonly used
Δ (delta) and ΔΔCq methods of qPCR analysis make an assumption of 100%
efficiency within their calculations (i.e. generated amplicon is 2n when cycle
number is n). However, without optimisation, efficiency may fall below acceptable
levels (90-110%) and concentration of reagents or thermal protocol may need to be
modified to improve it.
Although qPCR reactions occur in three stages, thermal cycling itself may have two
or three steps. As enzyme activity is improving, it is becoming more common to
combine primer binding and extension into one temperature incubation step.
Typical two or three step thermal protocols are shown in Table 8.2 and 8.3
respectively.
Step Temperature Time Repeats
Hot Start 95°C 10 minutes 1 X
Denaturation 95°C 15 seconds 40 X
Annealing/Extension 60°C 60 seconds
Fluorescence Measurement
Table 9.2 - A typical two step qPCR thermal protocol where annealing and extension
have been combined into one step.

237
Step Temperature Time Repeats
Hot Start 95°C 10 minutes 1 X
Denaturation 95°C 15 seconds 40 X
Annealing 60°C 30 seconds
Extension 72°C 30 seconds
Fluorescence Measurement
Table 9.3 - A typical three step qPCR thermal protocol.
Figure 9.1 - The thermal profile of a typical three-step qPCR reaction. The 95°C hot
start step dissociates the enzyme from its inhibitor. 40 cycles of 95°C-60°C-72°C
follow the hot start. A fluorescence measurement is taken at the end of each cycle.

238
Figure 9.2 - The process of one DNA strand during one thermal cycle of a qPCR
reaction using primers and SYBR® Green. (1) Double stranded DNA with fluorescing
SYBR® Green bound to the minor groove. (2) Denaturation: The denaturation stage
(95°C) causes the two strands of DNA to dissociate, in turn causing the dissociation
and cessation of fluorescence of SYBR® Green. (3) Annealing: The annealing stage
(60°C) allows the primers to bind to their complementary sequences but does not
allow dissociated DNA strands to reassociate. (4) Extension: DNA polymerase
catalyses the addition of dNTPs to their complementary bases to create a new
strand of DNA. (5) Two double stranded DNA molecules have been created from
one starting template. SYBR® Green is able to bind and double the amount of
fluorescence is emitted than at the beginning of the cycle.
As each thermal cycle is completed, a fluorescence image is captured. Fluorescence
increases when the GOI is amplified as more probe conjugated fluorophores are
unquenched or as more double stranded DNA is created for SYBR® Green to bind
to. Fluorescence readings are plotted against cycle number on a graph to create a
sigmoidal amplification curve (Figure 8.3). A quantification cycle (Cq) value can be
obtained by creating a fluorescence threshold above background fluorescence and
determining at which cycle or cycle fraction the threshold was reached. An increase
in amplicon translates to a higher level of fluorescence and therefore a lower Cq
value.

239
Figure 9.3 - An example of three technical replicate amplification curves. Curves
show a sigmoidal shape with a lag, exponential and plateau stage. Cq value is
calculated from a defined threshold.
9.4 Post-Amplification Controls
As SYBR® Green is a non-specific double stranded DNA dye, a number of post-
amplification methods can be taken to ensure that the fluorescence measured is as
a result of amplification of the GOI. A dissociation curve, also referred to as a melt
curve, is a thermal protocol often programmed to begin immediately after
amplification. The qPCR reaction is heated and a fluorescence measurement taken
stepwise, either by degree or fraction of degree Celsius, usually from 60 to 95°C. As
the amplified product strands dissociate from one another, SYBR® Green dissociates
and ceases to fluoresce. The temperature at which the strands dissociate is
dependent on the amount of base pairs in the product; a longer amplicon will
dissociate at a higher temperature due to a higher number of hydrogen bonds
present between the bases in each strand. By plotting the rate of change in
fluorescence against temperature (Figure 8.4) and knowing the expected melt
temperature (Tm) of the amplicon, one is able to check if the product is at least the

240
expected size and if any nucleic acid contaminants of different Tms have been
amplified. The size of qPCR products can also be validated by agarose gel
electrophoresis. Separating PCR products in a gel with a DNA ladder reference is
able to show the size of all amplified nucleic acids and can serve as a method of
assessing specificity of fluorescence. Although neither of these methods can verify
with certainty that measured fluorescence is as a result of specific GOI
amplification, they go some way to demonstrating that it is likely.
Figure 9.4 - An example of three technical replicate dissociation curves. Replicates
mimic each other well and only one peak is observed, indicating that the Tm is 79°C
and there are no products of other sizes present.
Contamination can present a major problem in qPCR experiments. The inherent
nature of an amplification experiment means that even the smallest amount of
nucleic acid contamination can be represented in the data to a similar degree as the
amplicon. For this reason, non-template controls (NTCs), where template is
replaced with sterile water, should be included with every experiment to validate
that amplification is a result of the template and not reagent contamination.