Embed Size (px)
Citation preview

Integrated
Exploration Case
GOT
Author Index
Section Contents
Explor97 Master Page
Explor97 Contents
HistoriesO Next PaperPrevious PaperPaper 132
Exploring for Nickel in the 90s, or ‘til depth us do part’
Watts, A.[1]
1. Falconbridge Limited, Toronto, Ontario, Canada
ABSTRACT
Since the last great nickel exploration boom of the 1960s, which took place in the wake of the Thompson discovery, advancesin geophysical instrumentation, especially in large-loop time-domain electromagnetic (TEM) systems, and PC-aided inter-pretation, have revolutionized mineral exploration geophysics. The Sudbury Igneous Complex (SIC), host to the largest con-centration of nickel sulphide ore in the world, continues to provide an ideal testing ground for geophysical instrumentationboth surface and borehole, and refinement of the rigourous processing of time-domain EM required to ensure that high con-ductance ore bodies are not missed. In addition to the traditional exploration tools for nickel of EM and magnetics, non-traditional techniques such as audio-magnetotellurics, and 3-D seismics for massive sulphide detection, and ground-pen-etrating radar for massive-sulphide and nickel laterite delineation are meeting with increased acceptance.
INTRODUCTION
With the discovery of the Voisey’s Bay Ni/Cu deposit in 1994, the searchfor giant sulphide nickel deposits has been revitalised worldwide. Thisdiscovery, coupled with the belated recognition of the true dimensionsof the Norilsk Ni deposit in Russia, has helped spur a nickel explorationboom last seen in the post-Thompson discovery era of the 1960s.
Geophysics has played a key role in the discovery of the Ovoid depositat Voisey’s Bay (Crebs 1996), and gravity and magnetics helped isolatethe Lower Talnakh intrusion which is host to Talnakh “ore-junction” atNorilsk (V. Lulko, pers. comm.). Geophysics continues to be a crucialcomponent of the ongoing follow-up exploration programs in thesemining camps. While the geologic settings of the four premier Ni sul-phide mining camps worldwide, i.e., the Sudbury Basin, Thompson,Norilsk and now Voisey’s Bay may differ, the one constant in all four loca-tions is that the dominant sulphide ore-hosting mineral is pyrrhotite.This sulphide mineral has long been recognised as displaying the highestconductivity of the common sulphide minerals. Conductivity values ofSudbury ore are typically in the range of 104–106 siemens/metre. Whatmay have been neglected until fairly recently, certainly in the case ofSudbury, is the detectability of significant thicknesses of massive pyrrho-tite using traditional impulse-type time-domain borehole EM methods.Included in this paper is a cautionary case-history detailing problemsencountered initially using a typical impulse TEM system in Sudburyexploration, and what measures have subsequently been implemented toensure an economic ore deposit is not missed.
Other case-histories presented exemplify the depth penetrationcapabilities of modern-day fixed-loop TEM methods (Sudbury), theutility of 3-D magnetic inversion and 3-D computer visualization tech-niques in complex geologic terrains (Raglan Project), and finally the use
of the ground penetrating radar (GPR) method in mapping a typical Nilaterite profile at the Falcondo Mine (Loma Caribe Deposit) in theDominican Republic.
THE NORTH RANGE DEPTH PROJECT, SUDBURY
Discovery of the Craig Depth Ore Zone—Crone and UTEM boreholeEM system response in the vicinity of a “perfect” conductor
The objective of the on-going North Range Depth exploration pro-gram (Figures 1 and 2) is to evaluate the downdip potential betweenFalconbridge’s Craig and Onaping mines. During the period 1991–1993a total of ten deep holes were drilled to depths of between 2.0 and 2.5 kmin an east-west tier approximately 600 m downdip of these two mines.
During the period from 1984 to 1992 Falconbridge used the CronePulse EM (PEM) borehole system exclusively in the Sudbury Basin, mostnotably in the exploration program leading up to the discovery of Lind-sley deposit (Crone 1991). In September, 1992, a series of comparativetests were initiated between the Crone system and the UTEM system,manufactured by Lamontagne Geophysics of Kingston, Ontario.
These tests were carried out downdip of Inco’s Victor Depth deposit(Figure 1), ground that Falconbridge owns. The results of these tests willnot be discussed in this paper. Suffice it to say that sufficient discrepancyexisted between the results from the two systems, as presented by con-tractors, that it was decided to continue these comparative tests on theFalconbridge’s North Range Depth exploration program in the SudburyIgneous Complex.
The advantage that the Crone system had over most other boreholeEM systems at the time was a reliable three-component measurement
In “Proceedings of Exploration 97: Fourth Decennial International Conference on Mineral Exploration” edited by A.G. Gubins, 1997, p. 1003–1014

1004 Integrated Exploration Case Histories
capability, a capability which until recently the UTEM system, and mostother commercially available EM systems, did not have. The addeddirectional information provided by a three-component system is cru-cial when drilling holes that cost between $200,000–300,000. It was feltby Falconbridge’s exploration staff that perhaps only a combination ofthe two techniques would provide the total package of informationrequired to follow-up on prospective targets.
The first case history presented will compare the results from the twoborehole EM (BHEM) systems for a single hole, NRD-8 (Figure 2), acrucial hole in the North Range Depth project and one which played akey role in the subsequent discovery of the Craig Depth ore zone. Beforecomparing the results from NRD-8 for the two systems, a brief descrip-tion of some of the basic differences and similarities between the twosystems is required.
Crone PEM
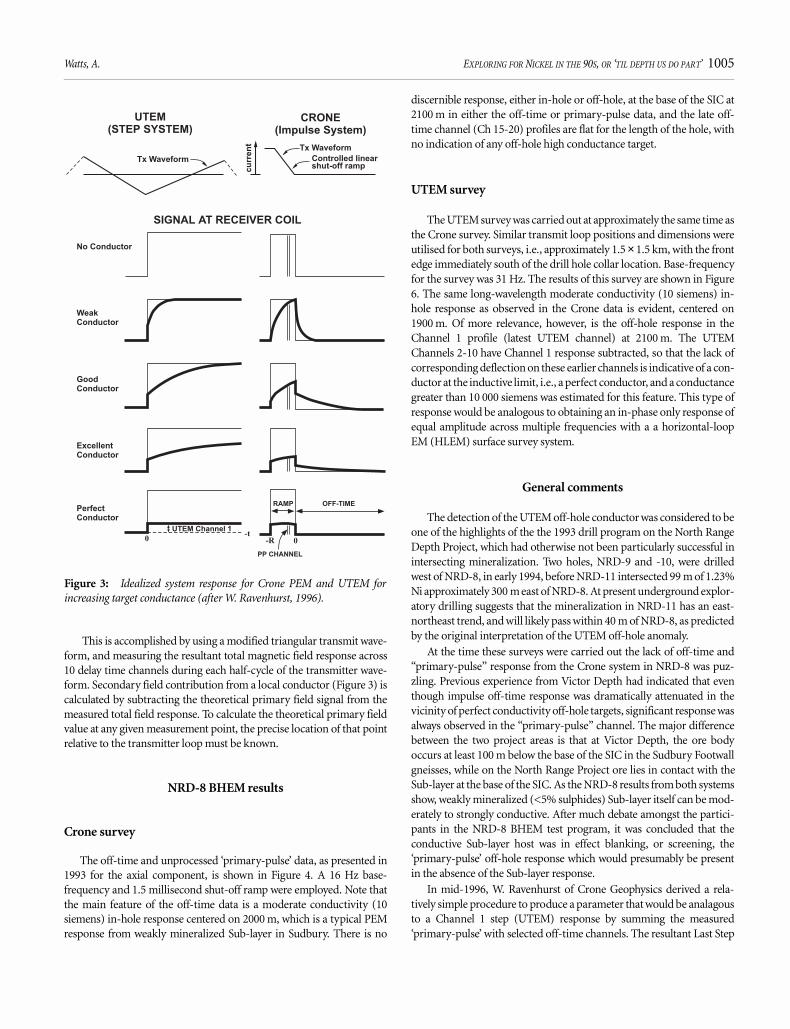
The Crone PEM system belongs to a family of time-domain EM sys-tems which use an impulse-type transmit waveform and measure the rateof change in decay of the induced secondary EM field during the trans-mitter off-time (Figure 3). The major advantage of measuring the sec-ondary field in the absence of the primary is that the exact geometricalrelationship between transmitter and receiver is not required. Anotheradvantage is that a pulsed transmitter waveform is amenable to large cur-rent output—transmitting 20 A into a 1 × 1 km loop is routine in presentday PEM surveys. A well-known drawback to any present-day impulse-based TEM system which measures the time derivative of the secondaryfield decay, rather than the secondary field decay itself, is that the initialamplitude of the off-time response falls off at a rate of 1/τ (Grant andWest, 1965). Since τ (time constant) values of more than 100 millisec-onds are common in Sudbury, this fall-off can be quite significant.
The Crone PEM system also has an accurately controlled linear shut-off ramp, which allows for a stable measurement of the so-called‘primary-pulse’. The shut-off ramp can be varied from 0.5 millisecondsto 1.5 millseconds. This measurement is normally made between 200and 100 microseconds before the initiation of the off-time measurement(Figure 3), and can be thought of as similar to a UTEM measurement inthat it is sampling the sum of the primary EMF generated in the receivercoil by the rapid shut-off of the transmitter current and any secondaryfield build-up caused by local conductors. Until recently this parameterwas frequently overlooked as a diagnostic tool and generally presented ina ‘raw’ format only, if at all. It is hoped that this case-history will serve toemphasise that proper processing of the ‘primary-pulse’ parameter is anessential component to any comprehensive interpretation of Crone PEMdata, and can compensate for the significant attenuation in off-timemeasurements in proximity to very high conductivity (>>104s) targets.
The UTEM system
The UTEM system is unique amongst time-domain EM systems inthat it is designed to measure the step rather than impulse response ofthe ground, which entails measurement of the secondary EM field in thepresence of the primary field (West et al., 1984). The step response canbe vizualised as the sum of a primary, inducing EM field of constantamplitude, and a secondary field produced by the build-up of eddy cur-rents in a local conductor.
Figure 1: Location map of North Range Depth and Joe Lake projects,Sudbury Igneous Complex. (modified after Naldrett, Hweins et al., 1984)
Figure 2: Location of NRD-8 and NRD-11 relative to Onaping andCraig Mines, SIC.
Watts, A. EXPLORING FOR NICKEL IN THE 90S, OR ‘TIL DEPTH US DO PART’ 1005
This is accomplished by using a modified triangular transmit wave-form, and measuring the resultant total magnetic field response across10 delay time channels during each half-cycle of the transmitter wave-form. Secondary field contribution from a local conductor (Figure 3) iscalculated by subtracting the theoretical primary field signal from themeasured total field response. To calculate the theoretical primary fieldvalue at any given measurement point, the precise location of that pointrelative to the transmitter loop must be known.
NRD-8 BHEM results
Crone survey
The off-time and unprocessed ‘primary-pulse’ data, as presented in1993 for the axial component, is shown in Figure 4. A 16 Hz base-frequency and 1.5 millisecond shut-off ramp were employed. Note thatthe main feature of the off-time data is a moderate conductivity (10siemens) in-hole response centered on 2000 m, which is a typical PEMresponse from weakly mineralized Sub-layer in Sudbury. There is no
discernible response, either in-hole or off-hole, at the base of the SIC at2100 m in either the off-time or primary-pulse data, and the late off-time channel (Ch 15-20) profiles are flat for the length of the hole, withno indication of any off-hole high conductance target.
UTEM survey
The UTEM survey was carried out at approximately the same time asthe Crone survey. Similar transmit loop positions and dimensions wereutilised for both surveys, i.e., approximately 1.5 × 1.5 km, with the frontedge immediately south of the drill hole collar location. Base-frequencyfor the survey was 31 Hz. The results of this survey are shown in Figure6. The same long-wavelength moderate conductivity (10 siemens) in-hole response as observed in the Crone data is evident, centered on1900 m. Of more relevance, however, is the off-hole response in theChannel 1 profile (latest UTEM channel) at 2100 m. The UTEMChannels 2-10 have Channel 1 response subtracted, so that the lack ofcorresponding deflection on these earlier channels is indicative of a con-ductor at the inductive limit, i.e., a perfect conductor, and a conductancegreater than 10 000 siemens was estimated for this feature. This type ofresponse would be analogous to obtaining an in-phase only response ofequal amplitude across multiple frequencies with a a horizontal-loopEM (HLEM) surface survey system.
General comments
The detection of the UTEM off-hole conductor was considered to beone of the highlights of the the 1993 drill program on the North RangeDepth Project, which had otherwise not been particularly successful inintersecting mineralization. Two holes, NRD-9 and -10, were drilledwest of NRD-8, in early 1994, before NRD-11 intersected 99 m of 1.23%Ni approximately 300 m east of NRD-8. At present underground explor-atory drilling suggests that the mineralization in NRD-11 has an east-northeast trend, and will likely pass within 40 m of NRD-8, as predictedby the original interpretation of the UTEM off-hole anomaly.
At the time these surveys were carried out the lack of off-time and“primary-pulse” response from the Crone system in NRD-8 was puz-zling. Previous experience from Victor Depth had indicated that eventhough impulse off-time response was dramatically attenuated in thevicinity of perfect conductivity off-hole targets, significant response wasalways observed in the “primary-pulse” channel. The major differencebetween the two project areas is that at Victor Depth, the ore bodyoccurs at least 100 m below the base of the SIC in the Sudbury Footwallgneisses, while on the North Range Project ore lies in contact with theSub-layer at the base of the SIC. As the NRD-8 results from both systemsshow, weakly mineralized (<5% sulphides) Sub-layer itself can be mod-erately to strongly conductive. After much debate amongst the partici-pants in the NRD-8 BHEM test program, it was concluded that theconductive Sub-layer host was in effect blanking, or screening, the‘primary-pulse’ off-hole response which would presumably be presentin the absence of the Sub-layer response.
In mid-1996, W. Ravenhurst of Crone Geophysics derived a rela-tively simple procedure to produce a parameter that would be analagousto a Channel 1 step (UTEM) response by summing the measured‘primary-pulse’ with selected off-time channels. The resultant Last Step
Figure 3: Idealized system response for Crone PEM and UTEM forincreasing target conductance (after W. Ravenhurst, 1996).

1006 Integrated Exploration Case Histories
(cleaned primary-pulse) parameter is then subtracted from the theoret-ical primary pulse value and expressed as a percentage (pers. comm):
LS(Last Step)= PP + Ch11 + Ch14 + Ch16 + Ch17 + Ch18 +2(Ch19) + 2(Ch20) [1]
The result of this procedure for NRD-8 is presented in Figure 5. Notethe similarity of the LS Crone parameter to the UTEM Ch 1 off-holeresponse at 2100 m, and the corresponding lack of response from theResidual ‘primary-pulse’ parameter at the same depth. The usefulness ofthe ‘Last Step’ derivation on other Falconbridge projects in the SIC since
the NRD-8 test work has proven itself several times over. This derivationof course implies the same precise knowledge of transmitter to receiverprobe geometry that is necessary for the processing of UTEM data.
In conclusion it can be stated that, in the SIC, the traditionalapproach of presenting impulse-type time-domain EM data in off-timeand raw ‘primary-pulse’ profile format only, has proven to be ineffectivein the detection of nearby highly conductive massive-sulphide ore. Aftermuch debate, controversy, and collaboration between Falconbridge geo-physical staff and the various contractors involved, a processingsequence is now in place to ensure these conductors are not missed. Itcan also be stated that detection of an inductive-limit off-hole UTEMresponse in NRD-8 provided substantial impetus for continued drillingin the NRD-8 area, which eventually led to the discovery of the CraigDepth ore body.
Figure 4: Crone PEM survey, NRD-8, axial component, September, 1993.
Figure 5: Re-processed Crone PEM survey, last step and residual ‘pri-mary-pulse’ profiles, NRD-8, October,1996.

Watts, A. EXPLORING FOR NICKEL IN THE 90S, OR ‘TIL DEPTH US DO PART’ 1007
JOE LAKE ZONE (WISNER TOWNSHIP—SUDBURY)
An example of 400 m+ depth penetration for a discrete massive-sulphide target using fixed-loop time-domain EM
Falconbridge’s Joe Lake Property (Figure 1) is located on the NorthRange of the Sudbury Igneous Complex (SIC), 30 km east of theOnaping/Levack cluster of Inco and Falconbridge Ni mines. Falcon-bridge obtained mineral rights to approximately 11 km of SIC contactbetween the period 1940–1973. Until 1993 very little exploration hadbeen carried out on the property, ostensibly due to lack of easy access.Inco had defined a small deposit, ie., 205 000 tonnes at 2.22% Ni and Cu,at surface immediately northwest of Falconbridge’s property. Otherfavourable indicators on the property are the shallow dip, < 40° S, appar-ent thickening of the prospective Sub-layer unit, and evidence for thepresence of an embayment structure in the SIC footwall.
In March 1993, Falconbridge contracted out a program of 31 km ofdeep-penetrating surface UTEM coverage to Lamontagne Geophysics.This survey covers 3 km of strike length and 1.5 km of dip length offavorable SIC footwall contact stratigraphy. The in-loop configuration isnot the standard mode of operation for the UTEM system because geo-metric inaccuracies are more difficult to correct for, but was specified for
this survey because of the excellent primary field coupling this configu-ration would provide to a shallow-dipping Sub-layer–hosted target. Two1.9 km × 2.5 km loops were surveyed, with measurements of the verticalcomponent of the magnetic field (H
z) taken at a nominal 50 m spacing.
Ten channels of data were acquired using a base repetition rate of 31Hz.The results from this survey are summarized in Figures 7 and 8. The
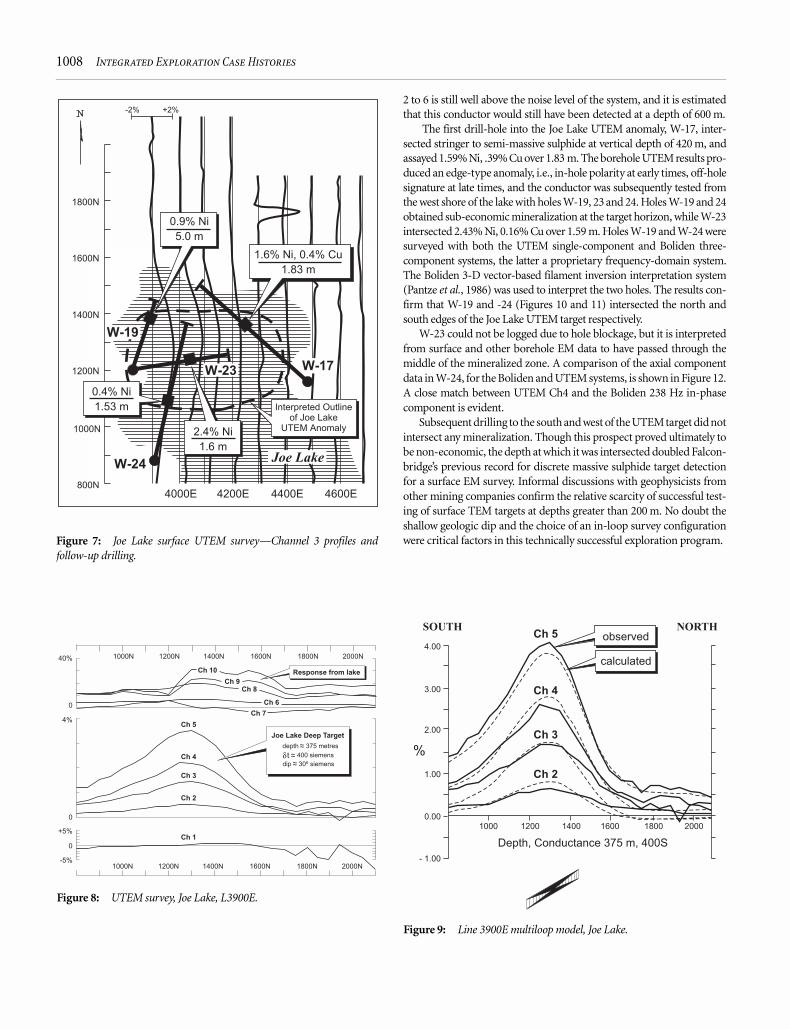
former is a plan profile map of UTEM Channel 3. Note the broad posi-tive peak-type response centered on approximately 1300N. The shape ofanomaly is typical of a shallow-dipping conductor for the Z-component.A vertical conductor would produce a crossover-type profile. Thoughthis conductor appears open to the west, a barren hole drilled by Inco atapproximately 3750E/1400N provides the apparent western limit to theconductor. Line 3900E is provided as a typical of the full ten-channelresponse profile over the Joe Lake UTEM anomaly. This set of profilesclearly shows the response from the lake between 1300N to 1600N pre-dominates at early times, after which a more conductive deeply buriedtarget starts to emerge between 1100N->1500N. Computer modeling(Figure 9) using the Multiloop program indicated a conductor varyingin depth to top of 375 m to 425 m in the conductance range of 50 s–400 s, and a consistent dip of 30°S. It should be noted that, even at a tar-get depth of 400 m, the UTEM anomaly of between 2–4% on Channels
Figure 6: UTEM survey, NRD-8, axial component, September, 1993.
1008 Integrated Exploration Case Histories
2 to 6 is still well above the noise level of the system, and it is estimatedthat this conductor would still have been detected at a depth of 600 m.
The first drill-hole into the Joe Lake UTEM anomaly, W-17, inter-sected stringer to semi-massive sulphide at vertical depth of 420 m, andassayed 1.59% Ni, .39% Cu over 1.83 m. The borehole UTEM results pro-duced an edge-type anomaly, i.e., in-hole polarity at early times, off-holesignature at late times, and the conductor was subsequently tested fromthe west shore of the lake with holes W-19, 23 and 24. Holes W-19 and 24obtained sub-economic mineralization at the target horizon, while W-23intersected 2.43% Ni, 0.16% Cu over 1.59 m. Holes W-19 and W-24 weresurveyed with both the UTEM single-component and Boliden three-component systems, the latter a proprietary frequency-domain system.The Boliden 3-D vector-based filament inversion interpretation system(Pantze et al., 1986) was used to interpret the two holes. The results con-firm that W-19 and -24 (Figures 10 and 11) intersected the north andsouth edges of the Joe Lake UTEM target respectively.
W-23 could not be logged due to hole blockage, but it is interpretedfrom surface and other borehole EM data to have passed through themiddle of the mineralized zone. A comparison of the axial componentdata in W-24, for the Boliden and UTEM systems, is shown in Figure 12.A close match between UTEM Ch4 and the Boliden 238 Hz in-phasecomponent is evident.
Subsequent drilling to the south and west of the UTEM target did notintersect any mineralization. Though this prospect proved ultimately tobe non-economic, the depth at which it was intersected doubled Falcon-bridge’s previous record for discrete massive sulphide target detectionfor a surface EM survey. Informal discussions with geophysicists fromother mining companies confirm the relative scarcity of successful test-ing of surface TEM targets at depths greater than 200 m. No doubt theshallow geologic dip and the choice of an in-loop survey configurationwere critical factors in this technically successful exploration program.
Figure 8: UTEM survey, Joe Lake, L3900E.
Figure 9: Line 3900E multiloop model, Joe Lake.
Figure 7: Joe Lake surface UTEM survey—Channel 3 profiles andfollow-up drilling.

Watts, A. EXPLORING FOR NICKEL IN THE 90S, OR ‘TIL DEPTH US DO PART’ 1009
Figure 11: Joe Lake, Boliden three-component EM, 238 Hz, cross-sec-tion looking east. Secondary field vectors and interpreted conductor.
Figure 12: W-24 Boliden/UTEM comparison, Joe Lake.
Figure 10: Joe Lake, Boliden three-component EM, 238 Hz, plan view.Secondary field vectors and interpreted conductor.

1010 Integrated Exploration Case Histories
KATINNIQ-EAST DEEP PROJECT
Example of the application of 3-D magnetic modeling and visualization to the mapping of at depth of
prospective ore-bearing stratigraphy.
The Katinniq deposit (Figure 13) consists of 8 mt of 3%Ni, .8%Cuand will be Falconbridge’s first production site when the Raglan Projectcomes on stream in late-1997. The deposit is located in the Cape SmithBelt, Ungava Peninsula, Québec. The Raglan nickel ore bodies are dot-ted along the entire length of a 50 km belt of ultramafic rocks, thatbelong to the Chukotat Group and the Katinniq deposit is the largest ofthose discovered to date.
This belt of ultramafic rocks consists of a complex assemblage ofperidotite, gabbro, pyroxenite, with a footwall of Povungnituk sedi-ments, and a hanging wall of basaltic lavas. Ore bodies discovered to dateare hosted by what have appeared to be discrete 2–3 km-long bodies ofstrongly magnetic peridotite, which frequently are associated with anon-magnetic and barren basal gabbro unit. Magnetic susceptibilities ofthe peridotite unit fall in the range of 30-70 × 10-3 SI units. The peridot-ite bodies were originally thought to be intrusive in nature, and wereidentified as such by individual names such as the Katinniq Sill, 5-8 Sill.Recent work by Lesher et al. (1995) suggest that they are in fact extrusivein nature, the product of channelized lava-flow systems.
In 1988, Falconbridge flew a detailed, radio-navigation controlled,helicopter EM and magnetic survey of the entire Raglan belt, at a line-spacing of 100 m. The aeromagnetic results of this survey are depicted inFigure 13, and show the excellent correlation between the numerous
known “sill bodies” and high-intensity magnetic features. Note, however,the unusual “fan-like” contour pattern emanating from either end of theknown, outcropping peridotite bodies, especially in the eastern half ofthe belt. At the time the survey was flown, the preferred explanation forthis peculiar pattern was that it was the result of a shallow northwardplunge to an outcropping peridotite sill whose extremity would invari-ably exhibit a pronounced change in strike direction. This explanationmight have been valid for that area immediately north of a particular sillextremity, but the apparent continuity clearly outlined by the magneticcontours between outcropping sills required further explanation. In allcases, these less intense and broader intervening magnetic trends lie sev-eral hundreds of metres north of the mapped Raglan ultramafic belt andostensibly fall within belt of well-mapped basaltic lavas which are persis-tently non-magnetic in hand specimen.
In 1989, a proposal that the aeromagnetic data was in fact suggestingthat the various Raglan ore-bearing “sill” bodies that lie between theDonaldson and Katinniq deposits—a distance of 20 km—could in factbe linked at depth and were likely to be continuous over this distance,was met with some skepticism. One of the major stumbling blocks tomaking a convincing argument at the time for this hypothesis was theinability of the geophysicist to model and represent accurately the mag-netic data in three dimensions.
In 1994, Falconbridge, as part of a consortium supporting develop-ment of 3-D geophysical modeling code at the University of BritishColumbia, obtained MAG3D, a program that allows the geophysicist totake the total field values from an airborne or ground magnetic surveyand calculate a 3-D earth model which would produce the observed
Figure 13: Total field aeromagnetics, general geology, and area modelled with MAG3D, Katinniq Area, Raglan Project.

Watts, A. EXPLORING FOR NICKEL IN THE 90S, OR ‘TIL DEPTH US DO PART’ 1011
data. The area between the Katinniq and 5-8 “sills” was used as theguinea pig for this new program whose output is a 3-D mesh of rectan-
gular or cubic blocks of susceptibilty values which would best fit theobserved total field data set.
The results from this 3-D magnetic modelling are shown in Figure 14.Because MAG3D solves for the entire data volume, in representing theresults in 3-D a lower limit to the susceptibilities portrayed is usually set.This figure represents all susceptibilities 40 × 10-3 SI and above. It quiteclearly shows that the Katinniq and 5-8 “sills” are linked at depth. Projectgeologists were significantly more receptive to drill-testing the areabetween Katinniq and 5-8 after being presented with the 3-D model.
As a result, DH 718381 was collared in June, 1995, and ultimatelydrilled to a depth of 1050 m. This drillhole intersected a highly magneticperidotite unit from 650 m to 980 m. This depth and thickness (330 m)agrees within 10% of that predicted by MAG3D and also more tradi-tional 2-D magnetic modeling of profiles in the area. Of added impor-tance was the intersection of a 10 m thick intersection averaging 0.85%nickel in the middle of the peridotite body. The success of this deep“wild-cat” hole suggests that many of the Raglan Ni-bearing peridotitebodies east of the Katinniq Deposit, instead of being isolated pods, couldin fact be connected at depth. A program to systematically test for theseburied extensions has been initiated.
This case-history illustrates how powerful modelling and visualiza-tion tools, available on the desktop computer only since the early 1990s,can provide the geologist and/or exploration manager with an easilyunderstood representation of a geophysicist’s oftimes esoteric ramblings.
LOMA CARIBE NICKEL LATERITE DEPOSIT, DOMINICAN REPUBLIC
An example of the usage of ground-penetrating radar to measure thickness of the limonite layer in a laterite profile
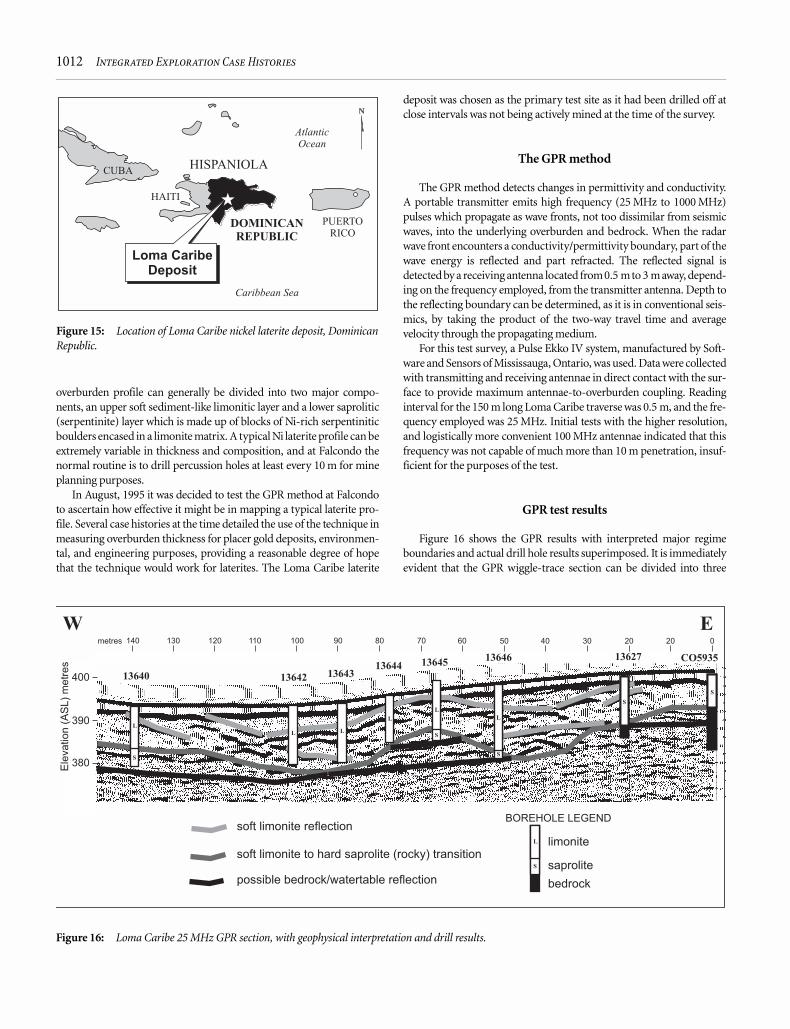
The Falcondo nickel laterite mine is located in the interior of theDominican Republic, 80 km north of Santo Domingo (Figure 15). It hasbeen owned and operated by Falconbridge since the late 1960s. It pro-duces approximately 30 million tonnes of Ni ore per year, at an averagegrade of 1.6%.
Nickel laterite deposits are produced by tropical weathering of ultra-mafic source rock. The source rock is usually dunite or peridotitecontaining 0.25->0.4% Ni that has substituted for magnesium in oliv-ine. Weathering causes the nickel to be leached out of the bedrock,resulting in a nickel-rich (as much as 2-3% Ni) overburden profile. This
Figure 14: Rendered 3-D isometric view of MAG3D inversion results, BH 718381 and superimposed aeromagnetics, Katinniq/ 5-8 Area.
1012 Integrated Exploration Case Histories
overburden profile can generally be divided into two major compo-nents, an upper soft sediment-like limonitic layer and a lower saprolitic(serpentinite) layer which is made up of blocks of Ni-rich serpentiniticboulders encased in a limonite matrix. A typical Ni laterite profile can beextremely variable in thickness and composition, and at Falcondo thenormal routine is to drill percussion holes at least every 10 m for mineplanning purposes.
In August, 1995 it was decided to test the GPR method at Falcondoto ascertain how effective it might be in mapping a typical laterite pro-file. Several case histories at the time detailed the use of the technique inmeasuring overburden thickness for placer gold deposits, environmen-tal, and engineering purposes, providing a reasonable degree of hopethat the technique would work for laterites. The Loma Caribe laterite
deposit was chosen as the primary test site as it had been drilled off atclose intervals was not being actively mined at the time of the survey.
The GPR method
The GPR method detects changes in permittivity and conductivity.A portable transmitter emits high frequency (25 MHz to 1000 MHz)pulses which propagate as wave fronts, not too dissimilar from seismicwaves, into the underlying overburden and bedrock. When the radarwave front encounters a conductivity/permittivity boundary, part of thewave energy is reflected and part refracted. The reflected signal isdetected by a receiving antenna located from 0.5 m to 3 m away, depend-ing on the frequency employed, from the transmitter antenna. Depth tothe reflecting boundary can be determined, as it is in conventional seis-mics, by taking the product of the two-way travel time and averagevelocity through the propagating medium.
For this test survey, a Pulse Ekko IV system, manufactured by Soft-ware and Sensors of Mississauga, Ontario, was used. Data were collectedwith transmitting and receiving antennae in direct contact with the sur-face to provide maximum antennae-to-overburden coupling. Readinginterval for the 150 m long Loma Caribe traverse was 0.5 m, and the fre-quency employed was 25 MHz. Initial tests with the higher resolution,and logistically more convenient 100 MHz antennae indicated that thisfrequency was not capable of much more than 10 m penetration, insuf-ficient for the purposes of the test.
GPR test results
Figure 16 shows the GPR results with interpreted major regimeboundaries and actual drill hole results superimposed. It is immediatelyevident that the GPR wiggle-trace section can be divided into three
Figure 16: Loma Caribe 25 MHz GPR section, with geophysical interpretation and drill results.
Figure 15: Location of Loma Caribe nickel laterite deposit, DominicanRepublic.

Watts, A. EXPLORING FOR NICKEL IN THE 90S, OR ‘TIL DEPTH US DO PART’ 1013
major regimes vertically. The uppermost regime, a set of two highenergy continous reflectors, correlates to the direct arrival wave, belowwhich is a regime of low velocity, relatively coherent reflections, which inturn is underlain by a much “noisier” discontinuous, short wavelengthregime. The boundary between the latter two regimes has been inter-preted as representing the limonite/saprolite interface and is demarcatedwith a red line. Drill holes, with the actual depth to the base of the limo-nite indicated, i.e., the L/S boundary, in general show an excellent cor-relation with the interpreted depths. An exception is noted at the rightside of the section, where significant departures in two drill holes areevident. These two drill holes were in fact located 5-10 m off the surveytraverse and it is suggested that they are not in fact representative of thelaterite profile immediately below the traverse. It was hoped that theGPR method might also be able to map saprolite/unweathered bedrockboundary. A semicontinuous reflector within the lowermost, “noisy”,regime has been interpreted as representing this interface, but unfortu-nately no holes are available to corroborate this interpretation, but it isfelt that this correlation is a much more suspect than the well-definedlimonite/saprolite transition.
From the GPR test at Loma Caribe it was concluded that the methodis capable of providing accurate and timely information on the thicknessof the limonite portion of a typical laterite profile and the possibility ofusing the technique in the exploration of new laterite deposits in theIvory Coast and New Caledonia is being considered.
CONCLUSIONS
The four case histories presented above showcase but a small cross-sec-tion of the plethora of new and exciting geophysical tools available to the
mineral exploration geophysicist in the 1990s. The BHEM case historypresented highlights the need to be continuously questioning traditionalways of processing and interpreting geophysical data. The search fornickel deposits remains a challenging one, especially when consideringthat any new ore found in the existing major nickel mining camps of theworld will likely be at depths greater than a kilometre. It is predicted thatrecently refined deep-search techniques such as three-componentBHEM, audio-magnetellurics, and 3-D seismics will become muchmore commonplace in future nickel exploration programs.
REFERENCES
Crebs, T.J., 1996, Discovery geophysics of the Voisey’s Bay Ni-Cu-Co deposit,Labrador, Canada; Paper in Society of Exploration Geophysicists AnnualMeeting, Denver, Colorado.
Crone, D., and Watts, A., 1991, Case History of Borehole Pulse EM suveys at theFalconbridge Lindsley Discovery in Sudbury; Paper presented at CanadianInstitute of Mining, Metallurgy and Petroleum, Ottawa.
Grant, F.S., and West, G.F., 1965, Interpretation Theory in Applied Geophysics;McGraw-Hill, New York, Chapters 15-18.
Lesher, C.M., Keays, R.R., Gillies, S.L., Thacker, J.L., Thibert, F., Tremblay, C.,and Dufresne, M., 1996, Physical volcanology and petrogenesis of komatiiticperidotite and komatiitic gabbro lava channels and sheet flows in the lowerChukotat group, Cape Smith belt, New Québec; in Int’l. Conf. on Tectonicsand Metallgeny of Early/Mid Precambrian Orogenic Belts (Precambrian ’95).
Pantze, R., Malmquist L., and Kristensson G., 1986, Directional EM measure-ments in boreholes; in Borehole Geophysics for Mining and GeotechnicalApplications, Geological Survey of Canada Publication; p.79-88.
West, G.F., Macnae, J.C., and Lamontagne, Y., 1984, A time-domain EM systemmeasuring the step response of the ground; Geophysics, 49, p.1010-1026.

1014 Integrated Exploration Case Histories