Embed Size (px)
Citation preview
Exploring Changing Travel TrendsSteven E. Polzin, Ph.D.Xuehao Chu, Ph.D.Center for Urban Transportation ResearchUniversity of South Florida
Nancy McGuckinTravel Behavior Associates

Fundamentals on Interpreting NHTS Data
“If you torture the data long enough, nature will confess.”
Ronald Coase – 1991 Nobel Prize in Economics
“If you torture the data long enough you can make it confess to anything.”
Alan Pisarski – No Nobel Prizes
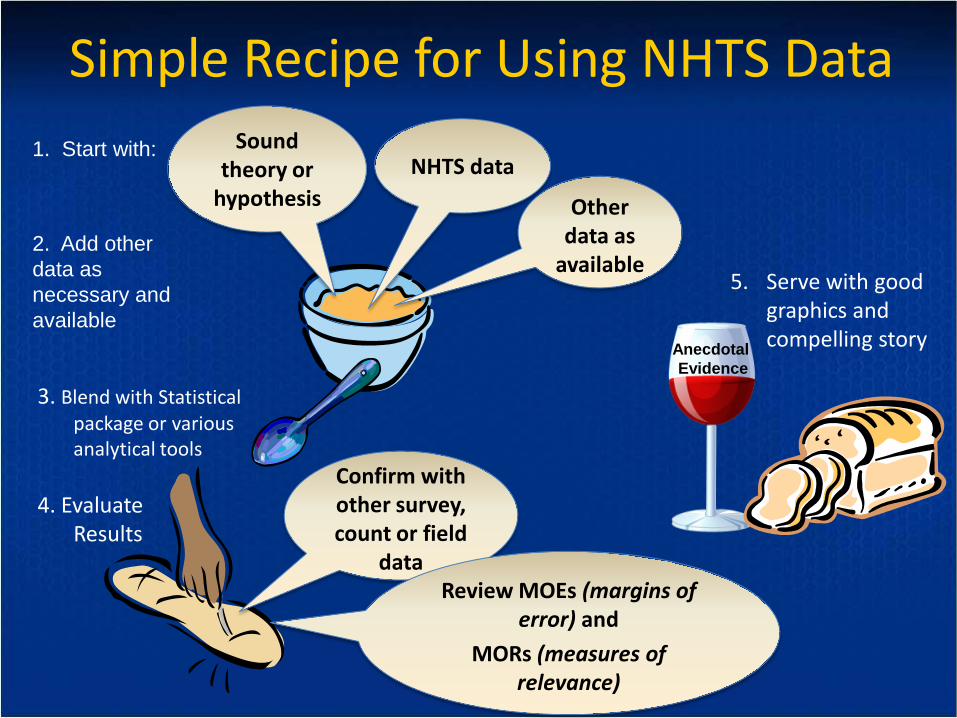
Simple Recipe for Using NHTS Data
3. Blend with Statistical package or various analytical tools
Sound theory or
hypothesis
Confirm with other survey, count or field
data
Other data as
available
NHTS data1. Start with:
2. Add other data as necessary and available
4. Evaluate Results
5. Serve with good graphics and compelling story
Review MOEs (margins of error) and
MORs (measures of relevance)
Anecdotal Evidence
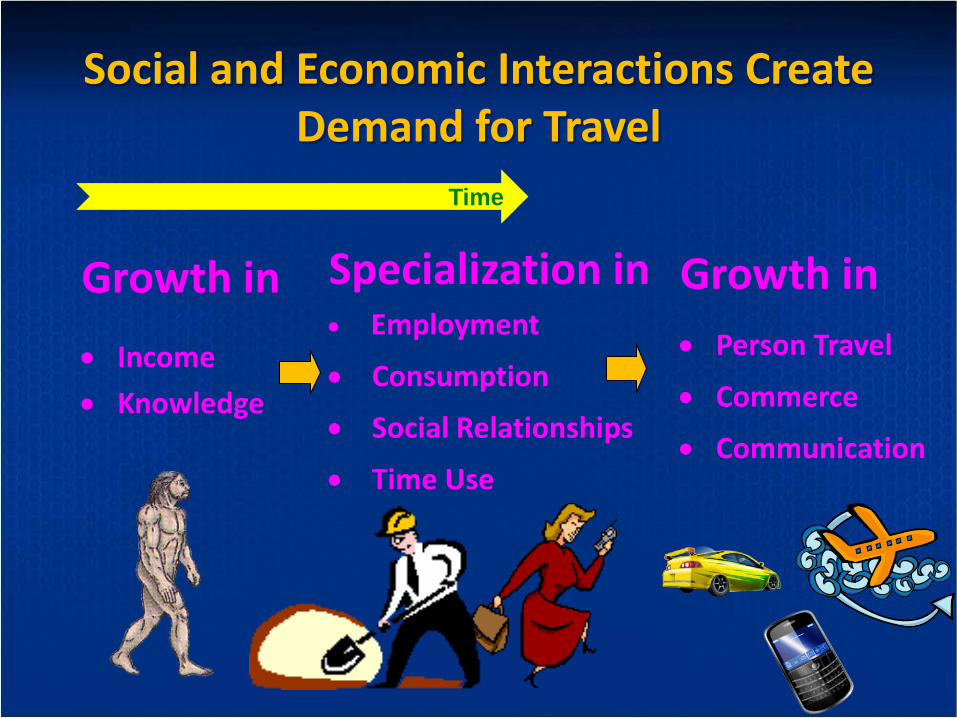
Growth in • Income• Knowledge
Social and Economic Interactions Create Demand for Travel
Specialization in• Employment
• Consumption
• Social Relationships
• Time Use
Growth in • Person Travel
• Commerce
• Communication
Time
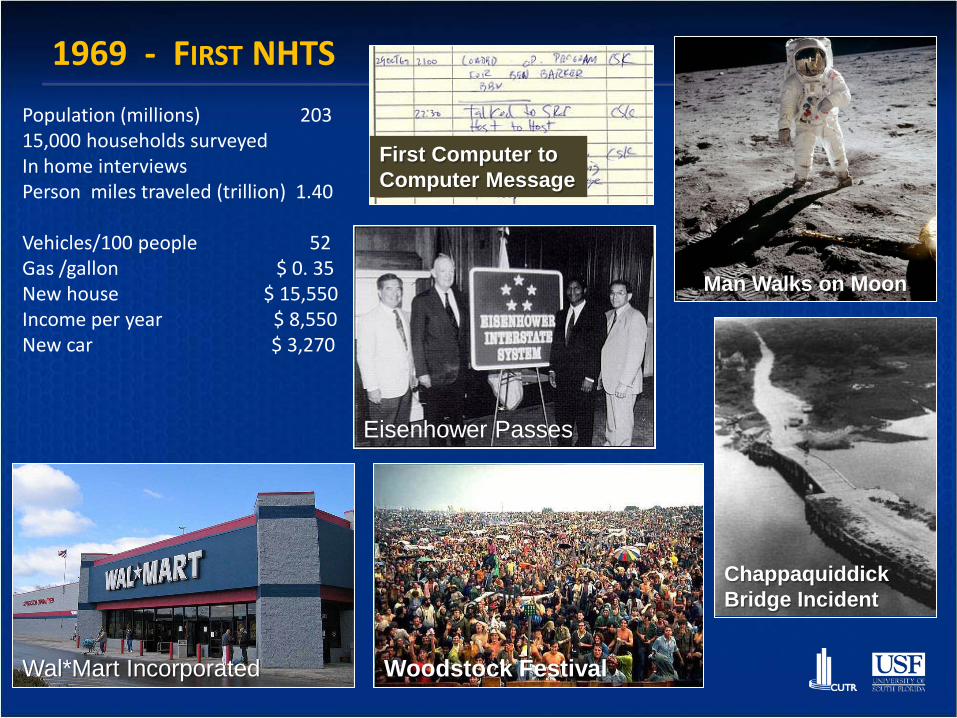
1969 - FIRST NHTS Population (millions) 20315,000 households surveyedIn home interviewsPerson miles traveled (trillion) 1.40
Vehicles/100 people 52Gas /gallon $ 0. 35New house $ 15,550Income per year $ 8,550New car $ 3,270
Man Walks on Moon
Wal*Mart Incorporated
ChappaquiddickBridge Incident
Woodstock Festival
Eisenhower Passes
First Computer to Computer Message
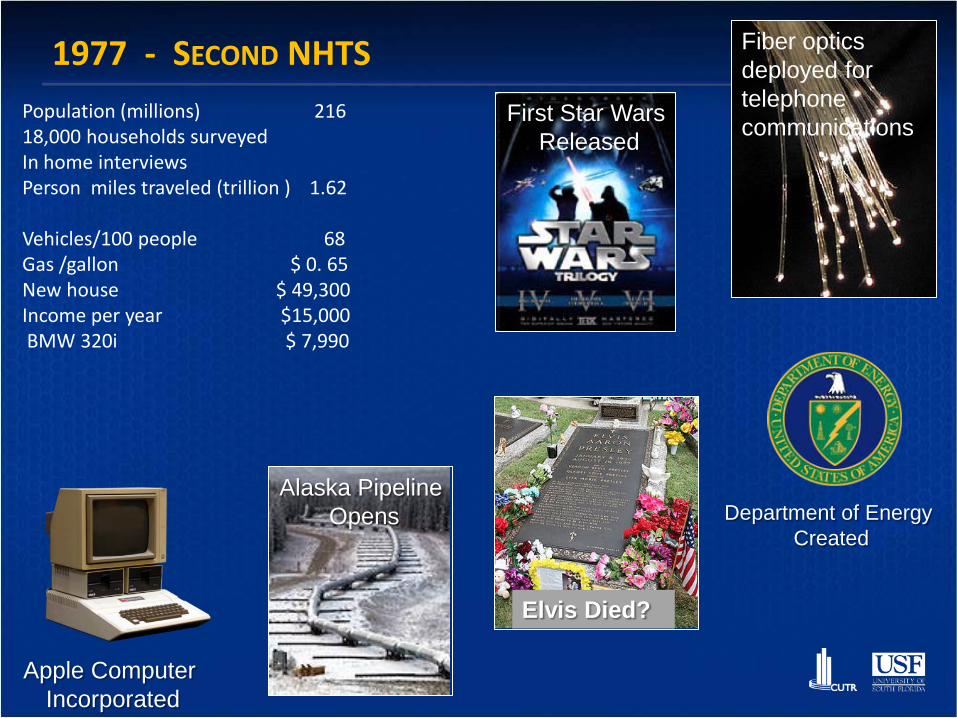
1977 - SECOND NHTS
Apple Computer Incorporated
Department of Energy Created
Alaska Pipeline Opens
Fiber optics deployed for telephone communicationsFirst Star Wars
Released
Elvis Died?
Population (millions) 21618,000 households surveyedIn home interviewsPerson miles traveled (trillion ) 1.62
Vehicles/100 people 68Gas /gallon $ 0. 65New house $ 49,300Income per year $15,000BMW 320i $ 7,990

1983 - THIRD NHTS
Modern Minivan Introduced
Michael Jackson does Moon Walk
ARPANET officially changes to use the Internet Protocol,
creating the Internet
First mobile phones introduced to public by Motorola
Top Seller Ford Escort
McNuggets Introduced
Microsoft Word and
Lotus 1-2-3 first released.
Population (millions) 2346,500 households surveyedIn home interviewsPerson miles traveled (trillions) 1.59
Vehicles/100 people 70Gas /gallon $ 0. 79New house $ 82,600Income per year $ 21,070Dodge RAM 50 Truck $ 5,665

1990 - FOURTH NHTS
Hubble Deployed from Discovery
Exxon Valdez Spill
Honda Accord Top Seller
"The Simpsons “ Aired First Time
Population (millions) 24918,000 + 4,300 add-on HouseholdsComputer Assisted Telephone InterviewPerson miles traveled (trillions) 2.03
Vehicles/100 people 76Gas /gallon $ 1.34New house $ 123,000Income per year $ 28,960Isuzu Rodeo $ 12,4900

1995 - FIFTH NHTS
DVD, Optical Disc Storage Media Announced.
Play Station Released in U.S. 1995 Honda Civic, Most Commonly Stolen Car in 2007
Population (millions) 26221,000 +21,000 add on householdsMail out with CATIPerson miles traveled (trillions) 3.11
Vehicles/100 people 77Gas /gallon $ 1.09New house $ 113,150Income per year $ 35,900New car $ 15,500
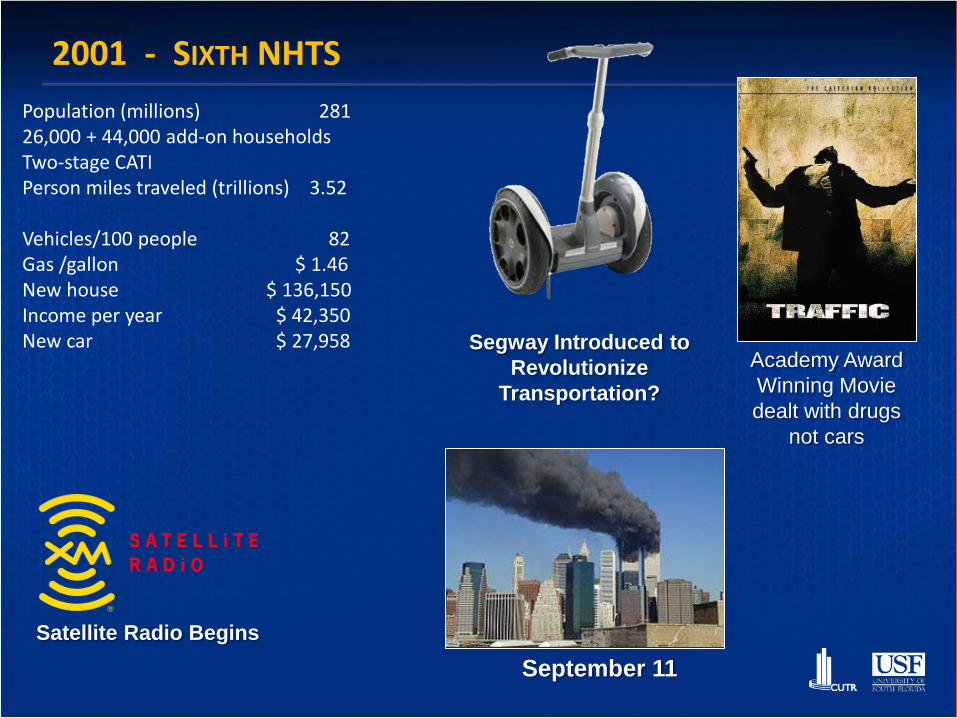
2001 - SIXTH NHTS
Academy Award Winning Movie dealt with drugs
not cars
September 11Satellite Radio Begins
Segway Introduced to Revolutionize
Transportation?
Population (millions) 28126,000 + 44,000 add-on householdsTwo-stage CATIPerson miles traveled (trillions) 3.52
Vehicles/100 people 82Gas /gallon $ 1.46New house $ 136,150Income per year $ 42,350New car $ 27,958

2008-09 - SEVENTH NHTS
Automakers Beg for Washington Aid
The top three Internet searches in 2008:
1. Britney Spears2. World Wrestling
Entertainment3. Obama
Richest Nations Agree to Halve Greenhouse Gas
Facebook Passes 100 Million Users
Population (millions) 30525,000 + 125,000 add-on householdsTwo-stage CATIPerson miles traveled (trillions) 3.30
Vehicles/100 people 80Gas /gallon $ 3.39New house $ 238,880Income per year $ 40,523New car $ 28,715

Apple iphone 7G iOS 8
Personal Teleportation App
Press to Transport
President Signs Transportation Reauthorization Bill LATE-TEA
Population (millions) 323Person VMT (trillion ) .23
Vehicles/100 people 8Gas /Gallon $0.79New house $165,000Income per year $38,000New Car NA
2014 - NHTS

Apple iphone 7G iOS 8
Personal Teleportation App
Press to Transport
President Signs Transportation Reauthorization Bill LATE-TEA
Population (millions) 323Person VMT (trillion ) .23
Vehicles/100 people 8Gas /Gallon $0.79New house $165,000Income per year $38,000New Car NA
2014 - NHTS
Apple iphone 7G iOS 8
Personal Teleportation App
Press to Transport
President Signs Transportation Reauthorization Bill LATE-TEA
Population (millions) 323Person VMT (trillion ) .23
Vehicles/100 people 8Gas /Gallon $0.79New house $165,000Income per year $38,000New Car NA
2014 - NHTS

Fundamental Travel TrendsVMT, Registered Vehicles, Gas Cost, Average Income
0%
100%
200%
300%
400%
500%
600%
700%
800%
900%
1000%
1969 1977 1983 1990 1995 2001 2008
Perc
ent G
row
th si
nce
1969
Average Income
Registered Vehicles
Gas Cost
PMT
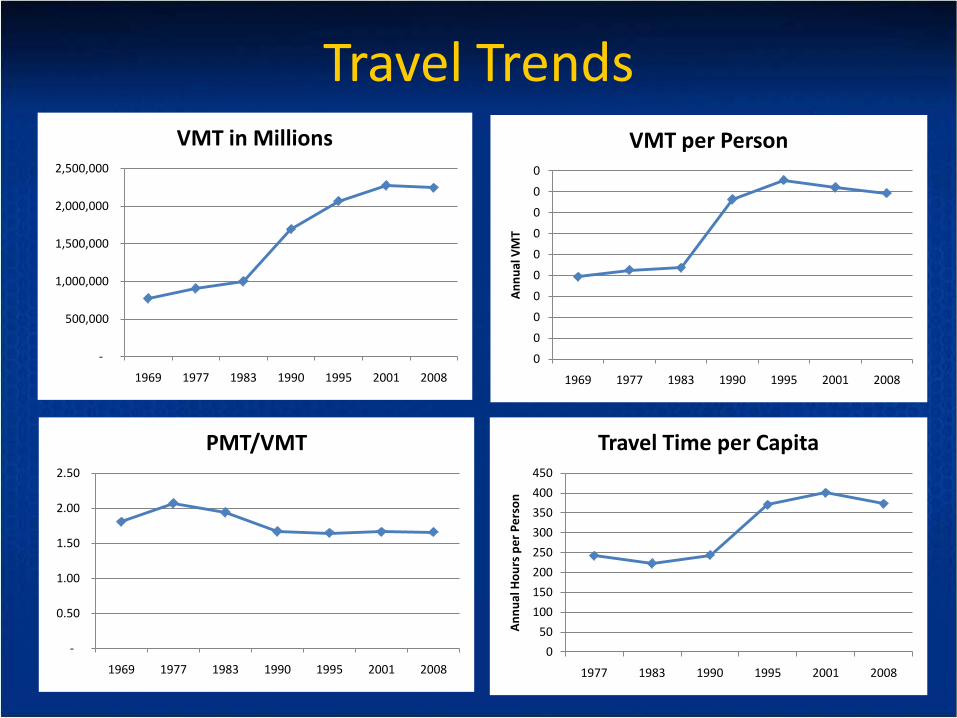
Travel Trends
050
100150200250300350400450
1977 1983 1990 1995 2001 2008
Annu
al H
ours
per
Per
son
Travel Time per Capita
0000000000
1969 1977 1983 1990 1995 2001 2008
Annu
al V
MT
VMT per Person
-
500,000
1,000,000
1,500,000
2,000,000
2,500,000
1969 1977 1983 1990 1995 2001 2008
VMT in Millions
-
0.50
1.00
1.50
2.00
2.50
1969 1977 1983 1990 1995 2001 2008
PMT/VMT

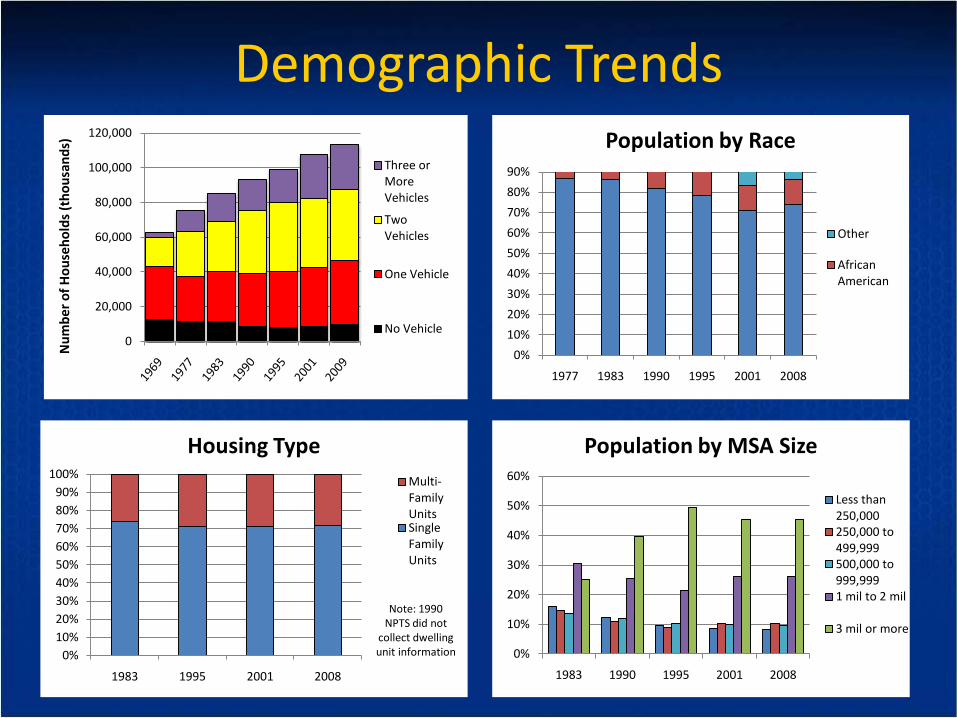
Demographic Trends
23
38
24
10
5
15
26
24
16
20
0 10 20 30 40
Only Child
Single Sibling
Two Siblings
Three Siblings
Basketball Team
Households with Siblings
1960 2000census
0%10%20%30%40%50%60%70%80%90%
100%
1983 1990 1995 2001 2008
Perc
ent o
f all
Hous
ehol
ds
Household Size
5+ Persons
4 Persons
3 Persons
2 Persons
1 Person
0%5%
10%15%20%25%30%35%40%45%50%
1977 1983 1990 1995 2001 2008
Perc
ent o
f all
Peop
le
Population by Age
Age 5-15
Age 16-25
Age 26-34
Age 35-64
Age 65 and over
0%
10%
20%
30%
40%
50%
60%
70%
80%
90%
1983 1990 1995 2001 2008
Perc
ent o
f Pop
ulat
ion
Population - Urban and Rural
Urban
Rural
Demographic Trends
0%
10%
20%
30%
40%
50%
60%
1983 1990 1995 2001 2008
Population by MSA Size
Less than 250,000250,000 to 499,999500,000 to 999,9991 mil to 2 mil
3 mil or more
0%10%20%30%40%50%60%70%80%90%
1977 1983 1990 1995 2001 2008
Population by Race
Other
African American
0%10%20%30%40%50%60%70%80%90%
100%
1983 1995 2001 2008
Housing TypeMulti-Family UnitsSingle Family Units
Note: 1990 NPTS did not
collect dwelling unit information
0
20,000
40,000
60,000
80,000
100,000
120,000
Num
ber o
f Hou
seho
lds (
thou
sand
s)
Three or More Vehicles
Two Vehicles
One Vehicle
No Vehicle
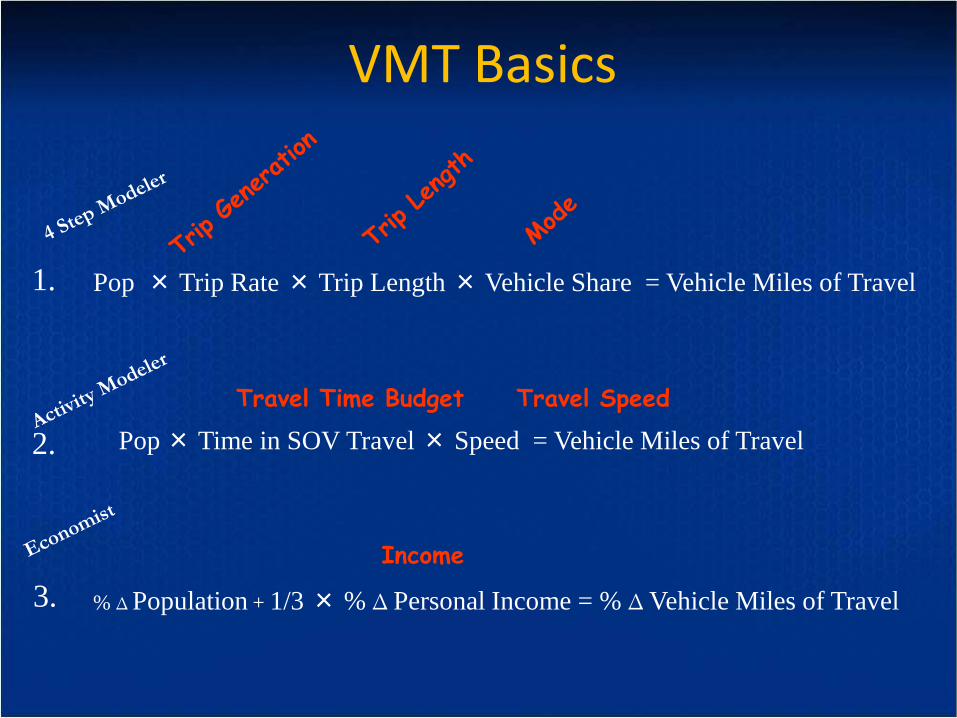
VMT Basics
Travel Time Budget Travel Speed
1.
2.
3. % Δ Population + 1/3 × % Δ Personal Income = % Δ Vehicle Miles of Travel
Income
Pop × Time in SOV Travel × Speed = Vehicle Miles of Travel
Pop × Trip Rate × Trip Length × Vehicle Share = Vehicle Miles of Travel

Trip Rate and Length
1067
1054
1371
1568
1449
1385
9.47 8.68 9.29 9.00
10.78 9.52
0
5
10
15
20
0
200
400
600
800
1000
1200
1400
1600
1800
1977 1983 1990 Adj. 1995 2001 2008
Trip
Len
gth
Annu
al T
rips
per P
erso
n 5+
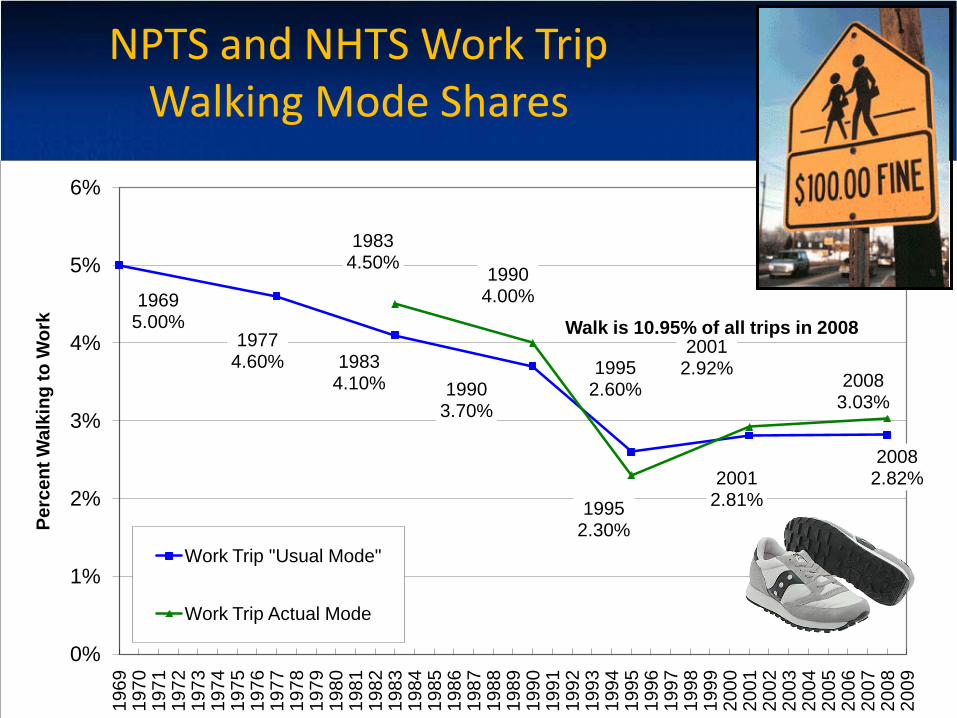
NPTS and NHTS Work Trip Walking Mode Shares
19695.00%
19774.60% 1983
4.10% 19903.70%
19952.60%
20012.81%
20082.82%
19834.50% 1990
4.00%
19952.30%
20012.92% 2008
3.03%
0%
1%
2%
3%
4%
5%
6%
1969
1970
1971
1972
1973
1974
1975
1976
1977
1978
1979
1980
1981
1982
1983
1984
1985
1986
1987
1988
1989
1990
1991
1992
1993
1994
1995
1996
1997
1998
1999
2000
2001
2002
2003
2004
2005
2006
2007
2008
2009
Perc
ent W
alki
ng to
Wor
k
Work Trip "Usual Mode"
Work Trip Actual Mode
Walk is 10.95% of all trips in 2008
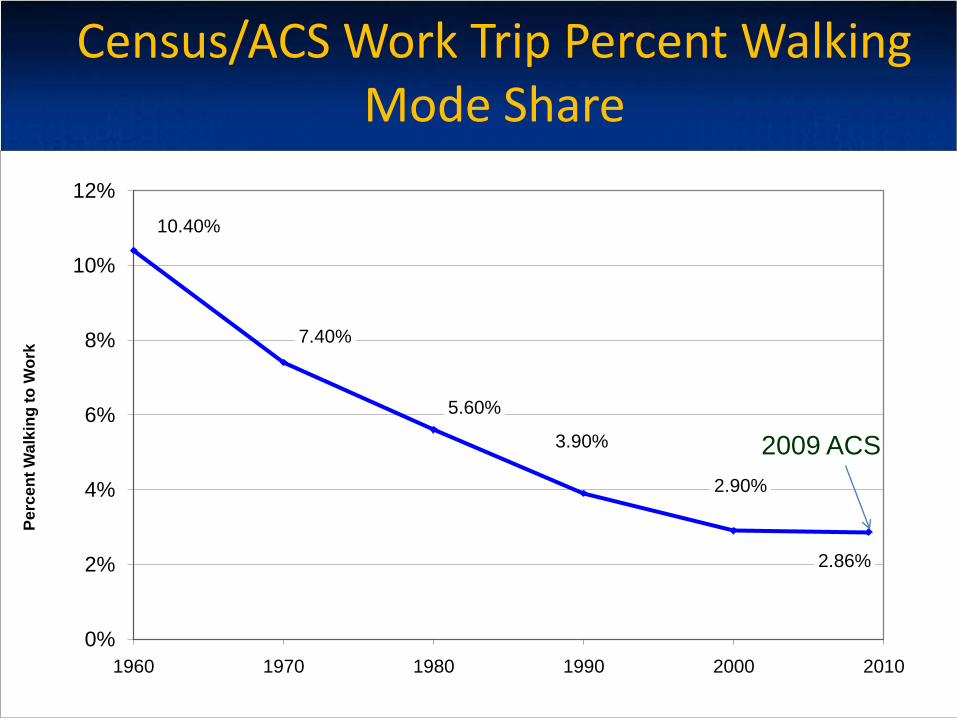
Census/ACS Work Trip Percent Walking Mode Share
10.40%
7.40%
5.60%
3.90%
2.90%
2.86%
0%
2%
4%
6%
8%
10%
12%
1960 1970 1980 1990 2000 2010
Perc
ent W
alki
ng to
Wor
k
2009 ACS

Vehicle Occupancies - NHTS
1.401.30 1.30
1.20 1.20 1.201.13
1.90 1.90
1.801.70
1.59 1.64
1.67
0.80
1.00
1.20
1.40
1.60
1.80
2.00
2.20
1969 1974 1979 1984 1989 1994 1999 2004 2009
Occ
upan
cy
Work Trip
All Trips
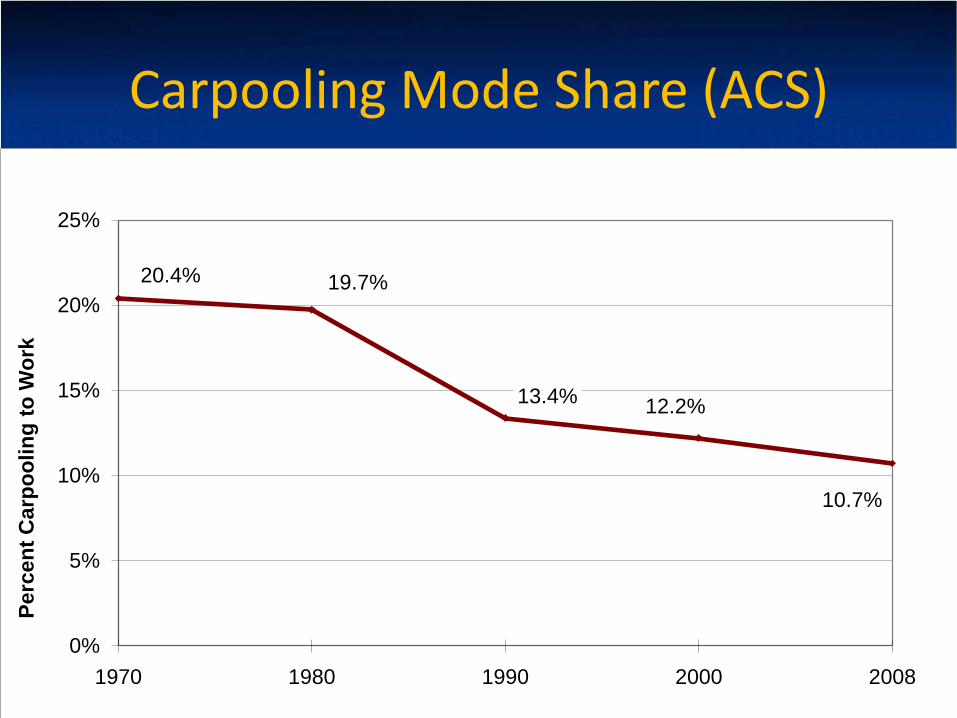
Carpooling Mode Share (ACS)
20.4% 19.7%
13.4% 12.2%
10.7%
0%
5%
10%
15%
20%
25%
1970 1980 1990 2000 2008
Perc
ent C
arpo
olin
g to
Wor
k
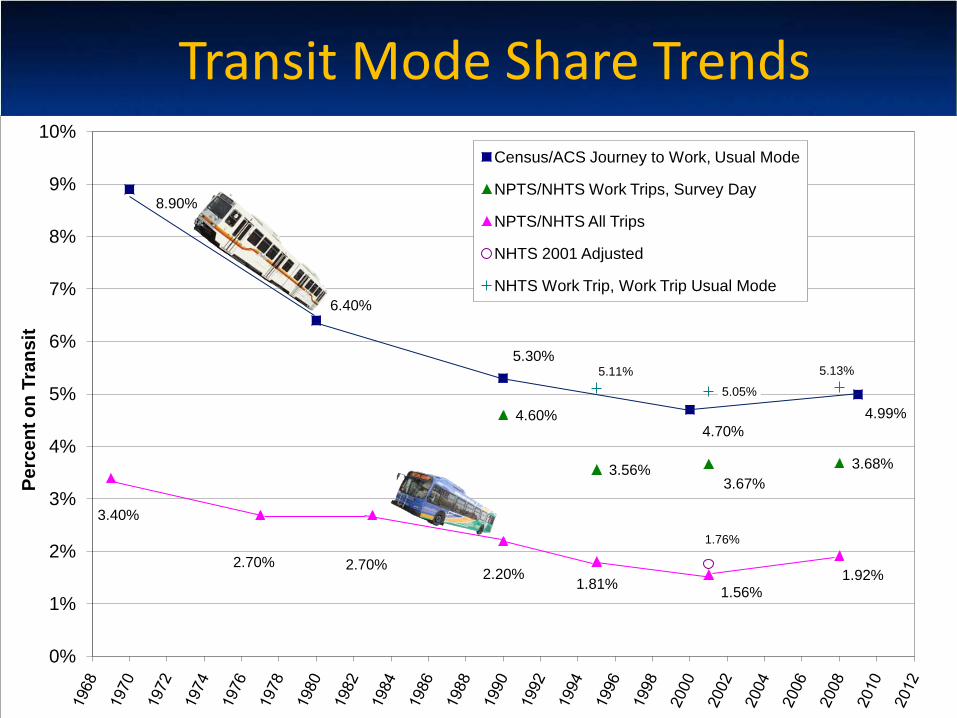
8.90%
6.40%
5.30%
4.70%4.99%4.60%
3.56%3.67%
3.68%
3.40%
2.70% 2.70% 2.20%1.81% 1.56%
1.92%
1.76%
5.11%5.05%
5.13%
0%
1%
2%
3%
4%
5%
6%
7%
8%
9%
10%
Perc
ent o
n Tr
ansi
t
Census/ACS Journey to Work, Usual Mode
NPTS/NHTS Work Trips, Survey Day
NPTS/NHTS All Trips
NHTS 2001 Adjusted
NHTS Work Trip, Work Trip Usual Mode
Transit Mode Share Trends
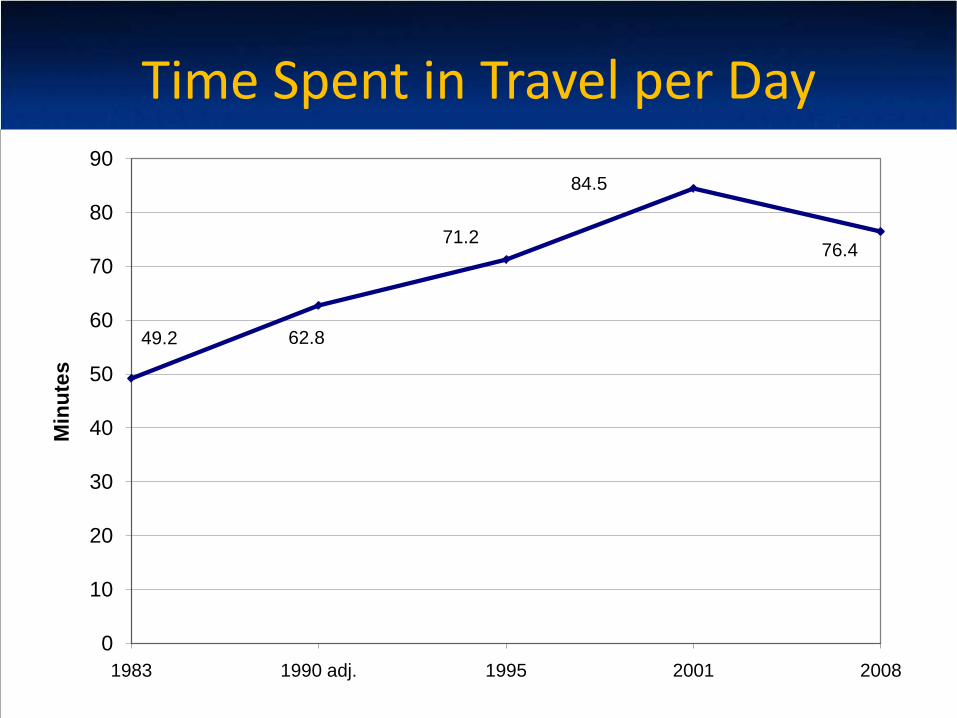
Time Spent in Travel per Day
49.2 62.8
71.2
84.5
76.4
0
10
20
30
40
50
60
70
80
90
1983 1990 adj. 1995 2001 2008
Min
utes
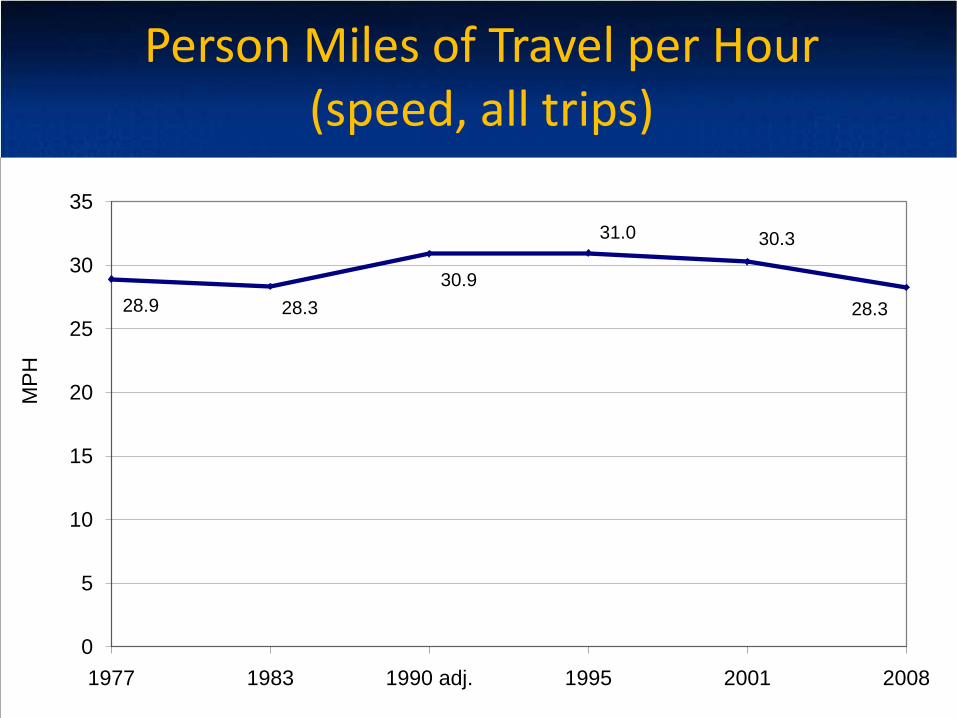
Person Miles of Travel per Hour (speed, all trips)
28.9 28.330.9
31.0 30.3
28.3
0
5
10
15
20
25
30
35
1977 1983 1990 adj. 1995 2001 2008
MP
H
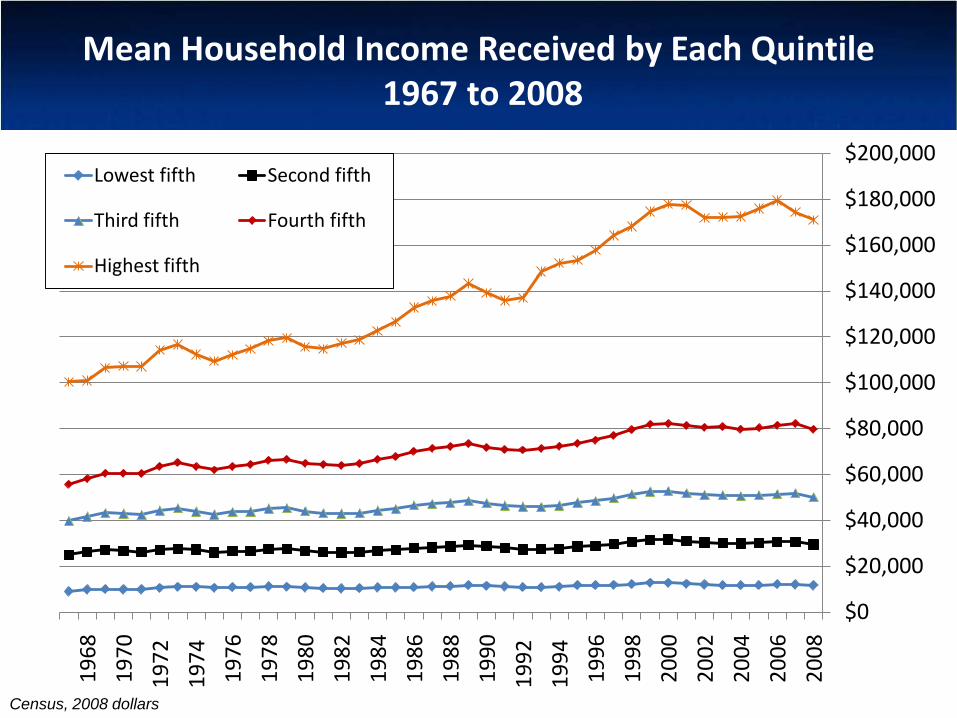
Mean Household Income Received by Each Quintile1967 to 2008
$0
$20,000
$40,000
$60,000
$80,000
$100,000
$120,000
$140,000
$160,000
$180,000
$200,000
2008
2006
2004
2002
2000
1998
1996
1994
19
92
1990
1988
1986
1984
1982
1980
1978
1976
1974
19
72
1970
1968
Lowest fifth Second fifth
Third fifth Fourth fifth
Highest fifth
Census, 2008 dollars

PMT by Income Quintile
0
2,000
4,000
6,000
8,000
10,000
12,000
14,000
16,000
18,000
1983 1995 2009
Annu
al P
er P
erso
n PM
T
1st 2nd 3rd 4th 5th
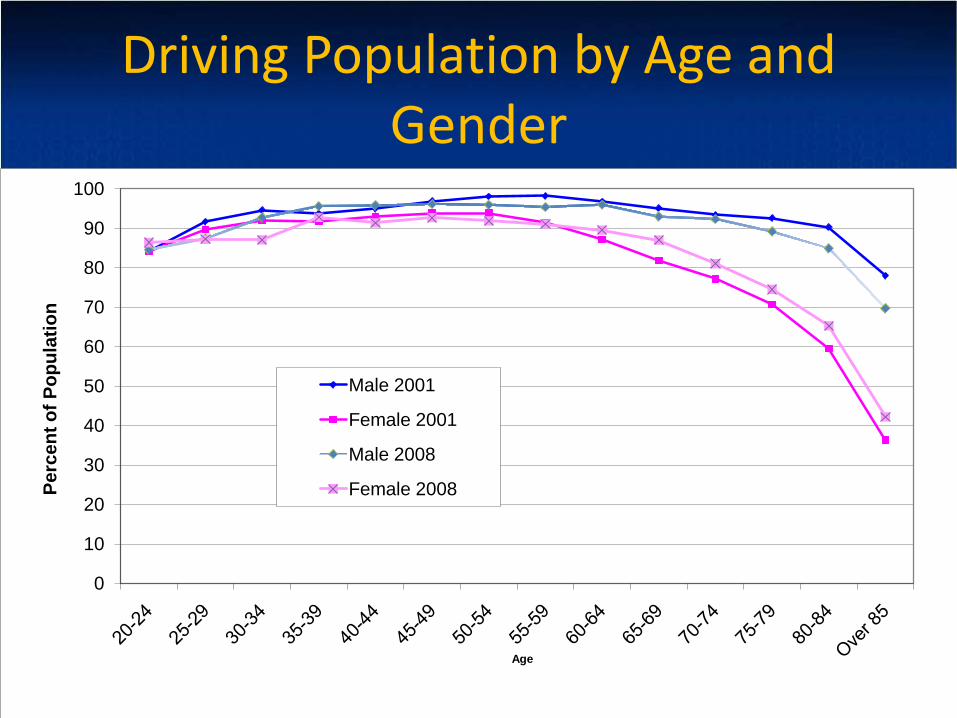
Driving Population by Age and Gender
30
0
10
20
30
40
50
60
70
80
90
100
Perc
ent o
f Pop
ulat
ion
Age
Male 2001
Female 2001
Male 2008
Female 2008
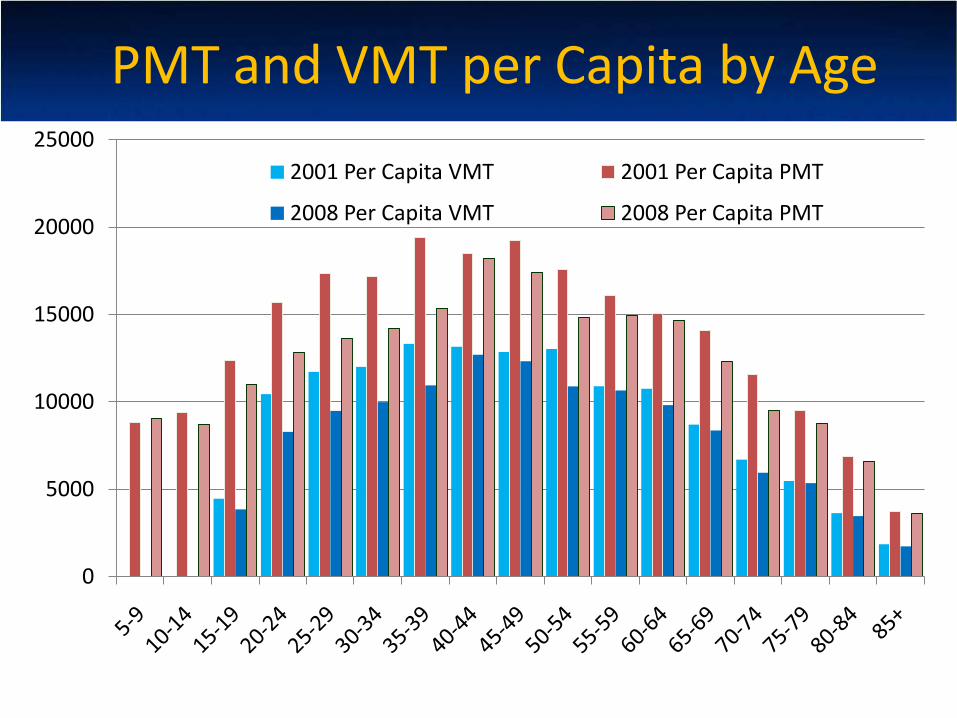
PMT and VMT per Capita by Age
0
5000
10000
15000
20000
250002001 Per Capita VMT 2001 Per Capita PMT
2008 Per Capita VMT 2008 Per Capita PMT

PMT and VMT per Capita by Age
0
2000
4000
6000
8000
10000
12000
140002001 Per Capita VMT
2008 Per Capita VMT

Trip Purpose Changes by Gender
0
100
200
300
400
500
600
700
800
900
1990 1995 2001 2009 1990 1995 2001 2009
Women Men
Annu
al P
erso
n Tr
ips
per P
erso
n
To or From Work Family and Personal Errands
School/Church Social and Recreational

Vehicle Availability
0
0.2
0.4
0.6
0.8
1
1.2
1.4
1.6
1969 1974 1979 1984 1989 1994 1999 2004 2009
Vehi
cles
per
Vehicles per worker
Vehicles per person 16 and older
Vehicles per person
Vehicles per driver
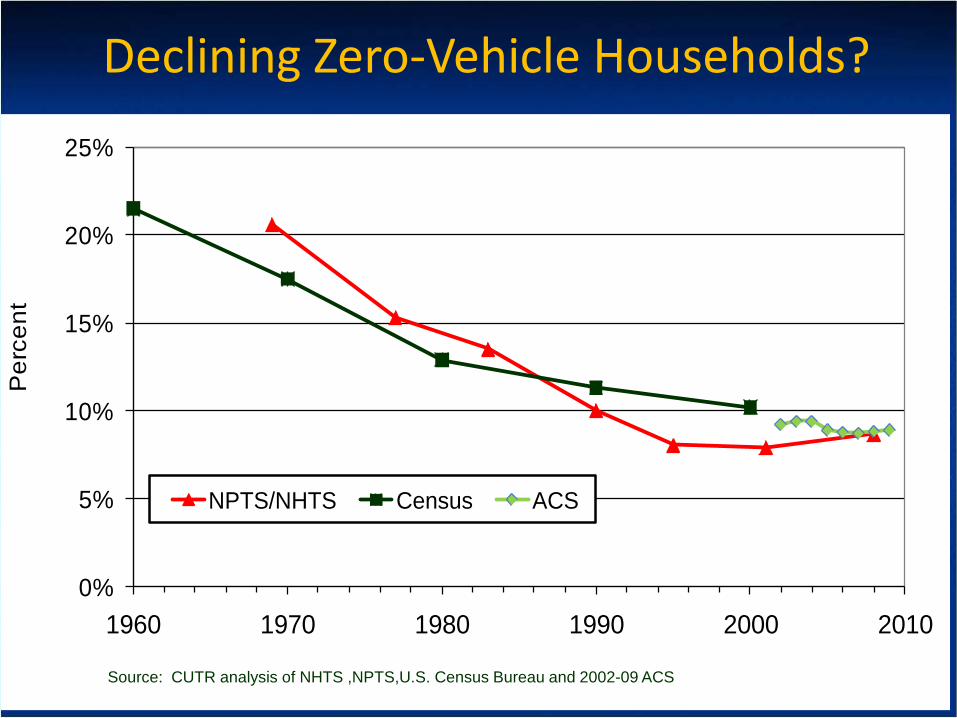
Declining Zero-Vehicle Households?
0%
5%
10%
15%
20%
25%
1960 1970 1980 1990 2000 2010
Per
cent
NPTS/NHTS Census ACS
Source: CUTR analysis of NHTS ,NPTS,U.S. Census Bureau and 2002-09 ACS
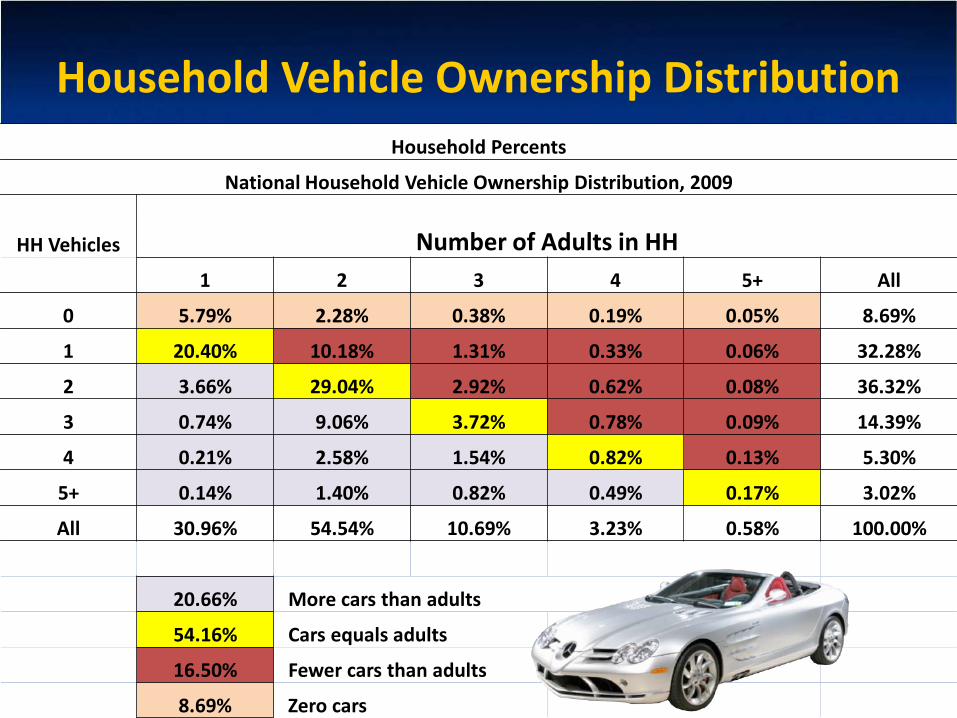
Household Vehicle Ownership DistributionHousehold Percents
National Household Vehicle Ownership Distribution, 2009
HH Vehicles Number of Adults in HH1 2 3 4 5+ All
0 5.79% 2.28% 0.38% 0.19% 0.05% 8.69%
1 20.40% 10.18% 1.31% 0.33% 0.06% 32.28%
2 3.66% 29.04% 2.92% 0.62% 0.08% 36.32%
3 0.74% 9.06% 3.72% 0.78% 0.09% 14.39%
4 0.21% 2.58% 1.54% 0.82% 0.13% 5.30%
5+ 0.14% 1.40% 0.82% 0.49% 0.17% 3.02%
All 30.96% 54.54% 10.69% 3.23% 0.58% 100.00%
20.66% More cars than adults
54.16% Cars equals adults
16.50% Fewer cars than adults
8.69% Zero cars
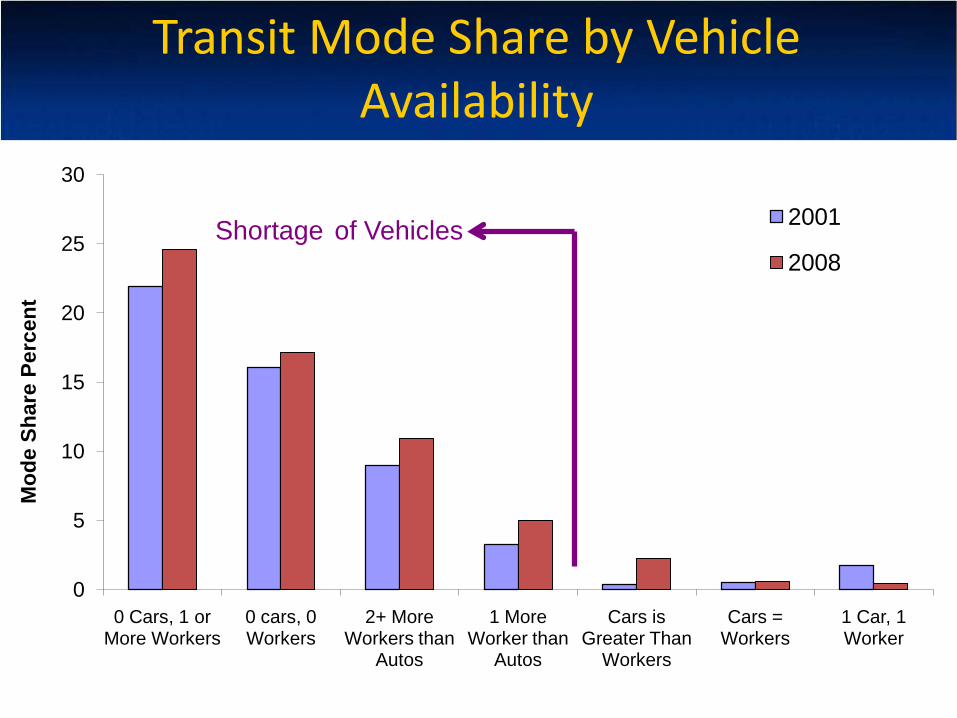
0
5
10
15
20
25
30
0 Cars, 1 or More Workers
0 cars, 0 Workers
2+ More Workers than
Autos
1 More Worker than
Autos
Cars is Greater Than
Workers
Cars = Workers
1 Car, 1 Worker
Mod
e Sh
are
Perc
ent
2001
2008
Transit Mode Share by Vehicle Availability
Shortage of Vehicles
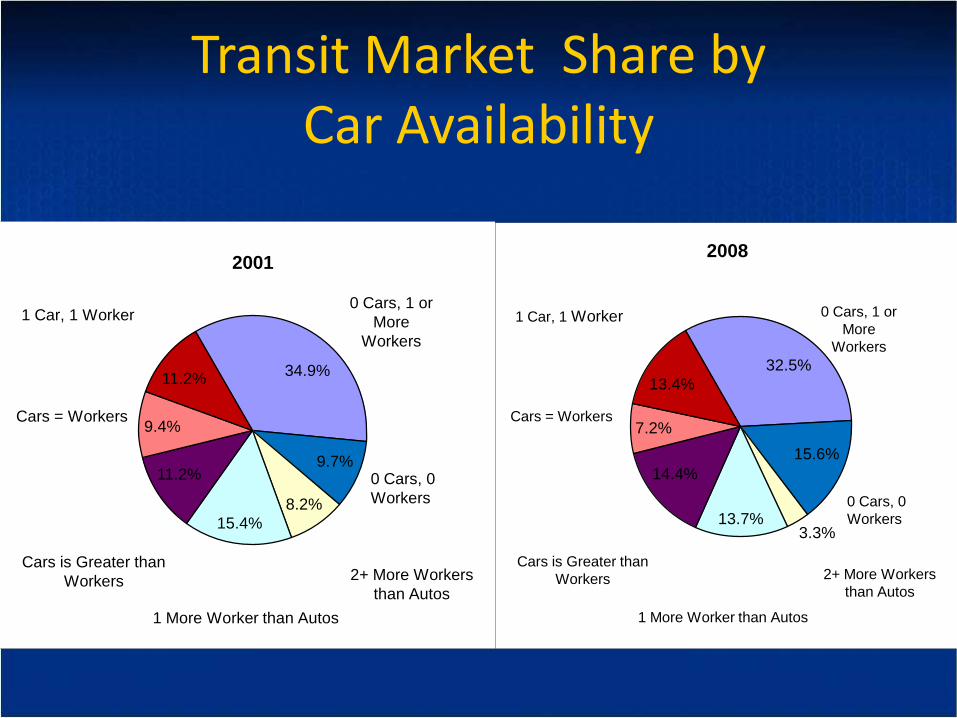
Transit Market Share by Car Availability
32.5%
15.6%
3.3%13.7%
14.4%
7.2%
13.4%
2008
0 Cars, 1 or More
Workers
0 Cars, 0 Workers
2+ More Workers than Autos
1 More Worker than Autos
Cars is Greater than Workers
Cars = Workers
1 Car, 1 Worker
34.9%
9.7%
8.2%15.4%
11.2%
9.4%
11.2%
2001
0 Cars, 1 or More
Workers
0 Cars, 0 Workers
2+ More Workers than Autos
1 More Worker than Autos
Cars is Greater than Workers
Cars = Workers
1 Car, 1 Worker
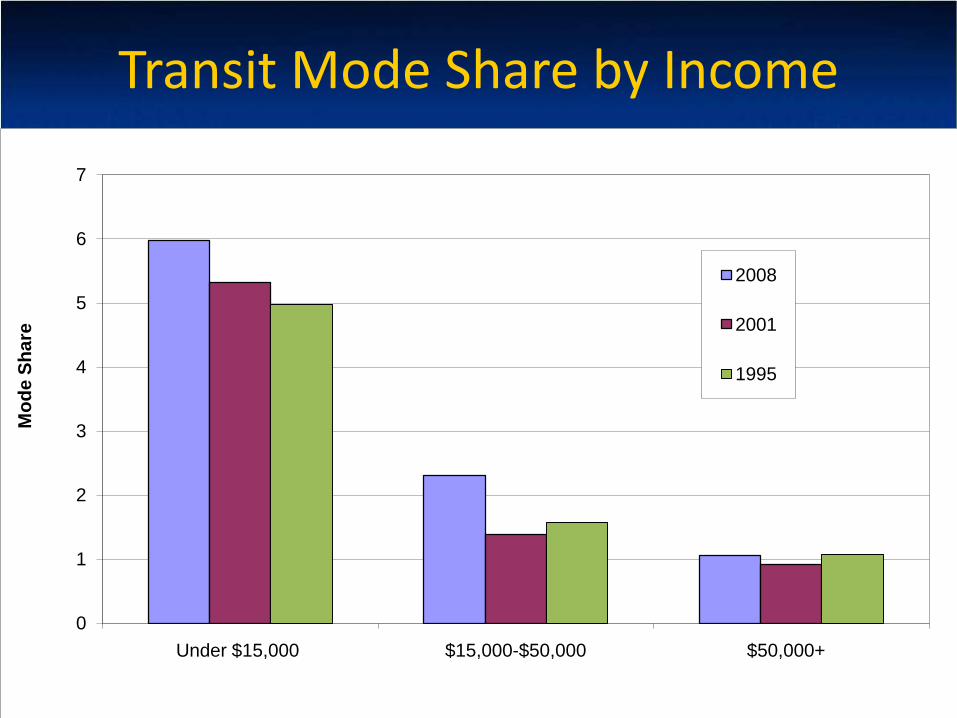
Transit Mode Share by Income
0
1
2
3
4
5
6
7
Under $15,000 $15,000-$50,000 $50,000+
Mod
e Sh
are
2008
2001
1995
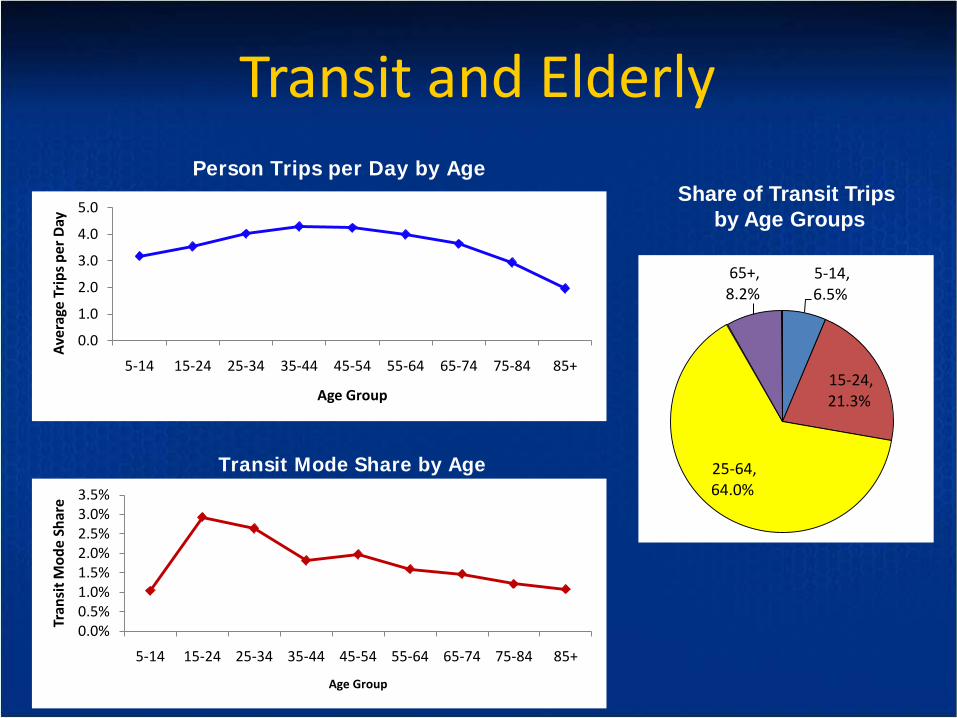
Transit and ElderlyPerson Trips per Day by Age
Transit Mode Share by Age
Share of Transit Trips by Age Groups
0.0
1.0
2.0
3.0
4.0
5.0
5-14 15-24 25-34 35-44 45-54 55-64 65-74 75-84 85+
Aver
age
Trip
s per
Day
Age Group
0.0%0.5%1.0%1.5%2.0%2.5%3.0%3.5%
5-14 15-24 25-34 35-44 45-54 55-64 65-74 75-84 85+
Tran
sit M
ode
Shar
e
Age Group
5-14, 6.5%
15-24, 21.3%
25-64, 64.0%
65+, 8.2%
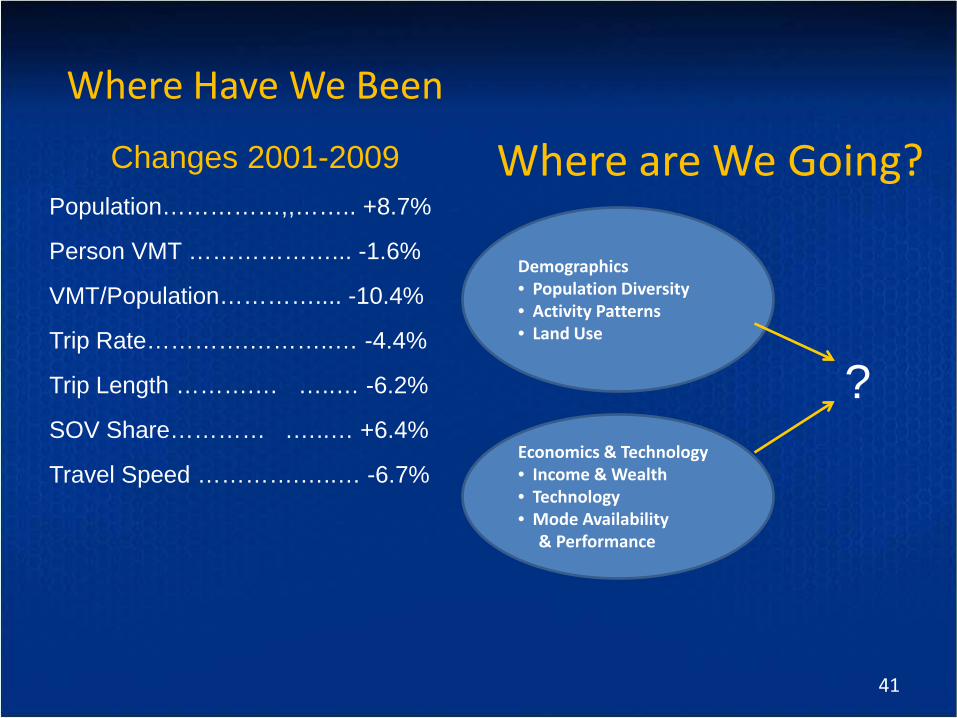
41
Changes 2001-2009 Population……………,,…….. +8.7%
Person VMT ………………... -1.6%
VMT/Population………….... -10.4%
Trip Rate………….………..… -4.4%
Trip Length ……….… …..… -6.2%
SOV Share………… .…..… +6.4%
Travel Speed ………….…..… -6.7%
Demographics• Population Diversity• Activity Patterns• Land Use
Economics & Technology• Income & Wealth• Technology • Mode Availability
& Performance
Where are We Going?
Where Have We Been
?
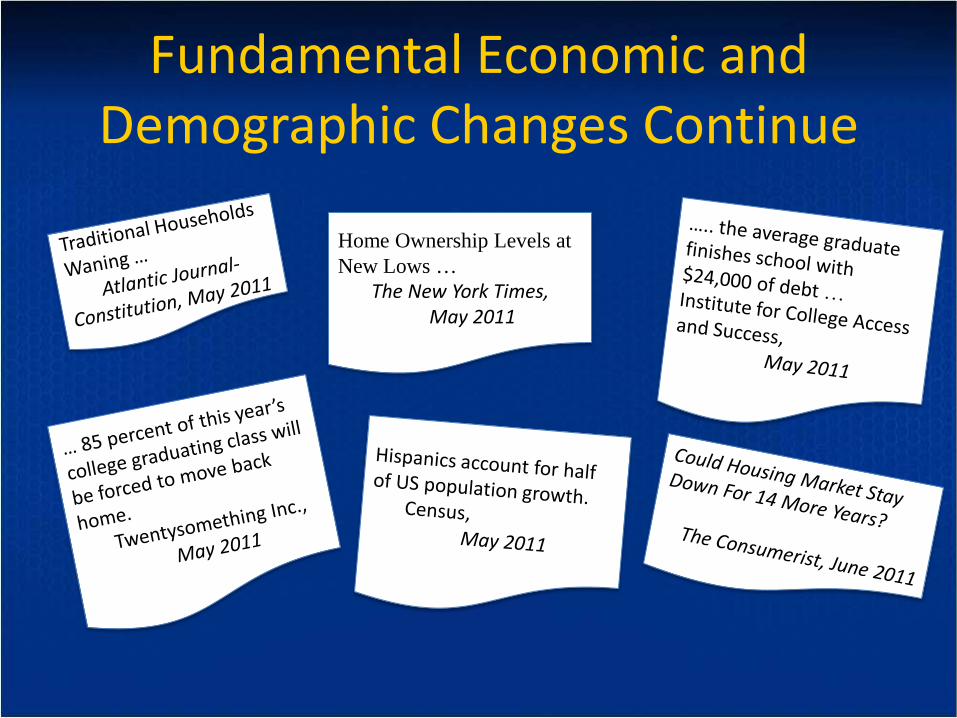
Fundamental Economic and Demographic Changes Continue
Home Ownership Levels at New Lows …
The New York Times,May 2011
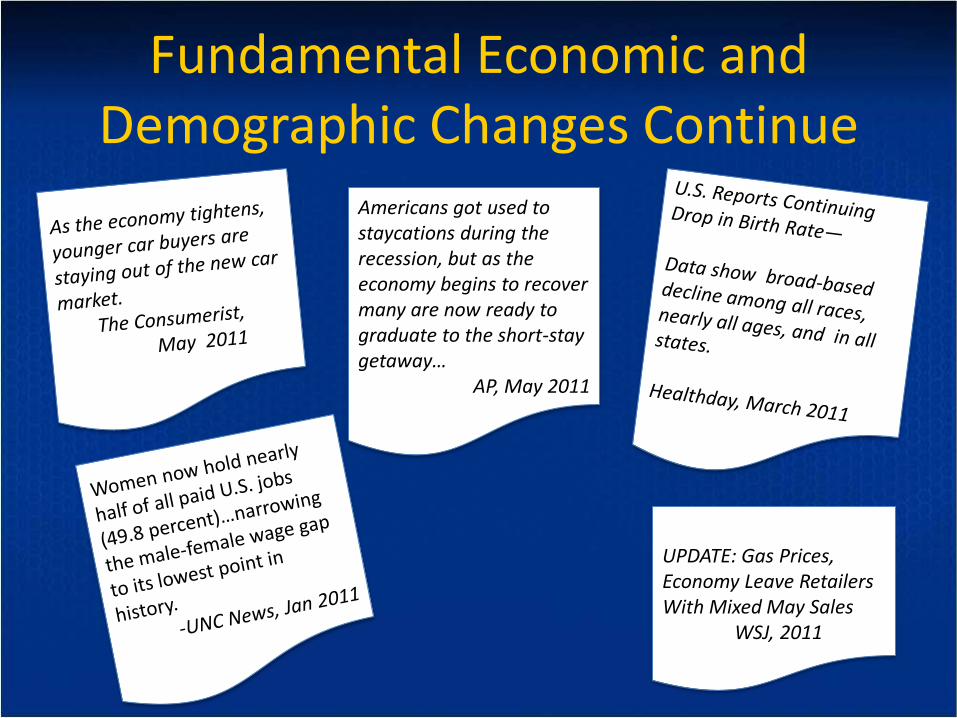
Fundamental Economic and Demographic Changes Continue
UPDATE: Gas Prices, Economy Leave Retailers With Mixed May Sales
WSJ, 2011
Americans got used to staycations during the recession, but as the economy begins to recover many are now ready to graduate to the short-stay getaway…
AP, May 2011
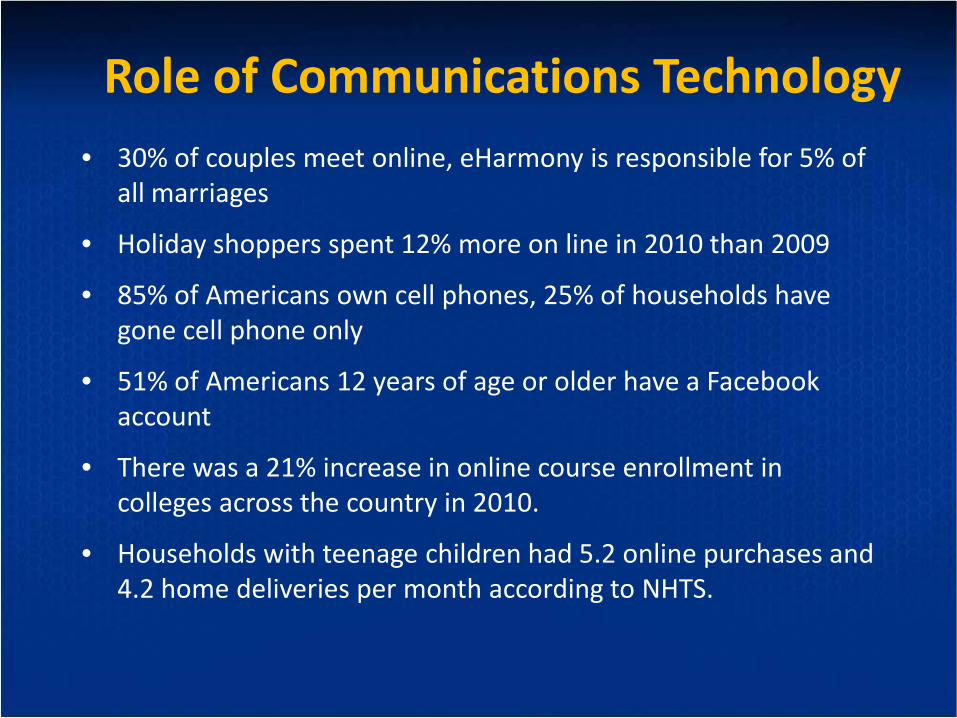
Role of Communications Technology• 30% of couples meet online, eHarmony is responsible for 5% of
all marriages
• Holiday shoppers spent 12% more on line in 2010 than 2009
• 85% of Americans own cell phones, 25% of households have gone cell phone only
• 51% of Americans 12 years of age or older have a Facebook account
• There was a 21% increase in online course enrollment in colleges across the country in 2010.
• Households with teenage children had 5.2 online purchases and 4.2 home deliveries per month according to NHTS.

Socio-Demographic Issues Aging population• Saturation of female labor force participation Different young adult behaviors Slowing migration - locked in homes/less mobile Reduced immigration Income/wealth impact• Changing household composition• Slowing of suburbanization?
System Supply Issues Future system supply and speed• Energy and other costs• Environment/climate concerns• Evolving technology impacting
travel• Etc.
How can the current and future NHTS help us address transportation planning and policy issues going forward?

NHTS - A FIX FOR DATA ADDICTS ANDINOCULATION AGAINST UNINFORMED DECISIONS
47