Embed Size (px)
Citation preview

Exploring behavioural patterns in interaction data
from the “Your Fertility” website
Master’s Thesis
Presented by
Ngoc Cat My Tran
Supervised by Dr Shaowen Qin and Dr Richard Leibbrandt
Submitted to the College of Science and Engineering in partial fulfilment of
the requirements for the degree of Master of Information Technology at
Flinders University – Adelaide Australia
June 2021
Author’s Declaration
Hereby I, Ngoc Cat My Tran, certify that this work does not incorporate without
acknowledgement any material previously submitted for a degree or diploma in
any university; and that to the best of my knowledge and belief it does not contain
any material previously published or written by another person except where due
reference is made in the text.
Signed
Date
Ngoc Cat My Tran
Adelaide, 11 June 2021
2

3
Abstract
Understanding user’s behavioural patterns while using a certain website can lead to
improved website design with more personalized features, or more precisely targeted
marketing campaigns. Various papers have been conducted to find the user’s
behavioural patterns in the online health platforms, but the majority of them just focus
on totally or partially offline behaviours. This study focuses on exploratory data
analysis to identify behavioural patterns in using an interactive tool on a fertility
education platform (the “Your Fertility” website). A dataset of 4245 people (84%
women and 16% men) who voluntarily accessed the online Healthy Conception Tool
(HCT) on the “Your Fertility” website was analysed. Depending on the types of
variables, the paper used certain statistical techniques including Pearson correlation
coefficient, Scatter plot, Chi-Squared Test, Bonferroni correction, One-hot encoding,
and Point Biserial Correlation. The paper indicated that the modified profile (the last
input of users) has a greater number of correlations than the initial profile (the first
input of users), which supports the “linear slider format” issue. Besides, this analysis
shows the significant gender differences in behaviours related to age and weight
directions, between people having children and no children, and between people
having STI (Sexually transmitted infections) test and not. Also, Principal Component
Analysis and K-means clustering were applied to figure out the user’s behaviours in
groups.

4
Acknowledgements
First and foremost, I wish to express my sincere gratitude towards my supervisors, Dr
Shaowen Qin and Dr Richard Leibbrandt, for their invaluable guidance, tremendous support
and meticulous suggestions throughout this whole process. I am also very appreciative of
them for positive communication in weekly offline and online meetings to empower me to
explore new knowledge and try new experiments with their right directions.
I am also enormously grateful to Dr Niranjan Bidargaddi and Dr Wenhao Li, who are the
project owners, for providing the dataset and initial directions.
And finally, I am most thankful to my family and friends for their unconditional love and
support during my course of study at Flinders University.

5
TABLE OF CONTENTS
AUTHOR’S DECLARATION ............................................................................................................................. 2
ABSTRACT ......................................................................................................................................................... 3
ACKNOWLEDGEMENTS .................................................................................................................................. 4
TABLE OF CONTENTS...................................................................................................................................... 5
LIST OF FIGURES ............................................................................................................................................. 6
LIST OF TABLES ............................................................................................................................................... 7
LIST OF ABBREVIATIONS ............................................................................................................................... 8
1. INTRODUCTION ............................................................................................................................................ 9
1.1 MOTIVATION............................................................................................................................................................. 9 1.2. RESEARCH QUESTIONS ......................................................................................................................................... 10 1.3. RESEARCH OBJECTIVES ........................................................................................................................................ 10 1.4. STRUCTURE ............................................................................................................................................................ 10
2. BACKGROUND STUDY AND RESEARCH ................................................................................................. 12
2.1 INTRODUCTION OF “YOUR FERTILITY” WEBSITE AND HEALTHY CONCEPTION TOOL (HCT) .......................... 12 2.2. THE IMPORTANCE OF UNDERSTANDING ONLINE USER’S INTERACTIVE BEHAVIOURS ........................................ 13 2.3. REVIEW ON USER’S BEHAVIOUR IN ONLINE HEALTH EDUCATION PLATFORMS .................................................. 14
3. DATA DESCRIPTION ................................................................................................................................... 17
3.1. DATA COLLECTION ................................................................................................................................................ 17 3.2. ORIGINAL DATA ..................................................................................................................................................... 19 3.3. DATA FOR PAIR-VARIABLE ANALYSIS ................................................................................................................... 20 3.4. DATA FOR GROUP-VARIABLE ANALYSIS ............................................................................................................... 22
4. METHODOLOGY ......................................................................................................................................... 24
4.1. PAIR-VARIABLE ANALYSIS .................................................................................................................................... 25 4.2. GROUP-VARIABLE ANALYSIS................................................................................................................................. 28
5. ANALYSIS AND RESULTS .......................................................................................................................... 32
5.1. PAIR-VARIABLE ANALYSIS’S RESULTS .................................................................................................................. 32 5.1.1. The modified profile and the initial profile .................................................................................................. 32 5.1.2. Behavioral differences between men and women ........................................................................................ 39 5.1.3. Previous Children and Weight change behaviour ....................................................................................... 41 5.1.4. STI Test and Completion (%)........................................................................................................................ 41
5.2. GROUP-VARIABLE ANALYSIS RESULTS ................................................................................................................. 42
6. DISCUSSION AND FUTURE WORK ........................................................................................................... 45
REFERENCES .................................................................................................................................................. 48
APPENDIX ........................................................................................................................................................ 53

6
List of Figures
Figure 1. The questions in Page 1 in the HCT (Fertility Coalition, 2012) ................................................ 17
Figure 2. The questions in Page 2 in the HCT (Fertility Coalition, 2012) ................................................ 18
Figure 3. The hierarchy visualisation of data division .............................................................................. 21
Figure 4. The general process for data analysis ........................................................................................ 24
Figure 5. The flowchart of pair-variable analysis ..................................................................................... 25
Figure 6. Chi-square tests using the Bonferroni correction between Gender and Age changing
behaviours in the modified profile .................................................................................................... 27
Figure 7. The flowchart of the group-variable analysis ............................................................................ 28
Figure 8. The PCA visualisation with the target Completion rate ............................................................ 29
Figure 9. An example for PCA visualisation without the target variable. ................................................ 30
Figure 10. Data allocation by K-means with centroids after training the model ...................................... 30
Figure 11. Correlation coefficient between features and user’s initial health profile (the first value) ..... 34
Figure 12. Correlation coefficient between features and user’s modified health profile (the last value) . 35
Figure 13. The scatter plots of Smoking and its Mean-Median between the initial profile and the
modified profile ................................................................................................................................. 36
Figure 14. The scatter plots of Alcohol Consumption and its Mean-Median between the initial profile
and the modified profile .................................................................................................................... 37
Figure 15. The scatter plots of Trying Month and its Mean-Median between the initial profile and the
modified profile ................................................................................................................................. 37
Figure 16. The scatter plots of Sex Frequency and its Mean-Median between the initial profile and the
modified profile ................................................................................................................................. 38
Figure 17. The histogram charts for 7 numerical variables of the initial profile ...................................... 38
Figure 18. The histogram charts for 7 numerical variables of the modified profile ................................. 39
Figure 19. The small set of heat map for correlations between the categorical variables in the modified
profile and numerical behavioural patterns ....................................................................................... 42
Figure 20. The PCA visualisation of PC6 and PC9 with K-means for assigning data to clusters ............ 43
Figure 21. The correlation coefficient between Clusters and the inputted variables in PC6 and PC9. .... 43
Figure 22. The PCA visualisation of PC7 and PC8 with K-means for assigning data to clusters ............ 43
Figure 23. The correlation coefficient between Clusters and the inputted variables in PC7 and PC8 ..... 44
Figure 24. The linear slider format is used on the website for numerical answers ................................... 46

7
List of Tables
Table 1. The description of attributes in the original dataset ...................................................................... 19
Table 2. A dataset of one visitor ID that captures all the changes of the user’s input. ............................... 20
Table 3. The summary of the expanded dataset .......................................................................................... 21
Table 4. The data classification of behavioural patterns ............................................................................. 22
Table 5. The description of 5 data groups after feature engineering ........................................................... 23
Table 6. The statistical techniques applied in the analysis depending on the types of variables ................ 25
Table 7. The Sex Right Time after the one-hot encoding process .............................................................. 26
Table 8. The number of principal components per each scenario with the cumulative variance over 80%29
Table 9. The number of relationships in pair-variable analysis .................................................................. 32
Table 10. The list of correlations between numerical variables of user’s profiles and their mean and
median (p < 0.001) (bold numbers are over 0.5) ................................................................................. 36
Table 11. Behavioural differences between men (n=669) and women (n=3461) in two profiles and two
types of directions ................................................................................................................................ 40
Table 12. The percentages of men and women in Age direction in the modified profile between the last
input and the first input ........................................................................................................................ 40
Table 13. The percentages of men and women in Height direction in the initial profile between the last
input and the first input ........................................................................................................................ 41
Table 14. The percentages of men and women in Weight direction in the modified profile between the last
input and the first input ........................................................................................................................ 41
Table 15. The percentages of people who have previous children and not in Weight directions in the
initial profile ........................................................................................................................................ 41
Table 16. The percentages of people who having previous children and not in Weight directions in the
modified profile ................................................................................................................................... 41

8
List of Abbreviations
BMI Body mass index
HCT Healthy Conception Tool
HISB Health Information-Seeking Behaviour
ID Identification/Identity/Identifier
MAC Mean Age at Childbearing
PC Principal Component
PCA Principal Component Analysis
PCOS Polycystic ovary syndrome
RRI Robinson Research Institute
STI Sexually transmitted infections
VARTA The Victorian AssistedReproductive Treatment Authority
VAS Visual analog scale

9
1. Introduction
1.1 Motivation
The Internet is becoming more and more popular for providing health information and access to health
care (Hinchliffe and Mummery, 2008). In fact, information retrieved from the Internet is the most
commonly referenced source of patients before consulting with clinicians (Rew et al., 2018). To improve
fertility awareness, the “Your Fertility” website has been developed since 2011 by The Fertility
Coalition with the fund from the Australian Government (The Fertility Coalition, 2012b). Besides other
interactive tools such as ovulation calculator, animations, quiz, etc., the Healthy Conception Tool (HCT)
is published in 2016 on the website to promote the modifiable factors that can reduce the possibility of
having a baby (Raymond J. Rodgers et al., 2020). The tool provides information about these factors
through the interactive questions and captures the data inputted by users for analysis and development
(Raymond J. Rodgers et al., 2020).
However, there are certain barriers in IT systems to meet user’s demands (Kerr et al., 2009) while the
user’s behaviours on fertility websites are limited in the previous studies. Various papers were
conducted to find the user’s behavioural patterns in the online health platforms, but the majority of them
just focus on completely or partially offline behaviours (Guillory et al., 2014, Wall, 2007, Bujnowska-
Fedak and Węgierek, 2020, Van Dijk et al., 2016, van Woerden et al., 2014, Bauerle Bass, 2003,
Anderson, 2018, Graffigna et al., 2017, Mills and Todorova, 2016, Spoelman et al., 2016). In the number
of studies analysing online user’s data, most of them analysed to predict the general trends or figures
(Ojala et al., 2017, Rampazzo et al., 2018) and to portrait user’s profile or preferences (Starling et al.,
2018, Raymond J. Rodgers et al., 2020), not to analyse the user’s behaviours to understand their implicit
needs.
Moreover, understanding user’s behaviours can assist website operators to improve a user’s experience
by designing the website based on user’s expectations and preferences as well as providing better
performance, personalized features, or more precisely targeted marketing campaigns (Wang et al.,
2016). Notably, one of the causes that lead to project failures is user’s dissatisfaction (Anthopoulos et
al., 2016, Pinto and Mantel, 1990, Imamoglu and Gozlu, 2008).
Meanwhile, there is no existing research in the Your Fertility program related to online user’s
behaviours, except the analysis of user’s demographics and characteristics (Raymond J. Rodgers et al.,
2020). Therefore, exploring behavioural patterns on the “Your Fertility” website is a currently active
research domain, which can be the initial reference for further research and website development to
succeed in meeting user’s expectations.

10
1.2. Research Questions
The research topic is conducted with the purpose of exploring the interactive data from the “Your
Fertility” website and its potential findings on understanding users as well as improving the user’s
website experience. The dataset with a great number of variables is very large, which is complex to
comprehensively analyse to figure out all potential behavioural patterns. In the scope of an 18-unit thesis
undertaken by one student, the paper focuses on answering the following questions:
- Is there any significant relationship between user’s behaviours and user’s health profiles in the
“Your Fertility” website’s context?
- What are these relationships?
1.3. Research Objectives
The main aim of the paper is to improve the health website quality for a better user experience by
finding behavioural patterns of visitors to “Your Fertility” website by statistical techniques. These
findings can also optimise the website design, especially the HCT not only to increase user’s
satisfaction but also to reduce the potential factors of data quality. Also, marketing and
communication strategies can be beneficial because of the findings of user’s preferences and
behaviours. It is also hoped that the research will aid the development of measurable metrics for the
healthcare professional to understand the concerns and needs of the relevant population based on data
provided by visitors to the website.
1.4. Structure
The research report is divided into the following sections.
1. Introduction
The section provides the context and motivation for conducting the topic and the main research
questions and primary goals. The structure of the paper is also provided in the section.
2. Literature review
The introduction about the “Your Fertility” website and the Healthy Conception Tool (HCT) is
mentioned in the section. Additionally, the section provides the importance of understanding user’s
interaction in online health sites through its benefits and applications. Also, literature on current research
of user’s behaviours on healthcare websites in general and on fertility websites, in particular, will be
discussed. The limitation and recommendation from the previous research papers will be concluded to
explain why the topic should be chosen.

11
3. Data Description
The section will give a brief introduction about how the dataset is collected. It provides the classification
of data in two phases of the analysis including pair-variable analysis and group-variable analysis as well
as and summary of data description in each stage.
4. Methodology
The analytical design and statistical methods applied in the analysis will be discussed in the section.
The flowcharts are illustrated for visualisation of the analysing process. Also, a brief explanation for
each technique is also mentioned.
5. Analysis and Results
The results from undertaking the analysis will be illustrated in this section. Following is the explanation
and interpretation of the results.
6. Discussion and Future Work
The section concludes key findings from the analysis with explanation by literature review. The
suggested application and recommended approaches for future studies are mentioned.

12
2. Background Study and Research
2.1 Introduction of “Your Fertility” website and Healthy Conception Tool (HCT)
Your Fertility program established in 2011 is a government-funded fertility health promotion program
with the purpose of awareness improvement related to fertility-affected factors that can assist people to
make the best possible decisions regarding childbearing (Hammarberg et al., 2017a). The program is
developed by the Fertility Coalition which is a partnership between, the Robinson Research Institute
(RRI) at the University of Adelaide, Healthy Male, Monash University, and Jean Hailes for Women’s
Health (The Fertility Coalition, 2012b).
Due to the impact of the Internet on Health Information-Seeking Behaviour (HISB) (Diaz et al., 2002),
as a part of Your Fertility program, Fertility Coalition built a website (www.Your Fertility.org.au) in
2012 for evidence-based information and resources related to fertility health education (Hammarberg
et al., 2017a). The “Your Fertility” website is mobile-friendly with up-to-date information focusing on
common factors that affect fertility and reproductive outcomes (Hammarberg et al., 2017a). For 5
years from its public launch, the website attracted over 10 million web page views and more than 5
million users (Hammarberg et al., 2017a).
Besides other interactive tools such as ovulation calculator, animations, quiz, etc., in 2016, the Healthy
Conception Tool (HCT) is published on the website to promote the modifiable factors that can reduce
the possibility of having a baby (Raymond J. Rodgers et al., 2020). The tool provides information about
these factors through the interactive questions and captures the data inputted by users for analysis and
development (Raymond J. Rodgers et al., 2020).
The HCT’s questions are arranged in two pages. Page 1 has 5 questions including genders, age, weight,
height, alcohol consumption, cigarette consumption while Page 2 has questions related to contraceptive
intention, trying months, children, STI test, menstrual cycle regularity, frequency and timing of
intercourse. The list of questions has changed for website update to provide the latest and useful
information. For each answer, the HCT displays the basic recommendations and color degree in
response to the user’s inputs (i.e., green colour means positive effects or red colour means negative
effects on fertility). The recommendation for each answer is the basic facts based on the evidence. After
answering all questions, the user can select the ‘View Summary’ button to view a summary of all
answers and the facts for each question.

13
2.2. The importance of understanding online user’s interactive behaviours
The Internet is becoming more and more popular for providing health information and access to health
care (Hinchliffe and Mummery, 2008). Health care’s intensive information can be collected, processed
and accessed online without barriers of the offline world (Helen et al., 2012). In fact, information
retrieved from the Internet is the most common use of online medical information technologies (Rew et
al., 2018). Moreover, the Internet of Things (IoT) has a significant impact on the way of data collection
and analysis (Zou et al., 2020).
The user’s interactive data on the website can provide user’s insights and their needs (Zou et al., 2020),
even their implicit behaviours and approaches (White et al., 2002). Understanding user’s behaviours
can improve user’s experience by delivering personalised features, better targeted marketing campaigns,
and higher performance (Wang et al., 2016). The purpose of user’s analysis is to design a website for
user’s diverse needs, preferences and behaviours (Pang et al., 2016). Lacking adequate user’s insight
analysis can lead to project failures because of not meeting user’s expectation (Anthopoulos et al., 2016,
Pinto and Mantel, 1990, Imamoglu and Gozlu, 2008).
User’s expectations and preferences role an important play in their feeling about the trustworthiness of
the health websites. In an experiment among 15 women in England, many participants ignored high-
quality content websites simply on the poor design and trusted fewer websites because of their
preferences (Sillence et al., 2007). Another similar finding is found in the study by Marin and Marin
(1990), in which identity preferences are highlighted as a motivation for users to trust those websites
because of the self-verification theory (Swann Jr and Read, 1981). It means a number of medically
credible websites can be rejected because users cannot find their social identity in the content of those
sites.
However, user’s interactive behaviours in online healthcare platforms are underestimated. In developing
public health websites, according to an Australian survey by Kerr et al. (2009), several health websites
seem to be developed without enough attention to the growing needs of end-users. Similar findings were
reported by Hinchliffe and Mummery (2008) and White and Raman (1999), in which, many
organisations pay little attention to evaluations when implementing a website. The reason is that
understanding user’s behaviour is not easy and the process can be taken significant time and costs (Wang
et al., 2016). Remarkably, user’s expectations can differ for each feature, such as providing particular
feedbacks for recommendations, or accuracy for forecast functions (Su et al., 2020). By pilot survey
among 1,000 women with either currently using fertility apps or future intention, Starling et al. (2018)
noticed the user’s demand for science-based content and personalized information under their
circumstances while most of the participants are not satisfied with their used apps. Moreover, in the
quality evaluation by Huang et al. (2005) among 266 fertility websites, they generally have low quality

14
scores in all three sections: ownership, content and website navigation. These results raise the
importance of evaluation about the expectations and satistication of current users who are using the
health care platforms.
When more and more users demand interactive tools instead of traditional information format (Helen et
al., 2012), not many healthcare websites collect behavioural and contextual data because they mainly
focus on delivering healthcare information for a large number of users more than increasing the existing
user’s experience on sites (Zou et al., 2020). These types of mentioned data are vital for developing
machine learning technologies, which can offer personalised features and behavioural predictions to
increase user’s engagements and experience (Goldenberg et al., 2021).
2.3. Review on user’s behaviour in online health education platforms
Despite the large number of research related to behaviours in online environments, the studies on user’s
behavioural analysis in online healthcare platforms are limited, especially in fertility health education
websites.
Many studies identified the relationship between offline factors and online health platform’s behaviours.
For example, Guillory et al. (2014) examine the impact of marital status and social support on HISB
among 1,329 pregnant women by logistic regression models. They concluded that women with less
social support may seek less healthcare information than women who already had social support. In the
studies by Bauerle Bass (2003), Anderson (2018), Graffigna et al. (2017), and Mills and Todorova
(2016), other factors affecting patient’s HISB are listed including, but not limited to, user’s self-efficacy,
behavior, health status, knowledge, attitude, offline healthcare, and severity of an illness. Furthermore,
the role of health promotion websites in user’s health behaviours and decisions is significant in the
studies by Wall (2007), Bujnowska-Fedak and Węgierek (2020), Van Dijk et al. (2016), and van
Woerden et al. (2014). Additionally, the effectiveness of healthcare websites in offline healthcare usage
and healthcare costs is investigated by interrupted time series analysis by Spoelman et al. (2016).
The analysis of online user’s behaviours in healthcare channels mainly gives attention to user’s
behaviours on general health areas or suggestions for specific groups of the population. One of the
studies analysing the online user behaviours within a health education website is presented by Pang et
al. (2016). They analysed the navigation flows of users in the Better Health Channel
(http://www.betterhealth.vic.gov.au) to figure out the HISB from user’s journey. Their findings show
that users tend to explore more topics of health information instead of one single topic. Their
recommendation is that the health education website should develop interactive tools to satisfy user’s
needs and HISB.

15
Studies by Nguyen et al. (2020) and Nguyen et al. (2018) using the data on health-related websites found
that if users can adjust the mode of information’s presentation to be suitable for their preferences,
characteristics, beliefs, etc., it will lead to the better user’s satisfaction and increasing health information
recall ability. The results can be applied in a new development process, but they cannot find the
challenges or barriers of users in the current website.
The comprehensive analysis by Watfern et al. (2019) for health platform’s design and implementation
figured out the list of factors affecting user’s engagement in the Healthy Mind website based on user’s
surveys. The findings can be useful to find out the website’s problems and revised suggestions. The
limitation of the study is that the health websites providing e-mental information assist people with
intellectual disability, so their behaviours and insights may be different to the general population who
would like to seek for fertility-related information.
A website evaluation research conducted by Ownby and Czaja (2003) presents the overview of design
challenges in healthcare website for the elderly. These challenges are visual, motor and cognitive. They
concluded that the poor design of websites can be difficult for users and decrease their ability to receive
health information. Usability guidelines are provided for website designers to improve user’s usability.
Although the research’s participants are people who are above 50 years old, the research’s conclusion
may open a potential domain to figure out if the younger people have any challenges related to usability
in healthcare websites.
In the fertility field, the volume of studies is inadequate while most of them use online data to analyse
for the general prediction or to portrait user’s profile and preferences. For instance, Ojala et al. (2017)
developed predictive models with 75% of the variance relating fertility for regional variation and trends
by combined data from Google Correlate and Google Trends as well as identified the social status based
on user’s search keywords. Although the dataset of the study is standard and general without sub-groups,
the findings still open further directions for analysis with online user’s interactive data. A similar method
is applied in the study by Rampazzo et al. (2018) when they built a simple regression model to estimate
the Mean Age at Childbearing (MAC) for countries having no fertility data by finding a strong
relationship between MAC based on Facebook and on traditional data using data from Facebook’s
Advertising Platform. To define the user’s demographics and characteristics, Raymond J. Rodgers et al.
(2020) use the interactive data in HCT of the “Your Fertility” website to validate the target audience.
The engaged users are 84% of women while the target audience is equally direct to men and women.
Giving the fact that men’s fertility knowledge often less than women’s (Daniluk and Koert, 2013), the
communication campaigns of the website can deliver strategies for more concentration on targeting
men.

16
Finally, the Your Fertility program conducted several research projects including fertility-related
factor’s awareness (Hammarberg et al., 2013), fertility knowledge and HISB in the general population
(Hammarberg et al., 2017b), the HISB of healthcare nurses (Hammarberg et al., 2016), and user’s
demographics and characteristics from data of HCT in the “Your Fertility” website (Raymond J.
Rodgers et al., 2020) but there is no research in online user’s behaviours or interaction. Therefore,
exploring user’s behaviours in an online fertility education platform in general, and the “Your Fertility”
website in particular, is an open research domain not only to identify the user’s behavioural patterns but
also, to find insights related to user’s challenges, barriers or issues when they interact with an interactive
tool like the HCT.

17
3. Data description
3.1. Data collection
Data used in this paper is collected from 12th June to 31st August 2018 by HTC which is an interactive
tool on the “Your Fertility” website. The dataset is non-identifiable and stored in software developed by
goAct (http://goact.co/). To derive metrics, Piwik Analytics Platform software (https://matomo.org/)
integrated with Your Fertility website was used. The privacy statement is available in the Appendix.
The HCT is an interactive tool with several questions about fertility-related factors such as age, weight,
height, smoking, alcohol consumption, conceptive intention, trying months, etc. Due to regular version
updates, since 2018, the list of questions in the HCT in June 2021 has changed. In particular, the
questions related to conceptive intention and contraception are removed to replace by other modifiable
factors’ questions including folic acid and iodine, physical activity, chemical exposure, and medication.
Because the previous user’s interface in 2018 was not available, Figure 1 and Figure 2 are the latest
user’s interface in June 2021.
Figure 1. The questions in Page 1 in the HCT (Fertility Coalition, 2012)

18
Figure 2. The questions in Page 2 in the HCT (Fertility Coalition, 2012)
During the data period, 19,277 users visited the HCT while 22% of them interacted with the tool. Of the
viewers, 12.5% entered the HTC directly while the rest came from other pages of the “Your Fertility”
website. Although the “Your Fertility” website is originated in Australia, the country that has the highest
percentage of users is the United States of America (38%). The following countries are Australia (21%),
the United Kingdom (10%), Indian (6%), Canada (5%) and others (2%). Clearly, the majority of
countries are from English-speaking countries.

19
3.2. Original data
The original dataset records all changes of inputs from 4245 users in the interactive tool on the “Your
Fertility” website. The original dataset has 20 variables described in Table 1. The provided data is by
date, which means that one day has one separated file contained a list of users and their changes in the
HCT.
Variable name Description Type of input Type of data
1 Visitor ID The unique code generated by the system for each
user visited the website Unique code N/A
2 Gender The state of being male or female of the user. The
user selects the gender on the top of the tool. “Women” or “Men” Categorical
3 Step
The page at the user’s input. The user has to answer
the age, height, and weight questions to move to the
next page (the second page). The total pages of the
tool are 2.
“1” or “2” Categorical
4 Timestamp The time at the user’s input. The system will
automatically record the time of the user’s inputs. Unix timestamps N/A
5 Age The age of the user. The user input by either the
slider scale or input text box
Number with the
range of 0-45 for
women and 0-60
for men
Numerical
6 Height The height of the user. The user input by either the
slider scale or input text box
Number with the
range of 0-210 Numerical
7 Weight The weight of the user. The user input by either the
slider scale or input text box
Number with the
range of 0-150 Numerical
8 BMI The user’s BMI calculated by the system. -- Numerical
9 Smoking The number of cigarettes per day. The user input by
either the slider scale or input text box
Number with the
range of 0-20 Numerical
10 Alcohol
The number of standard drinks per week (Drinkwise
Australia, 2021). The user input by either the slider
scale or input text box
Number with the
range of 0-20 Numerical
11 Trying Conceive Intention for trying to conceive “Yes” or “No” Categorical
12 Trying Month
The number of months that the user tries to
conceive. The user input by either the slider scale
(range: 0-20) or input text box
Number Numerical
13 Previous Children The situation of having children “Yes” or “No” Categorical
14 STI Tested The situation of the test for Sexually transmitted
infections (STI) “Yes” or “No” Categorical
15 STI Positive The result of the STI Test “Yes” or “No” Categorical
16 Menstrual
Information
The question is “Are you having fewer than 9
periods per year or menstrual cycles longer than 35
days?”
“Yes” or “No” Categorical
17 Sex Frequency
The number of sex frequency per month. The user
input by either the slider scale (range: 0-20) or input
text box
Number Numerical
18 Sex Right Time Having sex at the right time of the month (the fertile
window)
“Yes” or “No” or
“Unsure” Categorical
19 Contraception Using the contraception method “Yes” or “No” Categorical
20 Medical
Conditions
The user can tick multiple options: cancer, diabetes,
endometriosis, Polycystic ovary syndrome (PCOS),
and other
Name of conditions Categorical
Table 1. The description of attributes in the original dataset

20
Table 2. A dataset of one visitor ID that captures all the changes of the user’s input.
A dataset of one visitor ID that captures all the changes of the user’s input is illustrated in Table 2. In
other words, every time the user makes a change using a control on the web page, it is recorded in the
data set. For example, in line 6, the user changed their value for Trying Months from 0 to 24, and in
line 7, she changed it from 24 to 4.
The challenges of the original dataset are mentioned below:
1. The gender selection on the website may have been difficult for users to notice and is disable
when being on page 2 of the Tool. Therefore, the default gender as “Women” affected the
user’s changes.
2. BMI calculated by the system is not accurate because of the system delays.
3. Smoking and Alcohol Consumption is default 0 from the beginning even the user does not
slide or input.
4. Trying Months and Sex Frequency is default 0 when the user moves to page 2 even if the user
does not slide or input.
5. No users answer the question of “Medical Conditional” so there is no data in the attribute.
6. Because each row captured a new change of users, each row is unique with its time of changes.
However, there are many duplicated rows when joining datasets of all days from 12th June to
31st August 2018 together. After investigation, the reason is that certain datasets by date
included a few of users and their changes, who were from the previous day because they made
changes at 12 AM or they returned tomorrow. The system captured all changes of visitors until
12 AM of that day but if their last change was made the next day, the system would export the
user’s changes from the first change in the previous day to the last change in the current day.
3.3. Data for pair-variable analysis
After the duplicate removal, the data has 4,130 people with 3461 women (83.8%) and 669 men
(16.2%). Then, the data was removed from the “0” default value and 2 attributes including BMI and

21
Medical Condition. A reason for BMI removal is because of system inaccurate calculation while no
user answered the Medical Condition question (the attribute with no data).
For the user’s profile, because of the large change frequency from the user’s inputs, it is hard to
conclude which input is to represent on behalf of users. Thus, the paper extracted the first user’s input
value of each attribute as the initial profile and the last user’s input value of each attribute as the
modified profile. The pair-variable analysis is applied for both profiles to figure out which profile has
more meaningful information.
The process of feature engineering is applied to create the user’s behavioural patterns. Hence, the
dataset is expanded into 119 variables (excluding visitor ID) with two profiles: the initial profile and
the modified profile. Table 3 shows the summary of the expanded dataset while Figure 3 illustrates
the hierarchy visualisation of data division. Also, the detail of behavioural patterns is described in
Table 4.
Type of variables Sub-classification Types of data
Independent (32) Users’ input (16 variables per profile) Numerical (14) /
Categorical (18)
Dependent (87)
Mean, median, number of changes and time spent for each input (45) Numerical (45)
Value differences and directions (42) Numerical (14) /
Categorical (28) Table 3. The summary of the expanded dataset
Figure 3. The hierarchy visualisation of data division
The behavioural group The behavioural pattern Type of data
General
(45 patterns)
Page Change: Number of page changes Numerical
Steps: The total frequency of changes made by users Numerical
Duration (milliseconds): Total user’s time spent Numerical
Completion (%): The rate of the user completing the tool
based on the number of completed questions Numerical

22
The change frequency for each attribute Numerical
The mean value for each numerical attribute Numerical
The median value for each numerical attribute Numerical
The time spent on each question Numerical
Differences
(14 patterns)
The difference between the second input’s value and the first
input’s value Numerical
The difference between the last input’s value and the first
input’s value Numerical
Directions
(28 patterns)
The change direction between the second input’s value and
the first input’s value for each attribute Categorical
The change direction between the last input’s value and the
first input’s value for each attribute Categorical
Table 4. The data classification of behavioural patterns
In the analysis between categorial variables and numerical variables, the one-hot encoding (also called
dummy coding) to transform the categorial variables with more than 2 values into numerical variable
based on the value of categorial. For example, Sex Right Time with 3 values including “Yes”, “No”,
and “Unsure”, after one-hot encoding, the variable will be transformed into 3 variables: Sex Right
Time with the answer “Yes”, Sex Right Time with the answer “No”, and Sex Right Time with the
answer “Unsure”. Each variable has two values: 0 means No and 1 means Yes. As result, 29
categorical variables with more than 3 values are transformed into 87 binary variables, which leads to
177 variables in total.
3.4. Data for group-variable analysis
From the result of pair-variable analysis, only the modified profile is applied in the group-variable
analysis. To ensure the variable’s independence in clustering, the behavioural patterns exclude the mean
and median of numerical attributes (14 variables). The group-variable analysis just works well with
numerical variables, so 177 variables after one-hot coding are applied in the group-variable analysis.
Because of the large number of variables, the dataset is divided into 5 groups (Table 5) when selecting
variables into Principal Component Analysis (PCA) in order to limit the number of components and
easily detect the clustering.
Type of variables Description
1 Original attributes (16) Users’ input
2 General features (31) Number of changes and time spent for each input
3 Difference (14) Two types of value differences: (1) between the second input
and the first input, and (2) the last input and the first input
4 Change directions between the second
input and the first input (42)
Three types of change directions: Positive (input’s value increase
for numerical variables or from No/Unsure to Yes for categorical
variables), No change (the difference of value is 0), and

23
Negative (input’s value decrease variables or from Yes to
No/Unsure Yes/No for categorical variables)
5 Change directions between the last input
and the first input (42)
Three types of change directions: Positive (input’s value increase
for numerical variables or from No/Unsure to Yes for categorical
variables), No change (the difference of value is 0), and
Negative (input’s value decrease variables or from Yes to
No/Unsure Yes/No for categorical variables)
Table 5. The description of 5 data groups after feature engineering

24
4. Methodology
The general process for data analysis is shown in Figure 4 as following steps.
- Data cleaning: The process of fixing and removing inaccurate, duplicate, wrong format data
within the provided dataset.
o Removing duplicates: identify and remove 115 duplicate rows of data in 4245 (2.7%)
to maintain the data quality.
o Removing the default value “0”: Smoking, Alcohol Consumption, Sex Frequency and
Trying Month attributes have the default value of 0, which affects the count of the
user’s change frequency. Thus, the default value of 0 is removed and the dataset is
counted the first changed value as the first input of the user.
o Format conversion: The timestamp in the original data is in Unix time format which is
represented as an integer. It is necessary for Unix time conversion to the readable
date/time format.
- Feature engineering: The process of transforming raw data into new features to represent the
behavioural patterns of users. In this process, 87 behavioural patterns are extracted from the
original attributes.
Figure 4. The general process for data analysis
- Data analysis: the process of discovering meaningful information or useful findings to answer
the research questions. The process includes two separate sub-phases: pair-variable analysis
and group-variable analysis.
Because of the unclear and unspecific requirements and expectation from project owners, the three
processes are in an iterative circle, in which one process can support other processes during the data
exploration to take advantage of what was learned in the previous stages.
All processes are used by Python programming language on Google Collaboratory (a Python
development environment that runs in the browser using Google Cloud) with Python libraries. For
data cleaning and feature engineering, the Python libraries include Pandas for data structures and
25
operations; and NumPy for n-dimensional arrays. The data analysis process requires more Python
libraries including Pandas, Seaborn, Matplotlib, Scipy, and Scikit Learn.
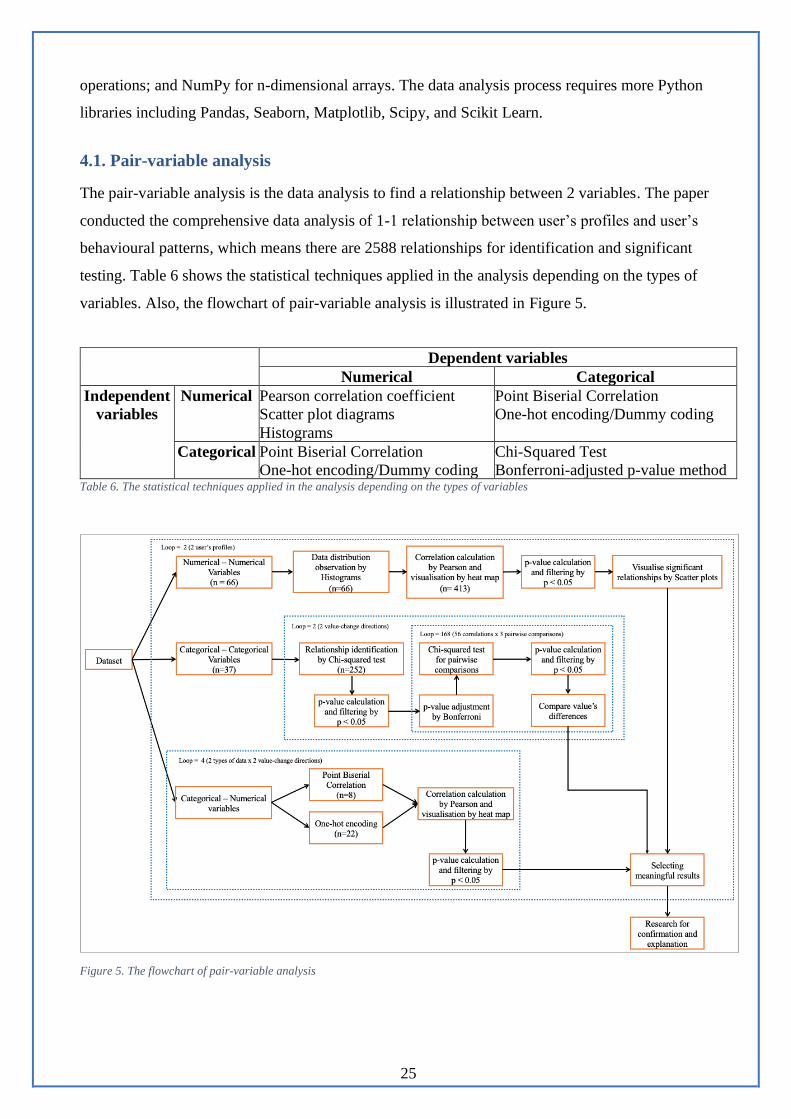
4.1. Pair-variable analysis
The pair-variable analysis is the data analysis to find a relationship between 2 variables. The paper
conducted the comprehensive data analysis of 1-1 relationship between user’s profiles and user’s
behavioural patterns, which means there are 2588 relationships for identification and significant
testing. Table 6 shows the statistical techniques applied in the analysis depending on the types of
variables. Also, the flowchart of pair-variable analysis is illustrated in Figure 5.
Dependent variables
Numerical Categorical
Independent
variables
Numerical Pearson correlation coefficient
Scatter plot diagrams
Histograms
Point Biserial Correlation
One-hot encoding/Dummy coding
Categorical Point Biserial Correlation
One-hot encoding/Dummy coding
Chi-Squared Test
Bonferroni-adjusted p-value method Table 6. The statistical techniques applied in the analysis depending on the types of variables
Figure 5. The flowchart of pair-variable analysis
26
The brief introduction and application of statistical techniques are described below:
- Pearson correlation coefficient: it is a standard method for measuring the correlation and
linear dependence between paired-data variables, which are numerical variables (Pearson,
1895). The value is ranged from -1 to +1, where ±1 means the strongest linear relationship, and
0 means no linear relationship (Pearson, 1895). The statistically significant value used in the
paper is less than 0.05 (p ≤ 0.05). The correlation coefficient values are illustrated in the heat
map as a visually appealing way.
- Scatter plot diagram: the representation of data points for two numerical variables. The
diagrams are used as the following steps after correlation calculation for observing the data
trend (close or far to the trend line) between 2 variables.
- Histograms: the display of data distribution by its occurrences/frequencies for each bin. The
histograms are used as supportive information to compare between two profiles (Figure 17 and
Figure 18).
- Point Biserial Correlation: a technique for correlation calculation for categorical variables
with only two values (i.e., Yes/No). The categorical values can be assigned to numerical
values. In the paper, “Yes” is transformed into “1”, and “No” is transformed into “0”. After
transformation, the Pearson technique can be applied to find the relationships between paired-
data variables.
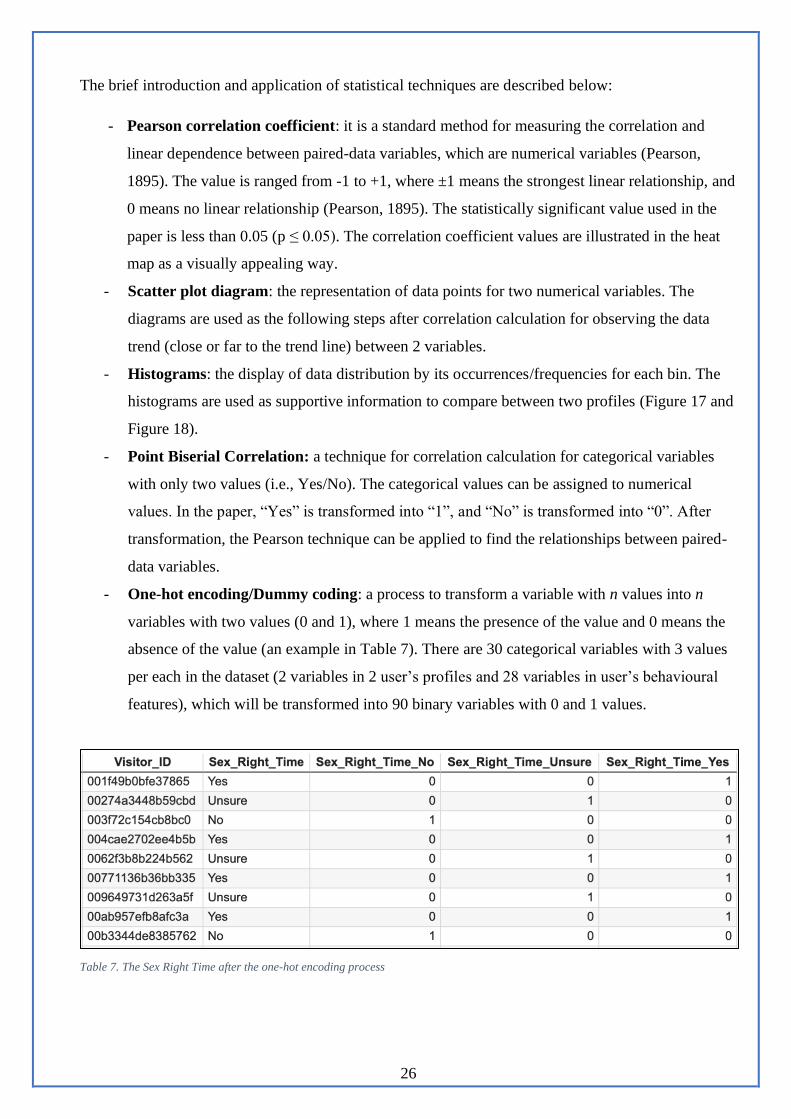
- One-hot encoding/Dummy coding: a process to transform a variable with n values into n
variables with two values (0 and 1), where 1 means the presence of the value and 0 means the
absence of the value (an example in Table 7). There are 30 categorical variables with 3 values
per each in the dataset (2 variables in 2 user’s profiles and 28 variables in user’s behavioural
features), which will be transformed into 90 binary variables with 0 and 1 values.
Table 7. The Sex Right Time after the one-hot encoding process
27
- Chi-Squared Test: a statistical hypothesis test for categorical variables to see their
dependence by converting categorical variables into a frequency table. The significant
relationship between variables in the Chi-squared test should meet three conditions: the Chi-
squared value over the critical value for the Chi-squared statistic by degrees of freedom, all
expected frequencies over 5 and p-value below 0.05. The Chi-squared tests applied two times
in the pair-variable analysis: (1) between two categorical variables to find the significant
relationship with original p-value 0.05; (2) between values across two identified variables with
Bonferroni-adjusted p-value 0.017.
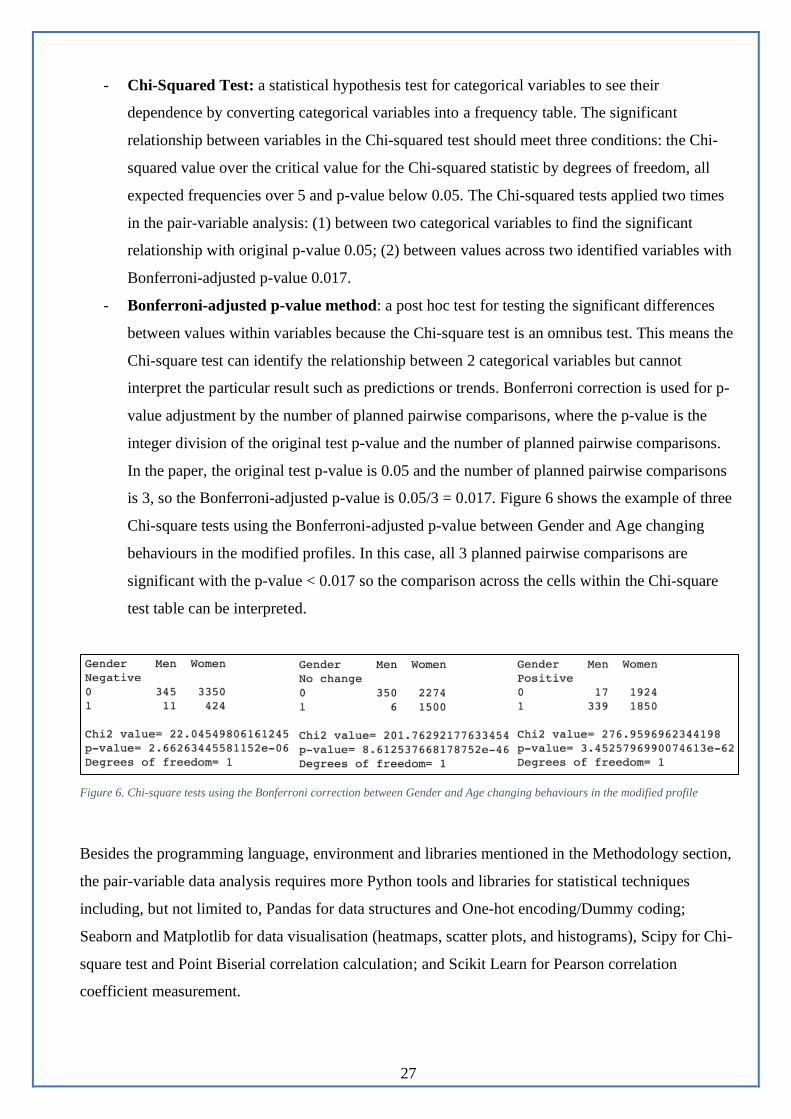
- Bonferroni-adjusted p-value method: a post hoc test for testing the significant differences
between values within variables because the Chi-square test is an omnibus test. This means the
Chi-square test can identify the relationship between 2 categorical variables but cannot
interpret the particular result such as predictions or trends. Bonferroni correction is used for p-
value adjustment by the number of planned pairwise comparisons, where the p-value is the
integer division of the original test p-value and the number of planned pairwise comparisons.
In the paper, the original test p-value is 0.05 and the number of planned pairwise comparisons
is 3, so the Bonferroni-adjusted p-value is 0.05/3 = 0.017. Figure 6 shows the example of three
Chi-square tests using the Bonferroni-adjusted p-value between Gender and Age changing
behaviours in the modified profiles. In this case, all 3 planned pairwise comparisons are
significant with the p-value < 0.017 so the comparison across the cells within the Chi-square
test table can be interpreted.
Figure 6. Chi-square tests using the Bonferroni correction between Gender and Age changing behaviours in the modified profile
Besides the programming language, environment and libraries mentioned in the Methodology section,
the pair-variable data analysis requires more Python tools and libraries for statistical techniques
including, but not limited to, Pandas for data structures and One-hot encoding/Dummy coding;
Seaborn and Matplotlib for data visualisation (heatmaps, scatter plots, and histograms), Scipy for Chi-
square test and Point Biserial correlation calculation; and Scikit Learn for Pearson correlation
coefficient measurement.

28
4.2. Group-variable analysis
The group-variable analysis is the data analysis for finding a relationship between more than 2
variables using clustering methods. The main methods are used for group-variable analysis in the
paper are PCA, K-means and Pearson correlation coefficient. The process of the group-variable
analysis is described in Figure 7.
Figure 7. The flowchart of the group-variable analysis
The description of each task as following:
- Feature selection: To ensure the variable’s independence in clustering, the behavioural
patterns exclude the mean and median of numerical attributes (14 variables).
- One-hot encoding: a process to transform a variable with n values into n variable with two
values (0 and 1), where 1 means the presence of the value and 0 means the absence of the
value. The PCA just works well with numerical variables, so 177 variables after one-hot
coding are applied in the group-variable analysis.
- Data scaling: The variables have a different range of measure, so the data needs to be scaled
into the same unit length.
- Target selection: The chosen target variable is Completion (%) to figure out the impact of the
empty data (incompleted questions) on the dataset.
- Data selection: Due to a large number of variables, the dataset is divided into 5 groups when
inputting into PCA in order to limit the number of components and easily detect the clustering.
- Feature extraction using PCA: The result from the PCA with Completion (%) is that there is
a difference between below 50% completion rate and over 50% completion rate (Figure 8),
which may be because the blank data should be replaced by the mean of each variable. To
ensure the data quality, the dataset with a completion rate below 50% is removed in the group-
variable analysis. The PCA runs with the loop of 15 times including 3 scenarios (1 with the
target variable and 2 without the target variable: all dataset and dataset with a Completion rate
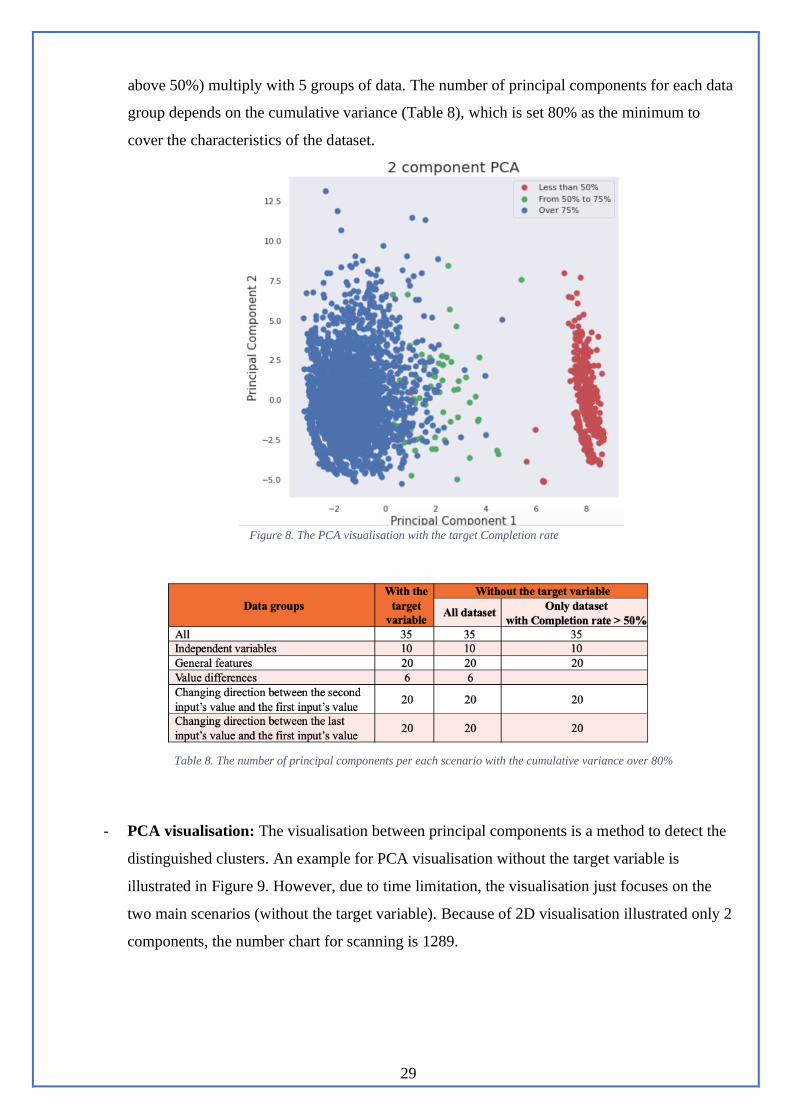
29
above 50%) multiply with 5 groups of data. The number of principal components for each data
group depends on the cumulative variance (Table 8), which is set 80% as the minimum to
cover the characteristics of the dataset.
Figure 8. The PCA visualisation with the target Completion rate
Table 8. The number of principal components per each scenario with the cumulative variance over 80%
- PCA visualisation: The visualisation between principal components is a method to detect the
distinguished clusters. An example for PCA visualisation without the target variable is
illustrated in Figure 9. However, due to time limitation, the visualisation just focuses on the
two main scenarios (without the target variable). Because of 2D visualisation illustrated only 2
components, the number chart for scanning is 1289.

30
Figure 9. An example for PCA visualisation without the target variable.
- Cluster detection: From PCA visualisation (1289) charts, the task is to manually examine and
observe to find if there are separated clusters. In the paper, two examples among several
clustering charts are shown to discuss.
- Data assignment by K-means: Using the K-means algorithm is to extract the clusters as
separated datasets. In other words, K-means are used to assign single data points into the
nearest cluster’s centroid and label them (Figure 10).
Figure 10. Data allocation by K-means with centroids after training the model
- Finding relationship by Pearson: After cluster extraction by K-means model, the average
value between two variables is calculated, which is compared with the inserted variables of
PCA by Pearson correlation coefficient to find the characteristics of each cluster.

31
The group-variable data analysis uses Python libraries including, but not limited to, Pandas for data
structures, operations and One-hot encoding/Dummy coding; Seaborn and Matplotlib for data
visualisation; Scikit Learn for PCA, K-means, and Pearson correlation coefficient.

32
5. Results and Analysis
5.1. Pair-variable analysis’s results
The paper conducted the comprehensive data analysis of 1-1 relationship between user’s profiles and
user’s behavioural patterns, which means there are 2588 relationships between 1-1 variables and 666
times of planned pairwise comparisons (3 planned pairwise comparisons for each of 222 significant
relationships after Chi-squared test) for identification and significant testing. After analysis with
significant tests and post hoc tests, 58 significant relationships are identified, then, 31 meaningful
relationships are pointed out and described in the paper. Table 9 shows the detail of the relationship’
number in each stage of the pair-variable analysis.
The
analysis
stage
Total a
pair of
variables
Number of
insignificant
relationships (p≥0.05)
Number of
significant
relationships (p<0.05)
Number of
meaningful
relationships
Description
Numerical
vs
Numerical
826 800
(-0.5<r<0.5) 26
(r<-0.5 or r>0.5)
22 (exclude dependent
relationships, i.e., value
differences and user’s
initial inputs)
- 14 for the user’s modified
profile and its Mean/Median
- 8 for the user’s initial
profile and its Mean/Median
Categorical
vs
Numerical
1314 1295
(-0.5<r<0.5) 19
(r<-0.5 or r>0.5)
1 (exclude dependent
relationships, i.e., page
and page changes; or
value directions and
user’s input value)
1 for STI testing and
Completion Rate
Categorical
vs
Categorical
448 226
- 222 after Chi-
squared test
- 13 after Bonferroni
correction post hoc
test and have
different trends
8 (exclude relationships
with small differences)
- 4 for gender and Age
directions in 2 profiles
- 1 for gender and Height
directions
- 1 for gender and Weight
directions - 2 for Children status and
Weight directions Table 9. The number of relationships in pair-variable analysis
5.1.1. The modified profile and the initial profile
Figure 11 and Figure 12 are heat maps based on the correlation coefficient value between 2 variables
in the initial profile and the modified profile. From the heat maps, there are significant relationships
between variables and their Mean or Median. Therefore, Table 10 compares between two types of
profiles, which indicates that the modified profile has a greater number of relationships than the initial

33
profile, especially the relationships between the modified profile and all variables’ mean and median
have a very strong positive correlation (0.93 ≤ r ≤ 1) with p-value < 0.001.
In detail, the scatter plots for Smoking (Figure 13), Alcohol Consumption (Figure 14), Trying Month
(Figure 15), and Sex Frequency (Figure 16) are illustrated. Even the initial profile has a strong
relationship between those variables and their Mean or Median (0.58 ≤ r ≤ 0.91), the graphs are
observed that many value dots are disjointed while the scatter plots of the modified profile are
displayed most dots near the 45-degree line, where the value and its Mean/Median are equal.
As the result, while Smoking, Alcohol Consumption, Trying Month, and Sex Frequency histograms
have the nearly same shape in both profiles, Age, Height, and Weight histograms between profiles are
observed the different shapes (Figure 17 and Figure 18). As can be seen, the modified profile’s
histograms have data distribution more normal than the initial profile.

34
Figure 11. Correlation coefficient between features and user’s initial health profile (the first value)

35
Figure 12. Correlation coefficient between features and user’s modified health profile (the last value)

36
A pair of variables
Correlation coefficient
The initial profile The modified profile
Age - Age Mean 0.44 0.96
Age - Age Median 0.32 0.96
Height - Height Mean 0.37 0.94
Height - Height Median 0.25 0.94
Weight - Weight Mean 0.33 0.93
Weight - Weight Median 0.23 0.94
Smoking - Smoking Mean 0.7 0.95
Smoking - Smoking Median 0.59 0.95
Alcohol Consumption - Alcohol Consumption Mean 0.68 0.95
Alcohol Consumption - Alcohol Consumption Median 0.58 0.96
Trying Month - Trying Month Mean 0.91 1
Trying Month - Trying Month Median 0.88 1
Sex Frequency - Sex Frequency Mean 0.88 0.97
Sex Frequency - Sex Frequency Median 0.82 0.98
Table 10. The list of correlations between numerical variables of user’s profiles and their mean and median (p < 0.001) (bold numbers
are over 0.5)
Figure 13. The scatter plots of Smoking and its Mean-Median between the initial profile and the modified profile

37
Figure 14. The scatter plots of Alcohol Consumption and its Mean-Median between the initial profile and the modified profile
Figure 15. The scatter plots of Trying Month and its Mean-Median between the initial profile and the modified profile

38
Figure 16. The scatter plots of Sex Frequency and its Mean-Median between the initial profile and the modified profile
Figure 17. The histogram charts for 7 numerical variables of the initial profile

39
Figure 18. The histogram charts for 7 numerical variables of the modified profile
5.1.2. Behavioral differences between men and women
In the analysis between categorical variables, gender is a variable that has the largest number of
relationships in both profiles. The results are demonstrated the gender differences in two profiles and
two types of directions in Table 11.
For the pair of Gender and Age direction, in the initial profile, the analysis indicates that gender affects
the volume of proportion but has no impact in behavioural directions while in the modified profile, the
behaviours between women and men are different in both quantity and directions. From a case of Gender
and Age direction in the modified profile between the last input and the first input (Table 12), more men
decrease their age value than women while women tend to increase or keep the same value.
For the pair of Gender and Height direction, there is a gender difference in only the initial profile
between the last input and the first input (Table 13), which found that the highest proportion (44.4%) of
men has the height value decrease while the highest proportion (53.4%) of women has the height value
increase.
For the pair of Gender and Weight direction, men tend to increase their weight value while women tend
to decrease their weight value (Table 14). All correlations between two variables have the p-value <

40
0.05 and the significant differences in 3 planned pairwise comparisons, which are comparisons in each
value of categorical variables, have the p-value less than 0.05/3 = 0.017.
Profile The initial profile The modified profile
The
direction
between
The second input
and the first input
The last input and
the first input
The second input
and the first input
The last input and
the first input
Gender -
Age
direction
The percentage of
men who increase
their age’s value
(95.2%) is higher than women’s
(49%).
The percentage of
men who increase
their age’s value
(96.6%) is higher than women’s
(51.9%).
More percentage of
men increases and
decreases their age
(64.4% and 33.9%, respectively) while
women tend to
increase and keep
the same age value
(50.8% and 43.2%,
respectively)
More percentage of
men increases and
decreases their age
(77% and 21.4%, respectively) while
women tend to
increase and keep
the same age value
(51.6% and 43.2%,
respectively)
Gender -
Height
Direction
Only ⅔ planned
pairwise
comparisons are
significant but there
is no gender
difference.
The highest
proportion (44.4%)
of men has the
height value
decrease while the
highest proportion
(53.4%) of women
has the height value
increase.
Only ⅔ planned
pairwise
comparisons are
significant but there
is no gender
difference.
All 3 planned
pairwise
comparisons are
significant but no
gender difference.
Gender -
Weight
direction
Only ⅔ planned
pairwise
comparisons are
significant but there
is no gender
difference.
Only ⅔ planned
pairwise
comparisons are
significant but there
is no gender
difference.
Only 1 3⁄ planned
pairwise
comparisons are
significant but there
is no gender
difference.
The majority of
men increases their
weight (60.2%)
while the highest
proportion of
women decreases
their weight
(55.4%)
Table 11. Behavioural differences between men (n=669) and women (n=3461) in two profiles and two types of directions
Table 12. The percentages of men and women in Age direction in the
modified profile between the last input and the first input

41
Table 13. The percentages of men and women in Height direction in
the initial profile between the last input and the first input
Table 14. The percentages of men and women in Weight direction in
the modified profile between the last input and the first input
5.1.3. Previous Children and Weight change behaviour
Similarly, Weight change direction is different between people who have previous children and those
who have no children. Specifically, having-children people (n=1138) tend to increase their weight value
while weight value decrease is the behaviour of people having no children (n=2363). The finding is
consistent among two profiles with two ways of directions (the second input or the last input compared
to the first input of the user). Table 15 and Table 16 show that the nearly same proportion between two
profiles for each direction and a few people (3.1%-3.7%) tends to decrease their weight value during
the second input and the last input.
Table 15. The percentages of people who have previous children and not in Weight directions in the
initial profile
Table 16. The percentages of people who having previous children and not in Weight directions in the
modified profile
5.1.4. STI Test and Completion (%)
In the analysis between categorical variables in the modified profile and numerical behavioural patterns,
there is a strong positive relationship between STI Test and Completion (%) with r = 0.61 and p < 0.001

42
described in Figure 19. In other words, people who already tested STIs (Sexually transmitted infections)
tend to complete more questions than people who did not test STI. However, there is no strong
relationship between variables in the initial profile and no linear relationship between the STI test with
the positive results and the rate of completion.
Figure 19. The small set of heat map for correlations between the categorical
variables in the modified profile and numerical behavioural patterns
5.2. Group-variable analysis results
Using the PCA for dimension reduction, the analysis identifies that there are several clusters based on
principal component (PC) visualisation. With the time constraint, the paper just illustrated two examples
of clustering after scanning 1289 charts. The variables inputted in the PCA of examples are the original
variables (user’s inputs) with the completion rate above 50%.
In the first example of PC6 and PC9 (Figure 20), Cluster 2 has a stronger negative correlation with
Height (r=-0.31, p=0.02) and a more significant positive correlation with Smoking (r=0.74, p<0.001)
than Cluster 1 (Figure 21).

43
Figure 20. The PCA visualisation of PC6 and PC9 with K-
means for assigning data to clusters
Figure 21. The correlation coefficient between Clusters and the inputted variables in PC6 and PC9.
In the second example of PC7 and PC8 (Figure 22), Cluster 1 has more significant positive correlations
with STI Test (r=0.72, p<0.001), and with Sex Right Time with the answer “Yes” (r=0.32, p=0.02), as
well as has a stronger negative correlation with Sex Right Time with the answer “Unsure” (r=-0.4,
p=0.008) than Cluster 2 (Figure 23).
Figure 22. The PCA visualisation of PC7 and PC8 with K-
means for assigning data to clusters

44
Figure 23. The correlation coefficient between Clusters and the inputted variables in PC7 and PC8

45
6. Discussion and future work
Understanding user’s behaviours can improve a user’s experience by providing better performance,
personalized features, or more precise targeted marketing campaigns (Wang et al., 2016). While lacks
of user satisfaction can lead to project’s failures (Pinto and Mantel, 1990), many fertility platforms fail
to meet user’s satisfaction (Starling et al., 2018). Thus, the paper is to analyse the data captured by the
HCT on the “Your Fertility” website with the aim of understanding user’s behaviours, exploring
user’s insights and identifing user’s barriers when using an interactive tool. The key findings of the
analysis show the differences between user’s initial profile and modified profile, and the significant
differences in behaviours between men and women related to age and weight directions, between
people having children and no children, and between people having STI (Sexually transmitted
infections) test and not. Also, Principal Component Analysis and K-means clustering are applied to
figure out the user’s behaviours in groups.
In detail, the result indicated that the last inputs of users may have a more informative value than the
first answer of users because the modified profile has a greater number of relationships/correlations
than the initial profile. Especially, the relationships between the modified profile and all variables’
mean and median have a very strong positive correlation (0.93 ≤ r ≤ 1) with the p-value < 0.001. The
finding is supported by scatter plots and histograms between two profiles. The finding can be
explained by the linear slider scale disadvantage. Even if there is a traditional text box at the end of the
slider scale, human’s reading behaviour is from left to right (Holmqvist and Wartenberg, 2005). The
linear slider or slider scale, which is a visual analog scale (VAS) that requires users to drag the slider
and move to the desired numeric point, is used on the HCT for all numerical inputs (Figure 24). While
the slider scale can increase user’s engagement (Stanley and Jenkins, 2007, Sikkel et al., 2014), it may
reduce data quality and accuracy (Derham, 2011, Couper et al., 2006) and response time because it is
not as easy to understand as the traditional format (Stanley and Jenkins, 2007, Sikkel et al., 2014,
Couper et al., 2006). Moreover, the slider scale’s quality depends on the device users used, i.e., mouse
or touch screen (Roster et al., 2015, Chyung et al., 2018, Buskirk, 2015). The slider scale is usually
used for the rating question with no more than 11 values (Chyung et al., 2018) but evaluations for
other questions are scarce. A comparison between slider scale and other input formats by Buskirk
(2015) shows more disadvantages than advantages for using slider scale. The suggestion is that a
user’s survey or an evaluation can be conducted to validate the finding in order to improve user’s
experience and increase data quality.

46
Figure 24. The linear slider format is used on the website for numerical answers
Another finding in the analysis is that there are differences between women and men in two profiles and
two types of directions. For the pair of Gender and Age direction, in the initial profile, the analysis
indicates that genders affect the volume of proportion but have no impact in behavioural directions while
in the modified profile, the behaviours between women and men are different in both quantity and
directions, which shows that men tend to increase and decrease their age value while women tend to
increase or keep the same their age value. For the pair of Gender and Weight direction, men tend to
increase their weight value while women tend to decrease their weight value. Similarly, Weight change
direction is different between people who have previous children and those who have no children.
Specifically, having-children people tend to increase their weight value while weight value decrease is
the behaviour of people having no children. The findings can suggest personalised features such as value
recommended, adjustable range of slider scale, or false answer detection based on their behaviours.
The relationship between the STI test and completion rate is an interesting finding of the paper. The
analysis presents that people who already tested STIs (Sexually transmitted infections) tend to complete
more questions than people who did not test STI. It may be because people who already tested STI have
more reproductive health than the rest, so they have the higher motivation to answer the relevant
questions. While infertility is a strong motivation for STI testing (Denison et al., 2017) because STIs
can cause infertility (Deyhoul et al., 2017), the relationship between STI testing and fertility awareness
or information-seeking behaviours is a potential area for research.
Using the PCA for dimension reduction, the analysis combined groups of variables identifies several
clusters based on principal component (PC) visualisation with the completion rate above 50%. Due to
the time constraint, the paper just illustrates two examples of clustering after scanning 1289 charts.
These findings can inspire further personalised functions for different user’s groups or the development
of machine learning models to detect the groups of correlated variables.
The limitations of the paper should be mentioned and discussed for further research. Firstly, the data
were collected only from the HCT on the “Your Fertility” website, so the user’s behaviours on the

47
other websites can be varied. The default value in certain attributes of the original dataset also may
affect the results. The dataset was collected in 2018 and a few questions in the HCT are changed,
which can lead to the different user’s behavioural patterns. Because of time constraint, the analysis
just shows the results in data exploration without evaluation and sets aside compounding variables
such as the user’s activities before and after entering the HCT or the context of users (i.e., the
operating system, browsers, date and time, countries, etc.). The groups of data in the group-variable
analysis are not comprehensive to identify the relationships between user’s profiles and user’s
behavioural patterns. Further data collection groups based on user’s origins, countries, or religions
may provide further interesting insights based on data segmentation.

48
References
Anderson, A. 2018. Online health information and public knowledge, attitudes, and behaviours
regarding antibiotics in the UK: Multiple regression analysis of Wellcome Monitor and
Eurobarometer Data. PloS one, 13, e0204878.
Anthopoulos, L., Reddick, C. G., Giannakidou, I. & Mavridis, N. 2016. Why e-government projects
fail? An analysis of the Healthcare. gov website. Government Information Quarterly, 33, 161-173.
Bauerle Bass, S. 2003. How will Internet Use Affect the Patient? A Review of Computer Network and
Closed Internet-based System Studies and the Implications in Understanding How the Use of the
Internet Affects Patient Populations. J Health Psychol, 8, 25-38.
Bujnowska-Fedak, M. M. & Węgierek, P. 2020. The impact of online health information on patient
health behaviours and making decisions concerning health. International journal of environmental
research and public health, 17, 880.
Buskirk, T. D. 2015. Are sliders too slick for surveys? An experiment comparing slider and radio
button scales for smartphone, tablet and computer based surveys. methods, data, analyses, 9, 32.
Chyung, S. Y., Swanson, I., Roberts, K. & Hankinson, A. 2018. Evidence‐based survey design: The
use of continuous rating scales in surveys. Performance Improvement, 57, 38-48.
Couper, M., Tourangeau, R., Conrad, F. & Singer, E. 2006. Evaluating the Effectiveness of Visual
Analog Scales: A Web Experiment. Social Science Computer Review - SOC SCI COMPUT REV,
24, 227-245.
Daniluk, J. C. & Koert, E. 2013. The other side of the fertility coin: a comparison of childless men’s
and women’s knowledge of fertility and assisted reproductive technology. Fertility and sterility, 99,
839-846.
Denison, H. J., Bromhead, C., Grainger, R., Dennison, E. M. & Jutel, A. 2017. Barriers to sexually
transmitted infection testing in New Zealand: a qualitative study. Australian and New Zealand
journal of public health, 41, 432-437.
Derham, P. A. 2011. Using preferred, understood or effective scales? How scale presentations effect
online survey data collection. Australasian Journal of Market & Social Research, 19.
Deyhoul, N., Mohamaddoost, T. & Hosseini, M. 2017. Infertility-related risk factors: a systematic
review. Int J Womens Health Reprod Sci, 5, 24-29.
Diaz, J. A., Griffith, R. A., Ng, J. J., Reinert, S. E., Friedmann, P. D. & Moulton, A. W. 2002. Patients'
use of the Internet for medical information. Journal of general internal medicine, 17, 180-185.
Drinkwise Australia. 2021. Available: https://drinkwise.org.au/standard-drinks-calculator/# [Accessed
19/4/2021].

49
Goldenberg, D., Kofman, K., Albert, J., Mizrachi, S., Horowitz, A. & Teinemaa, I. Personalization in
Practice: Methods and Applications. Proceedings of the 14th ACM International Conference on
Web Search and Data Mining, 2021. 1123-1126.
Graffigna, G., Barello, S., Bonanomi, A. & Riva, G. 2017. Factors affecting patients’ online health
information-seeking behaviours: The role of the Patient Health Engagement (PHE) Model. Patient
Education and Counseling, 100, 1918-1927.
Guillory, J., Niederdeppe, J., Kim, H., Pollak, J., Graham, M., Olson, C. & Gay, G. 2014. Does social
support predict pregnant mothers’ information seeking behaviors on an educational website?
Maternal and child health journal, 18, 2218-2225.
Hammarberg, K., Collison, L., Nguyen, H. & Fisher, J. 2016. Knowledge, attitudes and practices
relating to fertility among nurses working in primary health care. Australian Journal of Advanced
Nursing, The, 34, 6-13.
Hammarberg, K., Norman, R. J., Robertson, S., Mclachlan, R., Michelmore, J. & Johnson, L. 2017a.
Development of a health promotion programme to improve awareness of factors that affect fertility,
and evaluation of its reach in the first 5 years. Reproductive Biomedicine & Society Online, 4, 33-
40.
Hammarberg, K., Zosel, R., Comoy, C., Robertson, S., Holden, C., Deeks, M. & Johnson, L. 2017b.
Fertility-related knowledge and information-seeking behaviour among people of reproductive age:
a qualitative study. Human Fertility, 20, 88-95.
Hammarberg, K. P. D., Setter, T. M. P. H., Norman, R. J. M. D., Holden, C. a. P. D., Michelmore, J.
D. E. & Johnson, L. D. E. 2013. Knowledge about factors that influence fertility among Australians
of reproductive age: a population-based survey. Fertil Steril, 99, 502-507.
Helen, H., Joseph, M. & Sumayya, B. 2012. Australian Online Public Information Systems:An
Evaluative Study of an Evolving Public Health Website. AJIS. Australasian journal of information
systems, 17.
Hinchliffe, A. & Mummery, W. 2008. Applying Usability Testing Techniques to Improve a Health
Promotion Website. Health Promotion Journal of Australia: Official Journal of Australian
Association of Health Promotion Professionals, 19, 29-35.
Holmqvist, K. & Wartenberg, C. 2005. The role of local design factors for newspaper reading
behaviour–an eye-tracking perspective. Lund University Cognitive Studies, 127, 1-21.
Huang, J. Y., Discepola, F., Al-Fozan, H. & Tulandi, T. 2005. Quality of fertility clinic websites.
Fertility and sterility, 83, 538-544.
Imamoglu, O. & Gozlu, S. The sources of success and failure of information technology projects:
Project managers’ perspective. PICMET'08-2008 Portland International Conference on
Management of Engineering & Technology, 2008. IEEE, 1430-1435.

50
Kerr, D. V., Bryant, K. & Tsai, N. 2009. A Survey of Current e-Business (E-Government). AJIS.
Australasian journal of information systems, 15.
Marin, G. & Marin, B. V. 1990. Perceived credibility of channels and sources of AIDS information
among Hispanics. AIDS education and prevention: official publication of the International Society
for AIDS Education, 2, 154-161.
Mills, A. & Todorova, N. 2016. An integrated perspective on factors influencing online health-
information seeking behaviours.
Nguyen, M. H., Bol, N. & Lustria, M. L. A. 2020. Perceived Active Control over Online Health
Information: Underlying Mechanisms of Mode Tailoring Effects on Website Attitude and
Information Recall. Journal of health communication, 25, 271-282.
Nguyen, M. H., Smets, E. M., Bol, N., Loos, E. F. & Van Weert, J. C. 2018. How tailoring the mode
of information presentation influences younger and older adults’ satisfaction with health websites.
Journal of health communication, 23, 170-180.
Ojala, J., Zagheni, E., Billari, F. & Weber, I. Fertility and its meaning: Evidence from search behavior.
Proceedings of the International AAAI Conference on Web and Social Media, 2017.
Ownby, R. L. & Czaja, S. J. Healthcare website design for the elderly: improving usability. AMIA
Annual Symposium Proceedings, 2003. American Medical Informatics Association, 960.
Pang, P. C.-I., Harrop, M., Verspoor, K., Pearce, J. & Chang, S. What are health website visitors
doing: insights from visualisations towards exploratory search. Proceedings of the 28th Australian
Conference on Computer-Human Interaction, 2016. 631-633.
Pearson, K. 1895. Note on Regression and Inheritance in the Case of Two Parents. Proceedings of the
Royal Society of London, 58, 240-242.
Pinto, J. K. & Mantel, S. J. 1990. The causes of project failure. IEEE transactions on engineering
management, 37, 269-276.
Rampazzo, F., Zagheni, E., Weber, I., Testa, M. R. & Billari, F. Mater certa est, pater numquam: what
can Facebook advertising data tell us about male fertility rates? Proceedings of the International
AAAI Conference on Web and Social Media, 2018.
Raymond J. Rodgers, Heidi Long, Michael J. Davies, Nicole O. Mcpherson, Louise Johnson, Renee
D. De Silva, Karin Hammarberg, Sarah A. Robertson & Bidargaddi, N. 2020. Development of a
web-based preconception health-optimisation tool and characteristics of its users. Human
Reproduction.
Rew, L., Saenz, A. & Walker, L. 2018. A systematic method for reviewing and analysing health
information on consumer‐oriented websites. Journal of Advanced Nursing, 74, 2218-2226.
Roster, C. A., Lucianetti, L. & Albaum, G. 2015. Exploring slider vs. categorical response formats in
web-based surveys. Journal of Research Practice, 11, D1-D1.
51
Sikkel, D., Steenbergen, R. & Gras, S. 2014. Clicking vs. Dragging: Different Uses of the Mouse and
Their Implications for Online Surveys. Public Opinion Quarterly, 78, 177-190.
Sillence, E., Briggs, P., Harris, P. R. & Fishwick, L. 2007. How do patients evaluate and make use of
online health information? Social Science & Medicine, 64, 1853-1862.
Spoelman, W. A., Bonten, T. N., De Waal, M. W., Drenthen, T., Smeele, I. J., Nielen, M. M. &
Chavannes, N. H. 2016. Effect of an evidence-based website on healthcare usage: an interrupted
time-series study. BMJ open, 6, e013166.
Stanley, N. & Jenkins, S. Watch what I do: Using graphical input controls in Web surveys.
Challanges of a changing world. Proceedings of the Fifth International Conference of the
Association for Survey Computing, 2007. 81-92.
Starling, M. S., Kandel, Z., Haile, L. & Simmons, R. G. 2018. User profile and preferences in fertility
apps for preventing pregnancy: an exploratory pilot study. Mhealth, 4.
Su, Z., Figueiredo, M. C., Jo, J., Zheng, K. & Chen, Y. Analyzing Description, User Understanding
and Expectations of AI in Mobile Health Applications. AMIA Annual Symposium Proceedings,
2020. American Medical Informatics Association, 1170.
Swann Jr, W. B. & Read, S. J. 1981. Self-verification processes: How we sustain our self-conceptions.
Journal of Experimental Social Psychology, 17, 351-372.
The Fertility Coalition. 2012a. Privacy statement [Online]. Available:
https://www.yourfertility.org.au/privacy-statement [Accessed 14/12/2020].
The Fertility Coalition. 2012b. Your Fertility [Online]. Melbourne, VIC (Australia): The Fertility
Coalition (AU). Available: https://www.yourfertility.org.au/ [Accessed 9/9/2020].
Van Dijk, M. R., Huijgen, N. A., Willemsen, S. P., Laven, J. S., Steegers, E. A. & Steegers-
Theunissen, R. P. 2016. Impact of an mHealth platform for pregnancy on nutrition and lifestyle of
the reproductive population: a survey. JMIR mHealth and uHealth, 4, e53.
Van Woerden, H. C., Ashton, K., Garlick, C., Hurley, A., Cooper, A., Willson, A., Henry, R.,
Kiparoglou, V. & Potter, C. 2014. Evaluation of a web based tool to improve health behaviours in
healthcare staff. International archives of medicine, 7, 1-9.
Wall, A. F. 2007. Evaluating a health education website: The case of AlcoholEdu. NASPA journal, 44,
692-714.
Wang, G., Zhang, X., Tang, S., Zheng, H. & Zhao, B. Y. Unsupervised clickstream clustering for user
behavior analysis. Proceedings of the 2016 CHI conference on human factors in computing
systems, 2016. 225-236.
Watfern, C., Heck, C., Rule, C., Baldwin, P. & Boydell, K. M. 2019. Feasibility and acceptability of a
mental health website for adults with an intellectual disability: qualitative evaluation. JMIR mental
health, 6, e12958.

52
White, C. & Raman, N. 1999. The World Wide Web as a public relations medium: the use of research,
planning, and evaluation in web site development. Public Relations Review, 25, 405-419.
White, R. W., Ruthven, I. & Jose, J. M. The use of implicit evidence for relevance feedback in web
retrieval. European Conference on Information Retrieval, 2002. Springer, 93-109.
Zou, N., Liang, S. & He, D. 2020. Issues and challenges of user and data interaction in healthcare-
related IoT. Library Hi Tech.

53
Appendix
The privacy statement of Your Fertility web site says ‘The Fertility Coalition also collects data
through Google Analytics and/or Piwik Analytics designed to track the number of unique users, time
and date of visits to the site and behaviour of users on the website, such as page visited, clicks and
referral sources. The information collected by Google Analytics and/or Piwik Open Analytics does not
identify a user. This information is used for statistical purposes and to ensure our web site is providing
information relevant to our users. The Fertility Coalition may distribute aggregated statistical
information for statutory reporting purposes, but only in a form that will not identify any person
individually’. (The Fertility Coalition, 2012a)