Embed Size (px)
Citation preview

Journal of Finance and Accountancy Volume 19, March 2015
Explorations of inward, page 1
Explorations of inward Foreign Direct Investment:
U.S. and China comparative analysis
Jason Williams Embry-Riddle Aeronautical University
Xuezhi Zhang
Embry-Riddle Aeronautical University ABSTRACT
In recent decades, the majority of countries in the world have experienced substantial
growth in their economies, with a larger portion from the accelerated growth in international business, especially in foreign direct investment (FDI). FDI is a key indicator in global economic prosperity and productivity. FDI encourages technology innovation, job creation, capital transfer, and optimum distribution of resources between countries. FDI has become a quantifiable benchmark for international business and the impacts it has on both the host and investing countries.
The United States and China, according to A.T. Kearney FDI index, are ranked as the top two in the world for attracting foreign investment as of 2014. Historically, the United States has an “open economy” market and low barriers to attract foreign investment. For China, the largest foreign recipient country among developing countries, FDI has become an important factor in their economic growth.
The primary purpose of this research was to discover, explore and address the role of FDI in the two economic giants of the world: the United States and China. This research includes the following characteristics of inward US and China foreign direct investment: FDI flows and stock, FDI stock as a percentage of GDP, FDI employment, FDI financial flows, and sectorial distribution of FDI. Using statistical data from 2000 to 2013, an examination was conducted on the effects of inward FDI. Findings are displayed in the forms of graphs and tables to help analyze the tendency, significance and distribution of inward FDI. Keywords: Inward FDI Stock, Inward FDI Flows, FDI Stock as percentage of GDP Copyright statement: Authors retain the copyright to the manuscripts published in AABRI journals. Please see the AABRI Copyright Policy at http://www.aabri.com/copyright.html

Journal of Finance and Accountancy Volume 19, March 2015
Explorations of inward, page 2
INTRODUCTION
Inward foreign direct investment (IFDI) is a powerful instrument for stimulating economic
growth in the global economy; particularly in developed countries like the United States and developing countries such as China.
The empirical research results indicate the existence of the positive and significant relationship between FDI stock and output growth, additionally, FDI stock in the U.S. economy shows a relatively higher rate of growth in comparison with that of the domestic capital. FDI stock contributes about 23% to GDP growth in comparison with domestic capital contributing 20% (Kornecki and Borodulin, 2011).
Inward FDI contributes significantly to employment in the U.S. economy. Researchers identified a link between job growth in the U.S. economy during a period of increasing foreign direct investment flow (Payne and Yu, 2011).
There is no doubt that foreign direct investment (FDI) is an important factor facilitating the recent wave of globalization. According to the United Nations Conference on Trade and Development (UNCTAD), inward FDI stock in the world rose from US$ 7.5 trillion in 2000 to US$ 22.8 trillion in 2012.
FDI statistical comparability has improved considerably in recent years, but there are cases where data is still difficult to quantify, especially in the case of China where government owned activities report little or no statistics to the outside world. This lack of data is one area that this research attempted to gather and analyze using available sources such as the National Bureau of Statistics of China. The A.T. Kearney FDI index ranks world inward FDI and reveals FDI flows and the factors that drive corporate decisions to invest abroad. The United States and China are the most attractive FDI locations in the world and have achieved unprecedented levels of investors’ confidence. The United States and China are both a strong FDI magnet in the World economy.
The tenacious growth in the level of FDI in recent decades reveal both an upsurge in the size and number FDI transactions occurring. Undoubtedly, FDI is now seen as beneficial and nearly all countries try to provide a welcoming climate for international investors to drive economic productivity and improve competitive positions (OECD). National policy, economic stability, investment climate and positive governance policies have created an effective system that encourages international corporations to invest in the U.S. and China.
FDI financial structure includes: equity capital, reinvested earnings and intercompany debts. However, this research focused on reinvested earnings when looking at the FDI financial structure. Reinvested earnings on direct foreign investment consist of the retained earnings of a direct foreign investment enterprise. As FDI has a significant impact on China and the United States economic growth, research was based on macro-level, generally focusing on inward FDI stock and flows analysis and provides an inside perspective of the FDI trends for the United States and China.
METHODOLOGY AND SIGNIFICANCE
The primary purpose of this research was to investigative the Inward Foreign Direct Investment in the U.S. and China, focusing on the examination of the extent to which foreign capital contributes to the output growth of the U.S. economy in comparison to China.
Data was extracted from the United Nations Conference on Trade and Development
Journal of Finance and Accountancy Volume 19, March 2015
Explorations of inward, page 3
(UNCTAD), Bureau of Economic Analysis (BEA), Bureau of Labor Statistics, World Investment Reports, National Bureau of Statistics of China, as well as other selected databases.
This research analyzed FDI stock as a percentage of real GDP confirming importance of the FDI in the U.S. economy (Table 2). A comparative analysis of U.S. and China have been limited by the availability of comparable statistical data.
There have been a number of recent empirical studies on Foreign Direct Investment and the role that the investments play in host countries. This research has revealed that FDI is an important source of capital and that it is a multiplier for domestic private investments, which contributes to new job creation, technology innovations, and increases the economic activity in host countries (Chowdhury & Mavrotas, 2006).
The United States is a powerful and vital force in the world economy. The United States is rated number one country for investor confidence by the A.T. Kearney Index (Kearney, 2013). Based on the latest report (2014), the United States and China (ranked number one and two in the world respectively) are the strongest in attracting inward FDI in the world (Graph 2).
Inward foreign direct investment (IFDI) plays a very important role in United States, the world’s largest economy, with its stock growing from US$ 2.8 trillion in 2000 to US$ 3.9 trillion in 2012, which represents an increase of approximately 39% in ten years. This shows that the US FDI is growing rapidly and constitutes an investment destination for multinational enterprises (MNEs).
Based on current research, inward US FDI constitutes an important factor contributing to the overall output growth in U.S. economy. According to the United States Bureau of Labor Statistics, the volume of extensive foreign investment in the U.S. economy is correlated to the productivity and growth, signifying a positive relationship between the productivity growth and foreign capital (Kornecki & Borodulin, 2011).
In the long run, FDI creates an essential factor facilitating the economic growth in the U.S. and China contributing to manufacturing and production along with hundreds of thousands of employment opportunities.
China, the world’s largest developing country and one of its fastest growing economies with GDP of US$ 9,240 billion, is the second largest economy in the world. In 2013, China had accumulated an IFDI stock of US$ 957 billion, mainly, because of the initiation of economic reforms and trade liberalization in 1978. It is an open-up policy for foreign investors’ participation. Partly, the amount of FDI inflows dramatically increased due to the early entry of World Trade Organization (WTO) in 2001. The FDI is an important vehicle that drives local enterprise and multinational enterprises’ (MNEs) development, and expands the division of labor and specialization in “host” and “home” economies.
The role of FDI in China’s economy mostly reflects the poverty reduction. Many studies suggest that growth tends to lift the income of the poor proportionally with overall growth (Dollar and Kraay 2001). Given China’s condition in politics, population and economy, FDI has many significant implications in promoting economic growth. Primarily, IFDI helps enhance corporate governance. Secondly, it helps to transform the infrastructure of management and production into eco-friendly industry model. Thirdly, it improves environmental and labor standards. All in all, inward FDI contributes to China’s economic growth through direct effects on productivity, export and technology, positively facilitating economic transition (Zhang, 2006).

Journal of Finance and Accountancy Volume 19, March 2015
Explorations of inward, page 4
RESULTS
Steady growth in the United States has allowed for a steady increase in living standards
for Americans and their Chinese counterparts. The average Gross Domestic Product (GDP) per capita (both in the U.S. and China) has increased significantly over the past decade due to an open economic environment along with the positive business legal structures, foreign policies, and trade agreements that have been created by both sides. In 2000, U.S. households averaged approximately $34,500 per capita increasing to over $53,000 per capita in 2013 (Analysis, 2013). The reader will notice (GDP Graph 3) that the 2008-2009 recession impacted GDP per capita for the first time in a decade in the United States, thus enhancing the multiplier effect that kept the economy stagnated during this timeframe of depression.
If looking at the Chinese GNI per capita (Graph 4) and the Inward Stock (Graph 6), they did not decline but actually increased. Even while the United States was on the edge of a major financial meltdown, the Chinese government continued to pursue other investors from abroad (mostly other Asian Countries) to continue to funnel investments in production their way. This kept China in the World’s number one position for investing during this time frame. Foreign Direct Investment helped spur recovery in the U.S. economy over the years that followed and this trend seems to continue. The United States (GDP Graph 7) displays a fourteen year comparison of “Current” and “Real” 2009 U.S. dollars in billions. This data shows the true value of the dollar as compared to the past few years. Gross Domestic Product in the United States has increased significantly from 2000 to 2013. The recession in 2009 was the only exception in the past fourteen years, as GDP pulled back slightly compared to the prior year. An increase in GDP over time was the trend found for the past decade. This inclining trend can be contributed to the Flows and Stocks that were inward during this time and matching of the data from across other investigated areas such as employment numbers. FDI was found to be significant in the recovery of the U.S. economy along with governmental policies from the Federal Reserve and Congress to keep the economy from completely being in a long and drawn out recession.
Per capita gross domestic product is the primary indicator most commonly used to compare income levels, such as in the United States (Analysis, 2013). There are two additional methods that are preferred by many economic analysts: per capita Net National Income (NNI) and Gross National Income (GNI). “Whereas GDP refers to the income generated by production activities on the economic territory of the country, GNI measures the income generated by the residents of a country, whether earned in the domestic territory or abroad” (OECD, 2014). In China, national income has risen steadily since 2000 (Graph 4), increasing 400% by 2011 (China, 2014). This rapid growth of income has outpaced that of the United States in percentages; however, there is a huge gap in income equality as the GDP Per Capita graphs indicate in USD amounts. The boom in China has been truly spectacular when looking at the numbers. This tremendous growth can be shown not only in the GDP per capita but also by just looking at the manufacturing sector represented by the sectoral graphs in this report. In the FDI Inflow pie chart (Graph 2), the percentages of worldwide FDI inflows by the top ten countries are represented. The United States and China are ranked number one and two respectively, as the largest recipients of Inward FDI (UNCTAD, UNCTAD FDI Flows, 2013). The reader will note that Hong Kong is considered a separate economic zone due to its differing set of rules and civilization for investing than in mainland China. If Hong Kong was combined

Journal of Finance and Accountancy Volume 19, March 2015
Explorations of inward, page 5
with mainland Chinese statistics, then China would be ranked first in the world, overtaking the United States by approximately three percent.
Reinvested earnings from foreign Multinational Corporations (MNC’s) increased steadily over the past few years (Graph 8). Prior to this, one can see from data gathered, that there was a trend to take earnings out of the United States and back to the home country of the investors. Recently, this trend has changed dramatically with companies reinvesting their earnings back into the economy. Factor’s such as tax incentives, economic development zones, better technology and safety of investments in the United States economy, has kept these earnings inside our borders. The effect of these monies being kept in the United States has helped spur employment and other economic activity such as in the financial market sector. This trend correlates to a positive impact and overall better economy inside of the United States. Inward FDI and their Reinvested Earnings have been determined to be significant to U.S. growth since the 2009 recession (Developement, 2013).
Investigation into the China-United States bilateral investment treaty (BIT) negotiations highlight that for a successful transfer of cross-border investments to occur, there needs to be some concessions on both sides. Liberalization of the new Chinese leadership, which took power in 2012, seeks to improve China’s position and legal ramifications and help diminish the differences between China and developed countries such as the United States (Zhang, 2014). Chinese official have recently approved a pilot free trade zone (FTZ) in Shanghai with a list of exceptions that specifically identify the way that foreign and Chinese investors will be treated in that particular zone. The pro-activeness on the side of the Chinese officials indicate that they also recognize the importance of limiting the barriers for investments as the returns from this process outweigh and negative impacts (Zhang, 2014). FDI is reducing the poverty rates in China and allowing its citizens to earn higher incomes and have a better quality of life then previous generations before them have had.
CONCLUSIONS
The empirical research results indicate the actuality of a positive and substantial
correlation between FDI stock and output growth. The research found that FDI stock in the U.S. and Chinese economies shows moderately higher rates of growth in comparison with that of internal domestic capital. Inward foreign direct investments contributed considerably to employment in the U.S. and Chinese economies. Research revealed that FDI supports a hosts of positive benefits not only in the United States but also in China. Most importantly for the United States, the creation high skilled sets of jobs along with technology growth and research and development (R&D). In China, Manufacturing was the biggest sector benefactor of inward FDI. This allowed for Chinese GDP per capita to increase, employment continue to grow, and the rapid development of infrastructures such as housing and transportation in China to expand. Industrial countries are the primary source of IFDI for the U.S. with emerging markets are becoming a larger source each year. This incline should continue as the foreign policies and structural barriers in these markets continue to decline. The inward FDI has increased in past fourteen years to become the most common type of capital flow. It is crucial for the U.S. to continue to attract foreign direct investments and help our economy grow and prosper. Research would suggest that U.S. policy makers formulate strategies that are favorable to encouraging investment in this country the way China is trying to attract FDI with its recent policy changes in FTZ’s. The expansion of the U.S. economy relies on IFDI and capital from abroad to push it

Journal of Finance and Accountancy Volume 19, March 2015
Explorations of inward, page 6
further ahead. This study tested the hypothesis that the Foreign Direct Investment contributes positively to both economies (U.S. and China). Regression modeling and economic theories require further exploration to extrapolate this analysis in more detail while incorporating outflows of stock and flows at the same time. China and the United states will continue to be a major player in global economics and trade. It is important to remain committed to this economic research and forge positive relationships with international partners for both countries to remain the primary leaders of the world economically.
REFERENCES
Advisers, D. o. (2013, October 01). Foreign Direct Investment in the United States. Retrieved
May 15, 2014, from The White House: http://www.whitehouse.gov/sites/default/files/2013fdi_report_-_final_for_web.pdf
Analysis, B. o. (2013). BEA National Economic Accounts. Retrieved June 09, 2014, from U.S. Department of Commerce: http://www.bea.gov/national/index.htm#gdp
Chen, C. (2011). Foreign Direct Investment in China: Location Determinant, Investor
Differences and Economic Impacts. Northamton, MA: Edward Elgar Publishing, Inc. China. (2014). National Bureau of Statistics of China. Retrieved June 02, 2014, from National
Bureau of Statistics of China: http://data.stats.gov.cn/workspace/index;jsessionid=88AB1D5DE2BB73519B004BD76A518054?m=hgnd
Chowdhury, A., & Mavrotas, G. (2006, January). FDI and Growth: What causes what? The
World Economy, 29(1), 9-19. Retrieved June 11, 2014, from http://ssrn.com/abstract=875102 or http://dx.doi.org/10.1111/j.1467-9701.2006.00755.x
Davis, K. (2010). Inward FDI in china and its policy context. (Columbia University), Available from Vale Columbia Center. Retrieved from http://www.vcc.columbia.edu/files/vale/documents/China_IFDI_final_18_Oct_0.pdf
Developement, O. f. (2013). OECD Factbook 2013: Economic, Environmental and Social
Statistics. Retrieved May 20, 2014, from OECD iLibrary: http://www.oecd-ilibrary.org/sites/factbook-2013-en/04/02/01/index.html?itemId=/content/chapter/factbook-2013-34-en
Dollar, D. & Kraay, A. (2001. April). The World Bank Policy Research Working Paper:
Growth is good for the poor. Retrieved November 24, 2014, from http://search.worldbank.org/all?qterm=Growth+is+good+for+the+poor+%2F+David+Dollar+and+Aart+Kraay.
Goss, E., Wingender, J. & Torau, M., “The contribution of foreign capital to U.S. productivity
growth”, The Quarterly Review of Economics and Finance, vol. 7(3) (July 2007), pp. 383-396).
Kearney, A. (2013, June). The 2013 A.T. Kearney Foreign Direct Investment Confidence Index -
Back to Business: Optimism Amid Uncertainty. Retrieved May 23, 2014, from AT Kearney: http://www.atkearney.com/documents/10192/1464437/Back+to+Business+-+Optimism+Amid+Uncertainty+-+FDICI+2013.pdf/96039e18-5d34-49ca-9cec-5c1f27dc099d
Kornecki, L., & Borodulin, V. (2011, Jan). FDI Contributes to Output Growth in the U.S.
Economy. Retrieved Jun 04, 2014, from David Publishing: http://www.davidpublishing.com/show.html?502

Journal of Finance and Accountancy Volume 19, March 2015
Explorations of inward, page 7
Kornecki, L. & Raghawan, S. (2008). The Impact of Inward FDI Stock on GDP Growth: An Empirical Evidence from Central and Eastern Europe. American Journal of Business
Research,1(1). Kornecki, L. & Rhoades, D. L. (2007). How FDI Facilitates the Globalization Process and
Stimulates Economic Growth in CEE. Journal of International Business Research
(JIBR), Allied Academies.vol.3, 29-30. Kornecki L. (2013). Inward FDI in the United States and its Policy Context. Columbia FDI
Profiles. Country profiles of inward and outward foreign direct investment issued by the Vale Columbia Center on Sustainable International Investment. NY. NY. 2013 (http://www.vcc.columbia.edu)
OECD. (2014). Foreign direct investment”, in OECD Factbook 2014: Economic, Environmental
and Social Statistics. OECD Publishing. Retrieved May 19, 2014, from http://www.oecd-ilibrary.org/economics/oecd-factbook_18147364
Pasha, T., & Crabtree, R. (2013, December 31). Foreign Direct Investment in the United States:
Drivers of U.S. Economic Competitveness. Retrieved May 20, 2014, from Select USA: http://selectusa.commerce.gov/sites/selectusa.commerce.gov/files/documents/2014/february/full_report_-_fdi_in_the_united_states.pdf
Payne, D. and Yu, F., “Foreign direct investment in the United States,” Department of Commerce. Economics and Statistics Administration, June 2011, (http://www.esa.doc.gov/sites/default/files/reports/documents/fdiesaissuebriefno2061411final.pdf )
Stiglitz, J. E. (2006). Making Globalization Work. New York: W.W. Norton & Company. UNCTAD. (2014). UNCTAD FDI Flows. Retrieved Jun 03, 2014, from
http://unctad.org/en/Pages/DIAE/Investment%20and%20Enterprise/FDI_Flows.aspx UNCTAD. (2014). UNCTAD FDI Stock. Retrieved Jun 03, 2014, from
http://unctad.org/en/Pages/DIAE/Investment%20and%20Enterprise/FDI_Stocks.aspx Yang, B. (2008). FDI and growth: a varying relationship across regions and over time. Applied
Economics Letters, 15(2), 105. Retrieved from ABI/IN FORM Global database. (Document ID: 1392843081).
Zhang, Kevin H. (2006) The Chinese Economy, vol. 39, no. 3, May–June 2006, pp. 79–90. M.E. Sharpe, Inc.
Zhang, S. (2014, Jan 6). Columbia FDI Perspectives - The China-United States BIT
negotiations: A Chinese perspective. Retrieved from Vale Columbia Center on Sustainable International Investment: www.vcc.columbia.edu/content/fdi-perspectives

Journal of Finance and Accountancy Volume 19, March 2015
Explorations of inward, page 8
TABLES
Table 1: Inward FDI in the World (Top 10 countries 2012)
Source: http://unctad.org/en/Pages/DIAE/FDI%20Statistics/FDI-Statistics.aspx
Table 2: Comparison of FDI stock (US and China) as a percentage of GDP (2012)
Inward FDI stock as a percentage of gross domestic product (2012)
China and United States comparison
China 10.10%
United States 24.20%
Source: http://unctad.org/en/PublicationsLibrary/wir2013_en.pdf
2000 2001 2002 2003 2004 2005 2006 2007 2008 2009 2010 2011 2012
World 7,511 7,556 7,598 9,511 11,233 11,674 14,405 18,038 15,586 18,312 20,380 20,873 22,813
Others 2,597 2,800 3,074 3,885 4,622 4,841 5,936 7,886 7,293 8,730 9,451 9,657 10,433
1. United States 2,783 2,560 2,022 2,455 2,717 2,818 3,293 3,551 2,486 2,995 3,397 3,509 3,932
2. Hong Kong, China 492 462 382 432 492 569 783 1,227 873 994 1,163 1,185 1,422
3. United Kingdom 463 527 549 635 740 851 1,133 1,230 963 1,104 1,163 1,185 1,321
4. France 391 384 441 653 867 889 1,107 1,247 905 1,039 1,054 956 1,095
5. Belgium 230 352 467 378 481 811 854 967 953 993 1,011
6. China 193 203 217 228 245 272 293 327 378 473 588 712 833
7. Germany 272 272 298 395 512 476 591 696 668 701 717 710 716
8. Brazil 122 122 101 133 161 181 221 310 288 401 682 695 702
9. Singapore 111 137 159 181 212 229 298 400 430 408 594 626 682
10. Switzerland 87 89 125 162 198 170 269 353 448 500 618 645 666
4,914 4,756 4,524 5,626 6,611 6,833 8,469 10,152 8,293 9,582 10,929 11,216 12,380
Country Inward FDI Stock 2000-2012 (Billions of US dollars)
Journal of Finance and Accountancy Volume 19, March 2015
Explorations of inward, page 9
GRAPHS
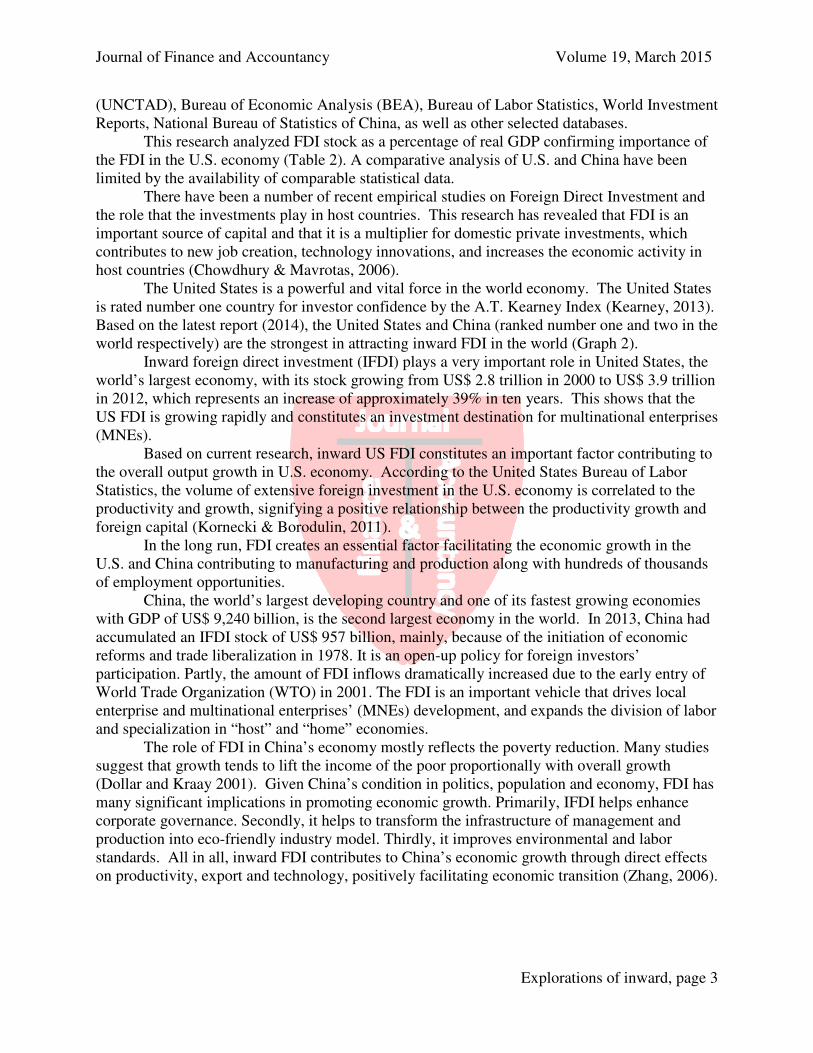
Graph 1: World Inward FDI Stock (Top 10 countries) 2000-2012 Average
Source: http://unctad.org/en/pages/PublicationWebflyer.aspx?publicationid=588

Journal of Finance and Accountancy Volume 19, March 2015
Explorations of inward, page 10
Graph 2: Inward FDI Flow (2012) – Top Ten Countries
Source: (OECD)http://www.oecd-ilibrary.org/economics/oecd-factbook-2013_factbook-2013-en

Journal of Finance and Accountancy Volume 19, March 2015
Explorations of inward, page 11
Graph 3: The U.S. real GDP per Capita
Source: http://www.bea.gov/national/index.htm#gdp Graph 4: China Gross National Income per capita
Source: http://data.stats.gov.cn/english/
Journal of Finance and Accountancy Volume 19, March 2015
Explorations of inward, page 12
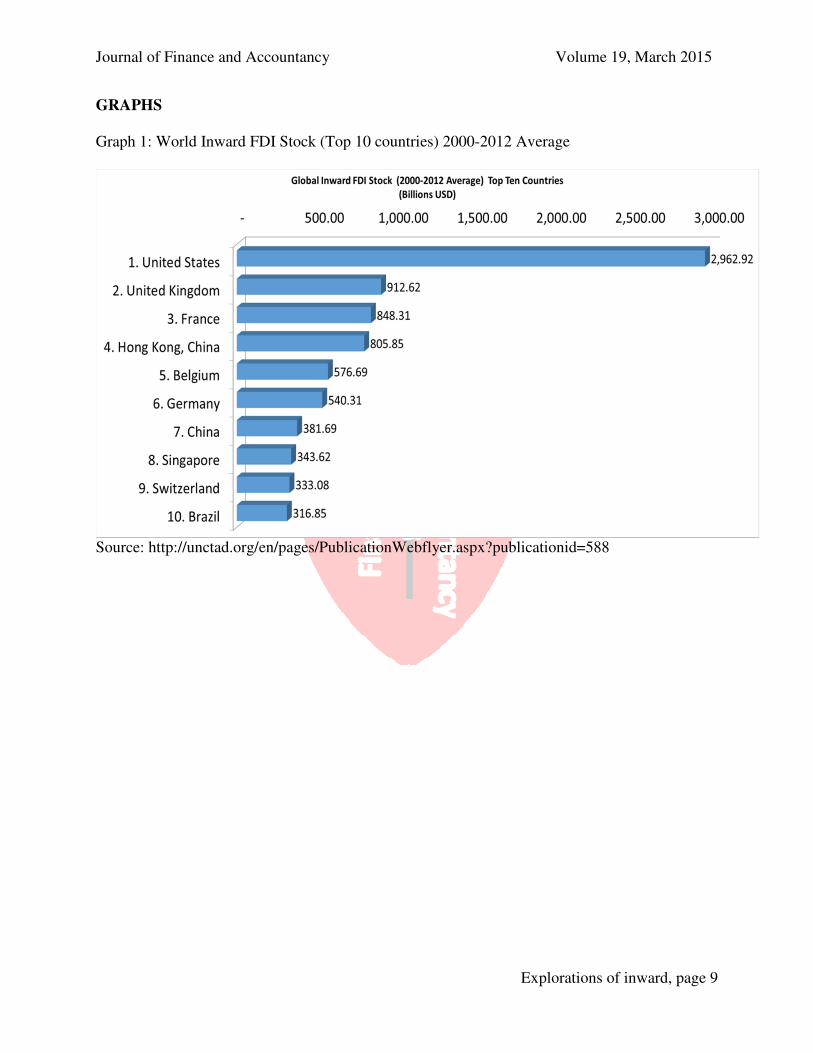
Graph 5: Inward FDI in the U.S. Economy (2010-2012, average)
Source: http://unctad.org/en/pages/PublicationWebflyer.aspx?publicationid=588
Graph 6: FDI stock U.S. and China Comparison
Source: http://unctad.org/en/Pages/DIAE/FDI%20Statistics/FDI-Statistics.aspx
0.00%
2.00%
4.00%
6.00%
8.00%
10.00%
12.00%
14.00%
16.00%
18.00%
FDI in the U.S.
Top Ten Investor Countries, 2010-2012 Average

Journal of Finance and Accountancy Volume 19, March 2015
Explorations of inward, page 13
Graph 7: US GDP (2000-2013) Current and real USD
Source: http://www.bea.gov/national/index.htm#gdp Graph 8: Reinvested earnings
Source:http://www.bea.gov/iTable/iTable.cfm?ReqID=2&step=1#reqid=2&step=7&isuri=1&20
2=1&203=25&204=99&205=1,2&200=2&201=1

Journal of Finance and Accountancy Volume 19, March 2015
Explorations of inward, page 14
Graph 9: Chinese Sectoral Distribution Comparison (2000 & 2008)
Source: www.fdi.gov.cn