Embed Size (px)
Citation preview

EXPLORATION REPORT
ON A
GEOPHYSICAL MAGNETIC SURVEY
AND AN
MMI SOIL GEOCHEMISTRY SURVEY
ON THE
BABS PROPERTY
BABINE LAKE AREA
OMINECA MINING DIVISION, BRITISH COLUMBIA
PROPERTY LOCATION: 63 km northeast of Houston 54°95’ N Latitude, 126° 05’ W Longitude NTS: 93K/13, 93L/16, 93M/01
WRITTEN FOR: KENRICH-ESKAY MINING CORP. C206 – 9801 King George Highway Surrey, B.C. V3T 5H5
WRITTEN BY: David G. Mark, P.Geo. GEOTRONICS CONSULTING INC. 6204 – 125th Street Surrey, British Columbia V3X 2E1
DATED:
May 8th, 2009
TABLE OF CONTENTS
SUMMARY................................................................................................................................ i
CONCLUSIONS ...................................................................................................................... ii
RECOMMENDATIONS ......................................................................................................... iv
INTRODUCTION and GENERAL REMARKS ............................................................................... 1
PROPERTY and ownership ................................................................................................................ 2
LOCATION AND ACCESS ................................................................................................................ 3
PHYSIOGRAPHY and CLIMATE .................................................................................................... 4
PREVIOUS WORK .............................................................................................................................. 4
(a) Minfile Occurrences near the Babs Property ........................................................................................... 8
i. Kare Showing ........................................................................................................................................... 8
ii. Mag Showing ........................................................................................................................................... 9
iii. Trek Showing ........................................................................................................................................... 9
iv. Hag Showing .......................................................................................................................................... 10
v. Mag Showing ......................................................................................................................................... 10
vi. Granisle Past Producer ........................................................................................................................... 11
vii. Bell Past Producer ............................................................................................................................. 12
(b) Aeromagnetic and Regional Geochemistry Surveys ............................... Error! Bookmark not defined.
MMI SOIL SAMPLING .................................................................................................................... 14
(a) Sampling Procedure ............................................................................................................................... 14
(b) Analytical Methods ................................................................................................................................ 14
(c) Compilation of Data ............................................................................................................................... 14
Magnetic Survey ................................................................................................................................. 15
(a) Instrumentation ...................................................................................................................................... 15
(b) Theory .................................................................................................................................................... 15
(c) Survey Procedure ................................................................................................................................... 15
(d) Data Reduction ....................................................................................................................................... 16

Discussion of Results ........................................................................................................................... 16
(a) Geological Mapping ............................................................................................................................... 16
(b) Anomalies .............................................................................................................................................. 17
SELECTED BIBLIOGRAPHY ..............................................................................................20
GEOPHYSICIST’S CERTIFICATE .....................................................................................22
AFFIDAVIT OF EXPENSES ................................................................................................23
APPENDIX –GEOCHEMISTRY DATA ...............................................................................24

LIST OF ILLUSTRATIONS
MAPS – at Back Approximate Scale* Map/Fig# BC Location Map 1:8,750,000 1 Access Location Map 1:123,000 2 Claim Map 1:48,000 3a Detail Claim Map 3b Geology Map 1:1,231,000 4a
Geology Map Legend n/a 4b
MMI STACKED HISTOGRAMS Copper, Gold, Silver, Cobalt,
Zinc Nickel, Cerium, Cadmium,
Copper, Lead Line 100E Fig 6a, 6b Fig 27a, 27b
Line 200E Fig 7 Fig 28
Line 300E Fig 8a, 8b Fig 29a, 29b Line 400E Fig 9 Fig 30
Line 500E Fig 10a, 10b Fig 31a, 31b Line 600E Fig 11 Fig 32
Line 700E Fig 12a, 12b Fig 33a, 33b
Line 800E Fig 13 Fig 34 Line 900E Fig 14a, 14b Fig 35a, 35b Line 1000E Fig 15a, 15b Fig 36a, 36b
Line 1100E Fig 16a, 16b Fig 37a, 37b Line 1200E Fig 17a, 17b Fig 38a, 38b
Line 1300E Fig 18a,18b Fig 39a,39b
Line 1400E Fig 19a,19b Fig 40a,40b Line 1500E Fig 20a, 20b Fig 41a, 41b
Line 1600E Fig 21 Fig 42
Line 1700E Fig 22 Fig 43
Line 1800E Fig 23 Fig 44 Line 1900E Fig 24 Fig 45
Line 2000E Fig 25 Fig 46 Line 2100E Fig 26 Fig 47 *This is the scale of the maps when produced on letter-size paper.

MMI SURVEY PLAN MAPS Metal Production Scale* Map/Fig#
Copper 1:10,000 GC-1 Zinc 1:10,000 GC-2 Gold 1:10,000 GC-3 Molybdenum 1:10,000 GC-4 Silver 1:10,000 GC-5 Lead 1:10,000 GC-6 Cobalt 1:10,000 GC-7 Cadmium 1:10,000 GC-8 Cerium 1:10,000 GC-9 Nickel 1:10,000 GC-10
MAGNETIC SURVEY PLAN MAPS Map Type Production Scale* Map/Fig#
Contour Plan 1:10,000 GC-1a Profile Plan 1:10,000 GC-1b
*The maps were produced at these scales but may be reduced to fit within the report and thus have a smaller scale.

SUMMARY
Magnetic and MMI soil sampling were carried within the Babs Property which is located just east of Babine Lake and just west of Tochcha Lake within the Omineca Mining Division of B.C. The grid itself is located approximately 14 km east of the settlement of Granisle and 65 km northeast of Houston.
The main purpose of the exploration program was to locate gold/silver mineralization, perhaps similar to the Yellowjacket Prospect, which is being explored for by Prize Mining. Here, bonanza-type gold occurs within listwanite and with associated sulphides. Both Feather and Providence creeks contain placer gold with there being a strong probability that the source occurs within the Babs Property. The secondary purpose was to locate porphyry-style base metal deposits which are suggested could occur in the area.
The magnetic survey was carried out with two proton precession magnetometers, with one being a base station, by taking readings every 25 m over twenty-one lines for a total survey length of 57,500 meters. The readings were input into a computer, and profiled above the IP and resistivity pseudosections. They were also plotted onto a base map at a scale of 1:5000, and contoured as well as plotted onto a second base map and profiled.
The MMI sampling consisted of 1,041 samples taken along 21 north-south lines with a line separation of 100 meters, for a total survey length of 52,050 meters. The samples were picked up every 50 meters where a picket was placed with the grid coordinates marked on an aluminum tag. The samples were sent to SGS labs in Toronto and tested for 46 elements.
i

CONCLUSIONS
1. The Babs Property contains two creeks that carry placer gold. Some of the gold, especially that within Feather Creek, is crystalline or angular in nature suggesting the strong probability that the source of the placer gold occurs within the Babs claims. The source is also likely associated with an acidic intrusive such as that of the Surprise Lake batholith.
2. Stream sediment sampling done by the government with a sample each taken at the mouths of Feather Creek and Providence Creek, respectively are very anomalous in gold, copper, and zinc. This strongly indicates that the causative sources occur within the Babs Property.
3. The MMI survey revealed one strong gold anomaly, labeled A, and two weaker ones, labeled B and C, respectively. The strong gold anomaly occurs 1,000 meters north of Feather Creek, is up to 84 times background and is open to the south, east and west.
4. The two weaker anomalies are open to the east and to the west, respectively, and thus if each was sampled more thoroughly, may be found to be much stronger.
5. The MMI survey also revealed two strong base metal anomalies, labeled D and E respectively, each of which is suggestive of larger base metal porphyry-style mineralization. The anomalies consist of several metals, the strongest ones being molybdenum, copper, zinc, nickel, and uranium. In addition, anomalous values in gold, silver, cobalt, arsenic, and antimony are associated with D and E.
6. Both D and E appear to have an east-west strike, though it is possible that the strike of E could be northwesterly. D has a minimum strike length of 1,000 meters with it being open to the west, though the main part of the anomaly has a strike length of 500 meters. Its width is up to 500 meters. E has a minimum strike length of 1200 meters with it being open to the west as well. Its width is also up to 500 meters.
7. MMI anomalies F and G are also base metal type with similar compositional characteristics to anomalies D and E. However, both of these anomalies strike northeasterly, which is sub-parallel to the mapped faults, and are more lineal in shape suggesting they may be structurally-controlled. F has a minimum strike length of 800 meters and G, 1200 meters.
8. The east end of anomalies D and E each abut against a possible acidic intrusive as interpreted from the MMI and magnetic survey results. This possible intrusive is characterized by low values in nickel, copper, zinc, molybdenum, uranium, and cadmium as well as elevated values in cerium and a slightly higher intensity in the magnetic field, about 20 to 40 nT. These last two features of higher cerium values and the higher magnetic field are especially indicative of an acid intrusive.
ii

9. The magnetic survey revealed a very quiet magnetic field over most of the grid area, which is typical of the sedimentary rocks that are probably underlying most of the property.
10. Two relatively strong magnetic highs occur along the northern edge of the survey grid and thus are undoubtedly reflecting the basaltic volcanic known to occur within this area. A small magnetic high along the southwestern survey edge is also probably reflecting basalts.
iii

iv
RECOMMENDATIONS
1. The MMI sampling and the magnetic surveying should be continued on the property as follows: - (a) fill in the 100-meter lines within the area of anomalies D and E. The line spacing for most of these two anomalies is 200 meters which is too far to accurately determine strike and anomaly extent, especially in the case of anomaly E. (b) extend the grid around anomaly A to the south, east and west with a line spacing of 100 meters and a sampling interval of 25 meters. (c) extend the grid to the east of anomaly C also taking samples every 25 meters on lines 100 meters apart. (d) extend the grid to cover Feather and Providence creeks in an attempt to locate the sources of the placer gold.
2. Carry out induced polarization (IP) surveying over anomalies D and E in order to verify the two anomalies as well as to determine the depth of the causative sources.
3. Geologically map the property, especially the grid area. This could be quite limited due to the widespread overburden cover.
4. Once the above is complete, then anomalies A, D, and E should be diamond drilled. It is also possible that other targets may develop from the above recommendations, such as anomaly C.

EXPLORATION REPORT
ON A
GEOPHYSICAL MAGNETIC SURVEY
AND AN
MMI SOIL GEOCHEMISTRY SURVEY
ON THE
BABS PROPERTY
BABINE LAKE AREA
OMINECA MINING DIVISION, BRITISH COLUMBIA
INTRODUCTION AND GENERAL REMARKS
This report discusses survey procedure, compilation of data, interpretation methods, and the results of magnetic surveying and MMI soil sampling carried out on the Babs Property which is located to the northeast of Houston, BC, and is owned by Kenrich-Eskay Mining Corp. which is the operator of the property.
The exploration work was carried out by a Geotronics crew of three to ten men during the period of June 9th to August 12th, 2008. The amount of work carried out was as follows:
WORK TYPE WORK AMOUNT
Magnetic Survey 57,500 meters
MMI Soil Sampling 1,041 samples along 52,050 meters
The purpose of the exploration program on this property is to look for gold mineralization, possibly associated with silver and copper values. Both main creeks, Feather and Providence, that drain the Babs Property contain placer gold with extensive placer mining having taken place on Feather. There is, therefore, a strong probability that the source(s) of the placer gold occurs within the Babs claims since at least some of the placer gold is crystalline in nature meaning it has not traveled far. In addition, the Saskatchewan Research Council did some studies of gold particles from glacial drift in the area and at least half of the particles were angular in nature thus meaning the particles were not far from their source.
The type of deposit being explored for may be similar to the nearby Yellowjacket Prospect which is being explored by Prize Mining. The Yellowjacket mineralization consists of
1

bonanza-type gold with surrounding disseminated sulphides occurring within a listwanite host rock. Listwanite may occur on MaxTech’s Babs Property possibly within the northern part. However, a government study carried out on Feather Creek indicates that the source of the Feather Creek gold is probably associated with acidic intrusives such as the Surprise Lake batholith and not listwanites.
A secondary purpose is to look for base metal mineralization, especially a porphyry copper type. It has been postulated that these may occur in the area close to the Surprise Lake batholith which is 150 to 1000 meters north of the north boundary of the Babs claims.
The purpose of the magnetic survey is to map rock types, such as the listwanite, and to map geological structure.
The purpose of the MMI soil sampling is to look for mineralization directly. MMI stands for mobile metal ions and describes ions, which have moved in the weathering zone and that are weakly or loosely attached to surface soil particles. MMI, which requires special sampling and testing techniques, are particularly useful in responding to mineralization at depth probably in excess of 700 meters. It also is not affected by glacial till, while standard soil sample techniques are. MMI is characterized in having a high signal to noise ratio and therefore can provide accurate drill targets. However, it may also move along fault lines and therefore could show the causative source to be laterally moved from where it actually is.
PROPERTY AND OWNERSHIP
The property is comprised of 49 contiguous tenures that comprise an area of 21,598.424 hectares and occurs within the Omineca Mining Division as shown on figure #2: These tenures occur on NTS map sheets 93K/13, 93L/16, 93M/01 and BCGS map sheets 93M/010, 93L/100, 93L/090, 93K/091, 93K/081.
Tenure Number Type Claim Name Good Until Area (ha)570504 Mineral BABS1 20091123 409.623570505 Mineral BABS2 20091123 465.221570506 Mineral BABS3 20091123 465.226570507 Mineral BABS4 20091123 465.226570508 Mineral BABS5 20091123 446.823570509 Mineral BABS6 20091123 316.461570510 Mineral BABS7 20091123 464.986570511 Mineral BABS8 20091123 464.992570512 Mineral BABS9 20091123 464.987570513 Mineral BABS10 20091123 465.165570514 Mineral BABS11 20091123 446.773570515 Mineral BABS12 20091123 447.013570517 Mineral BABS13 20091123 428.501570518 Mineral BABS14 20091123 447.143570519 Mineral BABS15 20091123 390.362
2

570520 Mineral BABS16 20091123 464.727570521 Mineral BABS17 20091123 464.735570522 Mineral BABS18 20091123 464.463570523 Mineral BABS19 20091123 445.914570524 Mineral BABS20 20091123 464.218570525 Mineral BABS21 20091123 464.242570527 Mineral BABS22 20091123 464.261570528 Mineral BABS23 20091123 408.416570529 Mineral BABS24 20091123 426.746570531 Mineral BABS25 20091123 463.981570532 Mineral BABS26 20091123 463.989570533 Mineral BABS27 20091123 464.003570534 Mineral BABS28 20091123 463.749570535 Mineral BABS29 20091123 463.753570536 Mineral BABS30 20091123 463.76570538 Mineral BABS31 20091123 278.248570539 Mineral BABS32 20091123 463.518570540 Mineral BABS33 20091123 463.52570541 Mineral BABS34 20091123 465.155570542 Mineral BABS35 20091123 465.406570543 Mineral BABS36 20091123 465.648570544 Mineral BABS37 20091123 464.921570546 Mineral BABS38 20091123 446.531570547 Mineral BABS39 20091123 464.908570548 Mineral BABS40 20091123 446.125570549 Mineral BABS41 20091123 464.546570550 Mineral BABS42 20091123 445.885570551 Mineral BABS43 20091123 427.11570552 Mineral BABS44 20091123 464.002570556 Mineral BABS45 20091123 389.458570558 Mineral BABS46 20091123 463.525570559 Mineral BABS47 20091123 446.972570560 Mineral BABS48 20091123 260.815570561 Mineral BABS49 20091123 372.672
Total Area: 21598.424 ha
Those claims that are owned by Kenrich-Eskay Mining Corp. of Surrey, British Columbia.
LOCATION AND ACCESS
Parts of this section are reproduced from DeLong and Haslinger, 1996.
The Babs Property is located within the central section of British Columbia, as shown on figure #1, 65 km to the northeast of Houston, 1148 km north of Vancouver, BC. It occurs to the immediate east of Babine Lake.
3

This property occurs within NTS map sheets 93K/13, 93L/16, and 93M/01. For the center of the property, the latitude is 54° 95’ North and the longitude is 126° 05’ West. The property boundaries occur within UTM co-ordinates 679000 and 313000 east; and 6078000 and 6103000 north.
From the community of Topley, 30 km east of Houston on Highway 16, an all season, paved road runs forty km north to the community of Michelle Bay on the west shore of Babine Lake. From Michelle Bay, barge service is available on varying schedules to Nose Bay located on the east shore of Babine Lake. Access to the property is provided by the well maintained Nose Bay logging road east to Pats road at Kilometer 6, and then approximately 3 km south along Pats road to the centre of the Babs property.
PHYSIOGRAPHY AND CLIMATE
Reproduced from DeLong and Haslinger, 1996.
The Babs claim group covers gently rolling, forested and clear cut terrain with elevations ranging from 712 m in the southwest to 1189 m in the northeast. The climate is generally moderate. Temperatures range from +30" to -35" Celsius. Precipitation is usually moderate and more or less uniformly distributed throughout the year. With appropriate planning, drilling and development activities could be sustained all year round.
PREVIOUS WORK
Reproduced from DeLong and Haslinger, 1996.
In 1991 a float train of large angular Biotite Feldspar Porphyry boulders was discovered by current owner Ralph Keefe, a prospector. The boulders hosted chalcopyrite mineralization grading up to 0.9% Cu and 1.3 g t Au. Eleven mineral claims were staked in late 1991 covering the boulder train and surrounding ground. The claims were subsequently optioned to Equity Silver Mines Limited in early 1992.
In 1992 Equity Silver cut a grid over the boulder train and surrounding area to facilitate soil geochemical, magnetic, and induced polarization surveying and geological mapping. In addition, 25 test pits were excavated. Two were reported to have reached bedrock. From November 3 to November 7, 1992, 7 NQ diamond drill holes totaling 322 metres, were completed to the east, west and south of the mineralized boulder train. On July 3, 1993 Noranda Exploration Company Limited entered into an option agreement on the Babs 1-1 1 claim group. Following a regional reconnaissance field program an additional 8 claims (Babs 12-19) were staked.
A four-man geophysical crew completed 40 km of magnetic and 23 km of IP surveys in May and June of 1994. 398 soil samples were also collected.
In July of 1994 a two hole NQ diamond drilling program was completed to evaluate the results of the geochemical and geophysical program. One hole, NB94-10, encountered
4

grades of 0.19% Cu over 78.3 m including 0.32% Cu over 1 1.7 m.
GEOLOGY
A. Regional
Reproduced from DeLong and Haslinger, 1996.
The Babs property lies within the Intermontane Belt of northwest British Columbia in the southern portion of the Babine Copper-Gold Porphyry Mining District. It is largely underlain by Early Jurassic Topley intrusions that range from phaneritic quartz diorite and quartz monzonite to granodiorite. A fine-grained rhyolite phase is recorded (Geological Survey of Canada, Open File 351; 1976). The regional geology of the Babine Lake area is described by Carter (1973,1976) and Richards (1973, 1974).
The copper-gold porphyry deposits of the Babine Camp, including the Bell Mine (past production and reserves 160MT grading 0.45% Cu and 0.34 g/t Au), Granisle Mine (past production and reserves 81MT grading 0.43% Cu), and the Morrison Deposit (190MT reserve grading 0.4% Cu and 0.2 g/t Au), are all associated with Eocene age Biotite Feldspar Porphyry intrusions. The Biotite Feldspar Porphyry (BFP) intrusions are calcalkaline composition and are localized along major northwest trending extensional structures that form a series of large-scale grabens in the region. Northeast trending faults are also thought to be important as secondary structural controls on the emplacement of Biotite Feldspar Porphyry intrusions.
B. Property
Exposure is generally poor (less then 2%) as much of the property is covered by a glacial till sheet that has been reworked by secondary low energy glacio-fluvial processes (Stumpf et al. 1996). Surficial mapping by the British Columbia Geological Survey in 1995 has established a main iceflow direction toward 150” and a secondary direction of glacio-fluvial action generally toward south to southwest. Drainages and road cuts provide the best outcrop exposure.
In the Pats Road area, in the south central portion of the property, a 500 m by 150 m southeast trending train of well-mineralized subangular Biotite Feldspar Porphyry boulders has been identified in a logged area. Over 100 boulders ranging from 5 to 150 cm in diameter have been located. Test pits and diamond drilling have not identified the source of the boulders. These boulders may have been sourced from a nearby area “up-ice” of the boulder train as suggested by the subangular nature of the numerous mineralized float bloulders (Stumpf et al., 1996). Alternatively, the boulders may have been sourced from the Granisle Deposit, situated fourteen kilometres “up-ice” to the northwest.
A single mineralized biotite feldspar porphry float boulder was also located north of Nose Bay road (at 10+25N/ 27+70W; Figure 7). Drilling (DDH 96-18) “up-ice” from this boulder did not identify its source or encounter significant mineralization/alteration. The property is
5

mainly underlain by Late Triassic to Early Jurassic Topley intrusions of diorite to granite composition. Felsic volcanic rocks of probable Eocene age are locally exposed in the south central area of the property (Figure 7). Drill core provides key information on the distribution of units in the south portion of the property where altered felsic volcaniclastic rocks were intersected.
Outcrop is scarce in the area of Biotite Feldspar Porphyry float. To the east, sporadic outcrops of moderately magnetic Topley granodiorite and quartz diorite were encountered (Hanson, 1992). Four hundred metres east of the float a borrow pit exposes strongly altered and fractured very fine grained rhyolitic tuff with limonite and very minor malachite staining. Drill core in the area of the float is also rhyolitic quartz-eye to lapilli tuff. To the south are small scattered outcrops of coarser felsic tuffs. The area of the float is probably underlain by rhyolitic volcanic rocks that may be coeval with the Topley intrusions or may be part of the Eocene volcanic stratigraphy.
Map units for the Babs property are briefly described below (from Gray, 1996):
Late Triassic - Early Jurassic Rocks
Monzonite-Granite-Quartz Monzonite (EJT - Topley Intrusive Suite)
The property is mainly underlain by salmon pink medium- to coarse-grained intrusive rocks that weather an orangey colour. These intrusives are mainly monzonite but also include quartz monzonite, granite, and fine-grained to aphanitic felsic phases. These rocks are variably magnetic, ranging from non-magnetic to moderately magnetic. Intrusions on the property are probably different phases of a multiphase stock.
Quartz Diorite (E JT - Topley Intrusive Suite)
Quartz diorite dikes are exposed in “Camp Creek” in the north central portion of the property. These dikes are medium-grained equigranular rocks that typically contain 5% disseminated medium-grained pyrite. The dikes are generally small, usually less than a metre thick. They cut an earlier monzonite phase of the Topley intrusions. The quartz diorite dikes are interpreted as a late intrusive phase associated with the Topley intrusions.
Alteration
Most of the Topley rocks encountered at the surface are relatively fresh with only minor chlorite alteration of hornblende and biotite. Fractures sometimes have potassium feldspar alteration envelopes around them which are typically a few millimetres wide. Epidote veins and clots are locally observed. Some of the Topley rocks near the drill targets are altered to a chalky, whitish appearance. hydrothermal system produced during the emplacement of Biotite Feldspar Porphyry dikes. This argillic alteration may be related to a younger
Eocene (?) Rocks
Felsic Volcanic Unit
6

The Felsic Volcanic Unit (FVU) outcrops along road cuts in the south central portion of the property and is generally poorly exposed. Outcrops are typically rusty weathered and bleached. Based on drill core, the FVU consists of quartz crystal bearing rhyolite lapilli tuffs to agglomeratic lapilli tuffs and feldspar phyric rhyodacites. Quartz crystals compose 1-5% of the rock, are 1 to 2 mm in size and light grey in colour. Fragments range up to 10 cm across and locally have possible flow-banding. McIntyre et al. (1996) has suggested this felsic unit is similar to the quartz phyric felsic volcaniclastic rocks adjacent to the Bell Mine.
The FVU is interpreted, in part, as a proximal volcaniclastic unit either deposited as an ash flow or as an explosion breccia. Possible flow-banded fragments and crude flow structure in the feldspar phyric rhyodacites suggest an associated high level rhyodacite flow-dome complex. The position of the FVU, apparently bounded by Topley intrusive rocks suggests that the FVU may lie within a down-dropped fault block that was preserved from erosion.
Alteration
The alteration of the FVU mapped on surface in the area of drilling is dominated by sericiteclay+/- pyrite assemblages and is generally pervasive, has a buff to pale green cast and is locally “texture destructive” as fragment shapes and feldspar outlines are not discernible. In drill core these alteration assemblages were less well developed.
Mineralization
Chalcopyrite, pyrite, and pyrrhotite are the main sulphides noted in pre-1995 drilling with local sphalerite, arsenopyrite, and bornite(?). Chalcopyrite is developed mainly as disseminations and locally as clots and void fillings.
Biotite Feldspar Porphyry Boulders
Biotite Feldspar Porphyry boulders are typically highly-altered by pervasive secondary biotite-magnetite alteration and by stockwork veinlets of quartz+/-potassium feldsparchalcopyrite - magnetite (potassium feldspar detected by staining). Textures vary from relatively fresh-looking porphyries to highly mottled rocks including spheroidal patchy alteration that destroys all primary textures.
Mineralization is typically developed as disseminations and stockwork fracture coatings of chalcoppte (44%; average 1-2%), magnetite (<1-5%; average 2-3%) and pyrite (nil - 1%; average 4%). It is noted that some large recently located boulders have trace magnetite and 34% chalcopyrite.
Limited mapping and prospecting (10 man days) was carried out in November of 1995.
C. Mineralization
No mineralized occurrence so far is known on the property. However, as indicated within other parts of this report, there is much evidence that gold mineralization occurs on the
7

property especially since both Feather and Providence creeks are known to contain placer gold. Currently placer gold claims occur on both creeks.
Feather Creek in particular has had significant placer mining carried out on it, mostly by Bud Bergs in recent years, and that at least some of the gold that was placer mined on Feather Creek was crystalline in nature and thus did not come far (See Sack and Mihalynuk’s paper entitled “Proximal gold-cassiterite nuggets and the composition of the Feather Creek placer gravels: clues to a lode source near Atlin B.C.”). In other words, the source of the placer gold is very likely within the Babs Property. In addition, Sneddon in his report “Teslin Plateau Lode Gold Project” had gold particles from glacial drift in the area analyzed by the Saskatchewan Research Council and they reported that half of the particles were angular and thus did not come far.
Sack and Mihalynuk also concluded that the source of the placer gold within Feather Creek is not associated with ultramafites or listwanites, as appears to be the case elsewhere in the Atlin area (See the Yellowjacket report below). None, or very little clasts of these rock-types can be found in Feather Creek with the placer gold. Instead, the clasts are comprised of black chert; grey, tan, or red chert and wacke, with significant amounts of quartz and granitoid clasts. In addition, much of the placer gold is associated with cassiterite, which is a tin oxide. The Surprise Lake batholith is known to be high in tin. As a result, it is concluded that the source of the Feather Creek placer gold is associated with the Surprise Lake batholith.
It should be noted that Sack and Mihalynuk’s conclusions may not hold true for the placer gold of Providence Creek and thus it is possible that the source of the Providence Creek gold may be associated with listwanites and ultramafites.
(a) Minfile Occurrences near the Babs Property
i. Kare Showing (Minfile no. 093L 220 at UTM coordinates 6094043N and 686634E within the Babs Property. The following description is taken from BC Maplace.)
The claims are underlain by Lower Jurassic Hazelton Group rocks (Telkwa Formation), comprised of andesitic flows, tuff, and breccia with intercalated argillite and greywacke. Eocene dikes and sills crosscut the volcanics and are related to the Babine intrusions. They are comprised of granitic to feldspar porphyritic textured diorite with an economically mineralized biotite-hornblende feldspar porphyry member.
Zonal alteration is associated with the mineralized porphyry. Alteration associated with ore grade material is potassic with secondary biotite. A concentric intermediate zone surrounds the secondary biotite and is defined by the presence of fracture con- trolled pyrite with or without quartz carbonate gangue. The outermost zone is defined by the presence of carbonate fracture fillings with or without minor pyrite.
8

Chalcopyrite is associated with secondary biotite in a small feldspar porphyry dike trending northwest on R-186 and 188 west of Hawthorne Bay. In 1972, the grade was estimated at 0.1 per cent copper over 3.0 metres (Assessment Report 4250). East and west of this occurrence are weakly altered volcanic host rocks which contain carbonate veinlets.
A narrow northwest trending shear on Bab-131 is mineralized with pyrite, chalcopyrite, sericite, and secondary biotite.
ii. Mag Showing (Minfile no. 093L 209 at UTM coordinates 6095212N and 683469E within the Babs Property. The following description is taken from BC Maplace.)
The claims are underlain by Lower Jurassic Hazelton Group, Telkwa Formation rocks comprised of andesitic tuff and breccia with interbedded argillite, greywacke and shale. The volcanics are intruded by an Eocene Babine Intrusive which consists of a northeast extension of a biotite-feldspar porphyry dike. This dike occurs in the southern part of the Granisle Copper Ltd. property. The interbedded argillites and greywackes strike north and dip to the west at moderate angles.
Locally, a 0.3 metre wide calcite vein containing disseminated galena and sphalerite with minor chalcopyrite and pyrite follows a west trending shear zone. Disseminated pyrite, accompanied by iron staining, occurs in the argillites and greywackes adjacent to the shear zone.
iii. Trek Showing (Minfile no. 093L 208 at UTM coordinates 6096096N and 683878E and within the Babs Property. The following description is taken from BC Maplace.)
The claims are underlain by Lower Jurassic Hazelton Group, Telkwa Formation volcanics comprised of andesitic to basaltic flows and tuff with intercalated greywacke, argillite and graphitic shale. The volcanics are intruded by an Eocene Babine Intrusion comprised of porphyritic granodiorite. The Hazelton rocks are unconformably overlain by interbedded sandstone, shale and mudstone of the Sustut Group. Drilling near the central part of the property indicated it is underlain by an interbedded sequence of moderately dipping, fragmental andesites and black argillaceous, locally graphitic sediments. Inter- sections of up to 1.5 metres of disseminated, stringer and massive banded pyrrhotite, pyrite with minor chalcopyrite were found in the graphitic zones. Banding appears to be conformable with layering in the host rock. Sulphide mineralization also consists of disseminated pyrite with magnetite in the Hazelton rocks with minor disseminated and fracture filling pyrite and pyrrhotite in graphitic sections.
9

In 1966, Bethex reported a 0.3 metre quartz-carbonate vein occurring in the Hazelton rocks hosting galena, sphalerite and chalcopyrite. The vein strikes 074 degrees dipping 75 degrees north- east, and occurs in a greywacke exposed 1.0 kilometre northeast of the northwest corner of the Red 2 claim (HAG 093L 207). A basic dike was seen to cut the stringer and massive banded sulphides in addition to the more common post-mineral shearing and narrow carbonate filled fractures. Also, north of the claims a medium-grained diorite with lesser hornblende porphyry were noted cutting interbedded andesite tuff and argillaceous siltstone with some banded greywacke.
iv. Hag Showing (Minfile no. 093L 207 at UTM coordinates 6096714N and 683853E within the Babs Property. The following description is taken from BC Maplace.)
The area is underlain by Lower Jurassic Hazelton Group, Telkwa Formation volcanics comprised of andesitic flows, tuffs, and breccia with intercalated greywacke, argillite, and graphitic shale. The volcanics are intruded by an Eocene Babine Intrusion comprised of porphyritic granodiorite. The Hazelton rocks are unconformably overlain by interbedded sandstone, shale and mudstone of the Sustut Group. The showing consists of a 0.3 metre wide quartz-carbonate vein hosting galena, sphalerite, chalcopyrite and minor pyrite which crosscuts the Hazelton rocks. The vein strikes 074 degrees and dips 75 degrees northeast. The occurrence is in a greywacke exposed 1.0 kilometre northeast of the Trek (093L 208) massive banded pyrrhotite occurrence.
v. Mag Showing (Minfile no. 093M 002 at UTM coordinates 6098855N and 683231E within the Babs Property. The following description is taken from BC Maplace)
The Mag occurrence is located 4 kilometres north of Hawthorne Bay on the east side of Babine Lake. The area is underlain by andesitic tuffs and breccias of the Lower to Middle Jurassic Telkwa Formation (Hazelton Group). These have been intruded by the northeast extension of the biotite-feldspar porphyry dike of the Eocene Babine Intrusions which occurs at the Granisle mine (092L 145) immediately to the south. Interbedded argillites and greywackes of the Lower to Middle Jurassic Nilkitkwa Formation (Hazelton Group) are exposed in a creek in the area. These sediments strike north and dip to the west at moderate angles. Calcite veins, up to 30 centimetres in width, occur in a west-trending fracture zone
10

cutting pyritic sedimentary rocks. The veins are mineralized with sphalerite, galena, pyrite and chalcopyrite.
vi. Granisle Past Producer (Minfile no. 093L 146 at UTM coordinates 6092308N and 682074E 3 km west of the Babs Property. The following description is taken from BC Maplace)
MacDonald Island is underlain by Lower-Middle Jurassic Telkwa Formation (Hazelton Group) volcanics comprised of green to purple waterlain andesite tuffs and breccias with minor intercalated chert pebble conglomerates in the central and eastern part of the island. These rocks strike northerly and dip at moderate angles to the west and are overlain in the western part of the island by massive and amygdaloidal andesitic flows and thin bedded shales. Copper mineralization at the Granisle mine is associated with a series of Eocene Babine Intrusions which occur in the central part of the island. The oldest is an elliptical plug of dark grey quartz diorite approximately 300 by 500 metres in plan. The most important intrusions are biotite-feldspar porphyries of several distinct phases which overlap the period of mineralization. The largest and oldest is a wide northeasterly trending dike which is intrusive into the western edge of the quartz diorite pluton. The contact is near vertical and several small porphyry dikes radiate from the main dike. Several of the phases of the porphyry intrusions are recognized within the pit area. Potassium-argon age determinations on four biotite samples collected in and near the Granisle ore body yielded the mean age of 51.2 Ma plus or minus 2 Ma (Minister of Mines Annual Report 1971). The wide porphyry dike which strikes northeast is bounded by two parallel northwest striking block faults. The westernmost crosses the island south of the mine and the eastern fault extends along the channel separating the island from the east shore of Babine Lake. An oval zone of potassic alteration is coincident with the ore zone. The main alteration product is secondary biotite. This potassic alteration zone is gradational outward to a quartz-sericite- carbonate-pyrite zone which is roughly coaxial with the ore zone. Within this zone, the intrusive and volcanic rocks are weathered to a uniform buff colour with abundant fine-grained quartz. Mafic minerals are altered to sericite and carbonate with plagioclase clouded by sericite. Pyrite occurs as disseminations or as fracture-fillings. Beyond the pyrite halo, varying degrees of propylitic alteration occurs in the volcanics with chlorite, carbonate and epidote in the matrix and carbonate-pyrite in fractured zones. Clay mineral alteration is confined to narrow gouge in the fault zones. The principal minerals within the ore zone are chalcopyrite, bornite and pyrite. Coarse-
11

grained chalcopyrite is widespread, occurring principally in quartz-filled fractures with preferred orientations of 035 to 060 degrees and 300 to 330 degrees with near vertical dips. Bornite is widespread in the southern half of the ore zone with veins up to 0.3 metres wide hosting coarse-grained bornite, chalcopyrite, quartz, biotite and apatite. Gold and silver are recovered from the copper concentrates. Molybdenite occurs within the ore zone, most commonly in drusy quartz veinlets which appear to be later than the main stage of mineralization. Magnetite and specularite are common in the north half of the ore zone where they occur in fractures with chalcopyrite and pyrite. Pyrite occurs in greatest concentrations peripheral to the orebody as blebs, stringers and disseminations. Mining at Granisle was suspended in mid-1982. Production from 1966 to 1982 totalled 52,273,151 tonnes yielding 69,752,525 grams of silver, 6,832,716 grams of gold, 214,299,455 kilograms of copper and 6,582 kilograms molybdenum. Unclassified reserves are 14,163,459 tonnes grading 0.442 per cent copper (Noranda Mines Ltd. Annual Report 1984). Remaining in situ reserves, as modelled in 1992 using a 0.30 per cent copper cutoff, are estimated to be 119 million tonnes grading 0.41 per cent copper and 0.15 grams per tonne gold (CIM Special Volume 46, page 254).
vii. Bell Past Producer (Minfile no. 093M 001 at UTM coordinates 6098605N and 677033E 3 km west of the Babs Property. The following description is taken from BC Maplace)
The Bell copper deposit is located on Newman Peninsula on the north end of Babine Lake. Two other large porphyry-type deposits, the Granisle (093L 146) and Morrison (093M 007), also occur in the area. The area was initially explored in 1913 for veins with lead and zinc mineralization. Reconnaissance geophysics and anomalous copper, in a soil geochemical survey in 1962, led Noranda Exploration Company to an area 800 metres northeast of the old adits. By 1967, mineable reserves of 42 million tonnes of ore had been defined grading 0.50 per cent copper, 0.35 gram per tonne gold and 1.0 gram per tonne silver, within an overall geological ore reserve of 116 million tonnes grading 0.48 per cent copper, 0.35 gram per tonne gold, 1.0 gram per tonne silver and less than 0.005 per cent molybdenum (Canadian Institute of Mining and Metallurgy Special Volume 15). Production began in 1972, and by December 31, 1990 approximately 71 million tonnes of ore had been processed. The Bell mine is a porphyry copper deposit hosted primarily in a biotite-feldspar porphyry stock of the Eocene Babine Intrusions. The stock is crosscut by the northwest
12
trending Newman fault which juxtaposes the two groups that host the intrusion. These groups are the Lower Jurassic Telkwa Formation (Hazelton Group) and the Lower Cretaceous Skeena Group. Telkwa Formation rocks are primarily fine-grained tuffs and andesites and the younger Skeena Group rocks are mostly fine-grained greywackes. The deposit overlaps onto both of these assemblages. The mineralization has been dated at 51.0 million years (Bulletin 64). Chalcopyrite and lesser bornite occur as disseminations in the rock matrix, in irregular quartz lenses and in a stockwork of 3 to 6- millimetre quartz veinlets which cut the feldspar porphyries and the siltstones. Molybdenite is rare, and occurs in the feldspar porphyry in the northern part of the mineralized zone. Gold occurs as electrum associated with the copper mineralization. Specular hematite and magnetite are common in quartz veinlets and hairline fractures. There is also significant supergene enrichment with chalcocite coating chalcopyrite. A supergene chalcocite zone capped the deposit and extended to depths of 50 to 70 metres. Some gypsum together with copper-iron sulphate minerals and iron oxides were also present (Open File 1991-15). The ore zone has pervasive potassic (mainly biotitization) alteration with a surrounding concentric halo of chlorite and sericite-carbonate alteration (propylitic and argillic) which corresponds to the two kilometre pyrite halo which surrounds the deposit. A late quartz-sericite-pyrite-chalcopyrite alteration has been superimposed on part of the earlier biotite-chalcopyrite ore at the western part of the orebody. A number of late-stage breccia pipes cut the central part of the ore zone near the Newman fault and alteration associated with their intrusion has apparently depleted the copper grades in the area of the pipes. Veinlets of gypsum are present in the upper part of the orebody. Anhydrite is a significant component in the biotite-chalcopyrite zone but is not present in other alteration facies. Monominerallic veinlets of anhydrite are rare (Open File 1991-15). The copper mineralization occurs in a crescent-shaped zone along the western contact of the porphyry plug. Better grades of copper mineralization are contained in a 60 by 90-metre thick flat-lying, blanket-like deposit which is connected to a central pipe-like zone, centred on the western contact of the intrusive. The pipe-like zone of copper mineralization is 150 metres in diameter and extends to a depth of at least 750 metres. Reserves in the present open pit and in the Extension zone are 71,752,960 tonnes grading 0.23 gram per tonne gold, 0.46 per cent copper and 0.48 gram per tonne silver (Noranda Inc. Annual Report 1990). Noranda reports that the mine will be closed in June 1992 due to depleted ore reserves (Northern Miner - March 16, 1992). Total production from 1972 to 1992 was 77,146,088 tonnes yielding 38,319,730 grams of silver, 12,885,964 grams of gold and 304,795,539 kilograms copper.
13

MMI SOIL SAMPLING
(a) Sampling Procedure The samples were picked up every 50 meters on the 100 meter separated lines. The total number of MMI samples was 1,041 along 52,050 meters of survey line. The number of survey lines totaled 21.
The sampling procedure was to first remove the organic material from the sample site (A0 layer) and then dig a pit over 25 cm deep with a shovel. Sample material was then scraped from the sides of the pit over the measured depth interval of 10 centimeters to 25 centimeters. About 250 grams of sample material was collected and then placed into a plastic Zip-loc sandwich bag with the sample location marked thereon. The 1,041 samples were then packaged and sent to SGS Minerals located at 1885 Leslie Street, Toronto, Ontario. (This is only one of two labs in the world that do MMI analysis, the other being in Perth, Australia where the MMI method was developed.)
(b) Analytical Methods At SGS Minerals, the testing procedure begins with weighing 50 grams of the sample into a plastic vial fitted with a screw cap. Next is added 50 ml of the MMI-M solution to the sample, which is then placed in trays and put into a shaker for 20 minutes. (The MMI-M solution is a neutral mixture of reagents that are used to detach loosely bound ions of any of the 46 elements from the soil substrate and formulated to keep the ions in solution.) These are allowed to sit overnight and subsequently centrifuged for 10 minutes. The solution is then diluted 20 times for a total dilution factor of 200 times and then transferred into plastic test tubes, which are then analyzed on ICP-MS instruments.
Results from the instruments for the 46 elements are processed automatically, loaded into the LIMS (laboratory information management system which is computer software used by laboratories) where the quality control parameters are checked before final reporting.
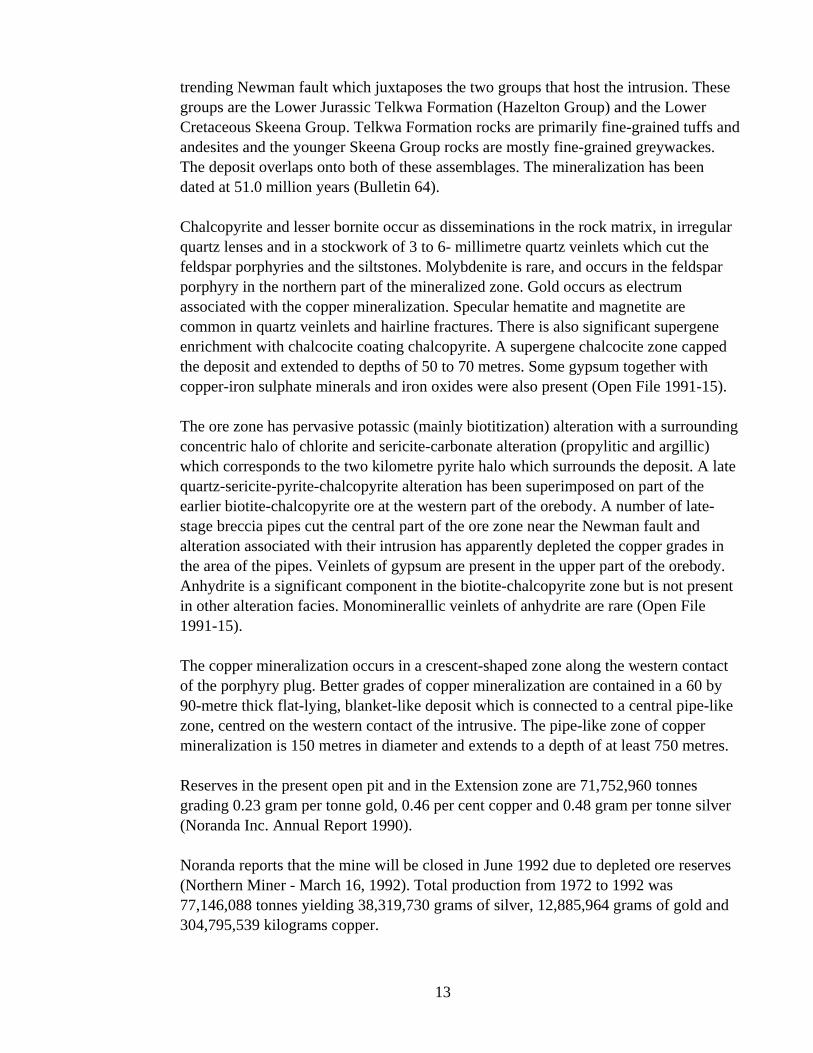
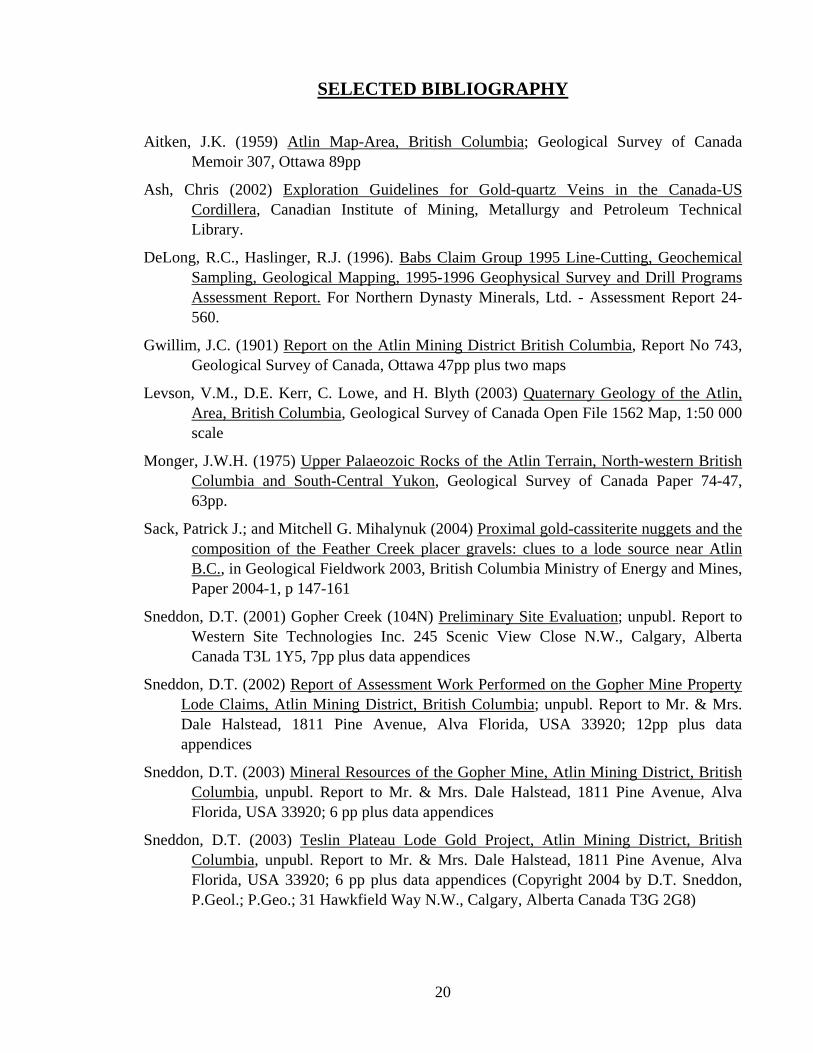
(c) Compilation of Data Twelve elements were chosen out of the 46 reported on and these were silver, arsenic, gold, cadmium, cerium, cobalt, copper, molybdenum, nickel, lead, uranium, and zinc. The mean background value was calculated for each of the 12 elements and this number was then divided into the reported value to obtain a figure called the response ratio, which is essentially the number times background. The background for each of the 12 elements is given below in parts per billion (ppb).
Ag As Au Cd Ce Co Cu Mo Ni Pb U Zn
4.32 5.57 0.05 6.39 73.25 31.50 169.47 4.01 55.78 83.70 4.58 125.99
14

Two stacked histograms of the response ratios were then made for each of the 21 lines, the first stacked histogram consisted of copper, gold, silver, cobalt, and zinc; the second stacked histogram of copper, cadmium, cerium, nickel, lead. This is shown under list of illustrations at the beginning of the report.
In addition, a plan map was made for each of 12 metals, on maps GC-1 to GC-12, respectively at a scale of 1:10,000. On each map, the data were plotted and contoured at a logarithmic interval.
MAGNETIC SURVEY
(a) Instrumentation The magnetic survey was carried out with two model G-856 proton precession magnetometers manufactured by Geometrics of San Jose, California. One was used as a base station and the other was used as the field unit. This instrument reads out directly in nanoTeslas (nT) to an accuracy of ±1 nT, over a range of 20,000 - 100,000 nT. The operating temperature range is -40° to +50° C, and its gradient tolerance is up to 3,000 gammas per meter.
(b) Theory Only two commonly occurring minerals are strongly magnetic, magnetite and pyrrhotite and therefore magnetic surveys are used to detect the presence of these minerals in varying concentrations, as follows:
• Magnetite and pyrrhotite may occur with economic mineralization on a specific property and therefore a magnetic survey may be used to locate this mineralization.
• Different rock types have different background amounts of magnetite (and pyrrhotite in some rare cases) and thus a magnetic survey can be used to map lithology. Generally, the more basic a rock-type, the more magnetite it may contain, though this is not always the case. In mapping lithology, not only is the amount of magnetite important, but also the way it may occur. For example, young basic rocks are often characterized by thumbprint-type magnetic highs and lows.
• Magnetic surveys can also be used in mapping geologic structure. For example, the action of faults and shear zones will often chemically alter magnetite and thus these will show up as lineal-shaped lows. Or, sometimes lineal-shaped highs or a lineation of highs will be reflecting a fault since a magnetite-containing magmatic fluid has intruded along a zone of weakness, being the fault.
(c) Survey Procedure Readings of the earth’s total magnetic field were taken every 25 meters along 21 survey lines with a separation of 100 meters. The total amount of surveying is 57,500 meters.
15

The diurnal variation was monitored in the field by a base station.
(d) Data Reduction The data was input into a computer. Using Geosoft software, it was next plotted with 56,800 nT subtracted from each posted value and contoured at an interval of 20 nT on a base map, GP-1, with a scale of 1:10,000. It was also profiled on the same scaled base map at a vertical scale of 1 cm = 75 nanoTeslas.
DISCUSSION OF RESULTS
(a) Geological Mapping As mentioned above, most of the property is underlain by the Kedahda Formation, which consists of chert, siliceous argillite, and siliclastic rocks, of the Cache Creek Complex. According to the geology map, this also underlies almost the entire grid area as well. The exception is the northern part of the grid which is underlain by Cache Creek basaltic volcanic rocks. However, the magnetic and MMI surveys have appeared to delineate rock-types within the grid area either more accurately than is shown, or mapped previously unknown rock-types.
Firstly, the magnetic survey has revealed the magnetic field over most of the grid area to have a low magnetic intensity, varying for the most part from 57,080 nT to 57,160 nT to give a range of only 80 nT, which means the magnetic field over most of the grid area is very quiet. This is typical of sedimentary rock-types and thus confirms the underlying rock-type to be the Cache Creek sediments.
In addition, the magnetic survey has mapped the Cache Creek basaltic volcanic rocks within the northern part of the grid area more accurately than is shown on fig. 4, the geology map. These are shown by magnetic values above 57,160 nT. The outline of the basalts as delineated by the magnetic highs is shown on the magnetic and MMI plan maps. The southern boundary of the basalts is somewhat arbitrary and could be further south or further north than is shown. There is also a smaller high within the southwestern part of the survey area open to the west that is also probably reflecting basalts, though none is shown within this area on the geology map.
The MMI results have shown what appear to be an area within the southeastern and eastern part of the grid that is somewhat devoid of certain metals namely, nickel, copper, zinc, molybdenum, uranium, and cadmium. The writer has drawn a black dashed line around this area. It is open to the east and thus appears to be semi-circular. This is probably a lithological feature, quite possibly a buried acidic intrusive similar to the Surprise Lake batholith. In support of this interpretation are the following two facts both of which are indicative of acidic intrusives: (1) there is an increase in the cerium values within this area, and, (2) the magnetic field is somewhat higher within this area, say 20 to 40 nT. This possible acidic intrusive may be important to the emplacement of mineralization in the area, especially considering the study on Feather Creek by Sack and Mihalynuk.
16

There is some indication that this semi-circular area may extend to the north and be open to the north and northwest. The evidence is not as strong in that the suggested interpreted lithological contact is not as clearcut for the northern alternate interpretation as that for the southern one. Nevertheless, the alternate interpretation has been drawn on all the plan maps, as well.
In addition to MMI cerium results often mapping acidic rock-types, MMI nickel often maps basic/ultra-basic rock-types. For example in MMI surveying carried out by the writer to the northwest of the Babs property, anomalous nickel MMI results correlate with, or occur adjacent to anomalous gold MMI results. This suggests that the gold mineralization occurs with basic/ultra-basic rock-types, possibly listwanite. However, on the Babs Property, anomalous nickel results correlate directly with anomalous results in other base metals, as discussed below. This would suggest that anomalous nickel results may be reflecting nickel mineralization rather than basic/ultra-basic rock-types.
(b) Anomalies The MMI survey has revealed several anomalies throughout the grid area, both large and small. Seven anomalies are discussed below and have been labeled on the plan maps and the stacked histograms by the upper case letters A to G for ease of discussion. The first three, A to C, are principally gold anomalies and the second four, D to G, are principally base metal anomalies.
Anomaly A is the best gold anomaly within the grid area because of its strength and because it appears to have size. It consists of 11 anomalous values starting with the northernmost one being barely anomalous at four times background and increasing to the south to the southernmost eleventh value being 84 times background. However, the entire anomaly essentially occurs on one line within the southeast corner of the property and thus it is open to the south, east, and west. Thus the anomaly could be increasing in strength to the south beyond the grid area. In addition, this anomaly is the closest one to Feather Creek
Anomaly A is also anomalous in cobalt, which could be reflecting pyrite, as well as containing anomalous values in uranium, molybdenum, zinc, and some arsenic.
Anomaly B is also a gold anomaly occurring at the western edge of the grid on line 97000E and therefore is open to the west. It is up to 36 times background with the main part consisting of 5 values resulting in a width of 100 meters.
However, in a broader sense, the anomaly can be said to have a width of 300 meters, especially considering the associated anomalous metals. These are copper, molybdenum, zinc, cadmium, cobalt, arsenic, and uranium. In fact, while anomalous gold values are mostly limited to line 97000E, the other anomalous values in the metals just mentioned suggest the anomaly may extend 800 meters to the east where it seems to be connected to anomaly F. Nevertheless, the gold part of the anomaly correlates with anomalous cerium values suggesting the possibility that the causative source may
17

be associated with acidic rock types, whereas the base metal part of the anomaly which is further to the east, correlates with higher nickel values suggesting the possibility of being associated with basic/ultrabasic rock-types. Therefore, the two anomalies are probably separate.
Anomaly C is the third gold anomaly occurring on the east side of the grid principally on line 98600E and is open to the southeast. Weaker anomalous values extend westerly to line 98200 indicating the minimum strike length to be 400 meters. Anomaly C consists of eight anomalous values resulting in a width of 200 meters and that vary in intensity from 4 to 26 times background. The main correlating metals are copper, molybdenum, and uranium. There is one particularly high nickel value that suggests a correlating intrusive dyke consisting of a basic/ultrabasic rock-type.
Anomaly D is one of two important base metal anomalies consisting of copper, molybdenum, zinc, nickel, cadmium, and uranium. It occurs within the southern part of the grid centered at about 2700N on lines 97200E to 98000E, and possibly 98200E. This therefore suggests a minimum strike length of 1,000 meters with it being open to the west, though the western part of the anomaly is much narrower than the main body as seen on lines 97600E and 97800E. In fact, the main part of the anomaly occurs on lines 97400E to 97900E which therefore has a 500-meter strike length. The width is about 500 meters on line 97800E which is best seen on the stacked histograms since they show several metals and how they correlate with each other.
The correlation of the anomalous metals strongly suggests a porphyry copper type mineral deposit. Sneddon in his report entitled “Teslin Plateau Lode Gold Project” suggests that porphyry deposits probably occur proximal to the Surprise Lake Batholith which occurs just 2,500 meters north of the northern edge of the grid. The strongest base metal from an MMI point of view is molybdenum but copper, zinc, and nickel are also strong. In addition to the main metals mentioned above, anomaly D also contains anomalous values in gold, silver, lead, arsenic, and antimony.
The geology map suggests that the host rock is probably chert, argillite and/or siliclastic rocks of the Kedahda Formation which is part of the Cache Creek Complex. However, the correlating anomalous nickel results suggest that the host could be basic/ultra-basic rock-types. Nevertheless, as mentioned above, the close correlation of the nickel to the other base metals indicate that the anomalous nickel may actually be due to nickel mineralization, which is known to occur in the Atlin area. Or, perhaps, the nickel may be reflecting both nickel mineralization and basic/ultra-basic rock-types since nickel mineralization usually occurs within basic/ultra-basic rock-types.
The main part of the anomaly occurs at, and to the west of the MMI and magnetic-suggested lithological contact. In other words, for the most part, the causative source of anomaly D does not occur within the suggested acidic intrusive, but only within the Kedahda Formation.
18

A smaller anomaly with approximate dimensions of 100 meters by 250 meters occurs to the southeast of anomaly D. It has similar characteristics as anomaly D and also abuts the western boundary of the suggested acidic intrusive.
Anomaly E is the second important base metal anomaly. It consists of similar metals as anomaly D and thus is also strongly suggestive of porphyry-style mineralization. As in anomaly D, the strongest metal from an MMI point of view is molybdenum with copper, zinc and nickel also being very high. It also contains anomalous results in gold, silver, lead, antimony, and arsenic. In fact, the gold results are the second strongest within the grid area, after anomaly A, the strongest part occurring on the east side of anomaly E.
As in anomaly D, anomaly E also appears to strike east-west with it being centered at about 4200N on lines 97000E to 98100E. It therefore has a minimum strike length of 1100 meters with it being open to the west. The width could be up to 500 meters as is suggested on line 97600E.
However, the width is somewhat difficult to ascertain because of the close occurrences of anomalies F and G. In fact, in places, what has been attributed to anomalies F and G may actually be part of E. For example, on line 97200E, anomalies E and G appear to be the same anomaly and on line 98100, anomalies E and F appear to be the same anomaly. This therefore suggests the possibility that anomaly E actually strikes northwest-southeast. The difficulty of trying to determine strike and size is due to the 200-meter line spacing and thus further MMI soil sampling should be done across anomalies E, F and G.
The causative source of anomaly E also appears to be hosted by chert, argillite and/or siliclastic rocks of the Kedahda Formation. And like anomaly D, the east end of anomaly E occurs at an MMI-suggested lithological contact with the east side of the contact being an acidic intrusive.
Anomalies F and G are two base metal anomalies that strike in a northeasterly direction sub-parallel to the two main faults. They are narrower, more lineal-shaped anomalies, and thus may be structurally controlled. However, each of these two anomalies consists of the same base metals as anomalies D and E.
Anomaly F occurs to the southeast of anomaly E, has a strike length of 800 meters, though there is evidence that it could be longer, and has a width of 50 to 150 meters. The northeastern end of anomaly F ends at the MMI-suggested lithological contact.
Anomaly G occurs to the northwest of anomaly E, has a minimum strike length of 1200 meters, with it being open to the southwest and northeast, and has a width of 50 to 200 meters.
Both anomalies occur within the chert, argillite and/or siliclastic rocks of the Kedahda Formation.
19
SELECTED BIBLIOGRAPHY
Aitken, J.K. (1959) Atlin Map-Area, British Columbia; Geological Survey of Canada Memoir 307, Ottawa 89pp
Ash, Chris (2002) Exploration Guidelines for Gold-quartz Veins in the Canada-US Cordillera, Canadian Institute of Mining, Metallurgy and Petroleum Technical Library.
DeLong, R.C., Haslinger, R.J. (1996). Babs Claim Group 1995 Line-Cutting, Geochemical Sampling, Geological Mapping, 1995-1996 Geophysical Survey and Drill Programs Assessment Report. For Northern Dynasty Minerals, Ltd. - Assessment Report 24-560.
Gwillim, J.C. (1901) Report on the Atlin Mining District British Columbia, Report No 743, Geological Survey of Canada, Ottawa 47pp plus two maps
Levson, V.M., D.E. Kerr, C. Lowe, and H. Blyth (2003) Quaternary Geology of the Atlin, Area, British Columbia, Geological Survey of Canada Open File 1562 Map, 1:50 000 scale
Monger, J.W.H. (1975) Upper Palaeozoic Rocks of the Atlin Terrain, North-western British Columbia and South-Central Yukon, Geological Survey of Canada Paper 74-47, 63pp.
Sack, Patrick J.; and Mitchell G. Mihalynuk (2004) Proximal gold-cassiterite nuggets and the composition of the Feather Creek placer gravels: clues to a lode source near Atlin B.C., in Geological Fieldwork 2003, British Columbia Ministry of Energy and Mines, Paper 2004-1, p 147-161
Sneddon, D.T. (2001) Gopher Creek (104N) Preliminary Site Evaluation; unpubl. Report to Western Site Technologies Inc. 245 Scenic View Close N.W., Calgary, Alberta Canada T3L 1Y5, 7pp plus data appendices
Sneddon, D.T. (2002) Report of Assessment Work Performed on the Gopher Mine Property Lode Claims, Atlin Mining District, British Columbia; unpubl. Report to Mr. & Mrs. Dale Halstead, 1811 Pine Avenue, Alva Florida, USA 33920; 12pp plus data appendices
Sneddon, D.T. (2003) Mineral Resources of the Gopher Mine, Atlin Mining District, British Columbia, unpubl. Report to Mr. & Mrs. Dale Halstead, 1811 Pine Avenue, Alva Florida, USA 33920; 6 pp plus data appendices
Sneddon, D.T. (2003) Teslin Plateau Lode Gold Project, Atlin Mining District, British Columbia, unpubl. Report to Mr. & Mrs. Dale Halstead, 1811 Pine Avenue, Alva Florida, USA 33920; 6 pp plus data appendices (Copyright 2004 by D.T. Sneddon, P.Geol.; P.Geo.; 31 Hawkfield Way N.W., Calgary, Alberta Canada T3G 2G8)
20

Sneddon, D.T. (2005) Exploration Report on Claims Babs1 – Babs 3 and Fraser and Fraser 2, 2004 Assessment Activities, Atlin Mining Division, British Columbia, for Jason Heywood, Marmot Research Inc – Assessment Report Number 27852
21

GEOPHYSICIST’S CERTIFICATE
I, DAVID G. MARK, of the City of Surrey, in the Province of British Columbia, do hereby certify that:
I am registered as a Professional Geoscientist with the Association of Professional Engineers and Geoscientists of the Province of British Columbia.
I am a Consulting Geophysicist of Geotronics Consulting Inc, with offices at 6204 – 125th Street, Surrey, British Columbia.
I further certify that:
1. I am a graduate of the University of British Columbia (1968) and hold a B.Sc. degree in Geophysics.
2. I have been practicing my profession for the past 41 years, and have been active in the mining industry for the past 44 years.
3. This report is compiled from data obtained from an MMI soil geochemistry survey and a magnetic geophysical survey carried out by a crew of Geotronics Consulting supervised by me over a grid within the Babs Property located near Babine Lake and located 190 km northeast of the town of Smithers, within the Omineca Mining Division of British Columbia. The work was done during the period of June 9th to August 12th, 2008.
4. I do not hold any interest in Kendrich Eskay Mining Corp, nor in the property discussed in this report, nor in any other property held by this company, nor do I expect to receive any interest as a result of writing this report.
David G. Mark, P.Geo. May 8th, 2009 Geophysicist
22

AFFIDAVIT OF EXPENSES
Grid emplacement as well as magnetic surveying and MMI soil sampling were carried out over the Babs Property, which occurs on Feather Creek, a tributary of O’Donnel River, and which is located 23.5 km due east of the village of Atlin, B.C. This work was done during the period of September 10th, 2007 to January 30th, 2008, and to the value of the following:
FIELD (Grid Emplacement, MMI Soil Sampling, Magnetic Surveying): Mob/demob share, (at cost) $ 5,828.00 MMI Survey, 5-man crew, 8 days @ $1,850/day 14,800.00 MMI Survey, 6-man crew, 9 days @ $2,150/day 19,350.00 Courier costs for sample shipping to Toronto 1,456.00 TOTAL $40,434.00 $40,434.00 LABORATORY: Laboratory testing of 1,017 samples @ $37/sample $37,629.00 $37,629.00 DATA REDUCTION and REPORT: Data reduction, 125 hours @ $50/hour $6,250.00 Report $4,000.00
TOTAL $10,250.00 $10,250.00
GRAND TOTAL $255,634.00
Respectfully submitted, Geotronics Consulting Inc.
David G. Mark, P.Geo, Geophysicist ................................................................................................... May 8, 2009
23

24
APPENDIX –GEOCHEMISTRY DATA

Map Center: 54.1743N 122.4235W Map Center: 54.1743N 122.4235W Map Center: 54.1743N 122.4235W Map Center: 54.1743N 122.4235W Map Center: 54.1743N 122.4235W
Babs PropertyBabs PropertyBabs PropertyBabs PropertyBabs Property
Abbotsford
Armstrong
Burnaby
Castlegar
Colwood
Coquitlam Courtenay
Cranbrook
Dawson Creek
Duncan
Enderby
Fort St. John
Grand Forks Greenwood
Kelowna Kimberley Merritt
Penticton
Port Alberni
Prince George
Prince Rupert
Quesnel
Revelstoke
Terrace
Victoria
Williams Lake
KENRICH-ESKAY MINING CORP.
BABS PROPERTYBABINE LAKE AREA, OMINECA MD, BC
BC LOCATION MAP
DRAWN BY:
DGM
JOB NO.:
08-12
NTS:93K/1393L/1693M/01
DATE:
April 09
FIG NO.:
1
Geotronics
GEOTRONICS CONSULTING INC.SURREY B.C.

Map Center: 54.3481N 124.8541WMap Center: 54.3481N 124.8541WMap Center: 54.3481N 124.8541WMap Center: 54.3481N 124.8541WMap Center: 54.3481N 124.8541W
Baldy Hughes
Barrett Lake
Bear Lake
Braeside
Burns Lake
Decker Lake
Donald Landing
Driftwood Creek
EndakoEngen
Foreman
Fort Babine
Fort Fraser
Fort St. James
François Lake
Grand Rapids
Granisle
Hixo
Houston
Leo Creek
Mackenzie
McLeod Lake
Middle River
North Bulkley
Palling
Perow
Quick
Red Ro
Reid Lake
Rose Lake
Sheraton
Smithers
Southbank
Stellako
Stoner
Strathnaver
Summit
SunnysideTachie
Tchesinkut Lake
Telkwa
Tintagel
Topley
Topley Landing
Vanderhoof
Woodp
KENRICH-ESKAY MINING CORP.
BABS PROPERTYBABINE LAKE AREA, OMINECA MD, BC
ACCESS LOCATION MAP
DRAWN BY:
DGM
JOB NO.:
08-12
NTS:
93K/13,‘L/16,’M/01
DATE:
April 09
FIG NO.:
2
N
Geotronics
GEOTRONICS CONSULTING INC.SURREY B.C.
Prince George
5 25 50
kilometersB
abin
eLake
Trem
bleur
Stu
art Lake
Lake
Ootsa Lake

Map Center: 54.9582N 126.0581W Map Center: 54.9582N 126.0581W Map Center: 54.9582N 126.0581W Map Center: 54.9582N 126.0581W Map Center: 54.9582N 126.0581W
Granisle
Topley Landing
093M.018 093N.011 093N.012093M.019 093M.020
093M.008 093M.009 093M.010 093N.001 093N.002
093L.098 093L.100 093K.092093L.099 093K.091
093K.082093L.088 093L.089 093K.081093L.090
093L.078 093L.079 093K.071 093K.072
KENRICH-ESKAY MINING CORP.
BABS PROPERTYBABINE LAKE AREA, OMINECA MD, BC
CLAIM MAPwith grid
DRAWN BY:
DGM
JOB NO.:
08-12
NTS:93K/1393L/1693M/01
DATE:
April 09
FIG NO.:
3a
N
Geotronics
GEOTRONICS CONSULTING INC.SURREY B.C.
1 5 10
kilometers
Babin
e Lake
Tochcha Lake
Natowite Lake
Fulton Lake

Map Center: 54.8628N 126.0161W Map Center: 54.8628N 126.0161W Map Center: 54.8628N 126.0161W Map Center: 54.8628N 126.0161W Map Center: 54.8628N 126.0161W
535998535998535998535998535998
535999535999535999535999535999
536002536002536002536002536002
536003536003536003536003536003
570504570504570504570504570504
570505570505570505570505570505570506570506570506570506570506570507570507570507570507570507
570508570508570508570508570508
570513570513570513570513570513
570514570514570514570514570514
570515570515570515570515570515
570517570517570517570517570517
570541570541570541570541570541
5705457054570545705457054
57054357054357054357054357054
570559570559570559570559570559
570560570560570560570560570560
110
0
1000
900
900
900
900
900
800
800
800
1100
100
0
100
0
1000
1000
900
1200
1100
1100
1000
1200
1200
1200
1200
093K.081093L.090
68
70
00
68
80
00
69
00
00
69
10
00
69
20
00
6086000
6083000
6082000
31
00
00
6086000
6085000
6081000
Geotronics
GEOTRONICS CONSULTING INC.SURREY B.C.
100 500 1000meters
N
KENRICH-ESKAY MINING CORP.
BABS PROPERTYBABINE LAKE AREA, OMINECA MD, BC
DETAIL CLAIM MAPwith grid
DRAWN BY:
DGM
JOB NO.:
08-12
NTS:93K/1393L/1693M/01
DATE:
April 09
FIG NO.:
3b

Granisle
Topley Landing
MARY ANN
TACHI
NEWMANGRANISLE
O
MINE
ALP
THEZAR 75 (WEST)THEZAR 81 (EAST)
CORTINA
TOTEM
HAGTREK
MAG
RED
DONNA
FG
BADGE
KETZA KARE
SAT
PRO
JILL
JACOB
CART
CALCITE
GOLD DUST
BABS
BELL MAG
SNOOPY
OLD FORT
JAKE
HEARNE HILL
MORRISON
WOLF
BAB
FORT
FIREWEED
NEWMAN NORTH
SPARROWHAWK
COPPER 1-4
LUCY
Geotronics
GEOTRONICS CONSULTING INC.SURREY B.C.
N
KENRICH-ESKAY MINING CORP.
BABS PROPERTYBABINE LAKE AREA, OMINECA MD, BC
GEOLOGY MAP
DRAWN BY:
DGM
JOB NO.:
08-12
NTS:93K/1393L/1693M/01
DATE:
Jan 09
FIG NO.:
4a
1 5 10
kilometers

KENRICH-ESKAY MINING CORP.
BABS PROPERTYBABINE LAKE AREA, OMINECA MD, BC
GEOLOGY MAP LEGEND
DRAWN BY:
DGM
JOB NO.:
08-12
NTS:93K/1393L/1693M/01
DATE:
Jan 09
FIG NO.:
4bGeotronics
GEOTRONICS CONSULTING INC.SURREY B.C.
Early Permian to Middle Triassic greenstone, greenschist metamorphics rocks
Late Triassic mudstone, siltstone, shale fine clastic sedimetnary rocks
Late Triassic to Early Jurassic granodioritic intrusive rocks
Late Triassic to Early Jurassic dioritic intrusive rocks
Early Jurassic argillite, greywacke, conglomerate turbidites
Early to Middle Jurassic coarse volcaniclastic and pyroclastic volcanic rocks
Early to Middle Jurassic dioritic intrusive rocks
Early Jurassic andesitic volcanic rocks
Middle Jurassic syenitic to monzonitic intrusive rocks
Early to Middle Jurassic undivided volcanic rocks
Late Pennsylvanian to Late Triassic serpentinite ultramafic rocks
Late Triassic to Early Jurassic undivided sedementary rocks
Eocene coarse volcaniclastic and pyroclastic volcanic rocks
Eocene conglomerate, coarse clastic sedimentary rocks
Eocene basaltic volcanic rocks
Early Cretaceous undivided sedementary rocks
Middle Jurassic marine sedimentary and volcanic rocks

50
60
70
80
90
100es
pons
e R
atio
Zn Co Ag Au CuKENRICH-ESKAY MINING CORP.
BABS PROPERTYBabine Lake Area, Omineca M.D., BC
MMI SOIL SAMPLINGResponse Ratio - Histogram
Line 100E
0
10
20
30
40
Re
Survey Station
Data Reduced by : GEOTRONICS CONSULTING INC

50
60
70
80
90
100es
pons
e R
atio
Zn Co Ag Au Cu KENRICH-ESKAY MINING CORP.BABS PROPERTY
Babine Lake Area, Omineca M.D., BCMMI SOIL SAMPLING
Response Ratio - HistogramLine 200E
0
10
20
30
40
Re
Survey Station
Data Reduced by : GEOTRONICS CONSULTING INC

50
60
70
80
90
100es
pons
e R
atio
Zn Co Ag Au CuKENRICH-ESKAY MINING CORP.
BABS PROPERTYBabine Lake Area, Omineca M.D., BC
MMI SOIL SAMPLINGResponse Ratio - Histogram
Line 300E
0
10
20
30
40
Re
Survey Station
Data Reduced by : GEOTRONICS CONSULTING INC

50
60
70
80
90
100es
pons
e R
atio
Zn Co Ag Au CuKENRICH-ESKAY MINING CORP.
BABS PROPERTYBabine Lake Area, Omineca M.D., BC
MMI SOIL SAMPLINGResponse Ratio - Histogram
0
10
20
30
40
Re
Survey Station
Data Reduced by : GEOTRONICS CONSULTING INC

50
60
70
80
90
100es
pons
e R
atio
Zn Co Ag Au CuKENRICH-ESKAY MINING CORP.
BABS PROPERTYBabine Lake Area, Omineca M.D., BC
MMI SOIL SAMPLINGResponse Ratio - Histogram
Line 500E
0
10
20
30
40
Re
Survey Station
Data Reduced by : GEOTRONICS CONSULTING INC

50
60
70
80
90
100es
pons
e R
atio
Zn Co Ag Au CuKENRICH-ESKAY MINING CORP.
BABS PROPERTYBabine Lake Area, Omineca M.D., BC
MMI SOIL SAMPLINGResponse Ratio - Histogram
Line 600E
0
10
20
30
40
Re
Survey Station
Data Reduced by : GEOTRONICS CONSULTING INC

50
60
70
80
90
100es
pons
e R
atio
Zn Co Ag Au CuKENRICH-ESKAY MINING CORP.
BABS PROPERTYBabine Lake Area, Omineca M.D., BC
MMI SOIL SAMPLINGResponse Ratio - Histogram
Line 700E
0
10
20
30
40
Re
Survey Station
Data Reduced by : GEOTRONICS CONSULTING INC

50
60
70
80
90
100es
pons
e R
atio
Zn Co Ag Au Cu KENRICH-ESKAY MINING CORP.BABS PROPERTY
Babine Lake Area, Omineca M.D., BCMMI SOIL SAMPLING
Response Ratio - Histogram
0
10
20
30
40
Re
Survey Station
Data Reduced by : GEOTRONICS CONSULTING INC

50
60
70
80
90
100es
pons
e R
atio
Zn Co Ag Au Cu KENRICH-ESKAY MINING CORP.BABS PROPERTY
Babine Lake Area, Omineca M.D., BCMMI SOIL SAMPLING
Response Ratio - HistogramLine 900E
0
10
20
30
40
Re
Survey Station
Data Reduced by : GEOTRONICS CONSULTING INC

50
60
70
80
90
100es
pons
e R
atio
Zn Co Ag Au CuKENRICH-ESKAY MINING CORP.
BABS PROPERTYBabine Lake Area, Omineca M.D., BC
MMI SOIL SAMPLINGResponse Ratio - Histogram
Line 1000E
0
10
20
30
40
Re
Survey Station
Data Reduced by : GEOTRONICS CONSULTING INC

50
60
70
80
90
100es
pons
e R
atio
Zn Co Ag Au CuKENRICH-ESKAY MINING CORP.
BABS PROPERTYBabine Lake Area, Omineca M.D., BC
MMI SOIL SAMPLINGResponse Ratio - Histogram
0
10
20
30
40
Re
Survey Station
Data Reduced by : GEOTRONICS CONSULTING INC

50
60
70
80
90
100es
pons
e R
atio
Zn Co Ag Au CuKENRICH-ESKAY MINING CORP.
BABS PROPERTYBabine Lake Area, Omineca M.D., BC
MMI SOIL SAMPLINGResponse Ratio - Histogram
0
10
20
30
40
Re
Survey Station
Data Reduced by : GEOTRONICS CONSULTING INC

50
60
70
80
90
100es
pons
e R
atio
Zn Co Ag Au CuKENRICH-ESKAY MINING CORP.
BABS PROPERTYBabine Lake Area, Omineca M.D., BC
MMI SOIL SAMPLINGResponse Ratio - Histogram
0
10
20
30
40
Re
Survey Station
Data Reduced by : GEOTRONICS CONSULTING INC

50
60
70
80
90
100es
pons
e R
atio
Zn Co Ag Au CuKENRICH-ESKAY MINING CORP.
BABS PROPERTYBabine Lake Area, Omineca M.D., BC
MMI SOIL SAMPLINGResponse Ratio - Histogram
Line 1400E
0
10
20
30
40
Re
Survey Station
Data Reduced by : GEOTRONICS CONSULTING INC

50
60
70
80
90
100es
pons
e R
atio
Zn Co Ag Au CuKENRICH-ESKAY MINING CORP.
BABS PROPERTYBabine Lake Area, Omineca M.D., BC
MMI SOIL SAMPLINGResponse Ratio - Histogram
0
10
20
30
40
Re
Survey Station
Data Reduced by : GEOTRONICS CONSULTING INC

50
60
70
80
90
100es
pons
e R
atio
Zn Co Ag Au CuKENRICH-ESKAY MINING CORP.
BABS PROPERTYBabine Lake Area, Omineca M.D., BC
MMI SOIL SAMPLINGResponse Ratio - Histogram
0
10
20
30
40
Re
Survey Station
Data Reduced by : GEOTRONICS CONSULTING INC

50
60
70
80
90
100es
pons
e R
atio
Zn Co Ag Au CuKENRICH-ESKAY MINING CORP.
BABS PROPERTYBabine Lake Area, Omineca M.D., BC
MMI SOIL SAMPLINGResponse Ratio - Histogram
0
10
20
30
40
Re
Survey Station
Data Reduced by : GEOTRONICS CONSULTING INC

50
60
70
80
90
100es
pons
e R
atio
Zn Co Ag Au CuKENRICH-ESKAY MINING CORP.
BABS PROPERTYBabine Lake Area, Omineca M.D., BC
MMI SOIL SAMPLINGResponse Ratio - Histogram
Line 1800E
0
10
20
30
40
Re
Survey Station
Data Reduced by : GEOTRONICS CONSULTING INC

50
60
70
80
90
100es
pons
e R
atio
Zn Co Ag Au CuKENRICH-ESKAY MINING CORP.
BABS PROPERTYBabine Lake Area, Omineca M.D., BC
MMI SOIL SAMPLINGResponse Ratio - Histogram
Line 1900E
0
10
20
30
40
Re
Survey Station
Data Reduced by : GEOTRONICS CONSULTING INC

50
60
70
80
90
100es
pons
e R
atio
Zn Co Ag Au CuKENRICH-ESKAY MINING CORP.
BABS PROPERTYBabine Lake Area, Omineca M.D., BC
MMI SOIL SAMPLINGResponse Ratio - Histogram
Line 2000E
0
10
20
30
40
Re
Survey Station
Data Reduced by : GEOTRONICS CONSULTING INC

50
60
70
80
90
100es
pons
e R
atio
Zn Co Ag Au CuKENRICH-ESKAY MINING CORP.
BABS PROPERTYBabine Lake Area, Omineca M.D., BC
MMI SOIL SAMPLINGResponse Ratio - Histogram
0
10
20
30
40
Re
Survey Station
Data Reduced by : GEOTRONICS CONSULTING INC
50
60
70
80
90
100es
pons
e R
atio
Pb Ni Ce Cd CuKENRICH-ESKAY MINING CORP.
BABS PROPERTYBabine Lake Area, Omineca M.D., BC
MMI SOIL SAMPLINGResponse Ratio - Histogram
Line 100E
0
10
20
30
40
Re
Survey Station
Data Reduced by : GEOTRONICS CONSULTING INC

50
60
70
80
90
100es
pons
e R
atio
Pb Ni Ce Cd CuKENRICH-ESKAY MINING CORP.
BABS PROPERTYBabine Lake Area, Omineca M.D., BC
MMI SOIL SAMPLINGResponse Ratio - Histogram
Line 200E
0
10
20
30
40
Re
Survey Station
Data Reduced by : GEOTRONICS CONSULTING INC

50
60
70
80
90
100es
pons
e R
atio
Pb Ni Ce Cd CuKENRICH-ESKAY MINING CORP.
BABS PROPERTYBabine Lake Area, Omineca M.D., BC
MMI SOIL SAMPLINGResponse Ratio - Histogram
Line 300E
0
10
20
30
40
Re
Survey Station
Data Reduced by : GEOTRONICS CONSULTING INC
50
60
70
80
90
100es
pons
e R
atio
Pb Ni Ce Cd CuKENRICH-ESKAY MINING CORP.
BABS PROPERTYBabine Lake Area, Omineca M.D., BC
MMI SOIL SAMPLINGResponse Ratio - Histogram
Line 400E
0
10
20
30
40
Re
Survey Station
Data Reduced by : GEOTRONICS CONSULTING INC

50
60
70
80
90
100es
pons
e R
atio
Pb Ni Ce Cd CuKENRICH-ESKAY MINING CORP.
BABS PROPERTYBabine Lake Area, Omineca M.D., BC
MMI SOIL SAMPLINGResponse Ratio - Histogram
Line 500E
0
10
20
30
40
Re
Survey Station
Data Reduced by : GEOTRONICS CONSULTING INC

50
60
70
80
90
100es
pons
e R
atio
Pb Ni Ce Cd CuKENRICH-ESKAY MINING CORP.
BABS PROPERTYBabine Lake Area, Omineca M.D., BC
MMI SOIL SAMPLINGResponse Ratio - Histogram
Line 600E
0
10
20
30
40
Re
Survey Station
Data Reduced by : GEOTRONICS CONSULTING INC

50
60
70
80
90
100es
pons
e R
atio
Pb Ni Ce Cd CuKENRICH-ESKAY MINING CORP.
BABS PROPERTYBabine Lake Area, Omineca M.D., BC
MMI SOIL SAMPLINGResponse Ratio - Histogram
Line 700E
0
10
20
30
40
Re
Survey Station
Data Reduced by : GEOTRONICS CONSULTING INC

50
60
70
80
90
100es
pons
e R
atio
Pb Ni Ce Cd CuKENRICH-ESKAY MINING CORP.
BABS PROPERTYBabine Lake Area, Omineca M.D., BC
MMI SOIL SAMPLINGResponse Ratio - Histogram
Line 800E
0
10
20
30
40
Re
Survey Station
Data Reduced by : GEOTRONICS CONSULTING INC

50
60
70
80
90
100es
pons
e R
atio
Pb Ni Ce Cd CuKENRICH-ESKAY MINING CORP.
BABS PROPERTYBabine Lake Area, Omineca M.D., BC
MMI SOIL SAMPLINGResponse Ratio - Histogram
Line 900E
0
10
20
30
40
Re
Survey Station
Data Reduced by : GEOTRONICS CONSULTING INC

50
60
70
80
90
100es
pons
e R
atio
Pb Ni Ce Cd CuKENRICH-ESKAY MINING CORP.
BABS PROPERTYBabine Lake Area, Omineca M.D., BC
MMI SOIL SAMPLINGResponse Ratio - Histogram
Line 1000E
0
10
20
30
40
Re
Survey Station
Data Reduced by : GEOTRONICS CONSULTING INC

50
60
70
80
90
100es
pons
e R
atio
Pb Ni Ce Cd CuKENRICH-ESKAY MINING CORP.
BABS PROPERTYBabine Lake Area, Omineca M.D., BC
MMI SOIL SAMPLINGResponse Ratio - Histogram
Line 1100E
0
10
20
30
40
Re
Survey Station
Data Reduced by : GEOTRONICS CONSULTING INC

50
60
70
80
90
100es
pons
e R
atio
Pb Ni Ce Cd CuKENRICH-ESKAY MINING CORP.
BABS PROPERTYBabine Lake Area, Omineca M.D., BC
MMI SOIL SAMPLINGResponse Ratio - Histogram
Line 1200E
0
10
20
30
40
Re
Survey Station
Data Reduced by : GEOTRONICS CONSULTING INC
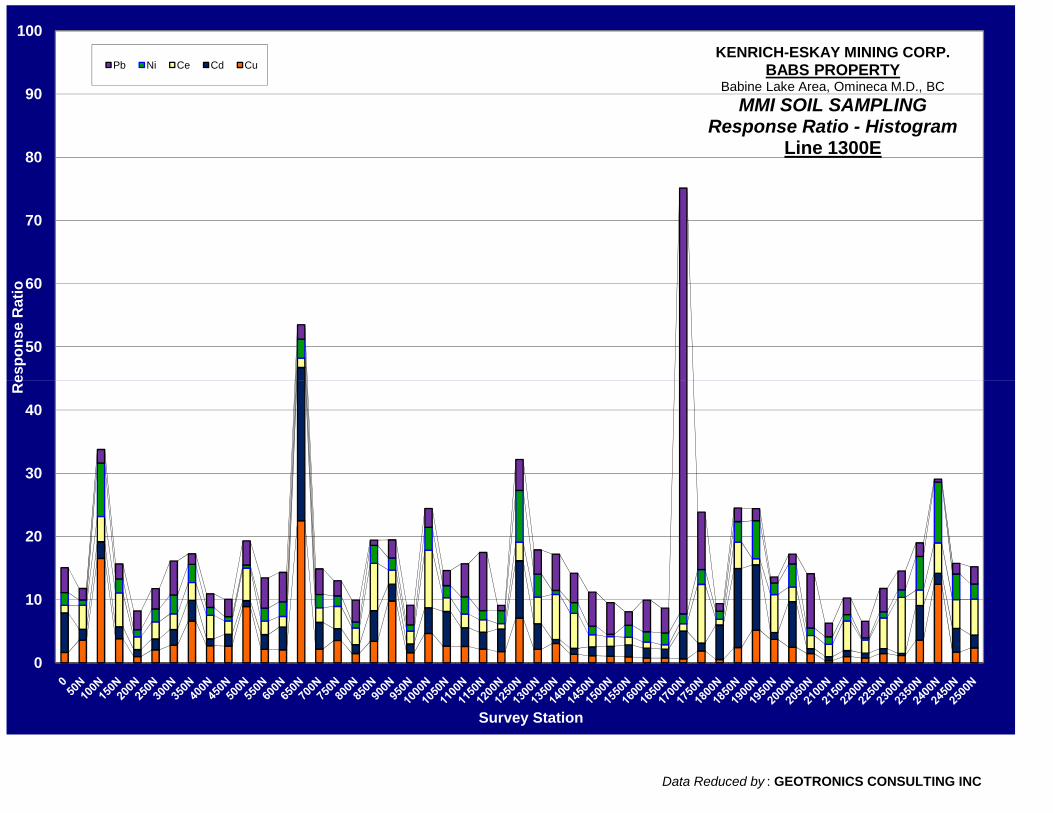
50
60
70
80
90
100es
pons
e R
atio
Pb Ni Ce Cd CuKENRICH-ESKAY MINING CORP.
BABS PROPERTYBabine Lake Area, Omineca M.D., BC
MMI SOIL SAMPLINGResponse Ratio - Histogram
Line 1300E
0
10
20
30
40
Re
Survey Station
Data Reduced by : GEOTRONICS CONSULTING INC
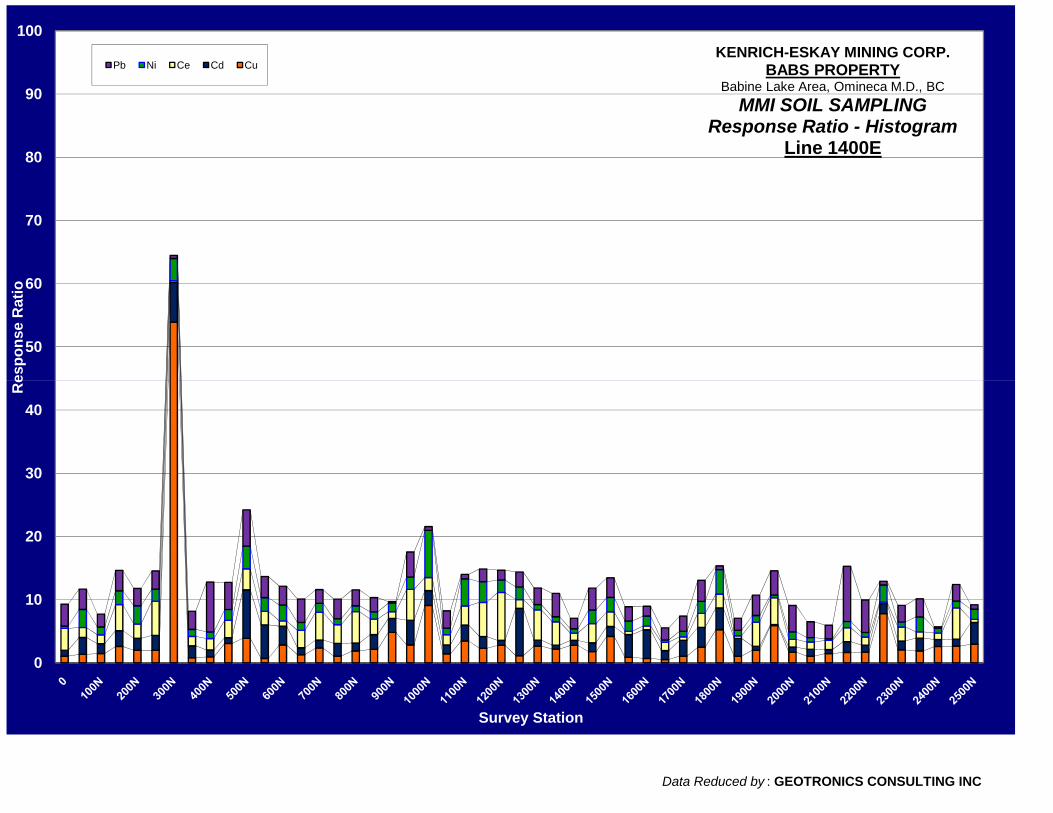
50
60
70
80
90
100es
pons
e R
atio
Pb Ni Ce Cd CuKENRICH-ESKAY MINING CORP.
BABS PROPERTYBabine Lake Area, Omineca M.D., BC
MMI SOIL SAMPLINGResponse Ratio - Histogram
Line 1400E
0
10
20
30
40
Re
Survey Station
Data Reduced by : GEOTRONICS CONSULTING INC

50
60
70
80
90
100es
pons
e R
atio
Pb Ni Ce Cd CuKENRICH-ESKAY MINING CORP.
BABS PROPERTYBabine Lake Area, Omineca M.D., BC
MMI SOIL SAMPLINGResponse Ratio - Histogram
Line 1500E
0
10
20
30
40
Re
Survey Station
Data Reduced by : GEOTRONICS CONSULTING INC

50
60
70
80
90
100es
pons
e R
atio
Pb Ni Ce Cd CuKENRICH-ESKAY MINING CORP.
BABS PROPERTYBabine Lake Area, Omineca M.D., BC
MMI SOIL SAMPLINGResponse Ratio - Histogram
Line 1600E
0
10
20
30
40
Re
Survey Station
Data Reduced by : GEOTRONICS CONSULTING INC

50
60
70
80
90
100es
pons
e R
atio
Pb Ni Ce Cd CuKENRICH-ESKAY MINING CORP.
BABS PROPERTYBabine Lake Area, Omineca M.D., BC
MMI SOIL SAMPLINGResponse Ratio - Histogram
Line 1700E
0
10
20
30
40
Re
Survey Station
Data Reduced by : GEOTRONICS CONSULTING INC

50
60
70
80
90
100es
pons
e R
atio
Pb Ni Ce Cd CuKENRICH-ESKAY MINING CORP.
BABS PROPERTYBabine Lake Area, Omineca M.D., BC
MMI SOIL SAMPLINGResponse Ratio - Histogram
Line 1800E
0
10
20
30
40
Re
Survey Station
Data Reduced by : GEOTRONICS CONSULTING INC

50
60
70
80
90
100es
pons
e R
atio
Pb Ni Ce Cd CuKENRICH-ESKAY MINING CORP.
BABS PROPERTYBabine Lake Area, Omineca M.D., BC
MMI SOIL SAMPLINGResponse Ratio - Histogram
Line 1900E
0
10
20
30
40
Re
Survey Station
Data Reduced by : GEOTRONICS CONSULTING INC
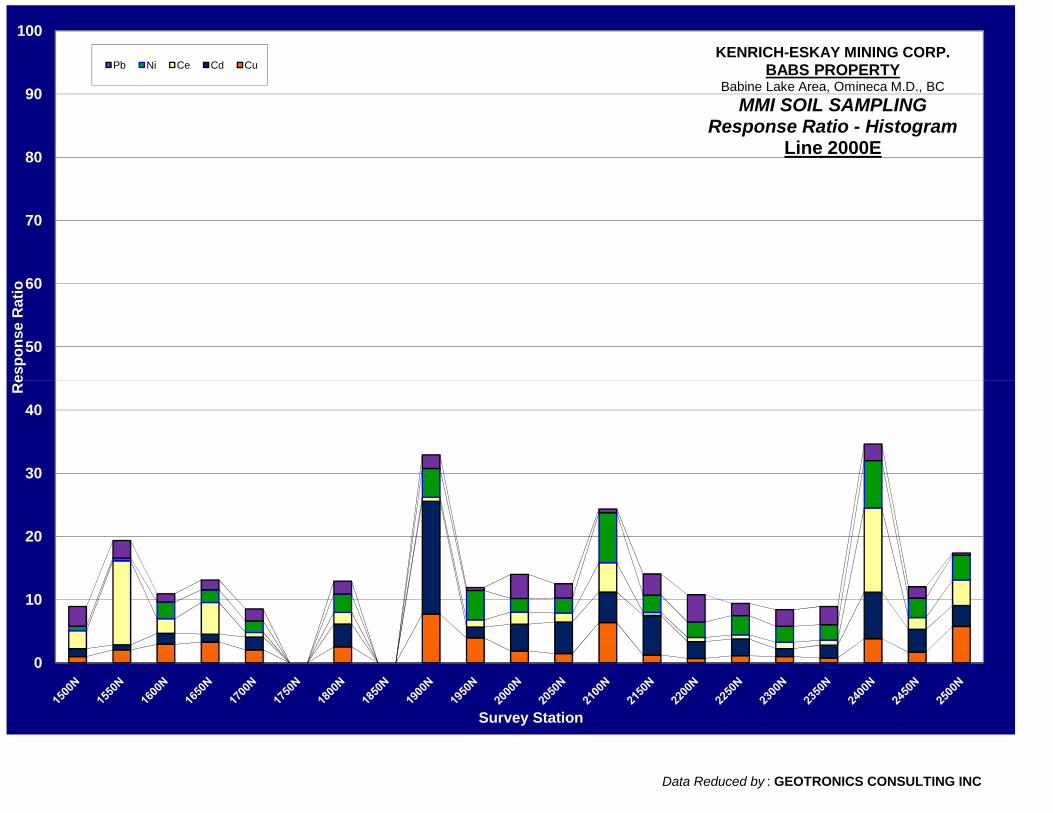
50
60
70
80
90
100es
pons
e R
atio
Pb Ni Ce Cd CuKENRICH-ESKAY MINING CORP.
BABS PROPERTYBabine Lake Area, Omineca M.D., BC
MMI SOIL SAMPLINGResponse Ratio - Histogram
Line 2000E
0
10
20
30
40
Re
Survey Station
Data Reduced by : GEOTRONICS CONSULTING INC

50
60
70
80
90
100es
pons
e R
atio
Pb Ni Ce Cd CuKENRICH-ESKAY MINING CORP.
BABS PROPERTYBabine Lake Area, Omineca M.D., BC
MMI SOIL SAMPLINGResponse Ratio - Histogram
Line 2100E
0
10
20
30
40
Re
Survey Station
Data Reduced by : GEOTRONICS CONSULTING INC