Embed Size (px)
Citation preview
Exploration & Production
59
Our Goals and Agenda
Demonstrate clear progress on performance
Describe our path to become “Top Tier”
Detailed review of operations
Confirm performance expectations
60
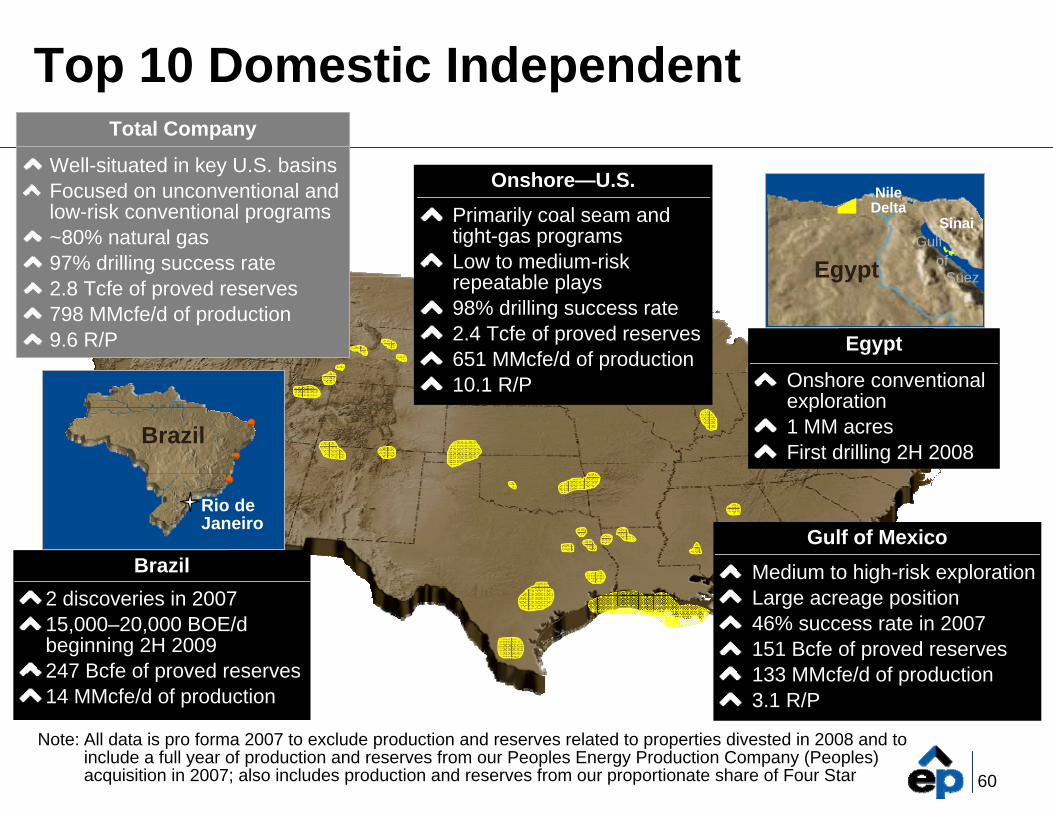
Top 10 Domestic Independent
Note: All data is pro forma 2007 to exclude production and reserves related to properties divested in 2008 and to include a full year of production and reserves from our Peoples Energy Production Company (Peoples) acquisition in 2007; also includes production and reserves from our proportionate share of Four Star
Brazil2 discoveries in 200715,000–20,000 BOE/d beginning 2H 2009247 Bcfe of proved reserves14 MMcfe/d of production
Egypt
Onshore conventional exploration1 MM acresFirst drilling 2H 2008
Egypt
NileDelta
Sinai
EgyptGulf
ofSuez
Total Company
Well-situated in key U.S. basinsFocused on unconventional and low-risk conventional programs~80% natural gas97% drilling success rate2.8 Tcfe of proved reserves798 MMcfe/d of production9.6 R/P
Onshore—U.S.Primarily coal seam and tight-gas programsLow to medium-risk repeatable plays98% drilling success rate2.4 Tcfe of proved reserves651 MMcfe/d of production10.1 R/P
Gulf of MexicoMedium to high-risk explorationLarge acreage position46% success rate in 2007151 Bcfe of proved reserves133 MMcfe/d of production3.1 R/P
Rio de Janeiro
Brazil
61
High Grading Our Portfolio
Divested 309 Bcfe of properties for $845 MM (sales price and assumed asset retirement obligation)—$2.73/Mcfe
Low inventory, high operating costs
Purchased Peoples for $887 MM
End result—more focused; more profitable, faster growing; added 450 total gross drilling locations
62
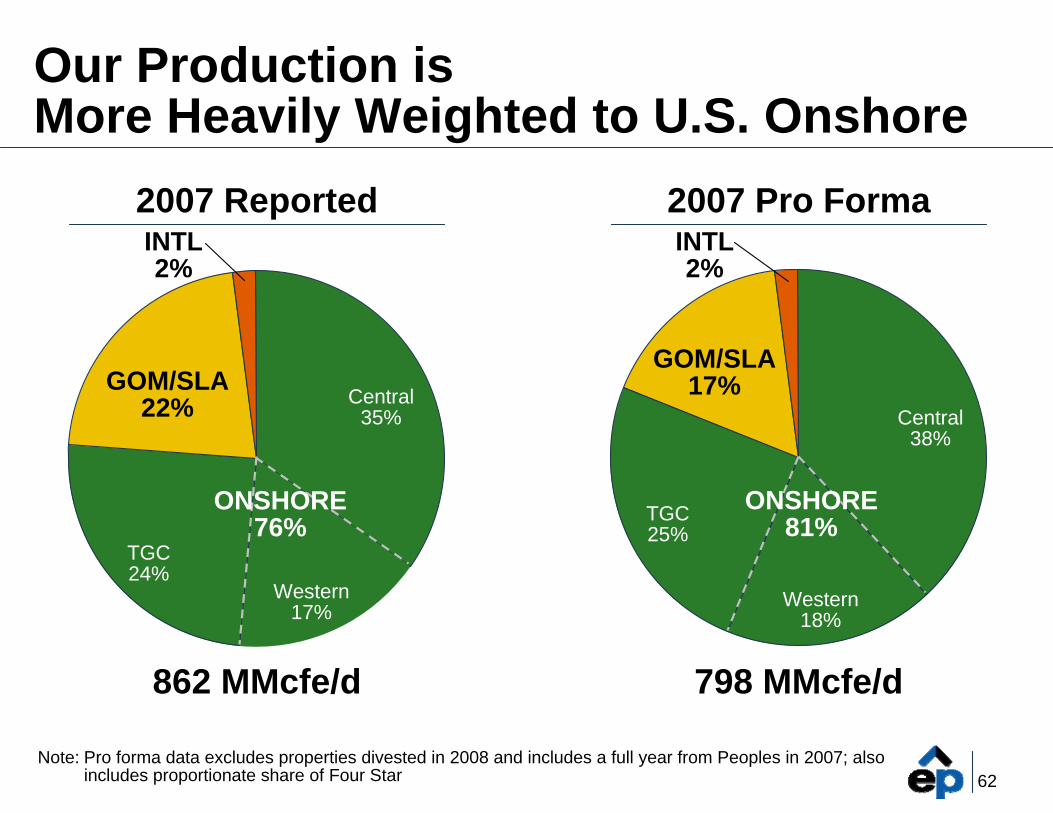
Our Production isMore Heavily Weighted to U.S. Onshore
Central 35%
Western17%
TGC24%
INTL2%
2007 Reported
862 MMcfe/d 798 MMcfe/d
2007 Pro Forma
GOM/SLA22% Central
38%
Western18%
TGC25%
GOM/SLA17%
ONSHORE76%
INTL2%
ONSHORE81%
Note: Pro forma data excludes properties divested in 2008 and includes a full year from Peoples in 2007; also includes proportionate share of Four Star
63
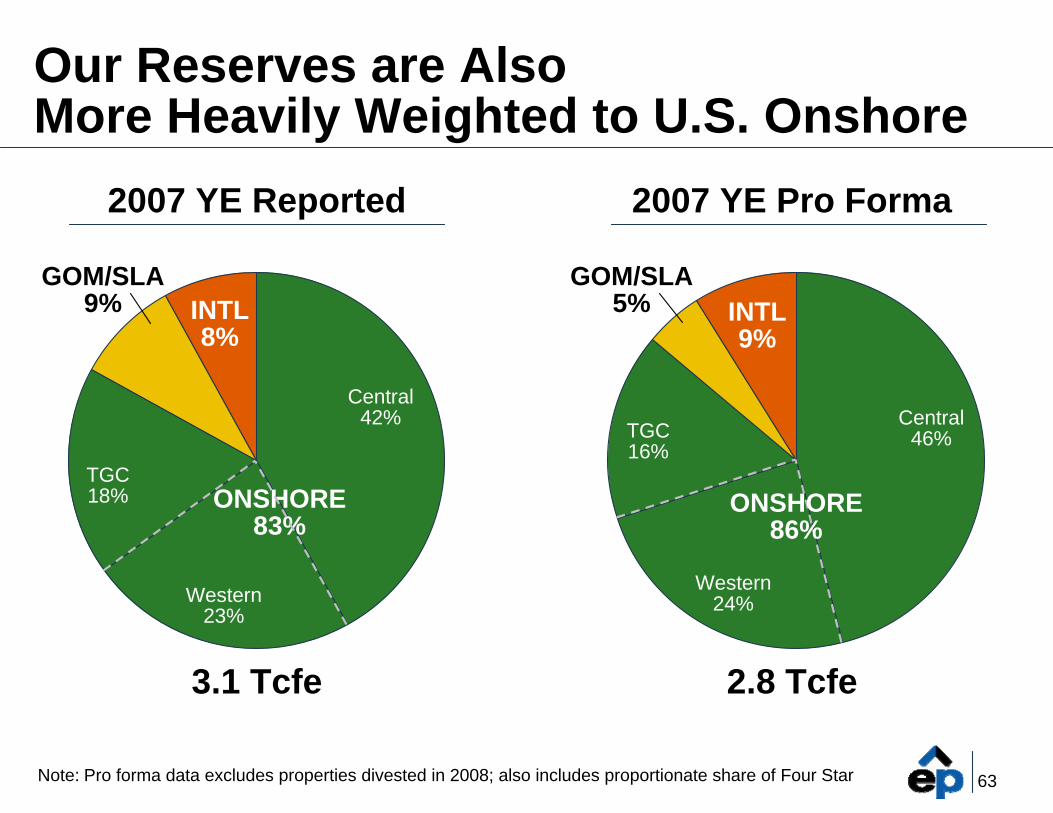
3.1 Tcfe
Our Reserves are AlsoMore Heavily Weighted to U.S. Onshore
Central42%
GOM/SLA9%
TGC18%
INTL8%
Central46%
GOM/SLA5%
TGC16%
INTL9%
2007 YE Reported 2007 YE Pro Forma
2.8 Tcfe
Western23%
Western24%
ONSHORE83%
ONSHORE86%
Note: Pro forma data excludes properties divested in 2008; also includes proportionate share of Four Star
64
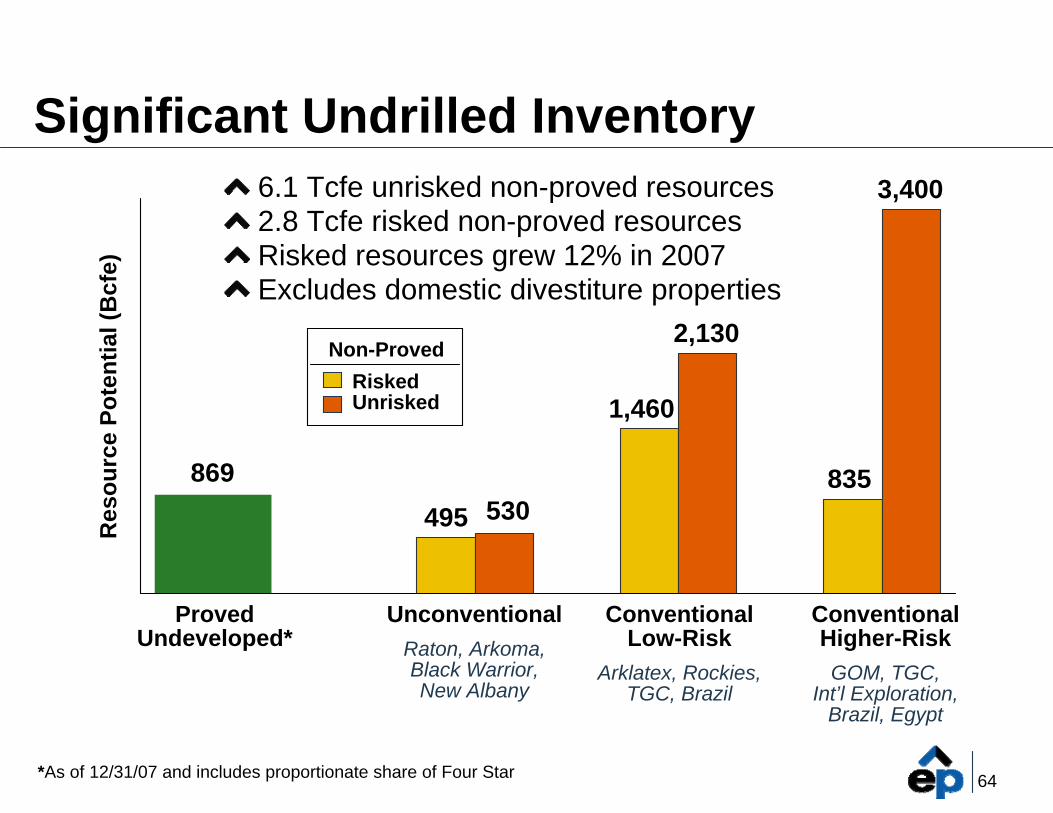
Significant Undrilled Inventory
Proved Undeveloped*
UnconventionalRaton, Arkoma,Black Warrior,New Albany
ConventionalLow-Risk
Arklatex, Rockies, TGC, Brazil
ConventionalHigher-RiskGOM, TGC,
Int’l Exploration,Brazil, Egypt
869495 530
1,460
2,130
835
3,400
*As of 12/31/07 and includes proportionate share of Four Star
Res
ourc
e Po
tent
ial (
Bcf
e)
6.1 Tcfe unrisked non-proved resources2.8 Tcfe risked non-proved resourcesRisked resources grew 12% in 2007Excludes domestic divestiture properties
RiskedUnrisked
Non-Proved
65
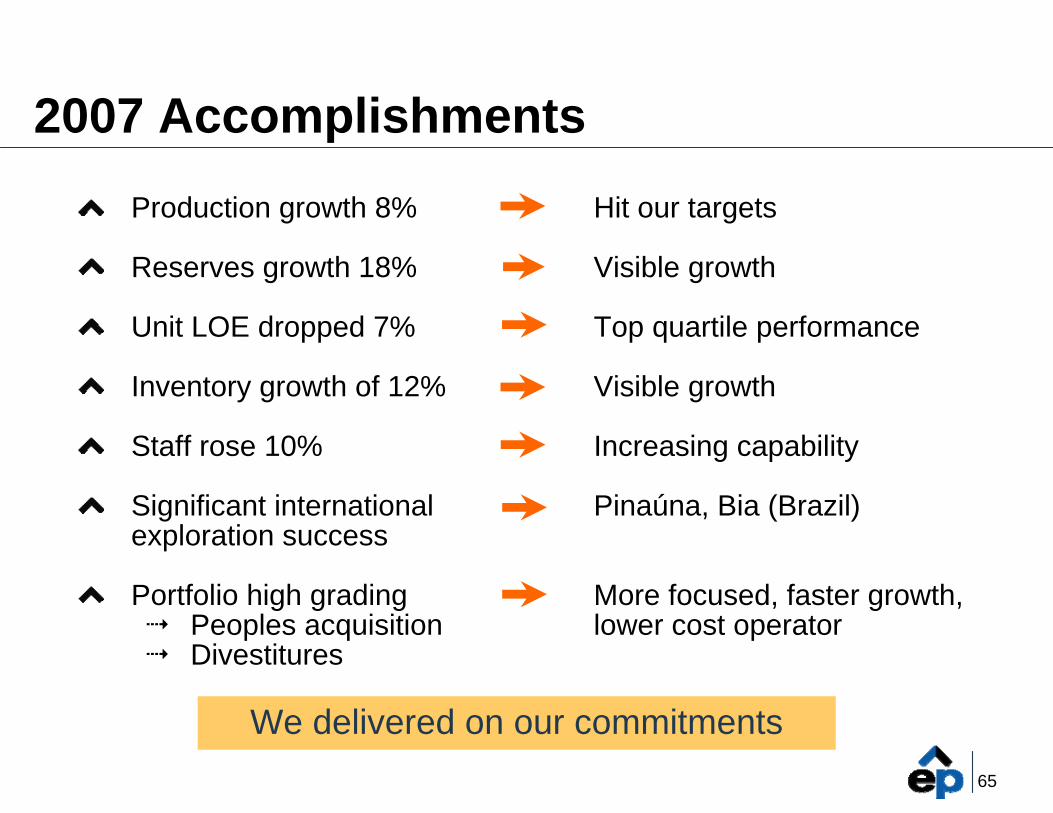
2007 AccomplishmentsProduction growth 8%
Reserves growth 18%
Unit LOE dropped 7%
Inventory growth of 12%
Staff rose 10%
Significant international exploration success
Portfolio high gradingPeoples acquisitionDivestitures
We delivered on our commitments
Hit our targets
Visible growth
Top quartile performance
Visible growth
Increasing capability
Pinaúna, Bia (Brazil)
More focused, faster growth, lower cost operator
66
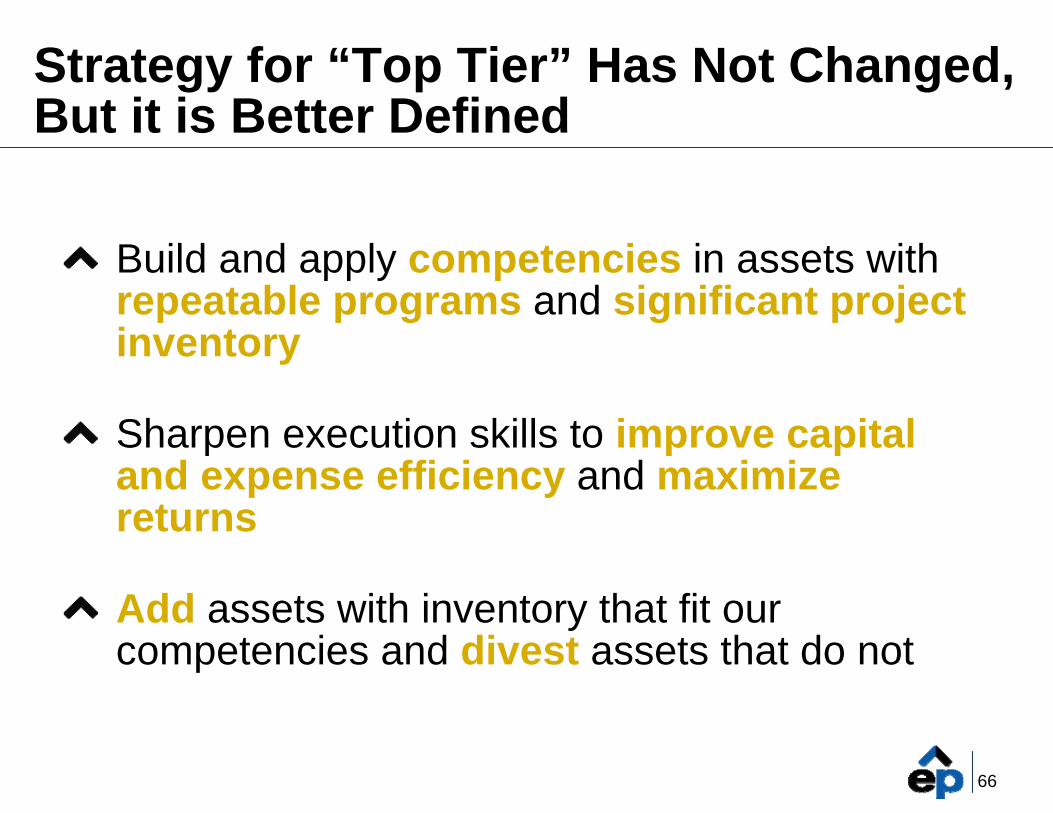
Strategy for “Top Tier” Has Not Changed,But it is Better Defined
Build and apply competencies in assets with repeatable programs and significant project inventory
Sharpen execution skills to improve capitaland expense efficiency and maximize returns
Add assets with inventory that fit our competencies and divest assets that do not
67
“Business Delivery Model” is the Core ofOur Approach to the Business
68
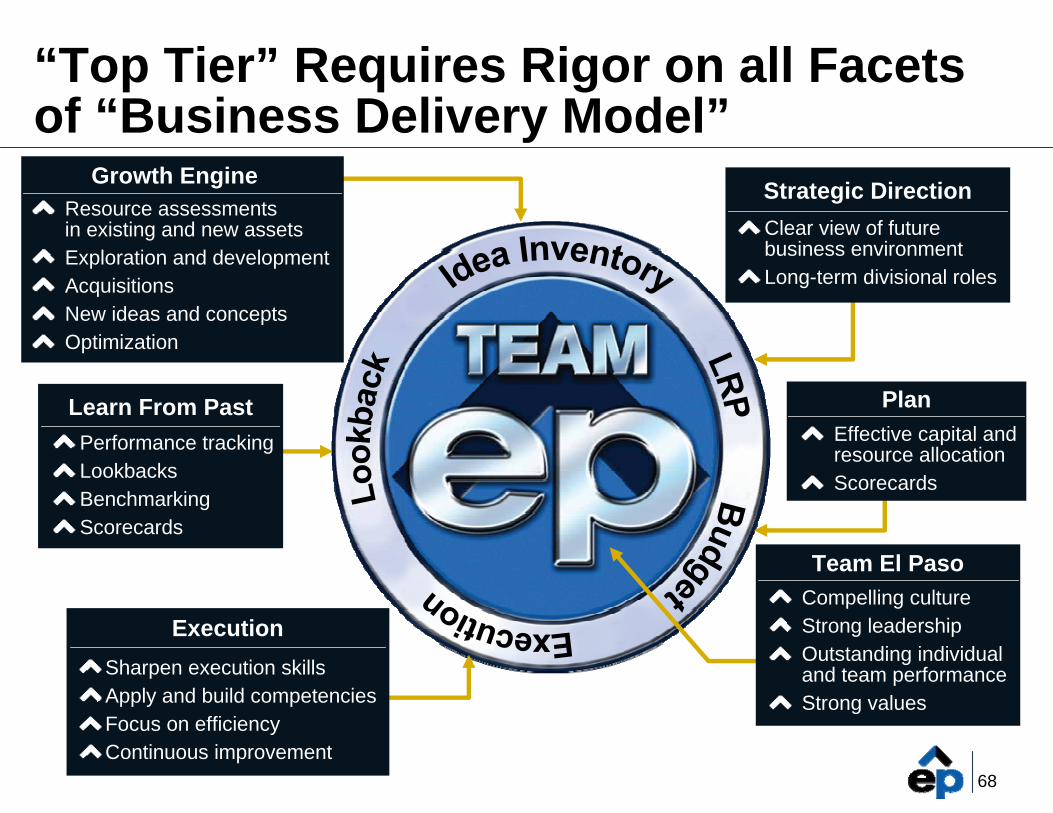
“Top Tier” Requires Rigor on all Facetsof “Business Delivery Model”
PlanEffective capital and resource allocationScorecards
Resource assessmentsin existing and new assetsExploration and developmentAcquisitionsNew ideas and conceptsOptimization
Growth Engine Strategic DirectionClear view of future business environmentLong-term divisional roles
Compelling cultureStrong leadershipOutstanding individualand team performanceStrong values
Team El Paso
Learn From PastPerformance trackingLookbacksBenchmarkingScorecards
Sharpen execution skills Apply and build competenciesFocus on efficiency Continuous improvement
Execution

69
Priority to Align Assets to Competencies
Competency
Rep
eata
bilit
y
StrengthenCompetencies
Leverage Strengths& Increase Activity
Rationalize DevelopInventory
Low
Hig
h
Weak Strong
70
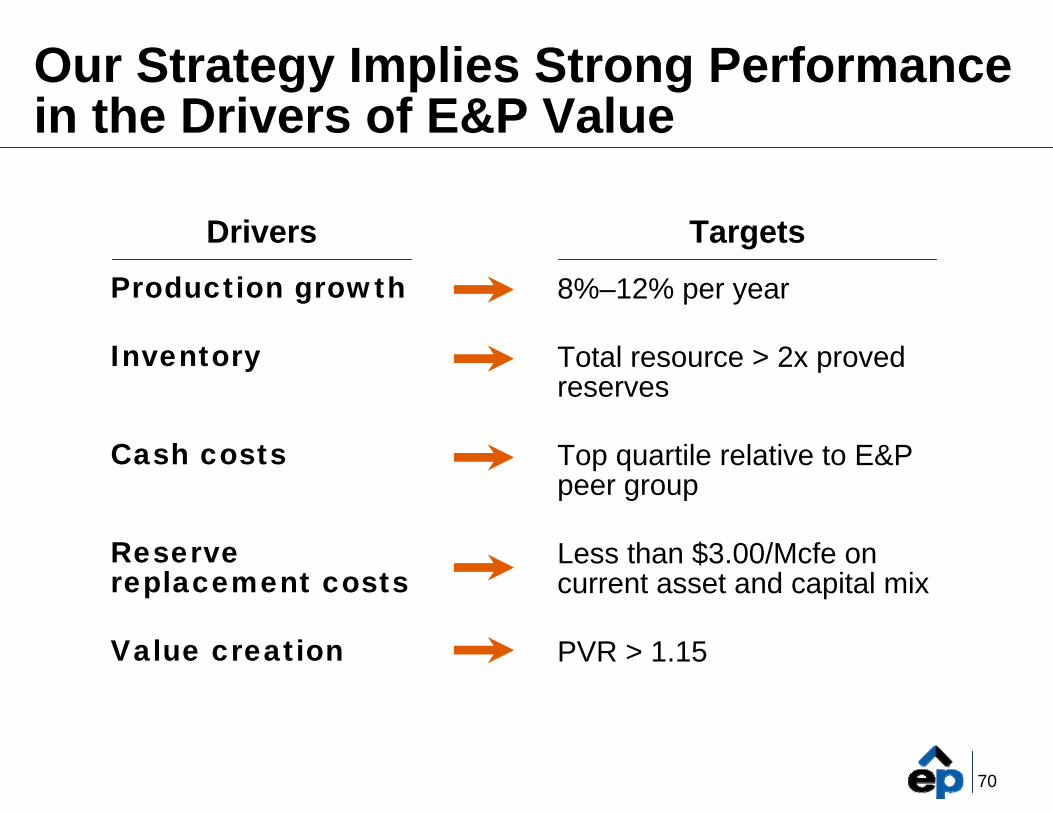
Our Strategy Implies Strong Performancein the Drivers of E&P Value
Production growth
Inventory
Cash costs
Reservereplacement costs
Value creation
8%–12% per year
Total resource > 2x proved reserves
Top quartile relative to E&Ppeer group
Less than $3.00/Mcfe oncurrent asset and capital mix
PVR > 1.15
Drivers Targets
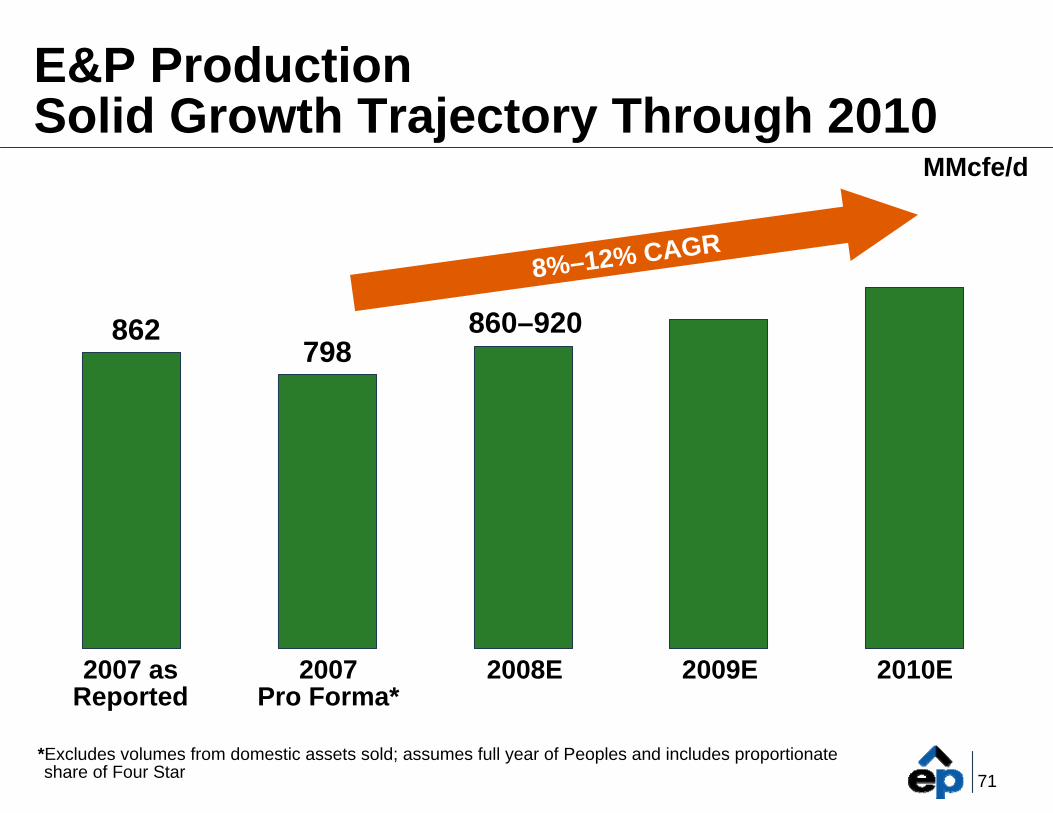
71*Excludes volumes from domestic assets sold; assumes full year of Peoples and includes proportionate share of Four Star
E&P ProductionSolid Growth Trajectory Through 2010
862798
860–920
8%–12% CAGR
2007 asReported
2007Pro Forma*
2008E 2009E 2010E
MMcfe/d
72
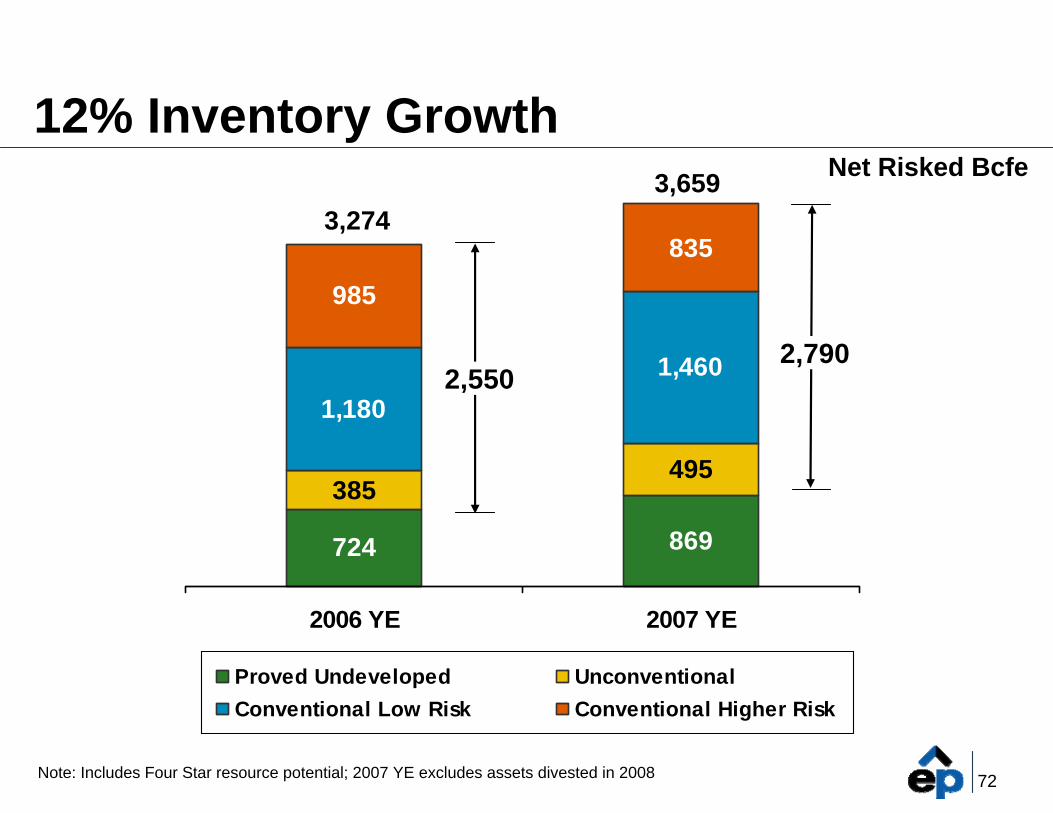
724 869
385495
1,1801,460
985
835
2006 YE 2007 YE
Proved Undeveloped UnconventionalConventional Low Risk Conventional Higher Risk
12% Inventory Growth
3,2743,659
2,7902,550
Note: Includes Four Star resource potential; 2007 YE excludes assets divested in 2008
Net Risked Bcfe
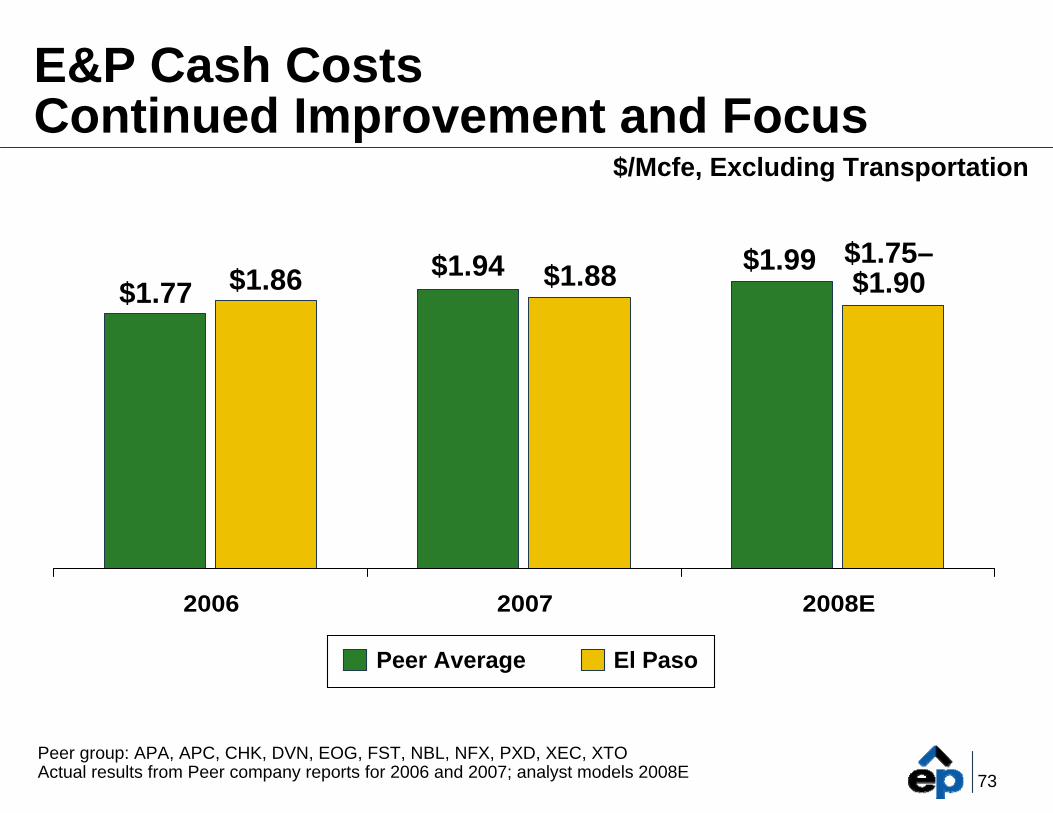
73Peer group: APA, APC, CHK, DVN, EOG, FST, NBL, NFX, PXD, XEC, XTOActual results from Peer company reports for 2006 and 2007; analyst models 2008E
2006 2007 2008E
E&P Cash CostsContinued Improvement and Focus
$1.77 $1.86 $1.94 $1.88$1.75–$1.90
$1.99
Peer Average El Paso
$/Mcfe, Excluding Transportation
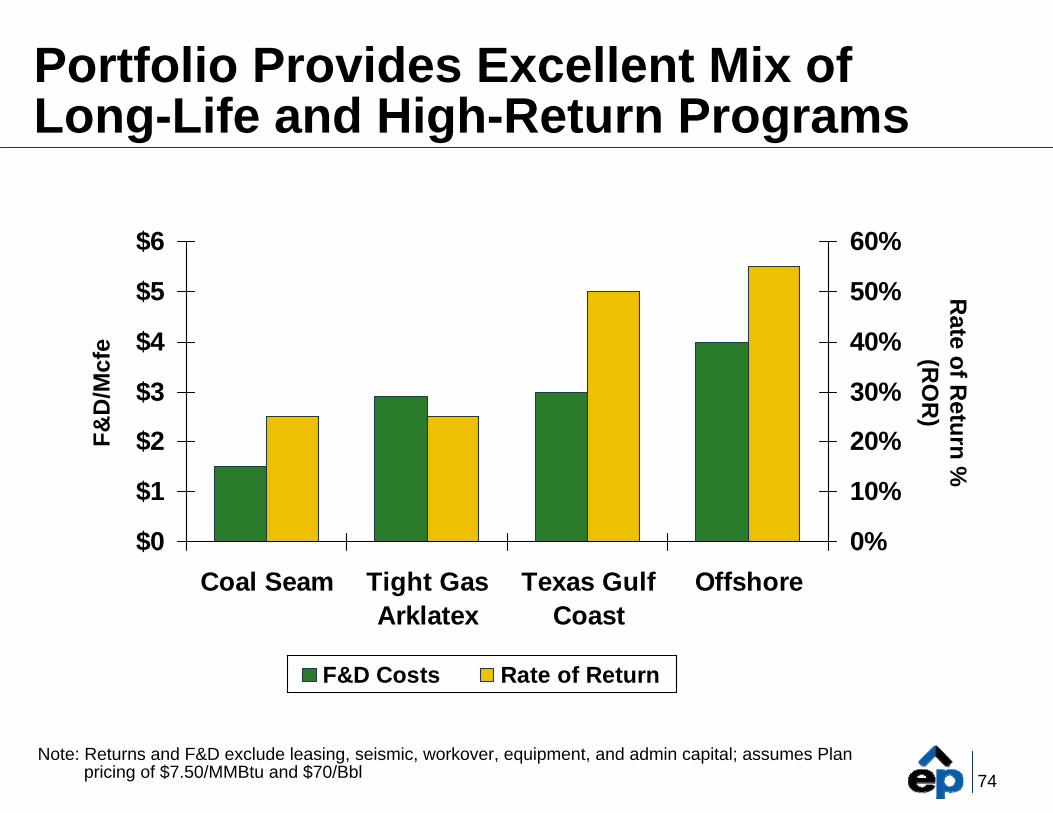
74Note: Returns and F&D exclude leasing, seismic, workover, equipment, and admin capital; assumes Plan
pricing of $7.50/MMBtu and $70/Bbl
Portfolio Provides Excellent Mix ofLong-Life and High-Return Programs
F&D
/Mcf
e
$0
$1
$2
$3
$4
$5
$6
Coal Seam Tight GasArklatex
Texas GulfCoast
Offshore0%
10%
20%
30%
40%
50%
60%
F&D Costs Rate of Return
Rate of R
eturn %(R
OR
)
75
0
2
4
6
8
10
12
14
4 5 6 7 8 9 10 11
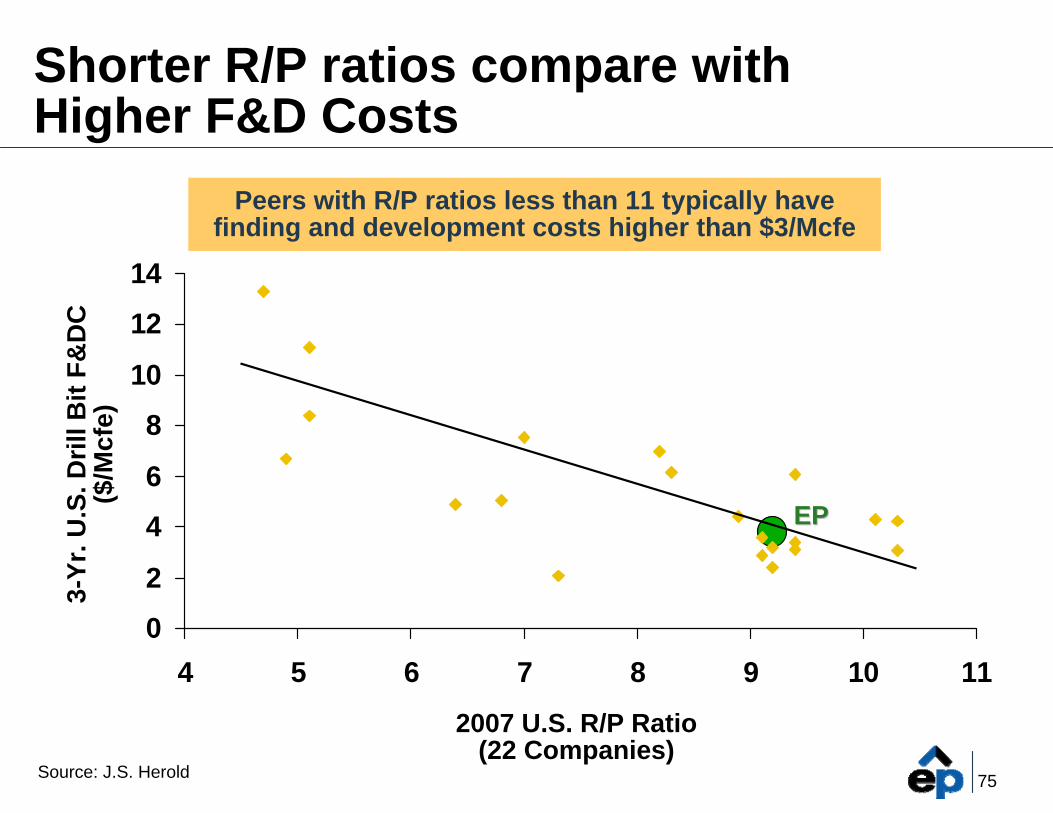
Shorter R/P ratios compare withHigher F&D Costs
EPEP
Peers with R/P ratios less than 11 typically havefinding and development costs higher than $3/Mcfe
3-Yr
. U.S
. Dril
l Bit
F&D
C($
/Mcf
e)
2007 U.S. R/P Ratio(22 Companies)
Source: J.S. Herold
76
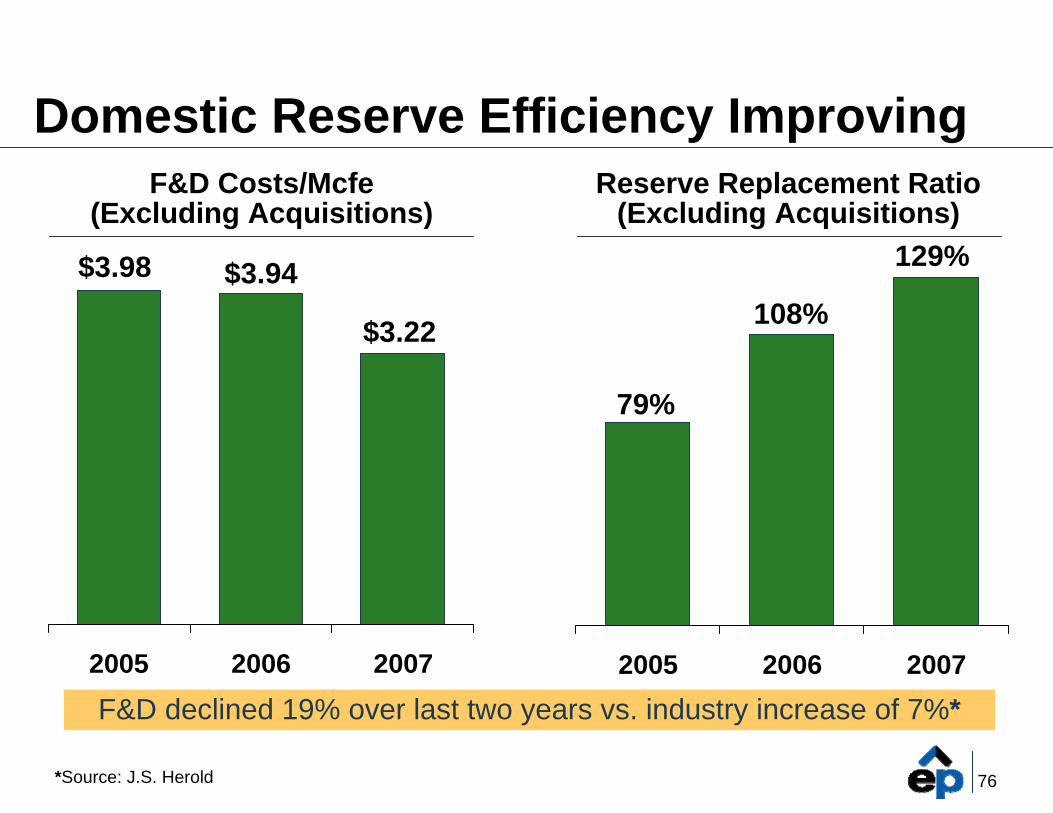
Domestic Reserve Efficiency Improving
2005 2006 2007
F&D Costs/Mcfe (Excluding Acquisitions)
$3.98 $3.94
$3.22
2005 2006 2007
Reserve Replacement Ratio (Excluding Acquisitions)
79%
108%
129%
F&D declined 19% over last two years vs. industry increase of 7%*
*Source: J.S. Herold
77
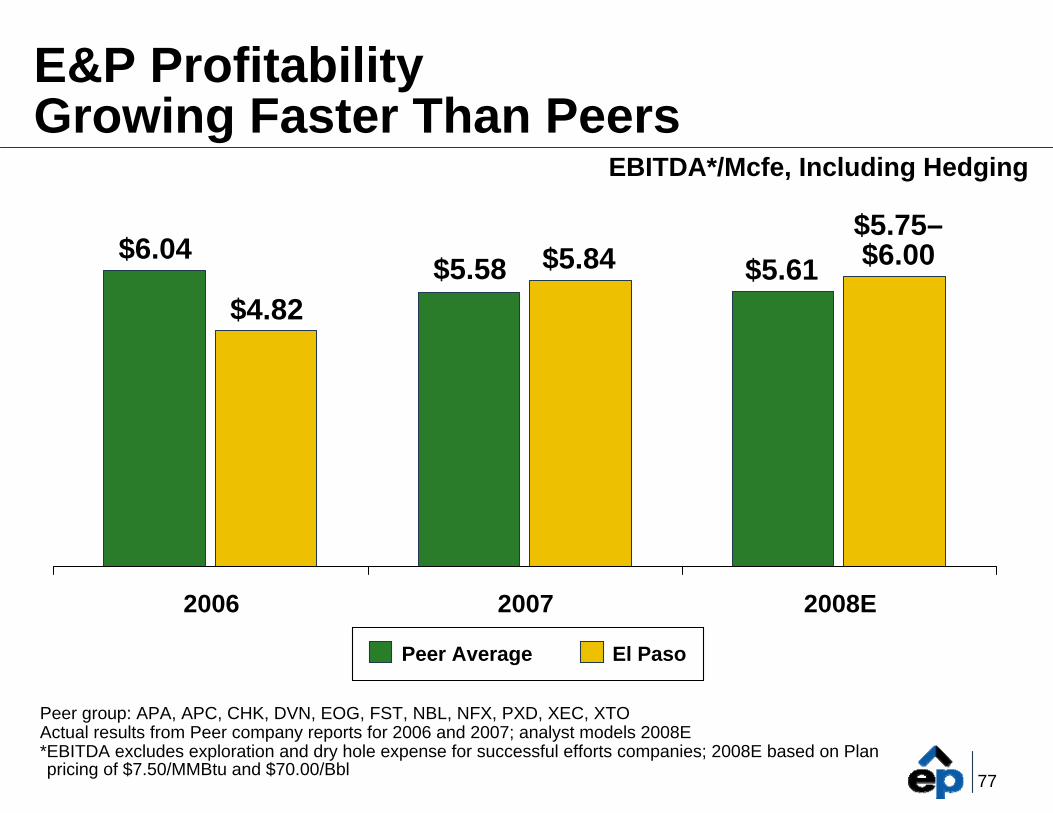
2006 2007 2008E
E&P ProfitabilityGrowing Faster Than Peers
$6.04
$4.82$5.58 $5.84
$5.75–$6.00
Peer group: APA, APC, CHK, DVN, EOG, FST, NBL, NFX, PXD, XEC, XTOActual results from Peer company reports for 2006 and 2007; analyst models 2008E*EBITDA excludes exploration and dry hole expense for successful efforts companies; 2008E based on Plan pricing of $7.50/MMBtu and $70.00/Bbl
$5.61
Peer Average El Paso
EBITDA*/Mcfe, Including Hedging
78
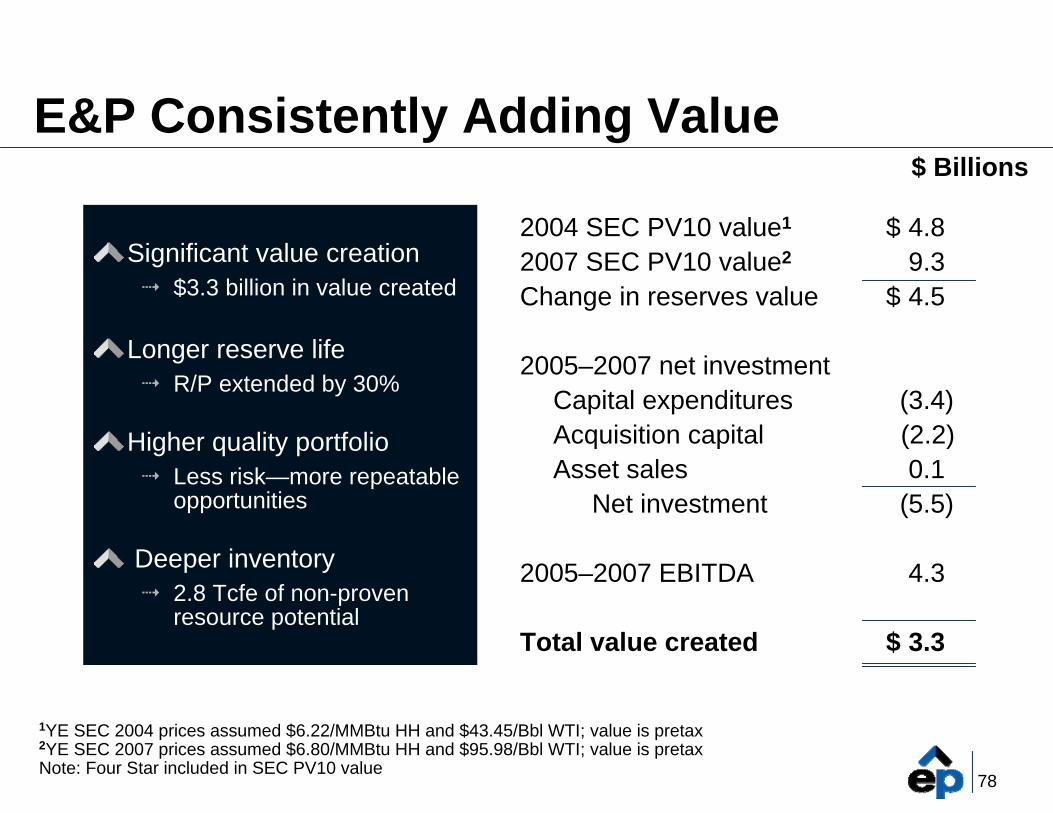
E&P Consistently Adding Value
Significant value creation$3.3 billion in value created
Longer reserve lifeR/P extended by 30%
Higher quality portfolioLess risk—more repeatable opportunities
Deeper inventory 2.8 Tcfe of non-proven resource potential
1YE SEC 2004 prices assumed $6.22/MMBtu HH and $43.45/Bbl WTI; value is pretax2YE SEC 2007 prices assumed $6.80/MMBtu HH and $95.98/Bbl WTI; value is pretaxNote: Four Star included in SEC PV10 value
2004 SEC PV10 value1
2007 SEC PV10 value2
Change in reserves value
2005–2007 net investmentCapital expendituresAcquisition capitalAsset sales
Net investment
2005–2007 EBITDA
Total value created
$ 4.89.3
$ 4.5
(3.4)(2.2)0.1
(5.5)
4.3
$ 3.3
$ Billions

79
El Paso Will Become a “Top-Tier” Performer
Performance is steadily improving
Growth strategy is rational and aligned with competencies
Significantly improved portfolio
Project inventory is high-quality and growing
Highly competent workforce
80
Program Review

81
Program Assumptions
Highlighted programs cover 85% of 2008 capitalProgram statistics are pro forma to exclude production from properties divested in 2008; includes a full year from PeoplesInventory
Locations are on gross basisResource potential is net to El PasoResource includes proved undeveloped reservesDoes not include value upside including infill drilling
EconomicsReturns assume $7.50/MMBtu Henry Hub and $70.00/Bbl WTIF&D costs = drilling and completion costsRate of return and PVR are risked; net to El Paso
82
Onshore
83
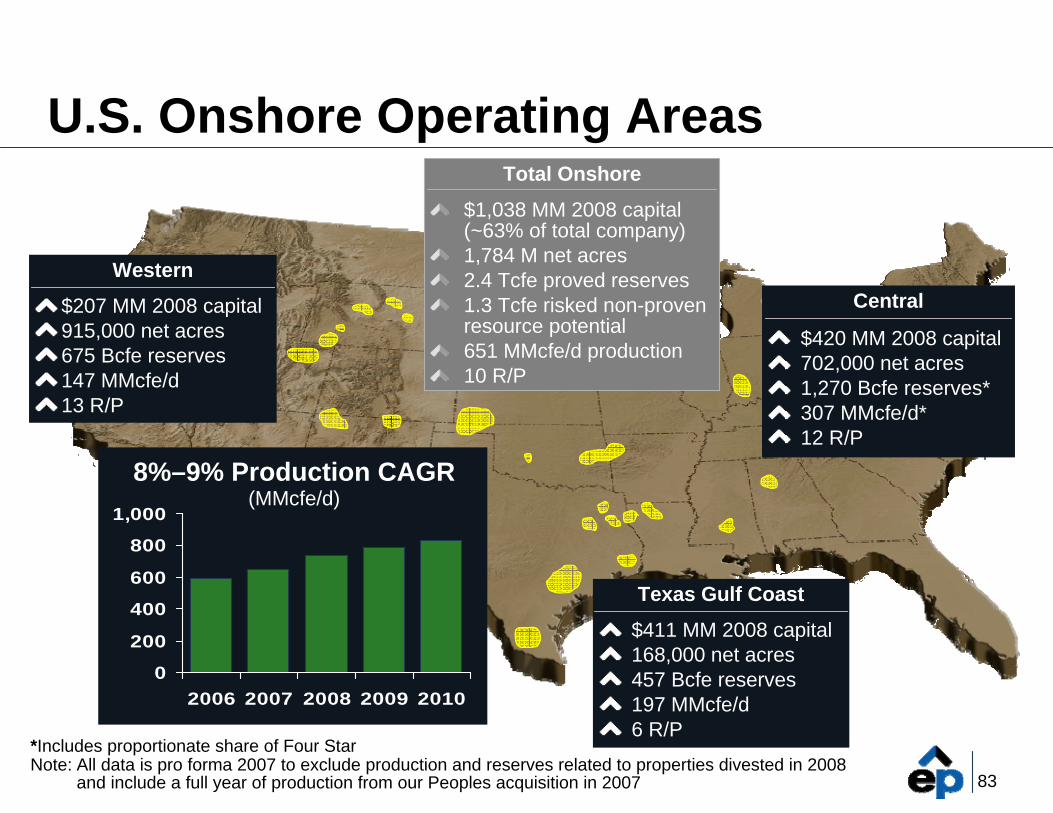
U.S. Onshore Operating Areas
Western
$207 MM 2008 capital915,000 net acres675 Bcfe reserves147 MMcfe/d13 R/P
Texas Gulf Coast
$411 MM 2008 capital168,000 net acres457 Bcfe reserves 197 MMcfe/d6 R/P
Central
$420 MM 2008 capital702,000 net acres1,270 Bcfe reserves*307 MMcfe/d*12 R/P
*Includes proportionate share of Four StarNote: All data is pro forma 2007 to exclude production and reserves related to properties divested in 2008
and include a full year of production from our Peoples acquisition in 2007
Total Onshore
$1,038 MM 2008 capital(~63% of total company)1,784 M net acres2.4 Tcfe proved reserves1.3 Tcfe risked non-proven resource potential651 MMcfe/d production10 R/P
0
200
400
600
800
1,000
2006 2007 2008 2009 2010
8%–9% Production CAGR(MMcfe/d)
84
Onshore Characterization
Targeting repeatable, low to mid-risk programsHigh-quality, concentrated asset base
Material core positions in coal seam and tight gas Multi-year project inventoryStrong positions in resource plays
Annual capital spend of $1 billion generating EBITDA of $1.3 billion–$1.4 billionPredictable, mid-single digit production growth
85
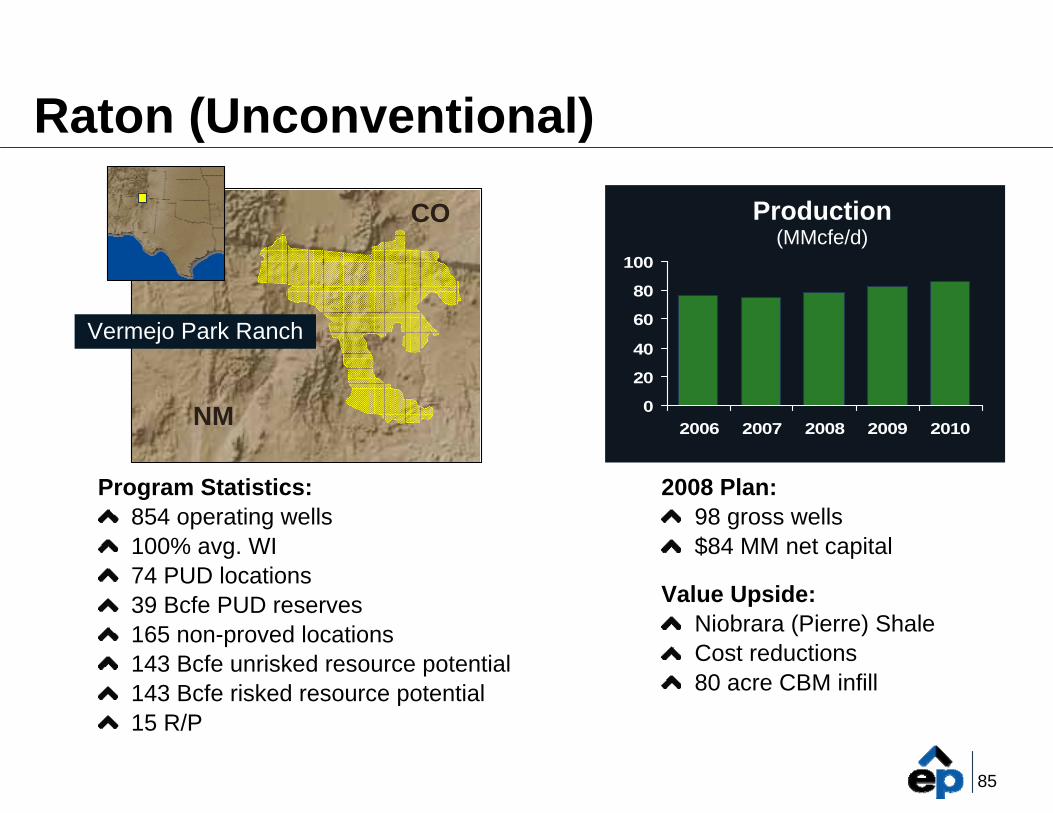
Raton (Unconventional)
Program Statistics:854 operating wells100% avg. WI74 PUD locations39 Bcfe PUD reserves165 non-proved locations143 Bcfe unrisked resource potential143 Bcfe risked resource potential15 R/P
2008 Plan:98 gross wells$84 MM net capital
Value Upside:Niobrara (Pierre) ShaleCost reductions80 acre CBM infill
0
20
40
60
80
100
2006 2007 2008 2009 2010
Production (MMcfe/d)
NM
CO
Vermejo Park Ranch
86
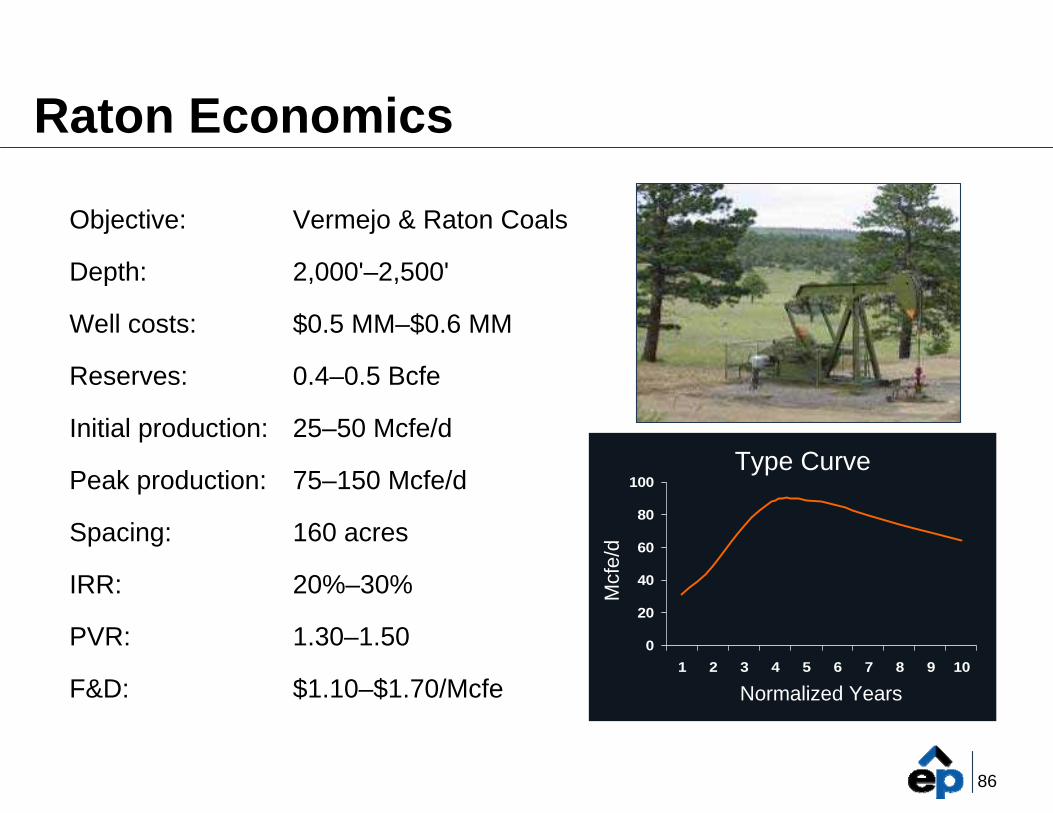
Raton Economics
Objective:
Depth:
Well costs:
Reserves:
Initial production:
Peak production:
Spacing:
IRR:
PVR:
F&D:
Vermejo & Raton Coals
2,000'–2,500'
$0.5 MM–$0.6 MM
0.4–0.5 Bcfe
25–50 Mcfe/d
75–150 Mcfe/d
160 acres
20%–30%
1.30–1.50
$1.10–$1.70/Mcfe
0
20
40
60
80
100
1 2 3 4 5 6 7 8 9 10
Normalized Years
Mcf
e/d
Type Curve
87
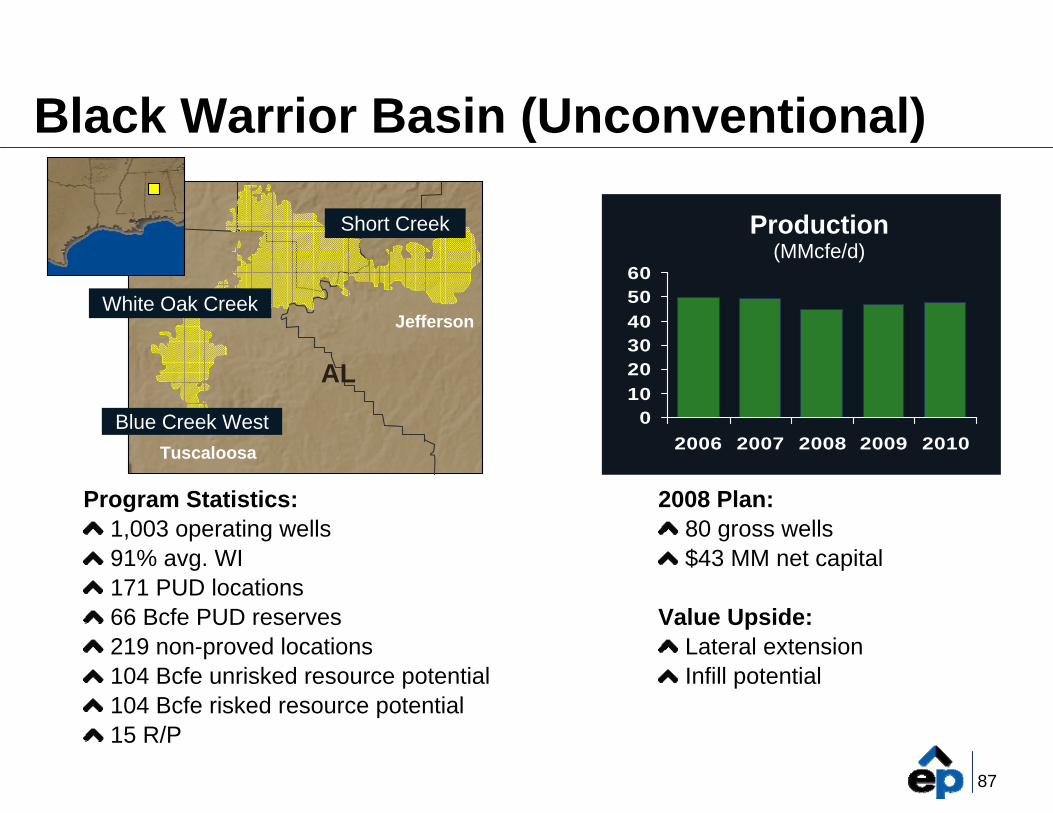
Program Statistics:1,003 operating wells91% avg. WI171 PUD locations66 Bcfe PUD reserves219 non-proved locations104 Bcfe unrisked resource potential104 Bcfe risked resource potential15 R/P
0102030405060
2006 2007 2008 2009 2010
Black Warrior Basin (Unconventional)
2008 Plan:80 gross wells$43 MM net capital
Value Upside:Lateral extensionInfill potential
Note: Excludes Brookwood
Production (MMcfe/d)
White Oak Creek
Blue Creek West
Short Creek
Jefferson
Tuscaloosa
AL
88
Normalized Years
Mcf
e/d
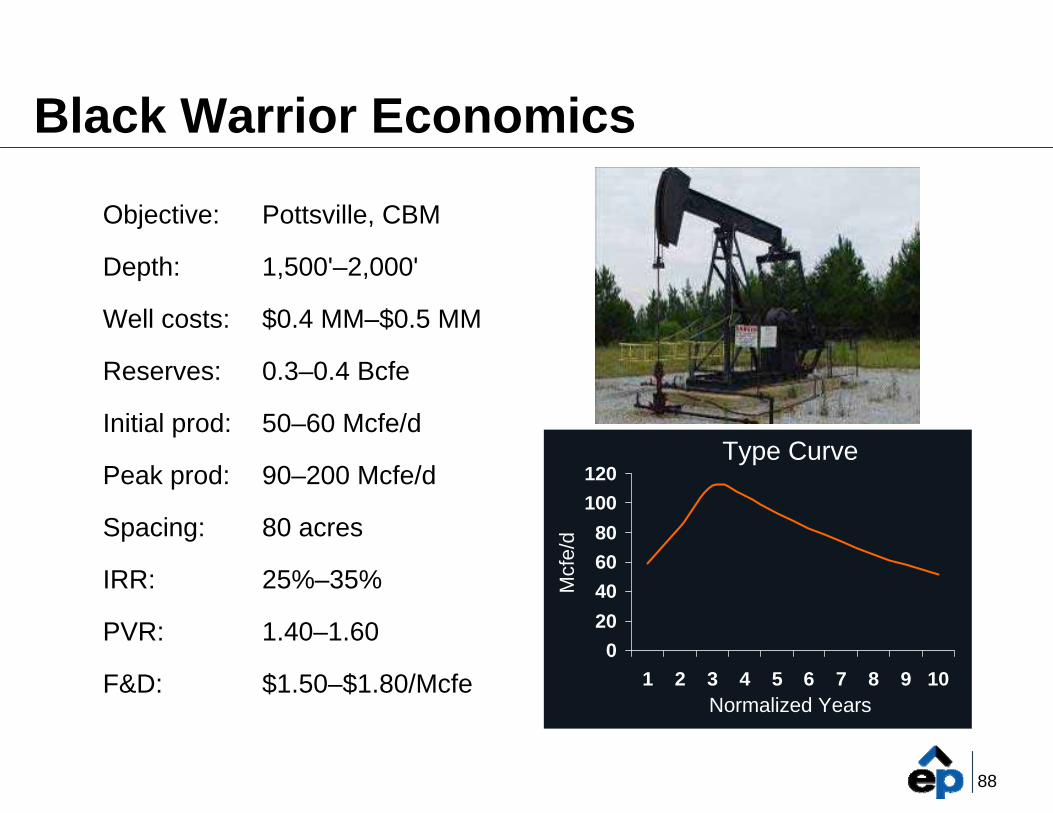
Black Warrior Economics
Objective:
Depth:
Well costs:
Reserves:
Initial prod:
Peak prod:
Spacing:
IRR:
PVR:
F&D:
Pottsville, CBM
1,500'–2,000'
$0.4 MM–$0.5 MM
0.3–0.4 Bcfe
50–60 Mcfe/d
90–200 Mcfe/d
80 acres
25%–35%
1.40–1.60
$1.50–$1.80/Mcfe
Type Curve
020406080
100120
1 2 3 4 5 6 7 8 9 10
89
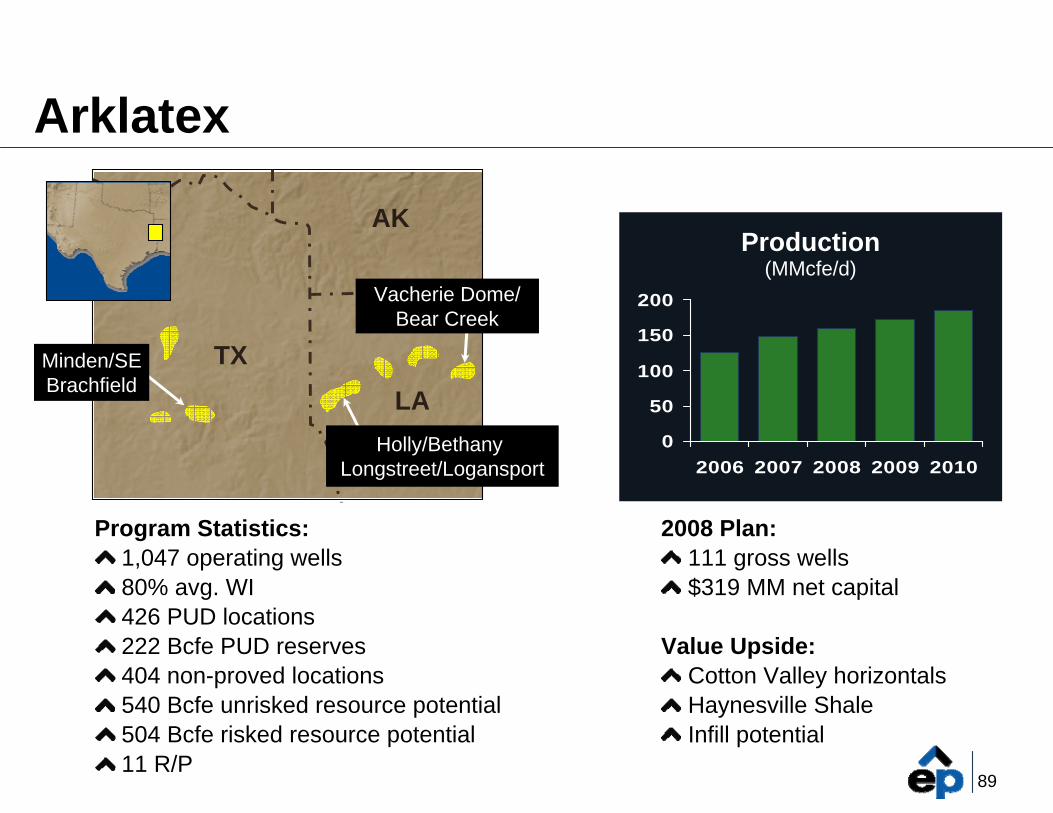
Arklatex
Program Statistics:1,047 operating wells80% avg. WI426 PUD locations222 Bcfe PUD reserves404 non-proved locations540 Bcfe unrisked resource potential504 Bcfe risked resource potential11 R/P
2008 Plan:111 gross wells$319 MM net capital
Value Upside:Cotton Valley horizontalsHaynesville ShaleInfill potential
Minden/SEBrachfield
0
50
100
150
200
2006 2007 2008 2009 2010
Production (MMcfe/d)
TX
AK
LA
Vacherie Dome/Bear Creek
Holly/Bethany Longstreet/Logansport
90
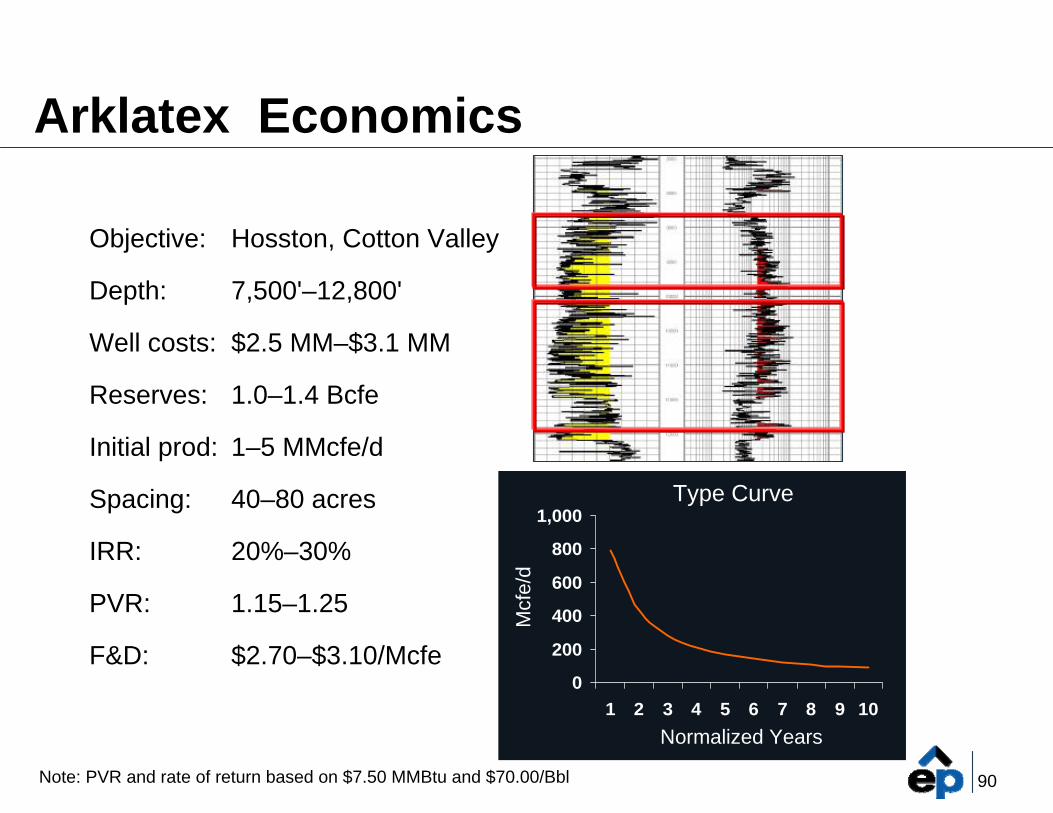
Arklatex Economics
Objective:
Depth:
Well costs:
Reserves:
Initial prod:
Spacing:
IRR:
PVR:
F&D:
Hosston, Cotton Valley
7,500'–12,800'
$2.5 MM–$3.1 MM
1.0–1.4 Bcfe
1–5 MMcfe/d
40–80 acres
20%–30%
1.15–1.25
$2.70–$3.10/Mcfe
Cotton Valley 10,500 ft.
Hosston 8,500 ft.
0
200
400
600
800
1,000
1 2 3 4 5 6 7 8 9 10
Type Curve
Normalized Years
Mcf
e/d
Note: PVR and rate of return based on $7.50 MMBtu and $70.00/Bbl
91
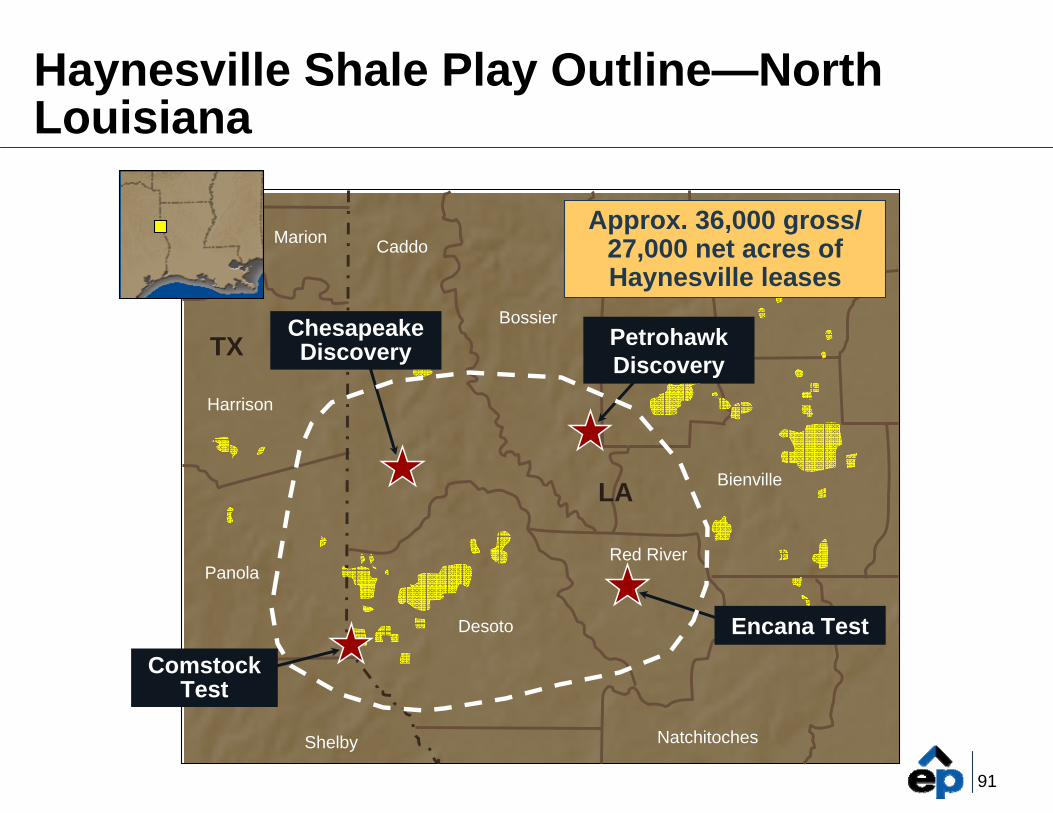
Haynesville Shale Play Outline—North Louisiana
Panola
Natchitoches
Marion
Bossier
Webster Claiborne
Harrison
Caddo
Shelby
Bienville
Red River
Desoto
Comstock Test
Petrohawk Discovery
Approx. 36,000 gross/ 27,000 net acres of Haynesville leases
ChesapeakeDiscovery
Encana Test
LA
TX
92
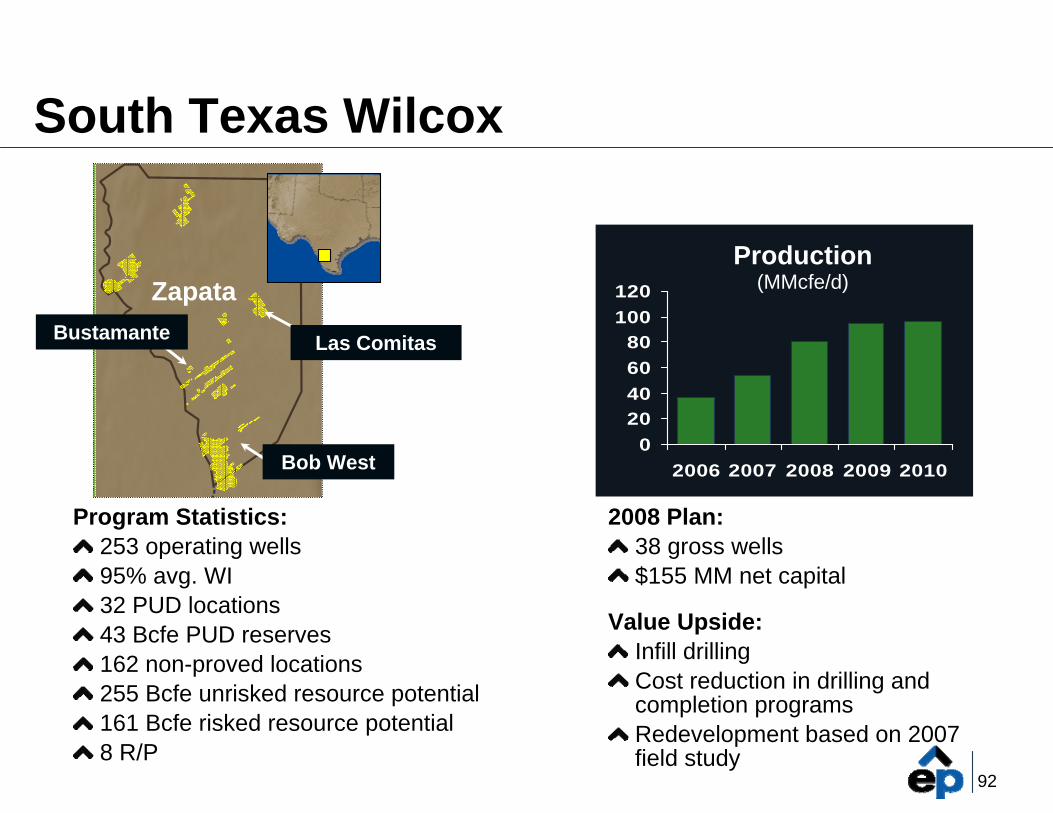
Zapata
South Texas Wilcox
Program Statistics:253 operating wells95% avg. WI32 PUD locations43 Bcfe PUD reserves162 non-proved locations255 Bcfe unrisked resource potential161 Bcfe risked resource potential8 R/P
2008 Plan:38 gross wells$155 MM net capital
Value Upside:Infill drillingCost reduction in drilling and completion programsRedevelopment based on 2007 field study
020406080
100120
2006 2007 2008 2009 2010
Production (MMcfe/d)
Las ComitasBustamante
Bob West
93
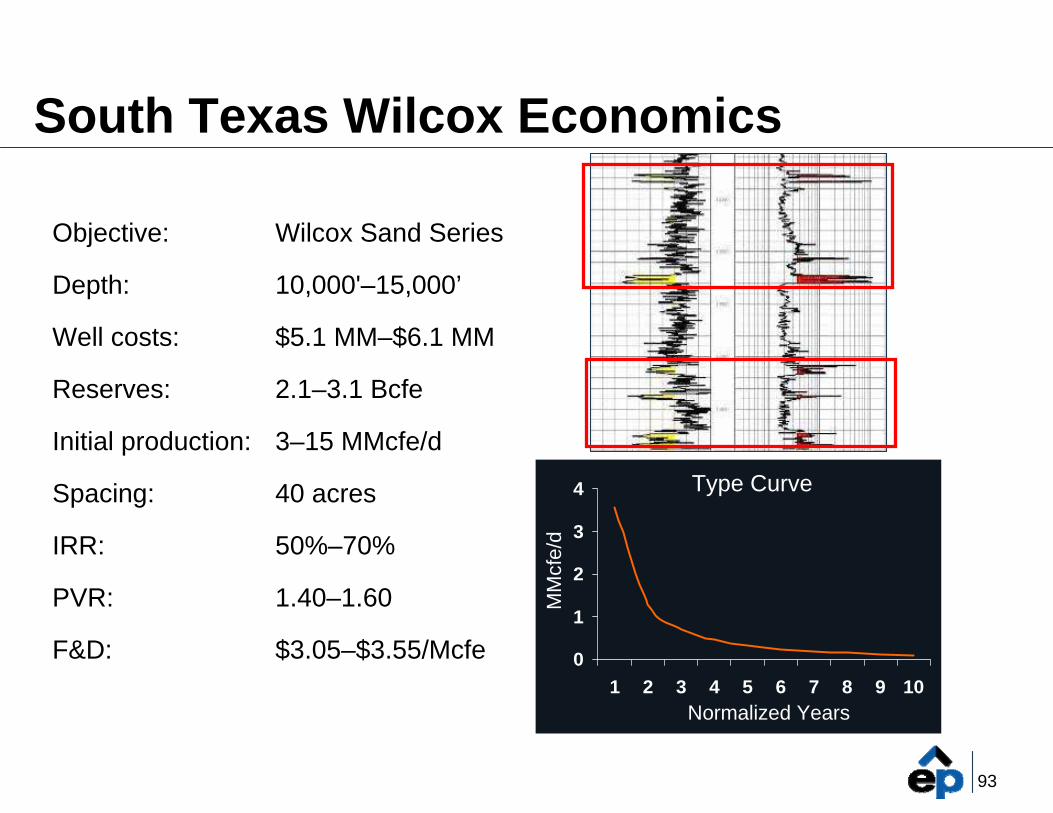
South Texas Wilcox Economics
Objective:
Depth:
Well costs:
Reserves:
Initial production:
Spacing:
IRR:
PVR:
F&D: 0
1
2
3
4
1 2 3 4 5 6 7 8 9 10
Type Curve
Wilcox Sand Series
10,000'–15,000’
$5.1 MM–$6.1 MM
2.1–3.1 Bcfe
3–15 MMcfe/d
40 acres
50%–70%
1.40–1.60
$3.05–$3.55/Mcfe
Lobo 14,000 ft.
Perdido 12,500 ft.
Normalized Years
MM
cfe/
d
94
020406080
100120
2006 2007 2008 2009 2010
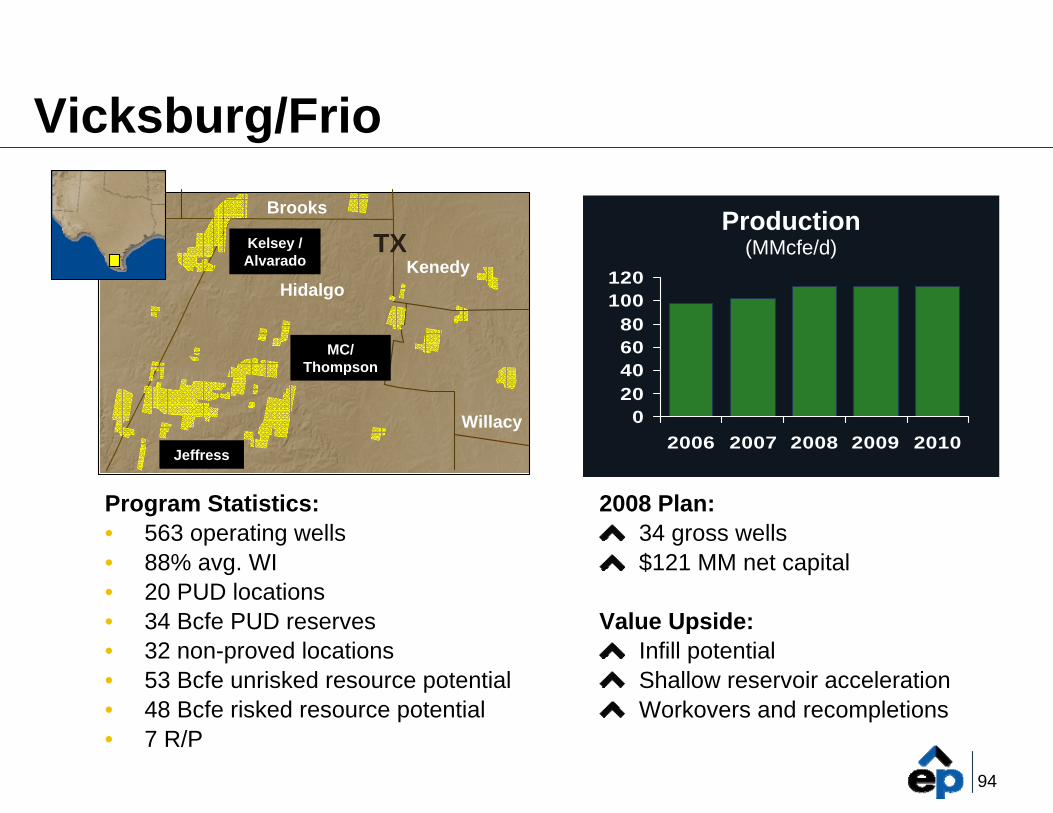
Vicksburg/Frio
Program Statistics:• 563 operating wells• 88% avg. WI• 20 PUD locations• 34 Bcfe PUD reserves• 32 non-proved locations• 53 Bcfe unrisked resource potential• 48 Bcfe risked resource potential• 7 R/P
2008 Plan:34 gross wells$121 MM net capital
Value Upside:Infill potentialShallow reservoir accelerationWorkovers and recompletions
Production (MMcfe/d)Kelsey /
Alvarado
Jeffress
MC/ Thompson
HidalgoKenedy
Willacy
Brooks
TX
95
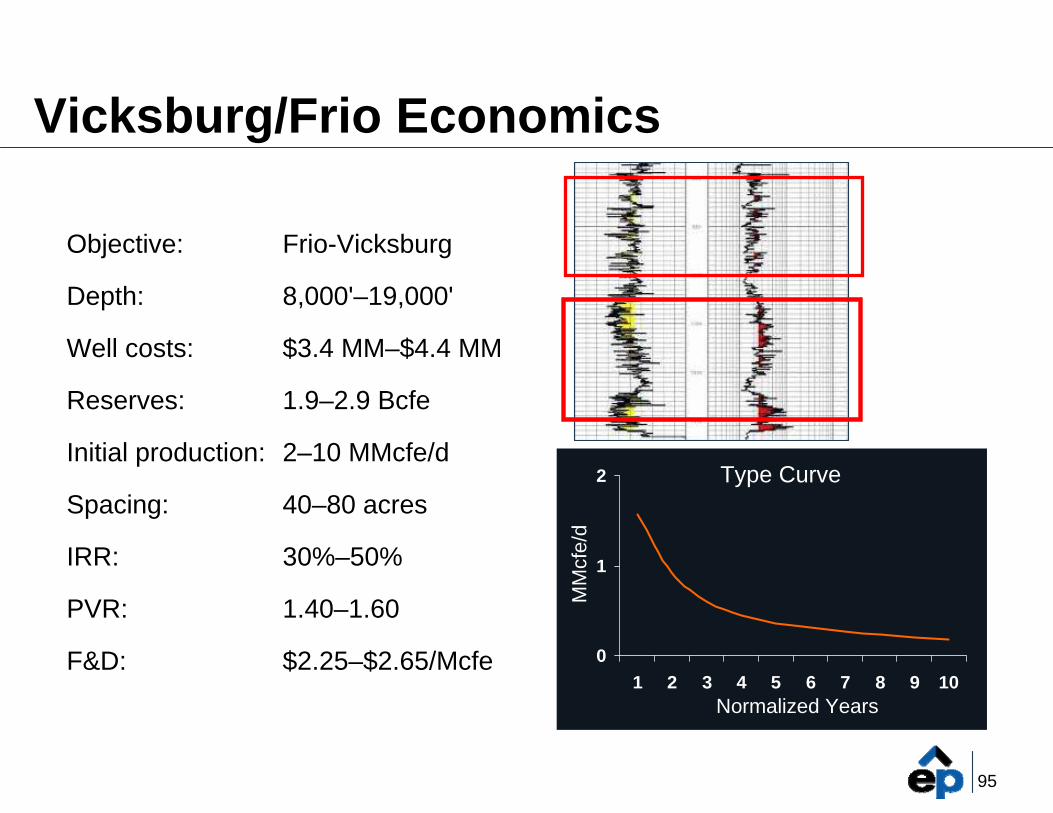
Vicksburg/Frio Economics
Objective:
Depth:
Well costs:
Reserves:
Initial production:
Spacing:
IRR:
PVR:
F&D:
Frio-Vicksburg
8,000'–19,000'
$3.4 MM–$4.4 MM
1.9–2.9 Bcfe
2–10 MMcfe/d
40–80 acres
30%–50%
1.40–1.60
$2.25–$2.65/Mcfe 0
1
2
1 2 3 4 5 6 7 8 9 10
T-Sand 13,000 ft.
S-Sand 9,000 ft.
Type Curve
Normalized Years
MM
cfe/
d
96
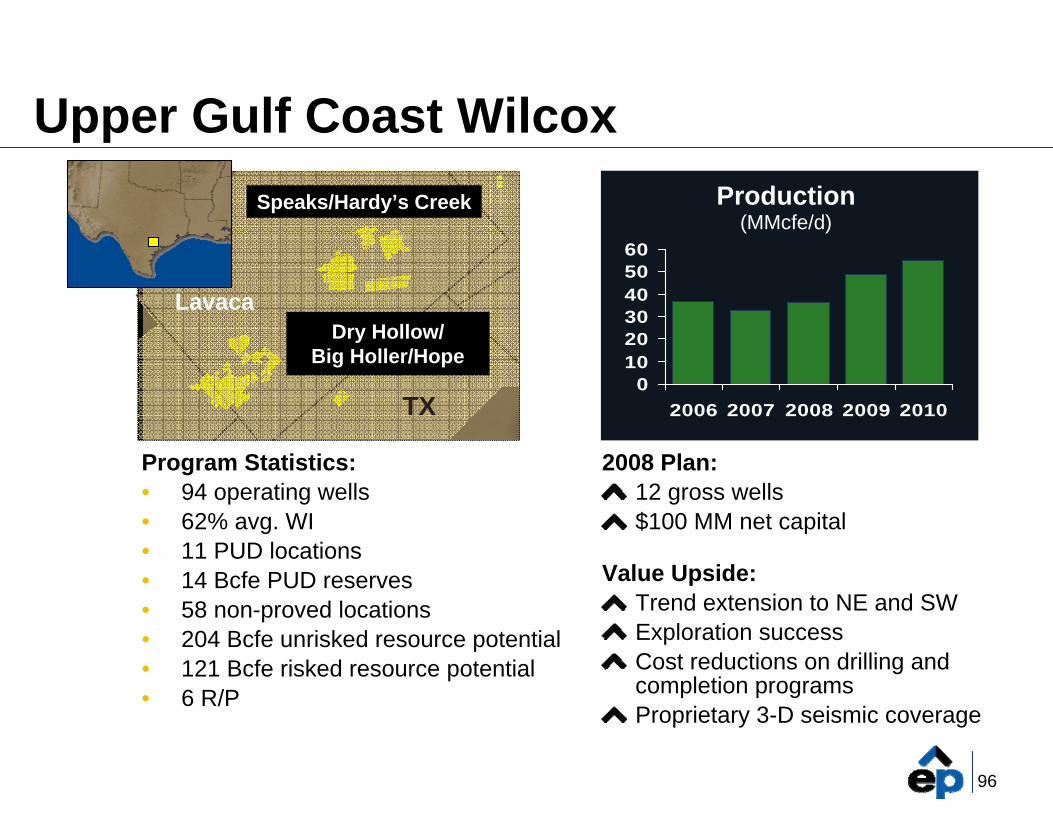
Upper Gulf Coast Wilcox
Program Statistics:• 94 operating wells• 62% avg. WI• 11 PUD locations• 14 Bcfe PUD reserves• 58 non-proved locations• 204 Bcfe unrisked resource potential• 121 Bcfe risked resource potential• 6 R/P
0102030405060
2006 2007 2008 2009 2010
2008 Plan:12 gross wells$100 MM net capital
Value Upside:Trend extension to NE and SWExploration successCost reductions on drilling and completion programsProprietary 3-D seismic coverage
Production (MMcfe/d)
Speaks/Hardy’s Creek
Dry Hollow/Big Holler/Hope
Speaks/Hardy’s Creek
LavacaDry Hollow/
Big Holler/Hope
TX
97
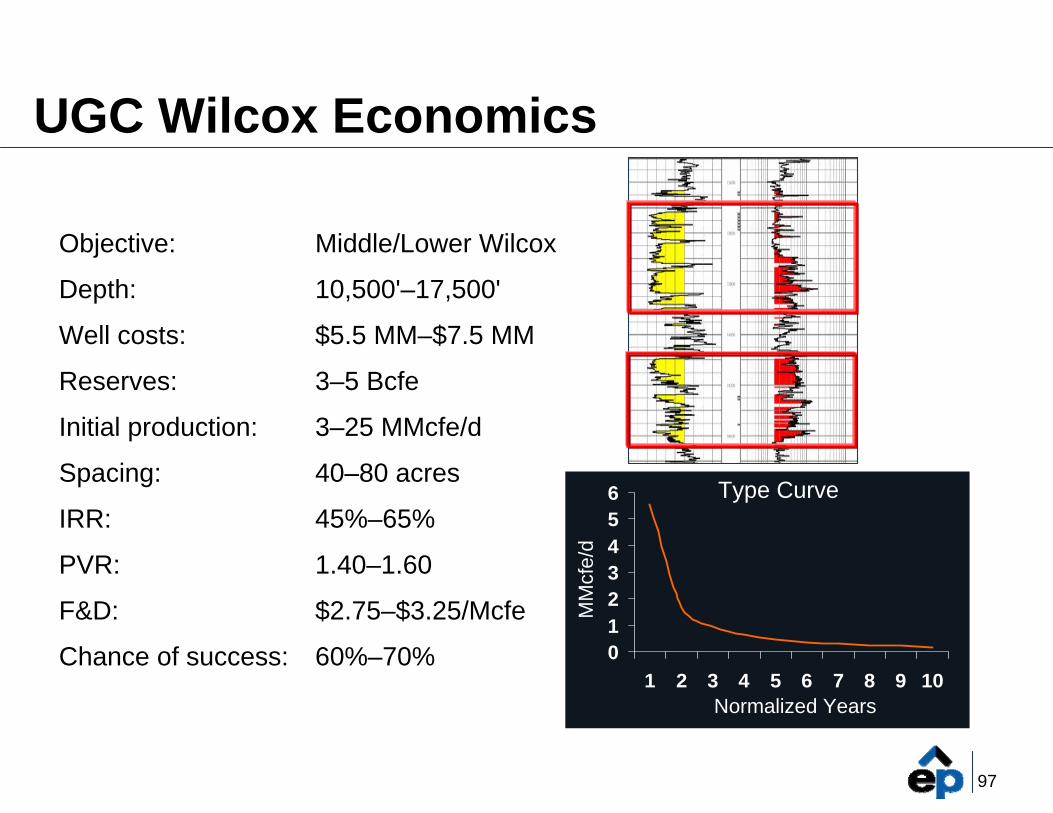
UGC Wilcox Economics
Objective:
Depth:
Well costs:
Reserves:
Initial production:
Spacing:
IRR:
PVR:
F&D:
Chance of success:
Middle/Lower Wilcox
10,500'–17,500'
$5.5 MM–$7.5 MM
3–5 Bcfe
3–25 MMcfe/d
40–80 acres
45%–65%
1.40–1.60
$2.75–$3.25/Mcfe
60%–70% 0123456
1 2 3 4 5 6 7 8 9 10
Ewers Sand 13,400 ft.
Meine Sand 14,400 ft.
Type Curve
Normalized Years
MM
cfe/
d
98
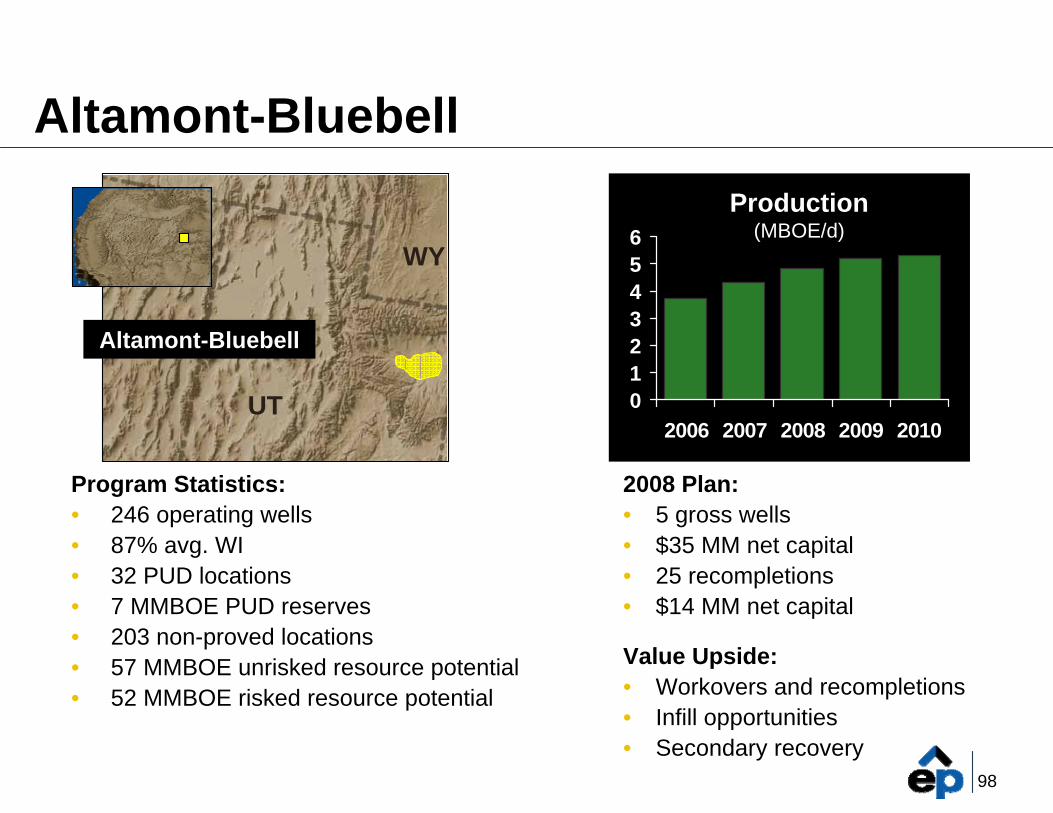
Altamont-Bluebell
Altamont-Bluebell
Program Statistics:• 246 operating wells• 87% avg. WI• 32 PUD locations• 7 MMBOE PUD reserves• 203 non-proved locations• 57 MMBOE unrisked resource potential• 52 MMBOE risked resource potential
2008 Plan:• 5 gross wells• $35 MM net capital• 25 recompletions• $14 MM net capital
Value Upside:• Workovers and recompletions• Infill opportunities• Secondary recovery
0123456
2006 2007 2008 2009 2010
Production(MBOE/d)
UT
WY
99
Type Curve
Normalized Years
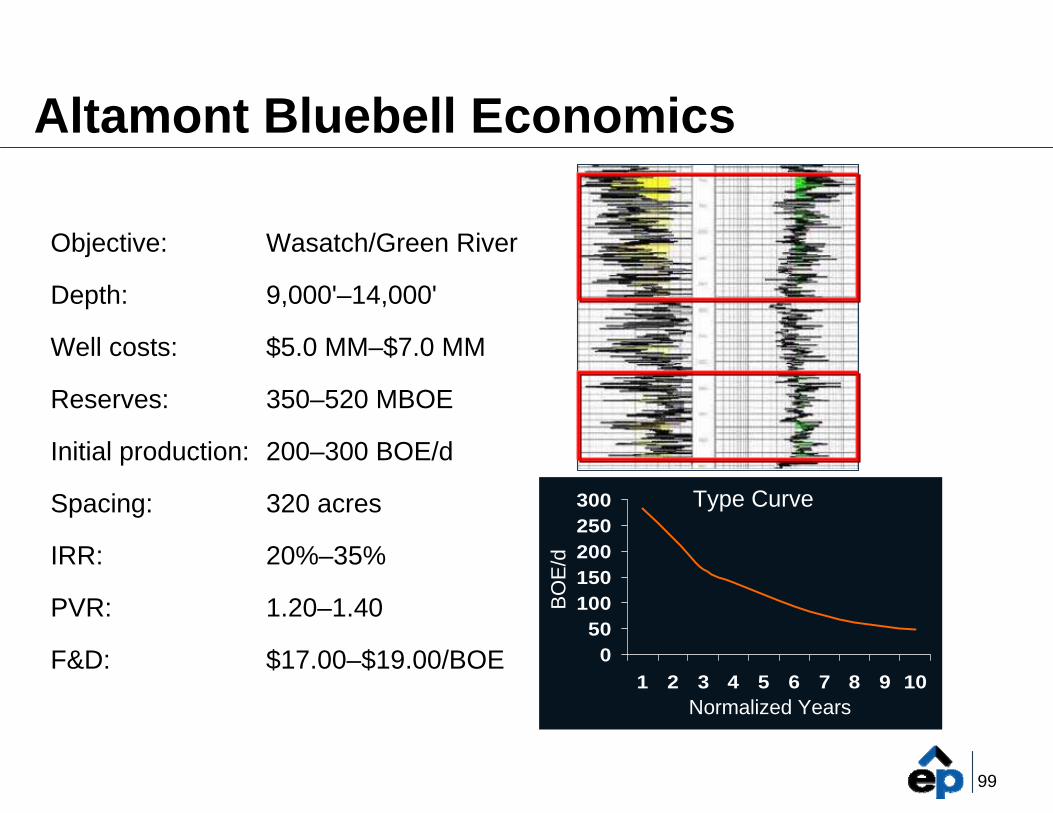
Altamont Bluebell Economics
Objective:
Depth:
Well costs:
Reserves:
Initial production:
Spacing:
IRR:
PVR:
F&D:
Wasatch/Green River
9,000'–14,000'
$5.0 MM–$7.0 MM
350–520 MBOE
200–300 BOE/d
320 acres
20%–35%
1.20–1.40
$17.00–$19.00/BOE 050
100150200250300
1 2 3 4 5 6 7 8 9 10
Wasatch 9,800 ft.
Green River 7,600 ft.
BO
E/d
100
Gulf of Mexico/South Louisiana(GOM/SLA)

101
Corpus ChristiCorpus Christi
HoustonHouston
New OrleansNew OrleansLATX
Note: All data is pro forma 2007 to exclude production and reserves related to properties divested in 2008 and include a full year of production from our Peoples acquisition in 2007
Gulf of Mexico/SLA Statistics
383,000 net acres offshore21,000 net acres SLA133 MMcfe/d151 Bcfe reserves 625 Bcfe risked non-proved resource potential3 R/P
020406080
100120140
2006 2007 2008 2009 2010
Production (MMcfe/d)
GOM/SLA Position
102
GOM/SLA Characterization
Program emphasis on:Miocene and Plio-Pleistocene
Discrete structural and stratigraphic plays
Geophysical-driven programs
Higher rate, higher return wells
Geared for $225 MM–$275 MM of capital spendinggenerating $325 MM–$425 MM EBITDA
Repeatable portfolio of prospects
Essentially flat production
103
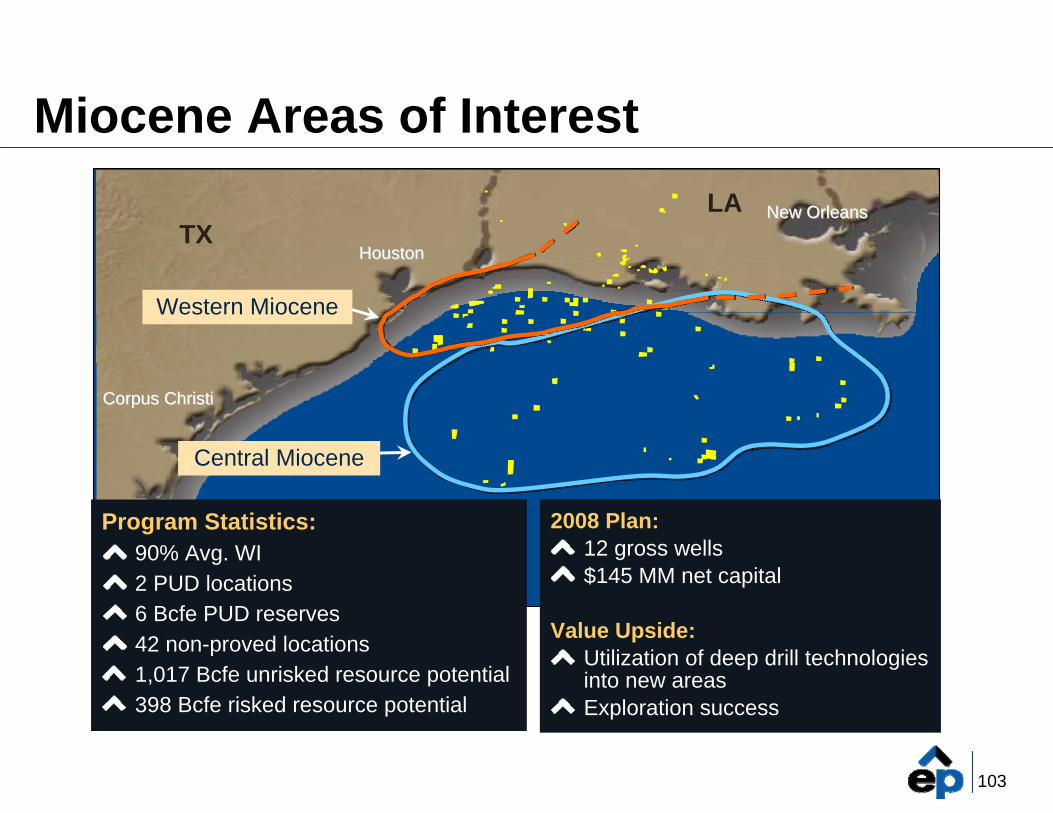
Miocene Areas of Interest
Corpus ChristiCorpus Christi
HoustonHouston
New OrleansNew Orleans
Western Miocene
Program Statistics:90% Avg. WI2 PUD locations6 Bcfe PUD reserves42 non-proved locations1,017 Bcfe unrisked resource potential398 Bcfe risked resource potential
2008 Plan:12 gross wells$145 MM net capital
Value Upside:Utilization of deep drill technologies into new areasExploration success
LATX
Central Miocene
104
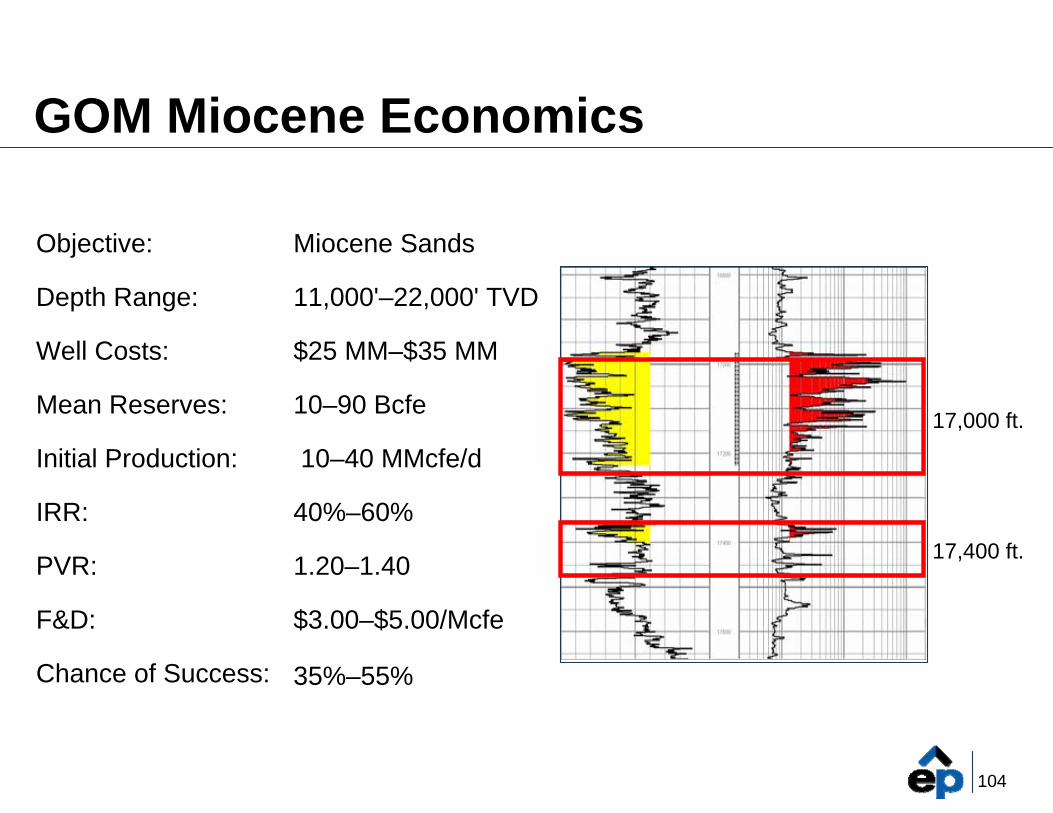
GOM Miocene Economics
Miocene Sands
11,000'–22,000' TVD
$25 MM–$35 MM
10–90 Bcfe
10–40 MMcfe/d
40%–60%
1.20–1.40
$3.00–$5.00/Mcfe
35%–55%
Objective:
Depth Range:
Well Costs:
Mean Reserves:
Initial Production:
IRR:
PVR:
F&D:
Chance of Success:
17,000 ft.
17,400 ft.
105
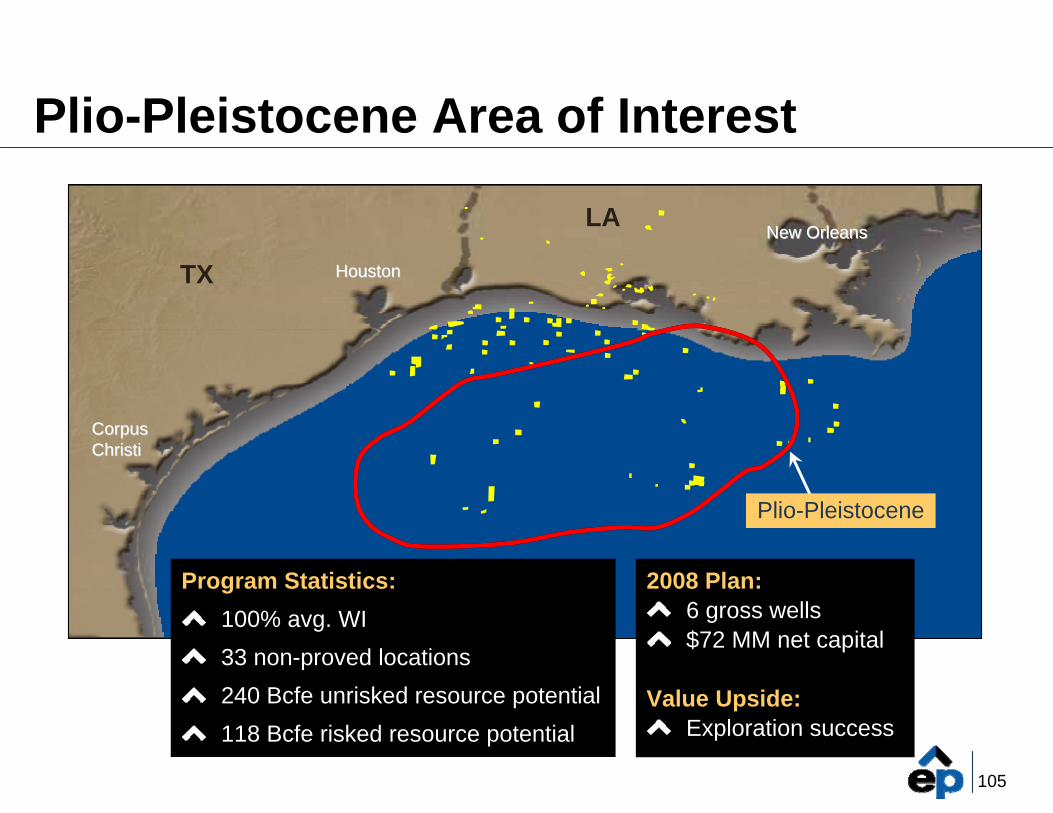
Plio-Pleistocene Area of Interest
CorpusCorpusChristiChristi
HoustonHouston
New OrleansNew Orleans
Plio-Pleistocene
Program Statistics:100% avg. WI33 non-proved locations240 Bcfe unrisked resource potential 118 Bcfe risked resource potential
2008 Plan:6 gross wells$72 MM net capital
Value Upside:Exploration success
LA
TX

106
GOM Plio-Pleistocene Economics
Plio-Pleistocene Sands
6,800'–13,500' TVD
$7 MM – $16 MM
2–12 Bcfe
2–20 MMcfe/d
50%–75%
1.4–1.6
$3.00–$4.00/Mcfe
50%–70%
Objective:
Depth Range:
Well Costs:
Mean Reserves:
Initial Production:
IRR:
PVR:
F&D:
Chance of Success:
7,000 ft.
7,600 ft.

107
International
108
International Characterization
Exploration and development opportunities inBrazil and Egypt
Bia and Pinaúna development underway (Brazil)
Risked resource potential of 1 Tcfe with more than35 prospects/leads
Up to 5 years of drilling inventory with up to 200 unrisked wells
Egypt drilling program commences 4Q 2008
Yearly capital spend of $300 MM–$350 MM overnext 3 years
Material production and reserve growth expected
109
Rio de Rio de JaneiroJaneiro
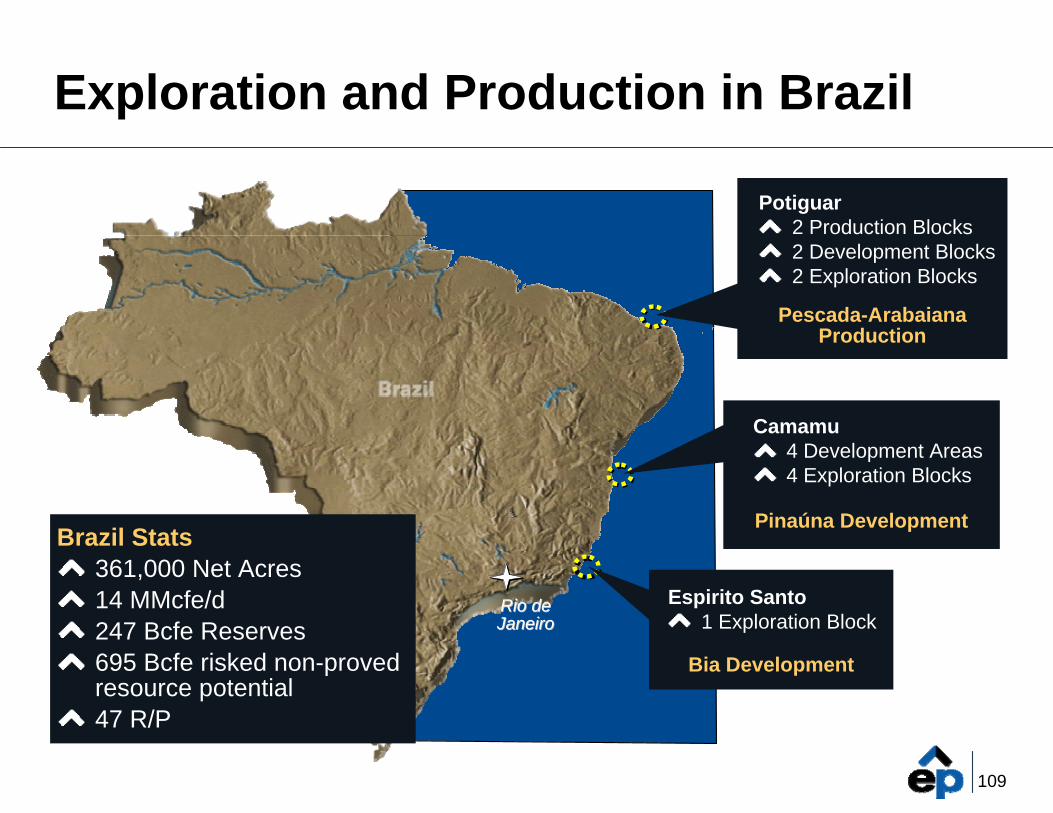
Exploration and Production in Brazil
Brazil Stats361,000 Net Acres14 MMcfe/d247 Bcfe Reserves695 Bcfe risked non-proved resource potential47 R/P
Potiguar2 Production Blocks2 Development Blocks2 Exploration Blocks
Pescada-Arabaiana Production
Camamu4 Development Areas4 Exploration Blocks
Pinaúna Development
Espirito Santo1 Exploration Block
Bia Development
110
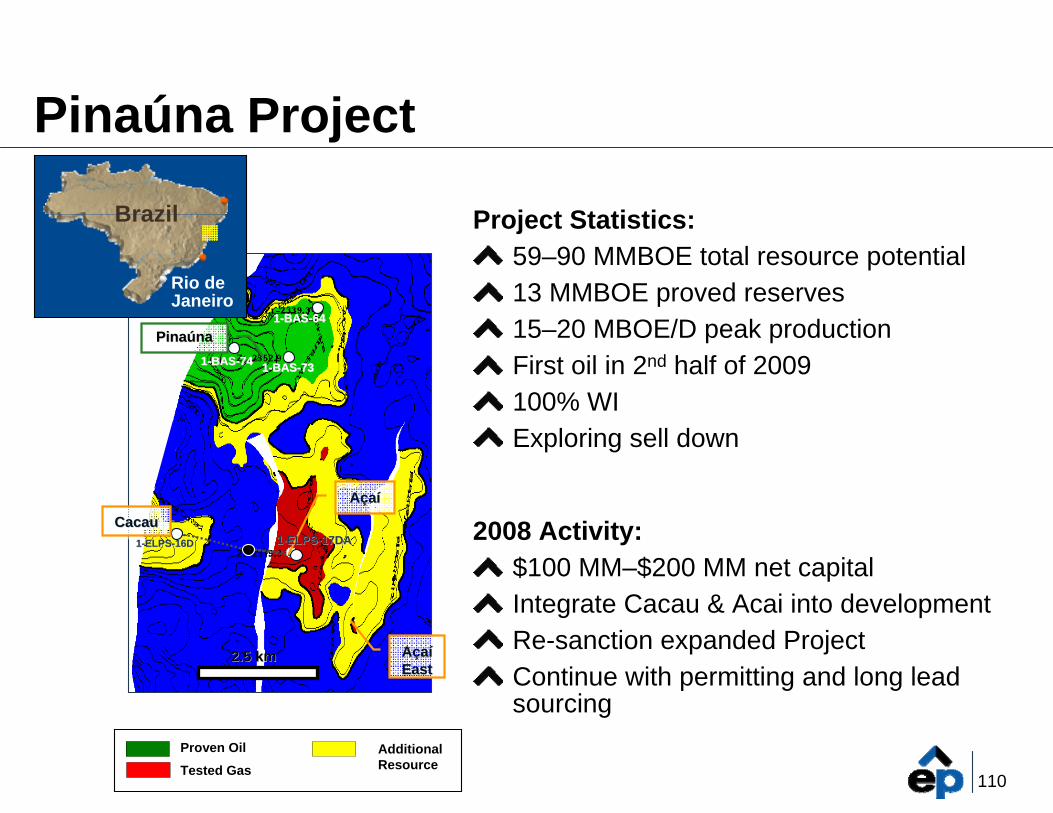
Pinaúna Project
Project Statistics:59–90 MMBOE total resource potential13 MMBOE proved reserves15–20 MBOE/D peak productionFirst oil in 2nd half of 2009100% WI Exploring sell down
2008 Activity:$100 MM–$200 MM net capitalIntegrate Cacau & Acai into developmentRe-sanction expanded ProjectContinue with permitting and long lead sourcing
11--BASBAS--737311--BASBAS--7474
11--BASBAS--6464
Resource OutlookAdditionalResource
Proven Oil
Tested Gas
2.5 km2.5 km
11--ELPSELPS--16D16D
AAççaaíí
11--ELPSELPS--17DA17DA
AAççaaííEastEast
CacauCacau
PinaPinaúúnana
Rio de Janeiro
Brazil
111
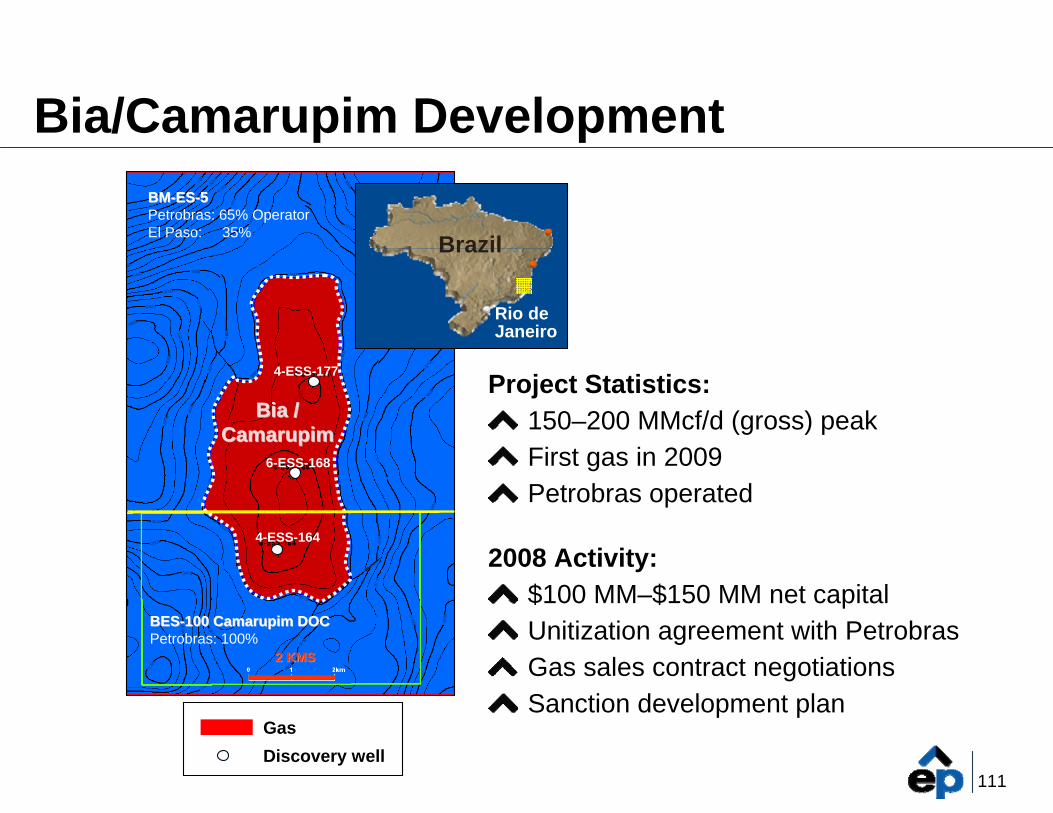
Bia/Camarupim Development
Project Statistics:150–200 MMcf/d (gross) peakFirst gas in 2009Petrobras operated
2008 Activity:$100 MM–$150 MM net capitalUnitization agreement with PetrobrasGas sales contract negotiationsSanction development plan
BESBES--100 Camarupim DOC100 Camarupim DOCPetrobras: 100%
BMBM--ESES--55Petrobras: 65% OperatorEl Paso: 35%
Gas
2 KMS2 KMS
6-ESS-168
4-ESS-164
4-ESS-177
Discovery well
Bia / Bia / CamarupimCamarupim
Rio de Janeiro
Brazil
112
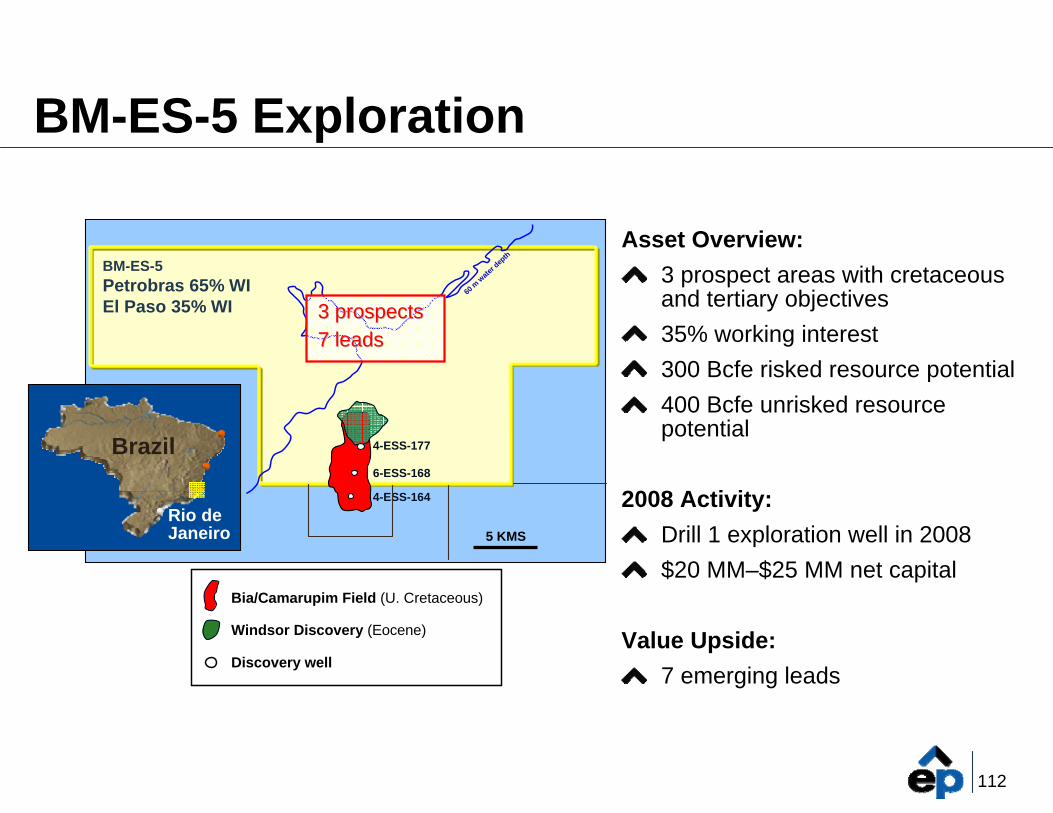
BM-ES-5 Exploration
Asset Overview:3 prospect areas with cretaceous and tertiary objectives35% working interest300 Bcfe risked resource potential400 Bcfe unrisked resource potential
2008 Activity:Drill 1 exploration well in 2008$20 MM–$25 MM net capital
Value Upside:7 emerging leads
5 KMS
60 m
wate
r dep
th
BM-ES-5Petrobras 65% WIEl Paso 35% WI
6-ESS-168
4-ESS-164
4-ESS-177
Windsor Discovery (Eocene)
Bia/Camarupim Field (U. Cretaceous)
Discovery well
Rio de Janeiro
Brazil
3 prospects3 prospects7 leads7 leads
113
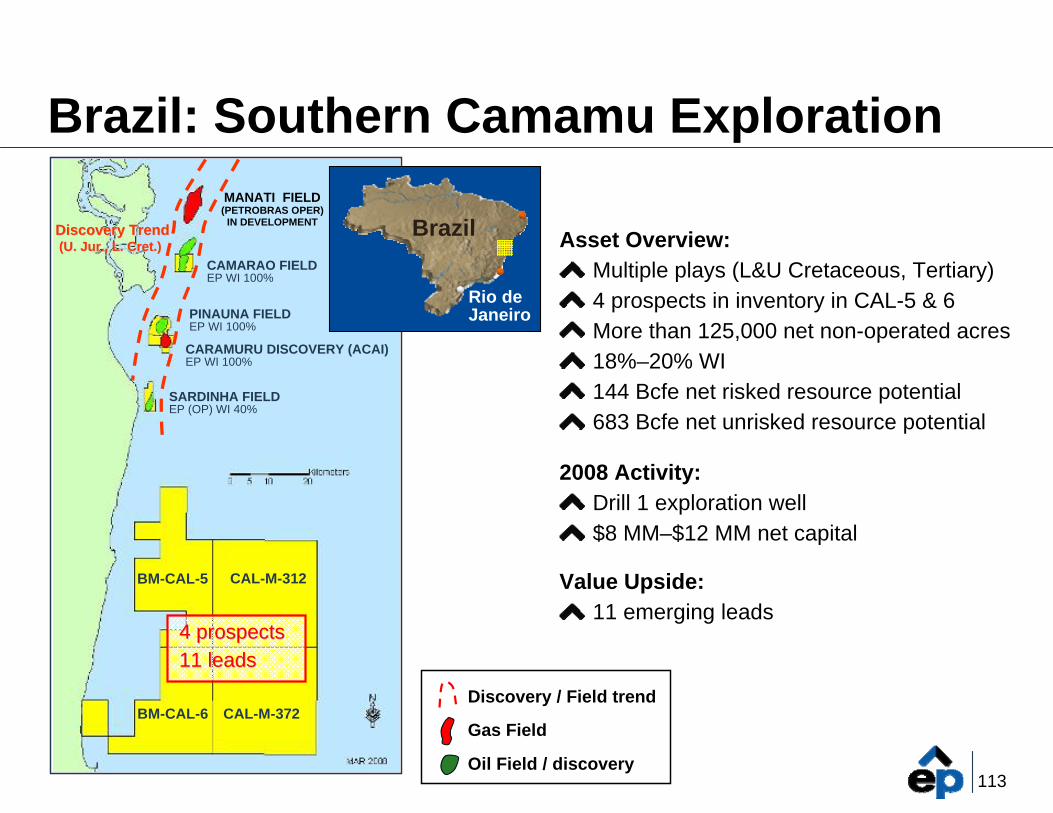
Brazil: Southern Camamu Exploration
Asset Overview:Multiple plays (L&U Cretaceous, Tertiary)4 prospects in inventory in CAL-5 & 6More than 125,000 net non-operated acres18%–20% WI144 Bcfe net risked resource potential683 Bcfe net unrisked resource potential
2008 Activity:Drill 1 exploration well$8 MM–$12 MM net capital
Value Upside:11 emerging leads
Gas Field
Oil Field / discovery
Discovery / Field trend
MANATI FIELD(PETROBRAS OPER)
IN DEVELOPMENT
CAMARAO FIELDEP WI 100%
PINAUNA FIELDEP WI 100%
SARDINHA FIELDEP (OP) WI 40%
CARAMURU DISCOVERY (ACAI)EP WI 100%
CAL-M-312
CAL-M-372
BM-CAL-5
BM-CAL-6
Discovery Trend Discovery Trend (U. Jur., L. Cret.)(U. Jur., L. Cret.)
Rio de Janeiro
Brazil
4 prospects4 prospects11 leads11 leads
114
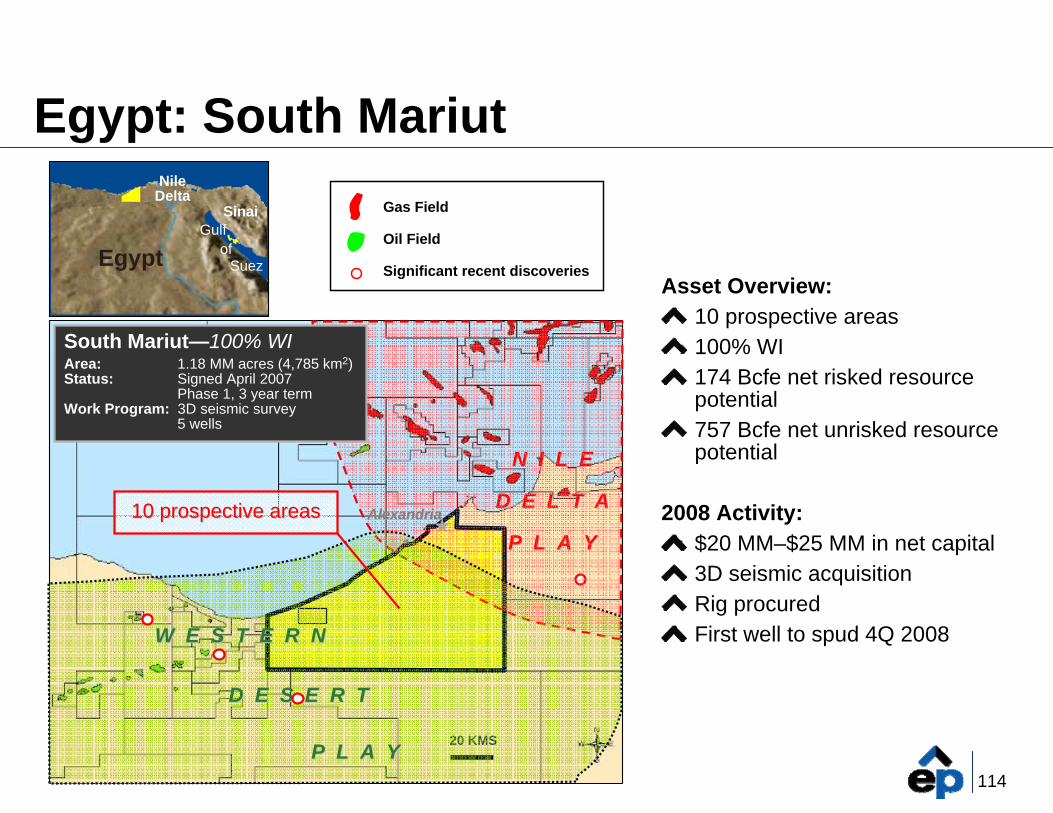
Egypt: South Mariut
Asset Overview:10 prospective areas100% WI174 Bcfe net risked resource potential757 Bcfe net unrisked resource potential
2008 Activity:$20 MM–$25 MM in net capital3D seismic acquisitionRig procuredFirst well to spud 4Q 2008
Gas Field
Oil Field
Significant recent discoveries
20 KMS
N I L E N I L E
D E L T AD E L T A
P L A Y P L A Y AlexandriaAlexandria
W E S T E R N W E S T E R N
D E S E R TD E S E R T
P L A Y P L A Y
South Mariut—100% WIArea: 1.18 MM acres (4,785 km2)Status: Signed April 2007
Phase 1, 3 year termWork Program: 3D seismic survey
5 wells
Egypt
NileDelta
Sinai
EgyptGulf
ofSuez
10 prospective areas10 prospective areas