Embed Size (px)
Citation preview

Seoul National University
Exploiting k-Nearest Neighbor Information with Many Data
Yung-Kyun NohRobotics Lab., Seoul National University
2017 TEST TECHNOLOGY WORKSHOP
2017. 10. 24 (Tue.)

Seoul National University
Contents• Nonparametric methods for estimating
density functions– Nearest neighbor methods– Kernel density estimation methods
• Metric learning for nonparametric methods– Generative approach for metric learning
• Theoretical properties and applications
2

Seoul National University
=[1, 2, 5, 10, …]T
Representation of Data
3
• Each datum is one point in a data space
Data space

Seoul National University
Classification
4
Seoul National University
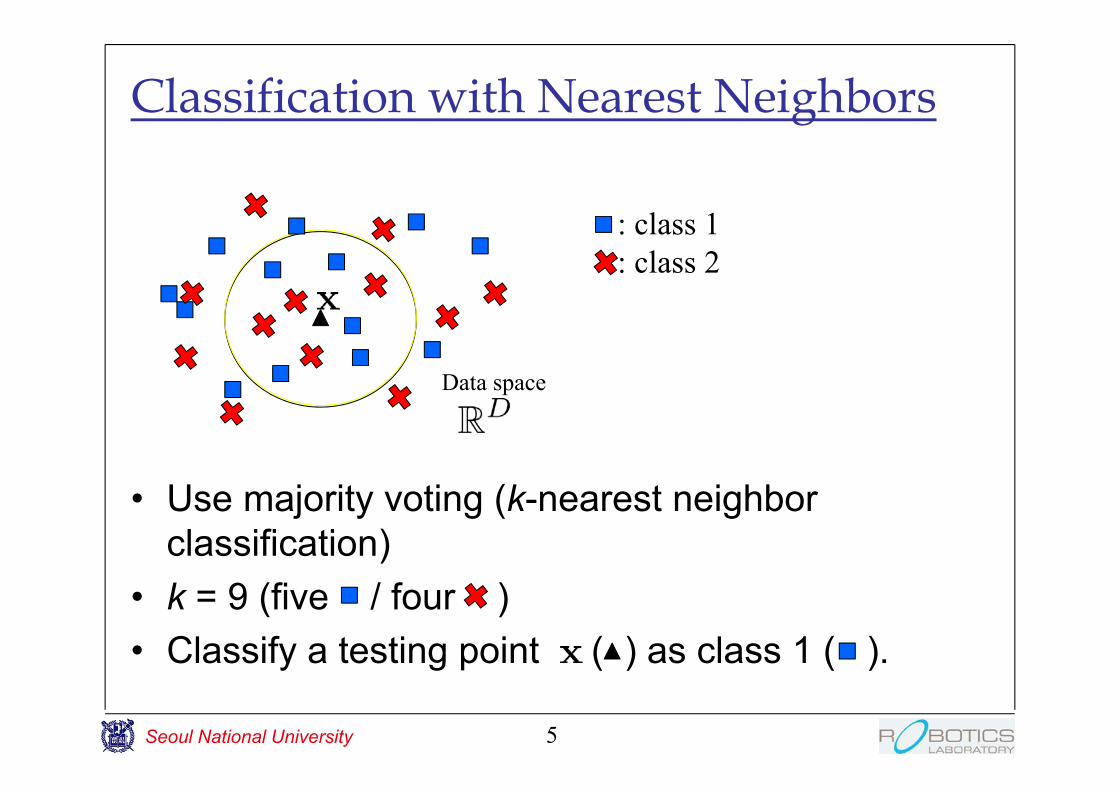
Classification with Nearest Neighbors
• Use majority voting (k-nearest neighbor classification)
• k = 9 (five / four )• Classify a testing point ( ) as class 1 ( ).
5
: class 1: class 2
Data space

Seoul National University 6
ship ship ship airplane ship
ship shipship deer ship
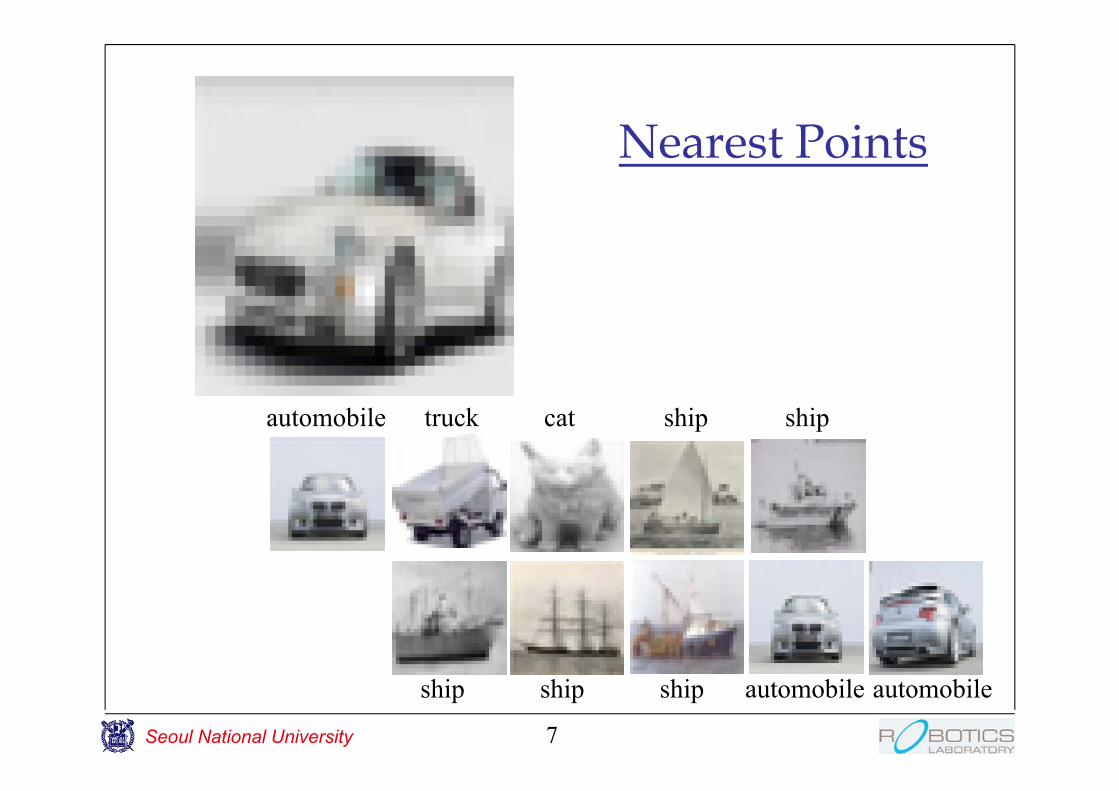
Nearest Points
Seoul National University 7
automobile truck cat ship ship
automobile automobileship ship ship
Nearest Points

Seoul National University
Bayes Classification• Bayes classification using underlying density
functions: Optimal
8
In general,we do not know the underlying density.
Error:
Bayes risk

Seoul National University
Nearest Neighbors and Bayes Classification
• Surrogate method of using underlying density functions.
9
Count nearest neighbors!

Seoul National University 10
• Tomas M. Cover (8/7/1938~3/26/2012)• BS. in Physics from MIT• Ph.D. in EE from Stanford• Professor in EE and Statistics, Stanford
• Peter E. Hart (Bone c. 1940s)• MS., Ph.D. from Stanford• A strong advocate of artificial intelligence in industry• Currently Group Senior Vice President at the Ricoh Company, Ltd.
Seoul National University
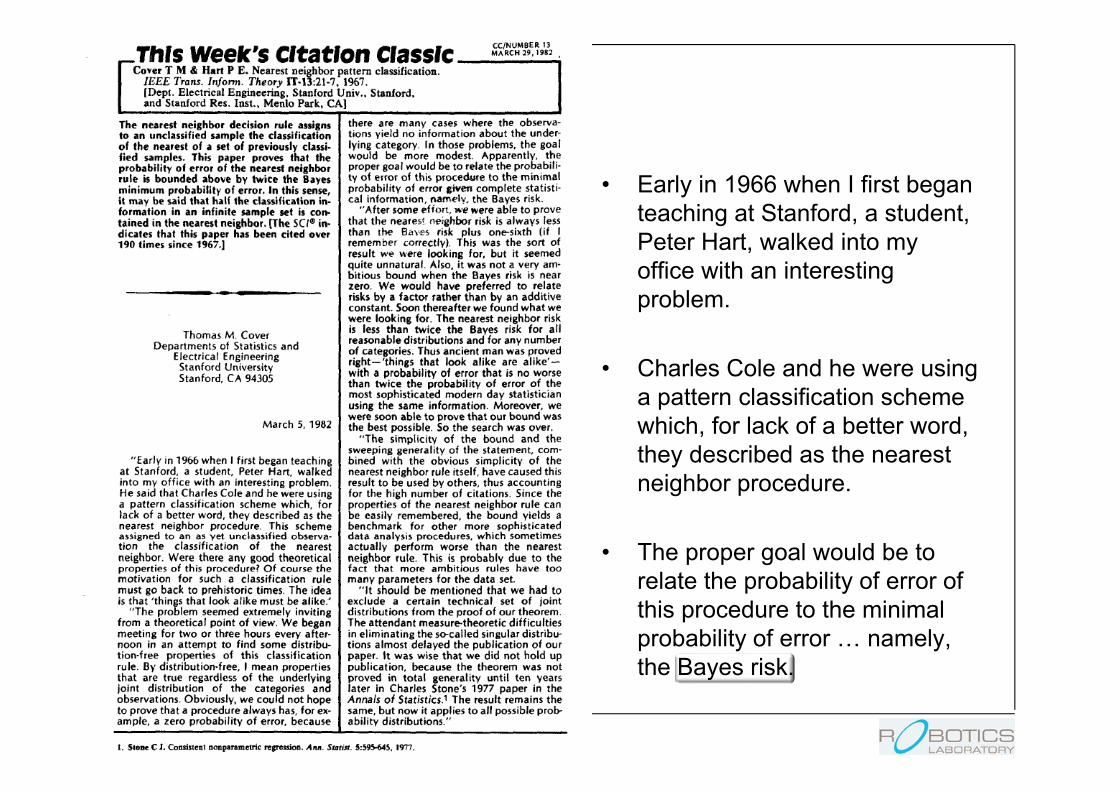
• Early in 1966 when I first began teaching at Stanford, a student, Peter Hart, walked into my office with an interesting problem.
• Charles Cole and he were using a pattern classification scheme which, for lack of a better word, they described as the nearest neighbor procedure.
• The proper goal would be to relate the probability of error of this procedure to the minimal probability of error … namely, the Bayes risk.
11

Seoul National University
Nearest Neighbors and Bayes Risk
12
[T. Cover and P. Hart, 1967]
• 1-NN error
• k-NN error
, uniformly!

Seoul National University 13
Nearest Neighbor Classification and Accuracy
Nearest neighbor classification with two-class data from two different random Gaussians

Seoul National University
Metric Dependency of Nearest Neighbors
14
• Different metric changes class belongings
Mahalanobis-type distance:
Classified as blueClassified as red

Seoul National University
Conventional Idea of Metric Learning
15
Class 1 Class 2 Class 1 Class 2

Seoul National University
Many Data Situation with Overlap
16
Seoul National University
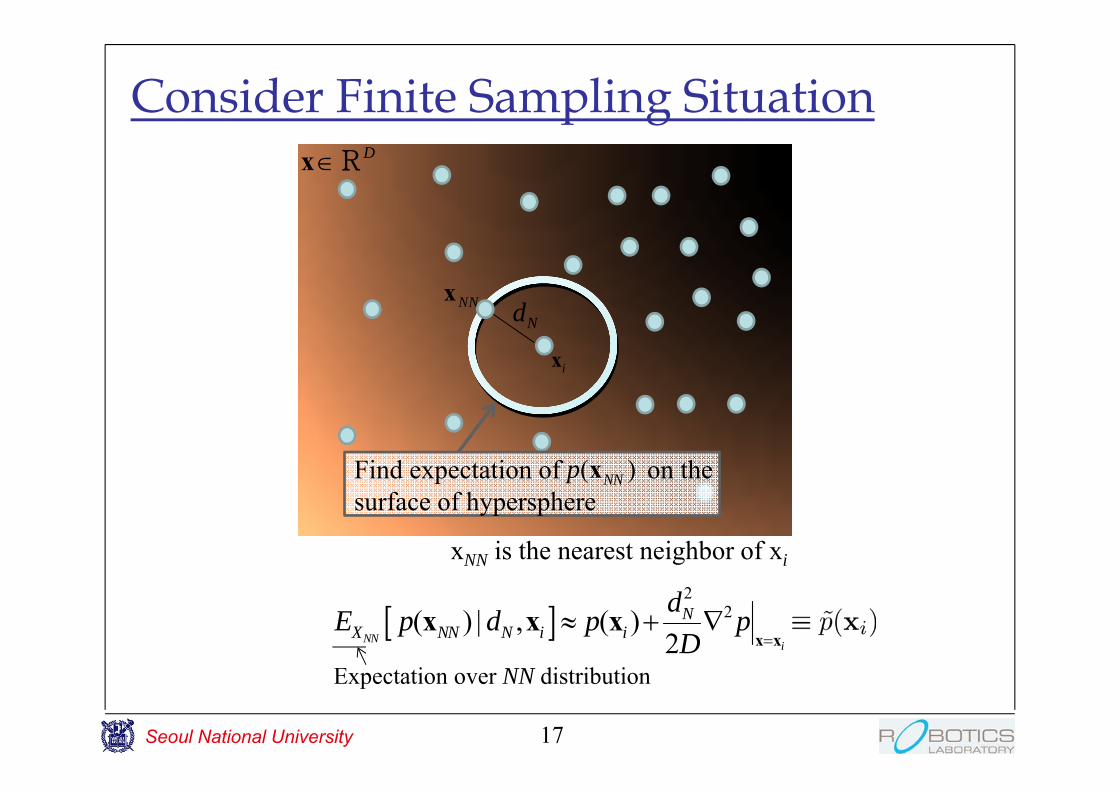
Consider Finite Sampling Situation
17
Expectation over NN distribution
2
2( ) | , ( )2NN i
NX NN N i i
dE p d p pD
x x
x x x
Nd
ix
NNx
Dx R
Find expectation of on the surface of hypersphere
( )NNp x
xNN is the nearest neighbor of xi

Seoul National University
Bias of Nearest Neighbor Classification• When nearest neighbor appears at a distance ‘d’.
18
Test point x NN point
Test point x NN point
Seoul National University
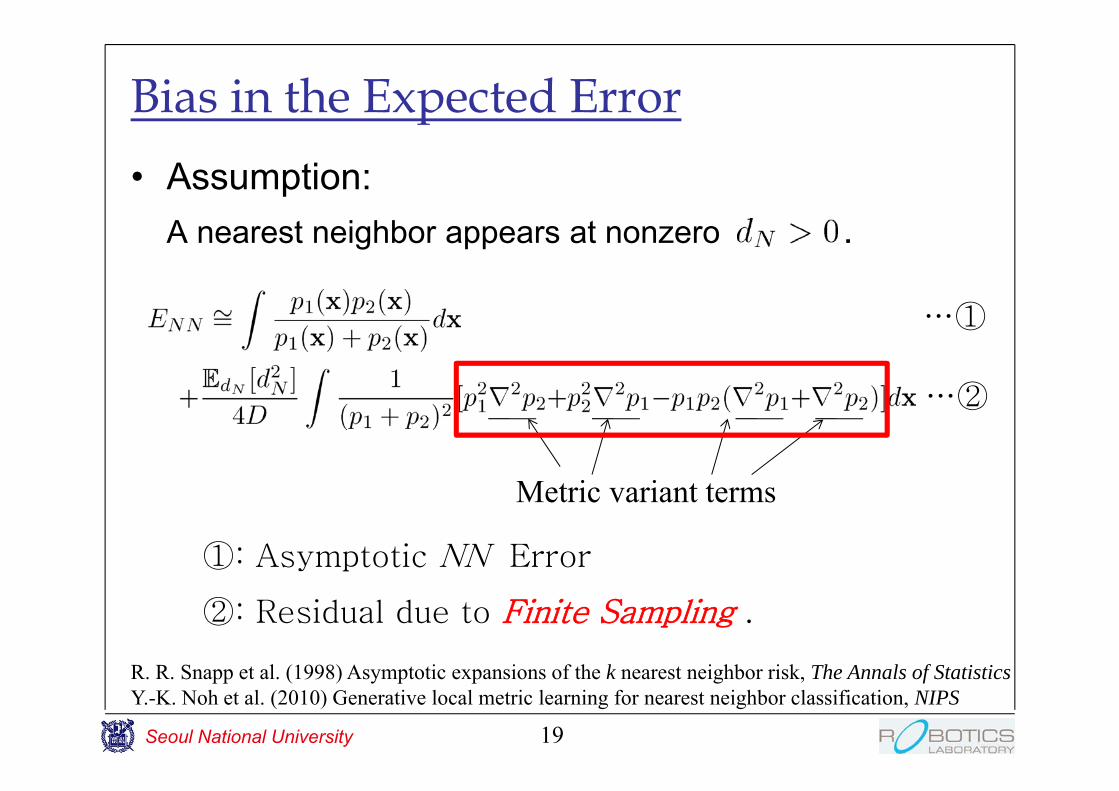
Bias in the Expected Error• Assumption:
A nearest neighbor appears at nonzero .
19
①: Asymptotic NN Error
②: Residual due to Finite Sampling .
…①
…②
Metric variant terms
R. R. Snapp et al. (1998) Asymptotic expansions of the k nearest neighbor risk, The Annals of StatisticsY.-K. Noh et al. (2010) Generative local metric learning for nearest neighbor classification, NIPS
Seoul National University
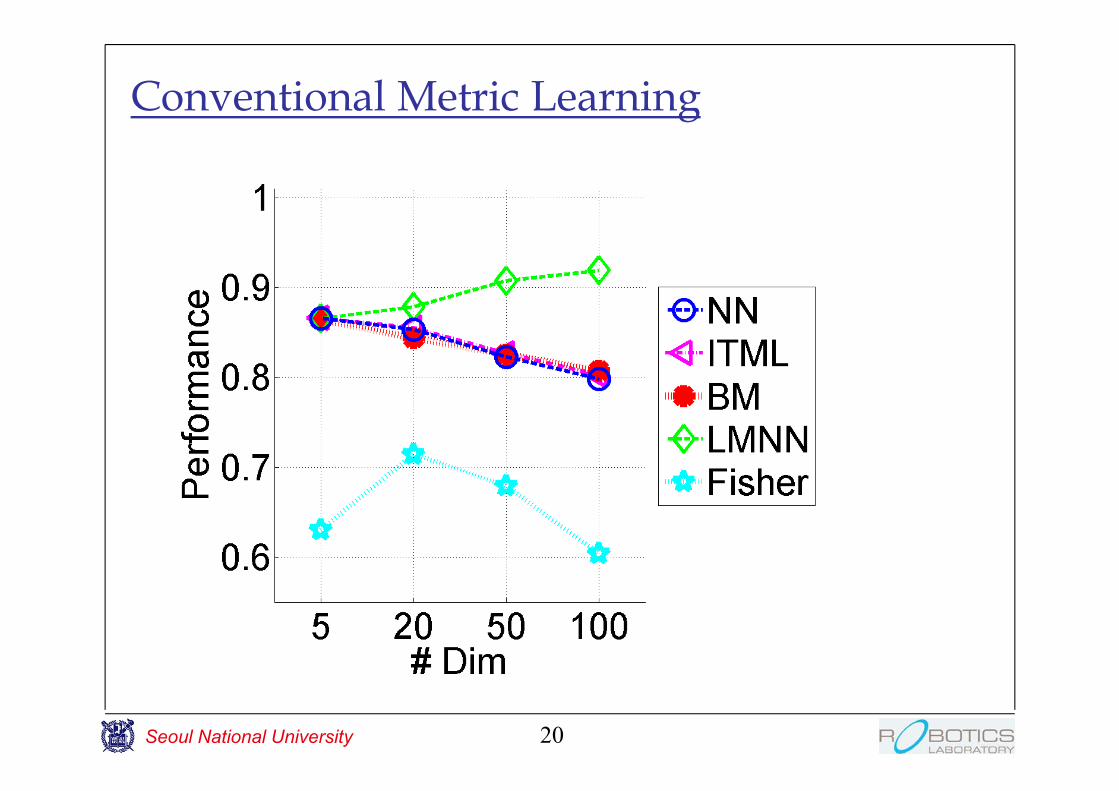
Conventional Metric Learning
20
Seoul National University
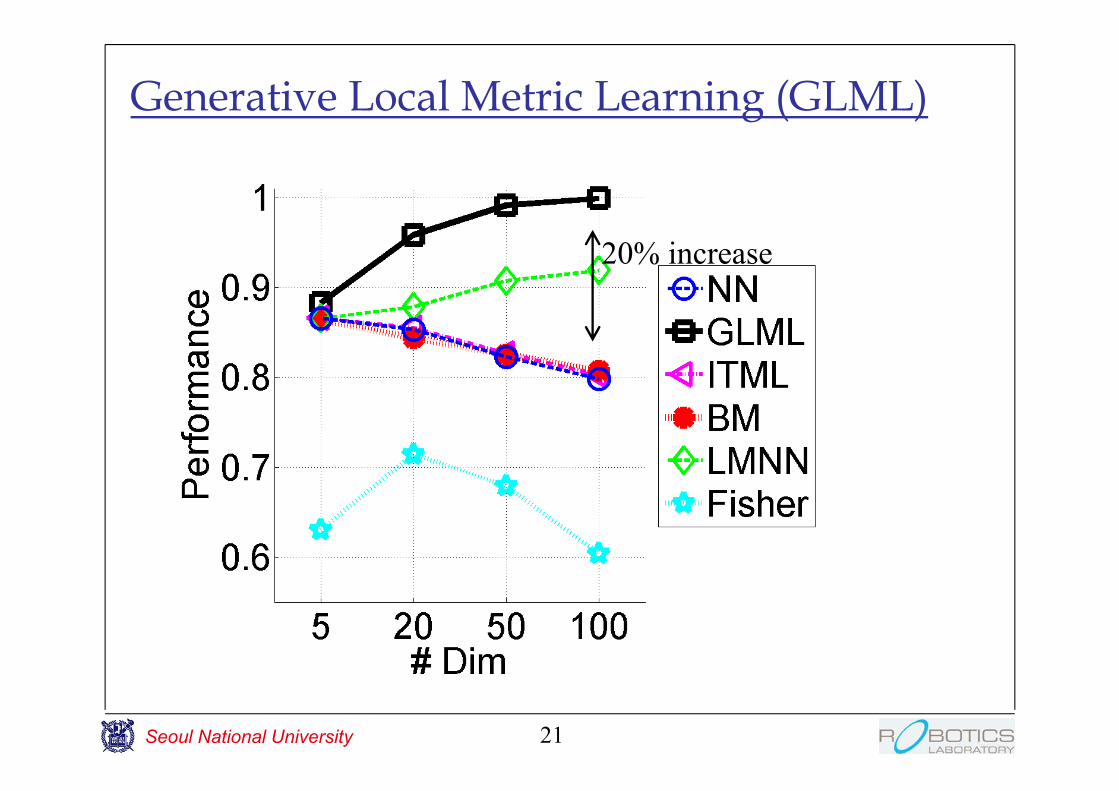
Generative Local Metric Learning (GLML)
21
20% increase
Seoul National University
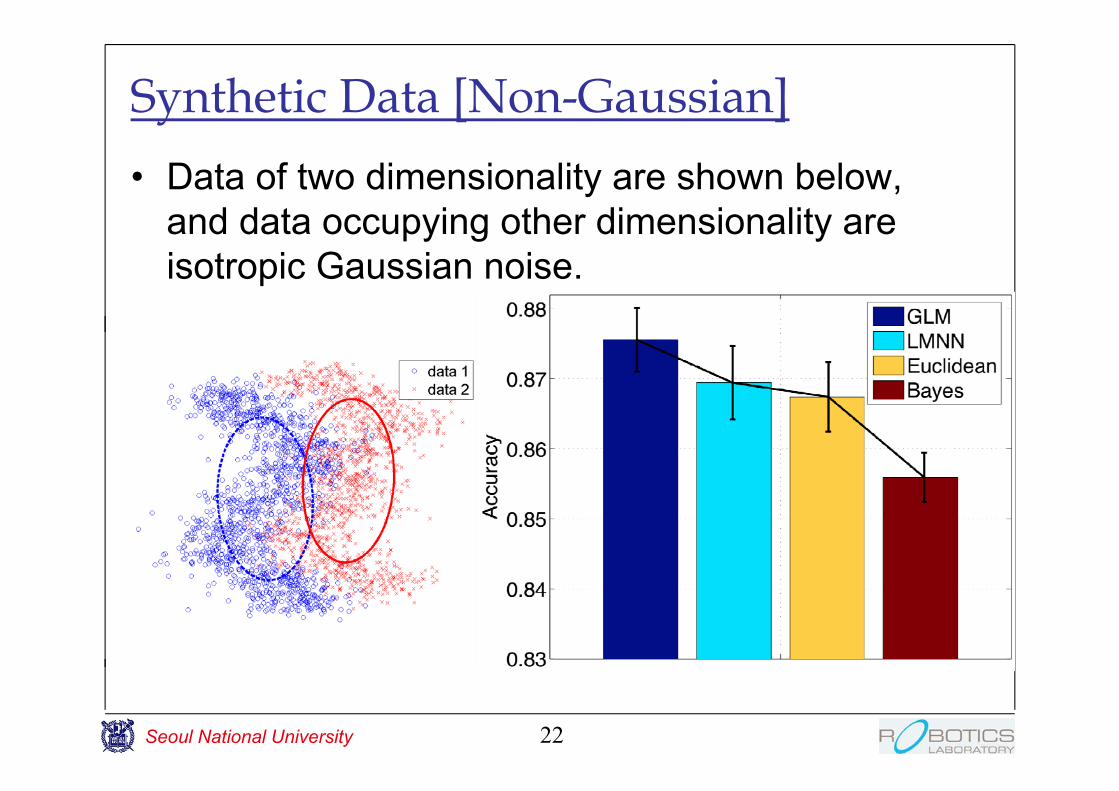
Synthetic Data [Non-Gaussian]• Data of two dimensionality are shown below,
and data occupying other dimensionality are isotropic Gaussian noise.
22

Seoul National University
100 180 270 350
0.55
0.6
0.65
0.7
0.75
# tr. data
Per
form
ance
Various Datasets – comparison with discriminative metric learning
23
German Ionosphere
Twonorm USPS 8x8 TI46
Waveform
100 150 200 2500.62
0.63
0.64
0.65
0.66
# tr. data
Per
form
ance
200 500 1000 1500
0.78
0.8
0.82
0.84
0.86
# tr. data
Per
form
ance
10 30 50 100
0.6
0.7
0.8
0.9
# tr. data
Per
form
ance
500 1000 2000 3000
0.9
0.92
0.94
0.96
# tr. data
Per
form
ance
100 300 500 1000
0.9
0.95
1
# tr. data
Per
form
ance
[Y.-K. Noh et al., 2010]

Seoul National University
Image Data Classification with Convolutional Neural Networks (AlexNet)
24
Caltech256Caltech101

Seoul National University
Manifold Embedding (Isomap)
25
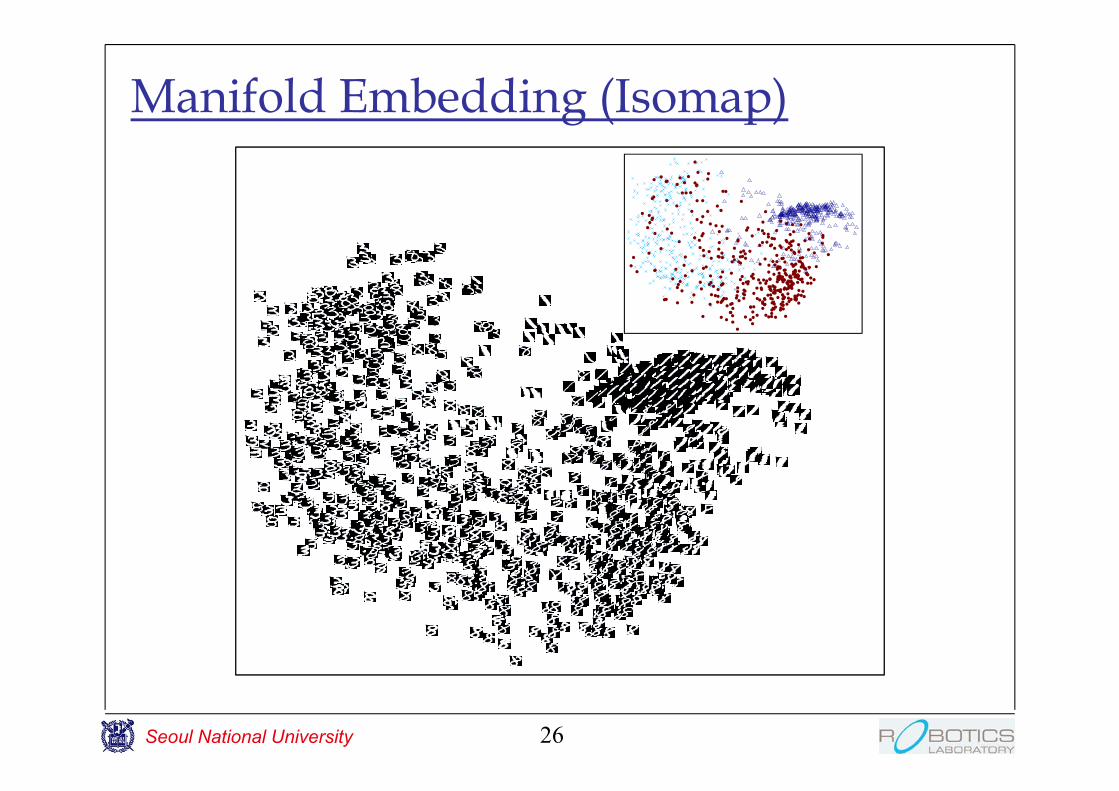
Use Dijkstra algorithm to calculate the manifold distance from nearest neighbor distanceMDS using manifold distance
( X )
Seoul National University
Manifold Embedding (Isomap)
26
Seoul National University
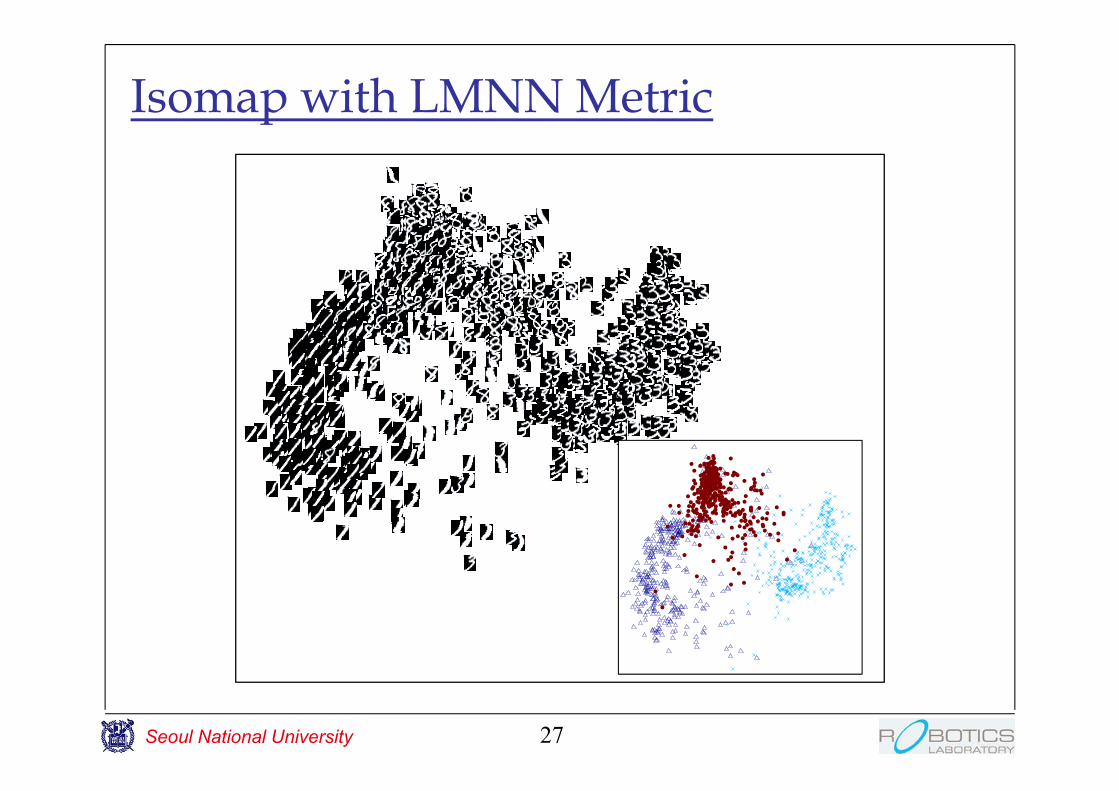
Isomap with LMNN Metric
27
Seoul National University
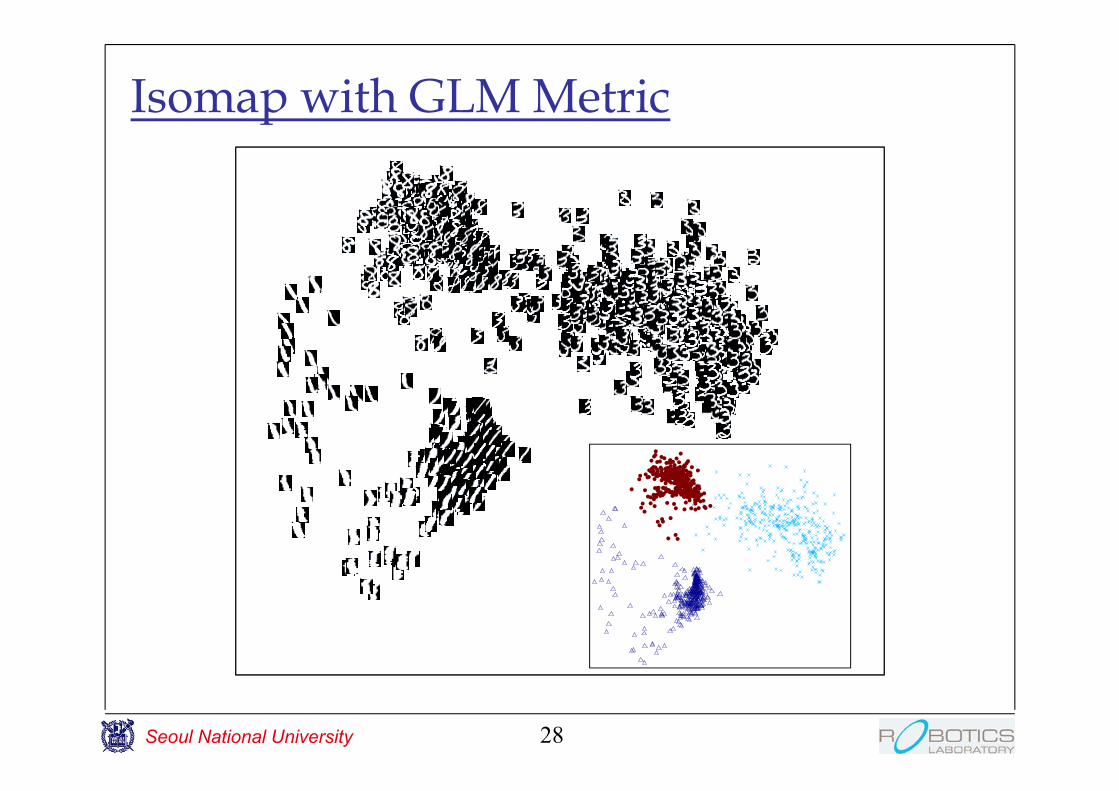
Isomap with GLM Metric
28
Seoul National University
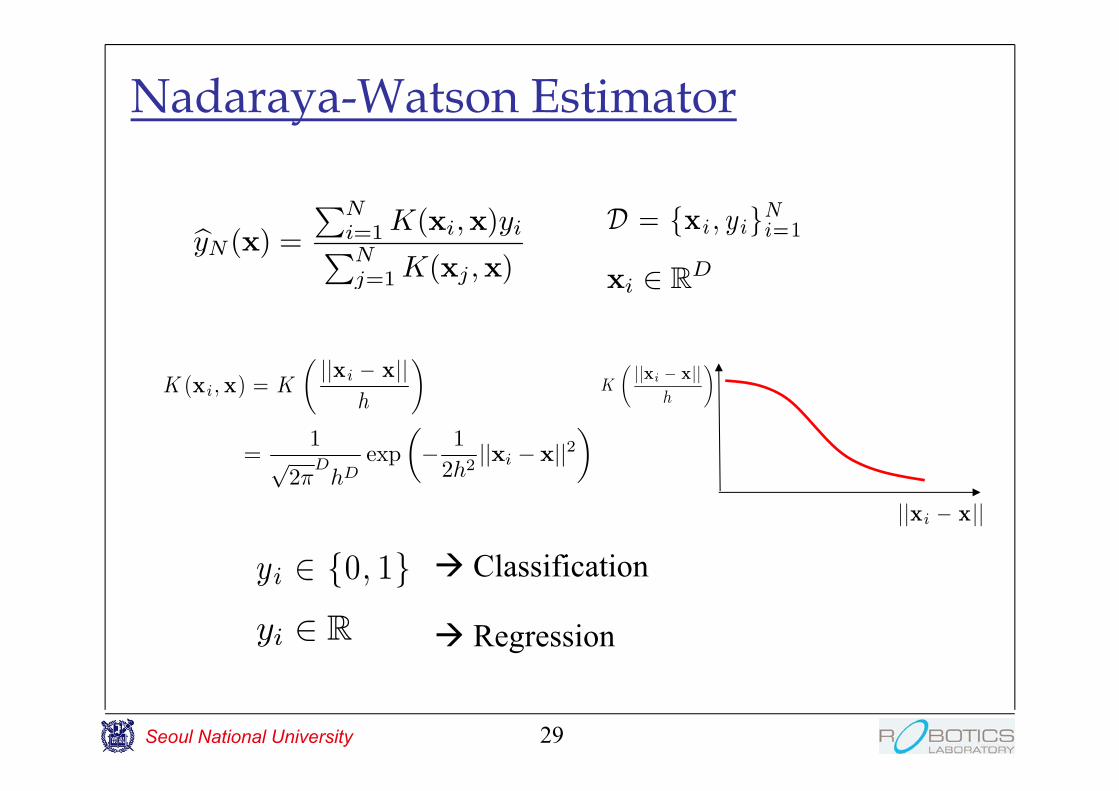
Nadaraya-Watson Estimator
29
byN (x) =
PNi=1 K(xi;x)yiPNj=1 K(xj ;x)
D = fxi ; yigNi=1
yi 2 f0; 1g Classification
yi 2 R Regression
xi 2 RD
K (xi ; x) = K
μjjxi ¡ xjj
h
¶=
1p
2¼D
hDexp
μ¡ 1
2h2jjxi ¡ xjj2
¶ K
μjjxi ¡ xjj
h
jjxi ¡ xjj

Seoul National University
Kernel regression (Nadaraya-Watson regression) with metric learning
30
byN (x) =
PNi=1 K(xi;x)yiPNi=1 K(xi;x)
D = fxi ; yigNi=1
K (xi ; x) = K
μjjxi ¡ xjj
h
¶=
1p
2¼D
hDexp
μ¡ 1
2h2jjxi ¡ xjj2
¶y1 y2
y3y4 y5
x1
x2
x3
x4 x5
x
by5(x) =K(x1;x)P5i=1 K(xi;x)
y1+K(x2; x)P5i=1 K(xi;x)
y2+K(x3;x)P5i=1 K(xi;x)
y3+K(x4;x)P5i=1 K(xi; x)
y4+K(x5; x)P5i=1 K(xi;x)
y5
y(x)?
xi;x 2 RD
Seoul National University
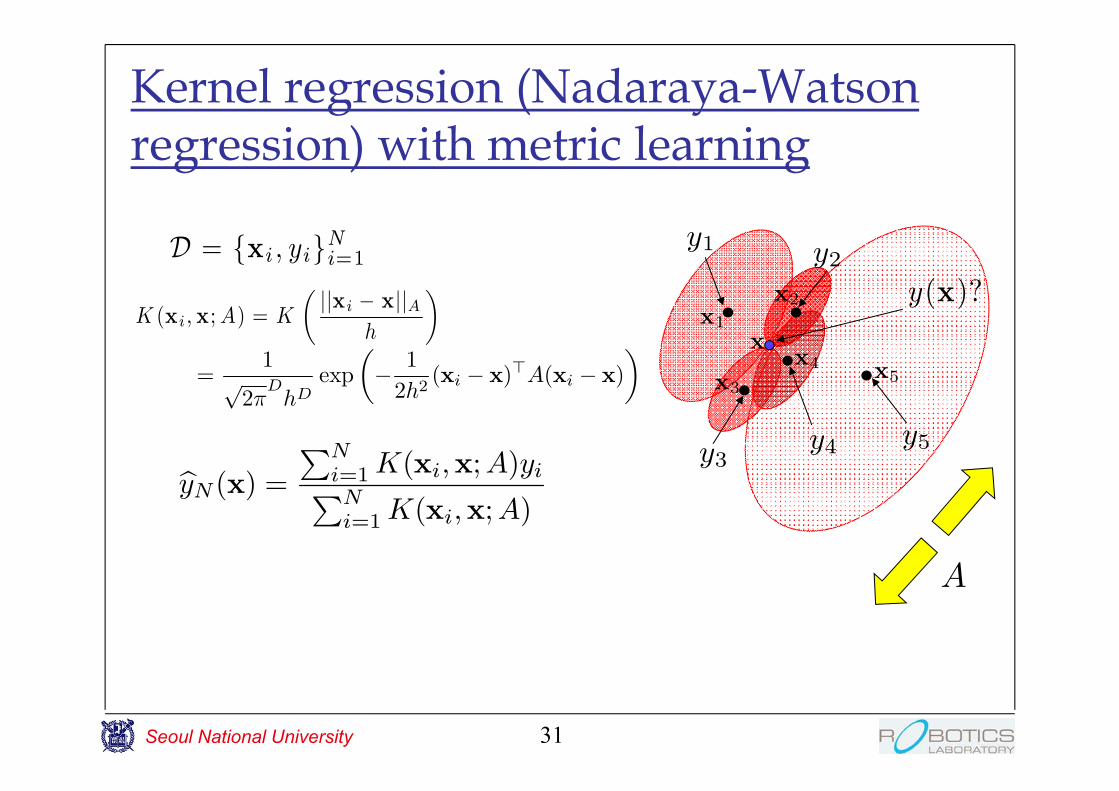
Kernel regression (Nadaraya-Watson regression) with metric learning
31
byN(x) =
PNi=1 K(xi;x;A)yiPNi=1 K(xi;x;A)
D = fxi ; yigNi=1
K (xi ; x; A) = K
μjjxi ¡ xjjA
h
¶=
1p
2¼D
hDexp
μ¡ 1
2h2(xi ¡ x)>A(xi ¡ x)
¶y1 y2
y3y4 y5
x1
x2
x3
x4 x5
x
y(x)?
A

Seoul National University
Nadaraya-Watson Regression is Asymptotically Optimal
32
limN!1
byN(x) = Ep(yjx)[y]
Minimizes mean square error (MSE)Metric independent asymptotic property
byN (x) =
PNi=1 K(xi;x)yiPNj=1 K(xj ;x)
(h ! 0)

Seoul National University
Mean Square Error with Finite Samples
33
byN (x) =
PNi=1 Kh(xi;x)yiPNj=1 Kh(xj ;x)
1
Ntst
NtstXj=1
(byN (xj)¡ yj)2
Seoul National University
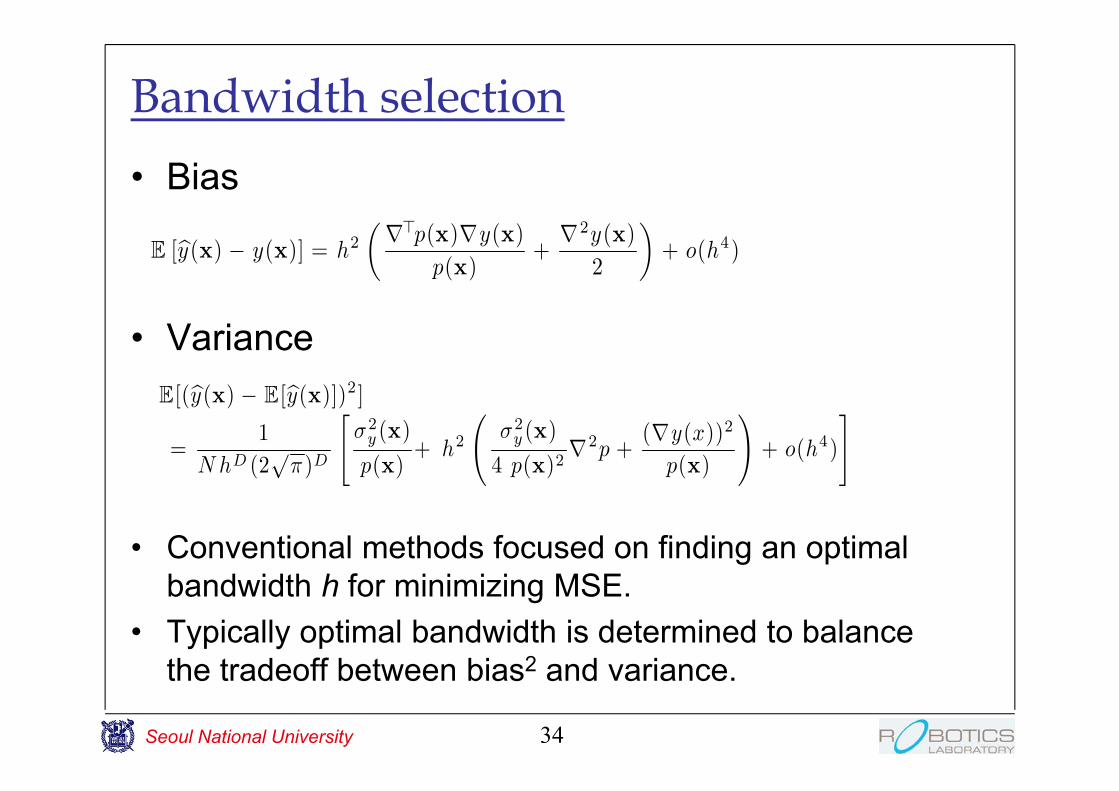
Bandwidth selection• Bias
• Variance
• Conventional methods focused on finding an optimal bandwidth h for minimizing MSE.
• Typically optimal bandwidth is determined to balance the tradeoff between bias2 and variance.
34
E [by(x) ¡ y(x)] = h2
μr>p(x)ry(x)
p(x)+r2y(x)
2
¶+ o(h4)
E[(by(x) ¡ E[by(x)])2 ]
=1
N hD (2p
¼)D
"¾2
y (x)
p(x)+ h2
þ2
y (x)
4 p(x)2r2p +
(ry(x))2
p(x)
!+ o(h4)
#

Seoul National University
Bandwidth selection• Bias
• Variance
• Conventional methods focused on finding an optimal bandwidth h for minimizing MSE.
• Typically optimal bandwidth is determined to balance the tradeoff between bias2 and variance.
35
E [by(x) ¡ y(x)] = h2
μr>p(x)ry(x)
p(x)+r2y(x)
2
¶+ o(h4)
E[(by(x) ¡ E[by(x)])2 ]
=1
N hD (2p
¼)D
"¾2
y (x)
p(x)+ h2
þ2
y (x)
4 p(x)2r2p +
(ry(x))2
p(x)
!+ o(h4)
#
+ Bias2
+ MSE1 + Bias2

Seoul National University
For Gaussian:
36
• Bias
• Variance
– 1) With Gaussian, we only consider the first term because y(x) is linear.
– 2) We simply ignore variance minimization. We will explain the reason later.
E [by(x) ¡ y(x)] = h2
μr>p(x)ry(x)
p(x)+r2y(x)
2
¶+ o(h4)
E[(by(x) ¡ E[by(x)])2 ]
=1
N hD (2p
¼)D
"¾2
y (x)
p(x)+ h2
þ2
y (x)
4 p(x)2r2p +
(ry(x))2
p(x)
!+ o(h4)
#
Linear y(x)
Simply ignore all variance
r2y(x) = 0

Seoul National University
For x & y Jointly Gaussian• Learned metric is not sensitive to the
bandwidth
37

Seoul National University
Benchmark Data
38

Seoul National University
Two Theoretical Properties for Gaussians
• The existence of a symmetric positive definite matrix A that eliminates the first term of the bias, .
• With optimal bandwidth h minimizing the leading order terms, the minimum mean square error is the square of bias in infinitely high-dimensional space.
39
r>p(x)ry(x)
p(x)

Seoul National University
• Choosing between two alternatives under time pressure with uncertain information.
Diffusion Decision Model
40
z
-z
evidence
T
class 1 class 1
class 2
Speed-accuracy tradeoffIncrease accuracy
Increase accuracy
Increase speed
Increase speed

Seoul National University
Sequential Sampling Methods• Sequential sampling methods for optimal
decision making
41
J. M. Beck. et al. (2008)
LIP
Response after some time (~1s)
…
Signals from two neurons of different receptive fields
…

Seoul National University
Equivalence Principle
42
• DDM (Diffusion Decision Model) for comparing two Poisson processes
• k-nearest neighbor classification in the asymptotic situation for 2 classes
Neuron
Neuron Neuron

Seoul National University
Diffusion Decision Processes• Implementation of diffusion decision model
with NN classification
43
Confidence level 0.8 Confidence level 0.9
(PV criterion)
Seoul National University
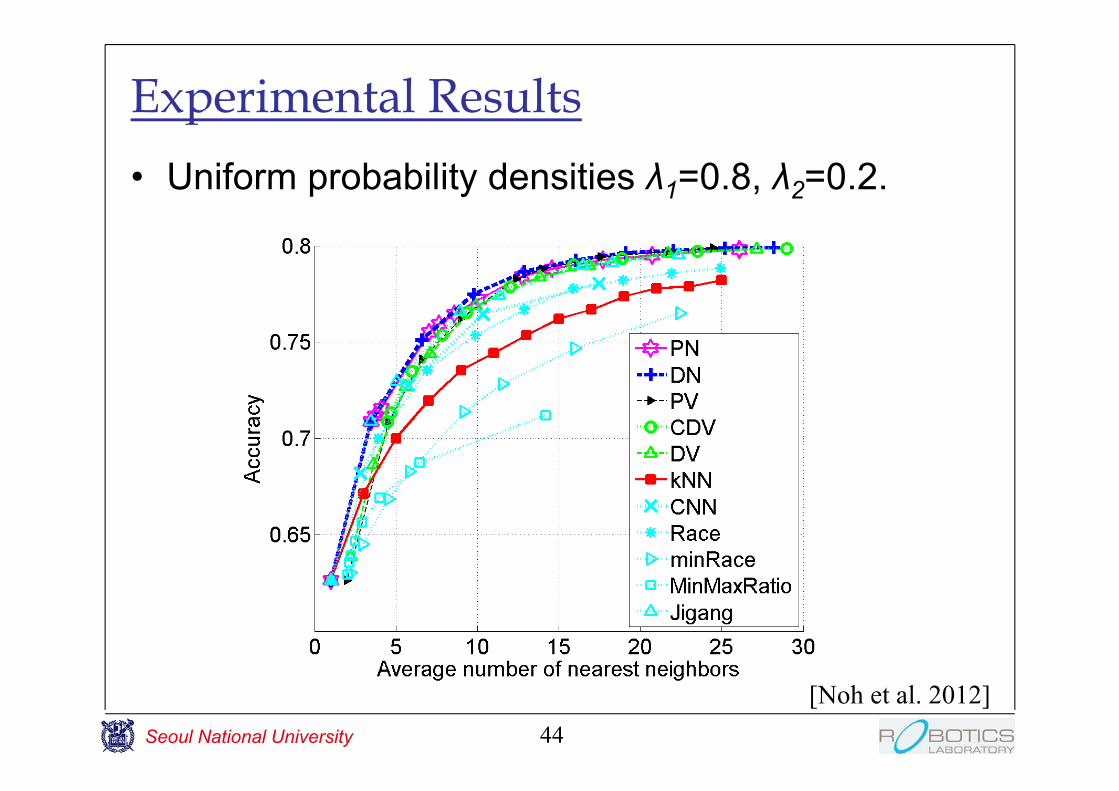
Experimental Results• Uniform probability densities λ1=0.8, λ2=0.2.
44
[Noh et al. 2012]
Seoul National University
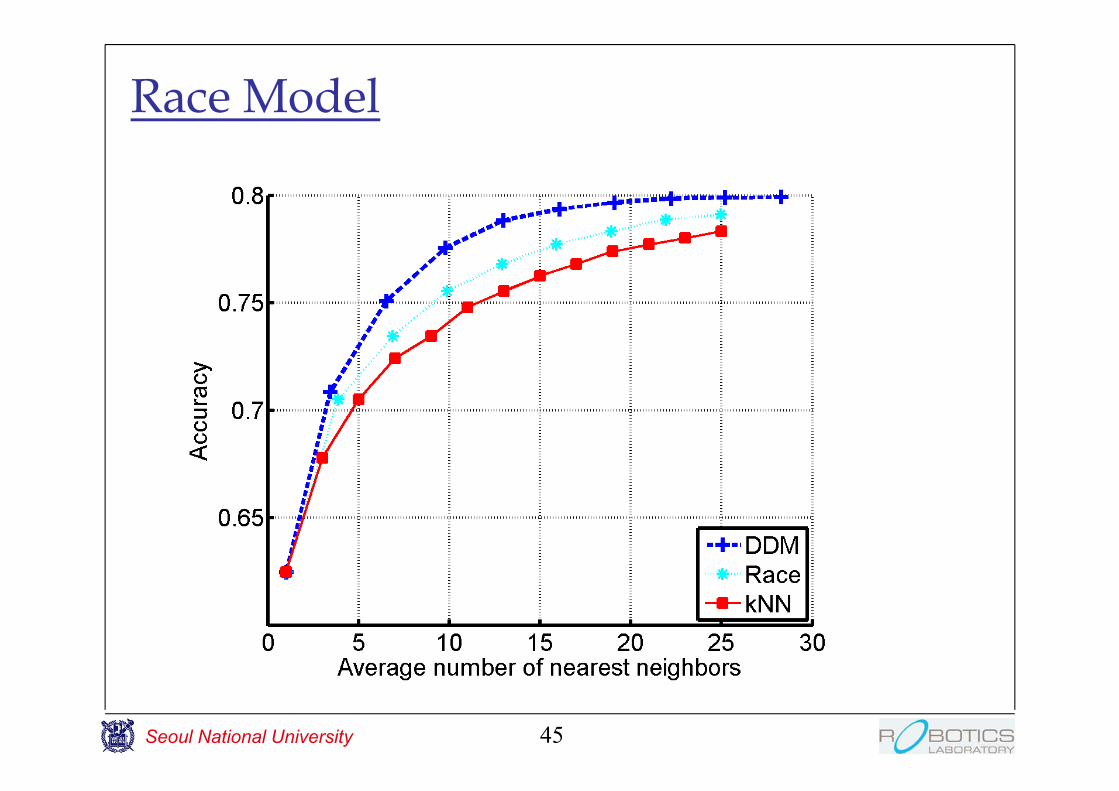
Race Model
45

Seoul National University
Effect of Number of Data• Two Gaussian Data
46
Number of data: Number of data:

Seoul National University
CIFAR-10 Images• Number of data: 1000/class
47
32x32 color images
Seoul National University
Summary• Nearest neighbor methods and asymptotic
property
• Naradaya-Watson regression with metric learning
• Diffusion decision making and nearest neighbor methods
48