Embed Size (px)
Citation preview
Explaining Households’
Investment Behavior
_______________
Dmitry S. MAKAROV
Astrid V. SCHORNICK
2010/44/FIN

Explaining Households’ Investment Behavior
Dmitry S. Makarov*
Astrid V. Schornick **
March 31, 2010
This paper has benefitted from conversations with Suleyman Basak, Francisco Gomes, Anna Pavlova and Raman Uppal. All errors are ours.
* Assistant Professor of Finance at New Economic School, Nakhimovsky pr. 47, Moscow
117418, Russia. Ph: (+7-495) 129-3911 Email: [email protected] ** Assistant Professor of Finance at INSEAD, Boulevard de Constance, 77305 Fontainebleau,
France. Ph: +33 (0) 1 60 72 49 92 Email : [email protected]
A working paper in the INSEAD Working Paper Series is intended as a means whereby a faculty researcher's thoughts and findings may be communicated to interested readers. The paper should be considered preliminary in nature and may require revision. Printed at INSEAD, Fontainebleau, France. Kindly do not reproduce or circulate without permission.

Abstract
Building on a framework of heterogeneous uncertainty across the population, this paper
provides a unified theoretical explanation for several salient features of household investment
behavior: First, a fraction of households will choose not to participate in the stock market,
with poorer households less likely to participate. Second, among the part of the population
that does choose to invest, wealthier households choose to invest a larger share of their
wealth into risky assets than less wealthy households. The model suggests that as aggregate
wealth rises, we should see higher levels of stock market participation. We build on a
CARA-normal framework with uncertainty-averse investors and link the level of uncertainty
to investor wealth, given the empirical evidence that wealthier investors tend to acquire
more costly information. The model is able to reconcile previous conflicting findings: our
model shows that the intuition of models with exogenous participation restrictions—limited
stock market participation leads to a higher equity premium—can indeed be retained when
the participation decision is endogenized.
2
1 Introduction
The availability of detailed data on household decision making has revealed that households
seem to follow particular patterns in their consumption and investment decisions, across different
countries and different forms of data collection. However, these patterns are not easily matched
by traditional representative-agent models of a utility maximizing investor. According to the
2001 Survey of Consumer Finances, 89% of households whose wealth is above the median
participate in the stock market, while the participation rate is only 15% among those whose
wealth is below the median. Within the group that does hold stocks in their portfolio, household
wealth predicts the degree of exposure to risky assets: wealthier households invest not just larger
sums into stock markets, but indeed a larger proportion of their wealth.
The robustness of these findings suggests that they are the result of optimal—albeit constrained—
decision making, which should be reflected in stock markets and the compensation they provide
for carrying risk. It is then perhaps not surprising that asset pricing models with a single rep-
resentative agent have had limited success in explaining aggregate market behavior like returns
and the risk premium. And by construction, they could provide no insight into these observed
differences between individuals’ investment or trading decisions.
While the theoretical literature has addressed the issues of limited participation as well as
the impact of wealth on investment decisions respectively, in this paper we provide a unified
theory that can explain these salient features of household investment decisions jointly. We
show that costly access to information, and investors’ aversion to the uncertainty that remains,
leads less wealthy households to opt out of participation in the stock market. At the same time,
among the group that chooses to invest, wealthier households invest a larger fraction of their
wealth in risky assets. As access to information becomes less costly, the model predicts that
stock market participation will increase—a trend that has been observed in the past decades.
In addition to matching these empirical features of portfolio choice, the model is also able to
reconcile conflicting findings of earlier papers on the resulting market risk premia. When a
fraction of the population chooses not to participate in the stock market, equity risk premia
rise. This is in contrast to the findings of, for example, Cao, Wang and Zhang (2005), who
find in their model that endogenizing the participation decision leads to lower risk premia when
3

investors opt out of the stock market. Earlier papers such as Basak and Cuoco (1998) suggested
a model of exogenously restricted participation to explain the high market risk premium seen
in the data. Taking advantage of the tractability provided by our model, we show that this
discrepancy in results can be reconciled by using a more realistic utility function for investors
when endogenizing the participation decision.
The empirical literature has identified two particularly robust features. Consistent with
the 2001 survey mentioned, Haliassos and Bertaut (1995) and Mankiw and Zeldes (1991) for
example show that a large fraction of households do not participate at all in the stock market,
with poorer households more likely not to hold any stocks. However, when looking only at the
the fraction of the population that does invest in the stock market, Vissing-Jorgenssen (2002),
Bertaut and Starr-McCluer (2000), as well as Perraudin and Sorensen (2000) find that the
wealth share invested in risky assets tends to increase with wealth.
While there are models that explain each of these patterns individually, ours is the first,
to our knowledge, to provide a unified explanation. Gomes and Michaelides (2006) as well
as Cao, Wang and Zhang (2005) obtain endogenous limited participation, but do not explain
the positive correlation between wealth and the relative amounts invested into stocks. Peress
(2004) and Wachter and Yogo (2007) on the other hand provide an explanation for the increasing
wealth share, but do not have limited participation—their models suggest that all agents should
optimally hold at least some amount of risky assets.
The theoretical literature in asset pricing has diverged into two main directions in the effort
to explain empirical regularities. One that focuses on modeling the features of the fundamental
economy and the underlying risk more comprehensively. Other efforts have instead focused on
sources of heterogeneity across investors as a possible explanation for observed asset market
behavior. This paper fits squarely into the latter category. Fundamental risks in the economy
follow a standard structure, the focus is on how heterogeneity in the wealth distribution can ex-
plain empirical findings. Our model combines a relatively standard notion of model uncertainty
with heterogeneous CARA investors, who differ in the level of uncertainty they face regarding
the distribution of asset payoffs.
Several studies have documented that expenditures on information about the stock market
increase with a person’s income, as early as Lewellen, Lease, and Schlarbaum (1977) and more
4

recently Donkers and Van Soest (1999). To reflect this relation in our model, we assume
that wealthier households have less uncertainty about the risky assets. As a result of higher
expenditures on information, investors become more familiar with financial markets, leaving
less uncertainty. We impose this exogenously and do not formulate the underlying decision
process about optimal information acquisition itself. While a tractable analysis of information
acquisition is possible in models with Bayesian investors who learn within a single-prior setting
– as in Verrecchia (1982) – a rigorous analysis of this issue in multi-prior settings is much more
challenging and would impede any tractability. Investors are assumed to have constant absolute
risk aversion, but we allow the parameter to be investor-specific. An investor’s absolute risk
tolerance increases proportionally with his wealth. This assumption, as already suggested in
Merton (1987), addresses the common common criticism of CARA-normal settings, namely
that CARA investors choose to invest a fixed amount into risky assets, irrespective of their level
of wealth. Our assumption retains tractability while taking into consideration the empirical
evidence that individuals’ absolute risk aversion decreases with wealth.1
These two deviations from standard models—linking risk aversion as well as uncertainty to
wealth—endogenously generate limited participation as well as rising fractions of wealth being
invested as investors of the participating group become wealthier. The equilibrium returns
resulting from matching these observed patterns of household stock holding, are able to reconcile
previous conflicting conclusions.
Investors averse to uncertainty in the sense formalized by Gilboa and Schmeidler (1998)
display a kink in their indifference curves—among the distributions they consider as possible
to be driving fundamental payoffs, uncertainty averse investors will base their decisions on
the ’worst-case’ distribution: the one that would be the least beneficial to them as investors.
Accordingly, investors who face a higher degree of uncertainty may choose not to participate at
all, if equilibrium returns are not high enough to compensate them for the additional perceived
uncertainty. Earlier papers like Verrecchia (1982) have shown that when information about
asset payoffs is costly, less wealthy individuals will purchase less information, a link that we
take as given in this paper. In a related paper, Makarov and Schornick (2010), we show that
the positive relationship between wealth and amount of information acquired follows through in1See e.g. Wolf and Pohlman (1983), Saha, Shumway, and Talpaz (1994), and Guiso and Paiella (2001).
5

equilibrium for the setup used here, with the adjustment made to CARA utility. In our setting,
poorer households have higher levels of uncertainty, creating the link between wealth an non-
participation. At the same time, among the group of households who do choose to participate,
households with higher wealth optimally choose to invest a higher share of wealth into risky
assets. This feature is the joint implication of the wealth-adjustment to CARA utility and
uncertainty aversion. Simply setting an investor’s absolute risk-tolerance parameter linear to
his wealth would, by itself, result in decisions akin to CRRA utility: risky investment making
up a constant fraction of an investor’s wealth. Also taking uncertainty about the possible
distribution of payoffs into consideration delivers the result that matches observed investment
behavior: wealthier households tend to invest a larger share of their wealth into assets with
risky payoffs.
While this does suggest that uncertainty aversion may be an explanation for the observed
features of individual portfolio choice, we do not claim that this is the only plausible source
of the findings. Other papers, for example At-Sahalia, Parker and Yogo (2004) link the equity
premium to the consumption of luxury goods—in contrast to basic goods. Rather, we want to
show that utility functions that capture multiple empirical regularities about investor behavior
are better able to explain features of the stock market, in particular the equilibrium implica-
tions of limited participation for asset prices and returns. Cao et al. (2005) likewise obtain
limited stock-market participation in their setting with uncertainty aversion. However, in their
model, the market risk premium decreases when market participation declines: endogenizing
the decision of investors to participate in the market makes the equity premium puzzle even
worse compared to the full-participation case. This is a surprising result as it stands in con-
trast to the conclusion of models with exogenous limited participation, e.g. Basak and Cuoco
(1998). They who argue that limited participation in the stock market can help resolve the
puzzle. The intuition behind their result is that as aggregate risk is shared among a smaller
group when a subset of the population is restricted from investing in the risky asset market, the
active investors demand a higher return for carrying this risk. In our analysis we generate an
endogenous level of participation from investors’ optimal decisions and find support for Basak
and Cuoco’s result. The underlying reason for the inverse result of Cao et al. (2005) is the lack
of wealth effect in investors’ risk aversion, not the presence of uncertainty aversion—the source
6

of endogenous limited participation. Considering a utility function that better matches other
features of households’ investment decisions, lower market participation leads to an increase in
the equity premium.
These results raise the question of which types of questions about investment can be reliably
answered in a setting based on CARA utility investors. The undeniable benefit of tractability
in CARA-normal settings unfortunately generates some counterintuitive results, due to the
very particular ways in which CARA investors share risk across the population. Many other
common utility specifications are also unable to precisely capture observed investment decisions
of individuals or households. But absolute risk aversion has a significant qualitative impact on
other pertinent economic quantities like asset prices. For example, Bernardo and Judd (2000)
solve numerically a variation of the Grossman and Stiglitz (1980) model in which investors have
CRRA preferences, and find that the original model’ predictions about the general equilibrium
effects, e.g. regarding price informativeness, are not robust once CARA is changed by CRRA.
The authors go as far as claiming that “exponential utility ... is an unreasonable assumption
making dynamic, general equilibrium extensions of this model unrealistic.” Our results seem to
support the argument that general-equilibrium conclusions of CARA-models need to be carefully
examined for robustness, especially when being considered in conjunction with other features
that capture heterogeneity across the population of (potential) investors.
The remainder of the paper is organized as follows. Section 2 described the economic setting.
Section 3 solves for an equilibrium. Section 4 demonstrates how the model’s predictions can
be used to explain several empirical regularities concerning stockholdings and equity premium.
Section 5 concludes. The Appendix contains all proofs.
2 Economic Setting
We consider a one-period economy populated by a continuum of investors indexed by i. There
are two traded assets—a risk-free bond whose rate is normalized to zero, and a risky stock. The
stock’s payoff at the terminal date, u, is normally distributed with mean µ and variance σ2. At
the initial date, each investor chooses their investment portfolio by maximizing expected utility
over terminal wealth, subject to the budget constraint set by their personal endowment as well
7

as their individual access to information. While investors know the exact value of σ, they are
uncertain about the true value of expected payoff µ. Averse to this uncertainty—in addition to
the fundamental risk posed by σ, investors form their investment decisions by considering the
distributions of u they deem possible, and basing their decision on their perceived ‘worst-case
scenario’. This approach to modeling uncertainty aversion, as distinct from risk aversion, was
formalized by Gilboa and Schmeidler (1989) and has subsequently been used by various other
papers.2 Investor i believes that true mean is contained in the set [µ − φi, µ + φi], where φi
defines investor i’s level of uncertainty. Investors differ in the degree of uncertainty they face,
and across the population, φi is uniformly distributed on the interval [φ− δ, φ+ δ], where δ is
a measure of uncertainty dispersion across investors.
There are a number of conceivable reasons that levels of uncertainty may vary across in-
vestors, most of which are based on a notion of (costly) access to and processing of information.3
Our interpretation relates the uncertainty dispersion to the incentives of information acquisi-
tion, various aspects of which have been studied in the literature. Very recently, Veldkamp
and Van Nieuwerburgh (2010) have linked costly information processing to optimal information
acquisition decisions and under-diversification in a setup with multiple assets. To keep the
model of investors’ portfolio choice tractable while capturing the cross-sectional characteristics
of the wealth distribution, we do not provide a formal analysis of the information acquisition
in this setting. We exogenously assume a positive relation between an investor’s wealth and
the optimal amount of information they acquire about the financial market, consistent with
the literature. Buying more information leads to a greater reduction in the level of uncertainty,
implying that wealthier investors have a narrower interval of uncertainty, [µ−φi, µ+φi], around
the true mean µ.
We assume the following relationship between the initial wealth and the level of uncertainty:
φi = 1/xi. (1)
where xi is investor i ∈ [0, 1]’s wealth—his endowment with units of risky stock.2For example Dow and Werlang (1992), Gilboa and Schmeidler (1993), Epstein and Wang (1994) as well as
Hansen and Sargent (2001), who link the formulation of Gilboa and Schmeidler (1998) to robust control theory.3Cao, Wang and Zhang (2005) also mention alternative explanations for the presence of limited participation,
e.g. transaction or liquidity costs, and other forms of market imperfections.
8

This relationship expresses the idea that if investor i has little wealth, they will spend less
on reducing uncertainty about the stock market, and the investor’s level of φi remains higher.
The particular functional form chosen is without much loss of generality, but aims to satisfy
two features consistent with the data.
First, the relationship in (1) reflects decreasing returns to information acquisition — even
very wealthy investors are not able to entirely eliminate uncertainty with respect to the financial
market and learn µ precisely: φi converges to zero slowly. Importantly, this relationship also
ensures that the level of uncertainty cannot be negative—one cannot be more than 100% about
the properties of an asset’s payoff distribution.Second, this relationship between uncertainty
and wealth ensures that imposing a realistic cross-sectional distribution of wealth can indeed
lead to φi being uniformly distributed. The functional form in (1) is consistent with wealth
having a power distribution ∝ w−1, which is broadly consistent with the empirical evidence.4
Characteristic for this distribution is that fewer people are associated to increasing levels of
wealth. This property is sometimes referred to as “80-20 rule”—meaning that 20% of the
population owns 80% of the wealth.
The average supply x of the risky stock in the population can be expressed in terms of the
distribution of investors’ uncertainty φi:
x =∫ φ+δ
φ−δ
1φi
12δdφi =
12δ
lnφ+ δ
φ− δ. (2)
The literature on the equilibrium effects of information acquisition have often relied on the
use of CARA utility to retain tractability. This, however, comes at the cost of lacking ’wealth
effects’, which empirically seem to be a stable feature of individuals’ portfolio choice: the extent
to which one invests in risky assets rises as one becomes wealthier. In this paper we try to
reconcile the two aspects by introducing the wealth effect directly in our CARA-normal setting.
We link an investor’s level of absolute risk tolerance ri to their initial endowment:5
ri = xi/a. (3)4This inversely proportional distribution is a special case of a more general Pareto distribution often used to
describe the distribution of wealth in various countries. See, e.g. Persky (1992).5This ad-hoc adjustment to the utility function was used early on by Merton (1987), and is also discussed
in more detail in the context of optimal information acquisition and investment in the authors’ related work
Makarov and Schornick (2010).
9
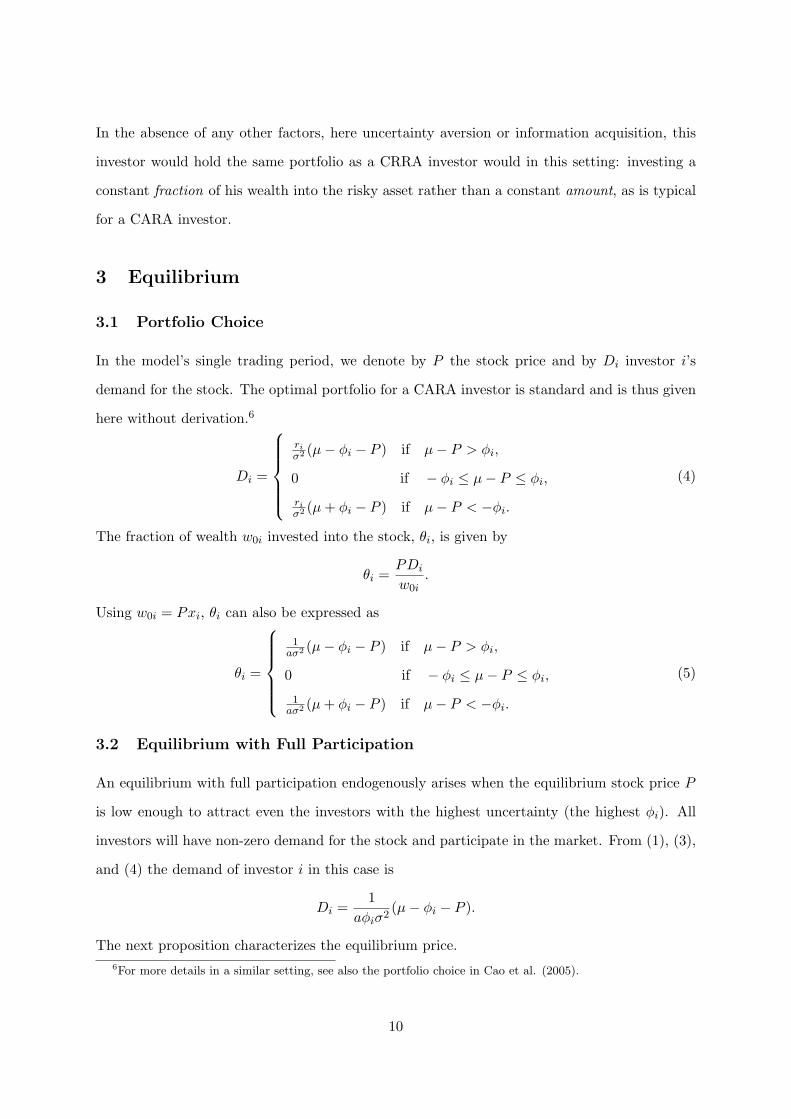
In the absence of any other factors, here uncertainty aversion or information acquisition, this
investor would hold the same portfolio as a CRRA investor would in this setting: investing a
constant fraction of his wealth into the risky asset rather than a constant amount, as is typical
for a CARA investor.
3 Equilibrium
3.1 Portfolio Choice
In the model’s single trading period, we denote by P the stock price and by Di investor i’s
demand for the stock. The optimal portfolio for a CARA investor is standard and is thus given
here without derivation.6
Di =
riσ2 (µ− φi − P ) if µ− P > φi,
0 if − φi ≤ µ− P ≤ φi,riσ2 (µ+ φi − P ) if µ− P < −φi.
(4)
The fraction of wealth w0i invested into the stock, θi, is given by
θi =PDi
w0i.
Using w0i = Pxi, θi can also be expressed as
θi =
1aσ2 (µ− φi − P ) if µ− P > φi,
0 if − φi ≤ µ− P ≤ φi,1aσ2 (µ+ φi − P ) if µ− P < −φi.
(5)
3.2 Equilibrium with Full Participation
An equilibrium with full participation endogenously arises when the equilibrium stock price P
is low enough to attract even the investors with the highest uncertainty (the highest φi). All
investors will have non-zero demand for the stock and participate in the market. From (1), (3),
and (4) the demand of investor i in this case is
Di =1
aφiσ2(µ− φi − P ).
The next proposition characterizes the equilibrium price.6For more details in a similar setting, see also the portfolio choice in Cao et al. (2005).
10
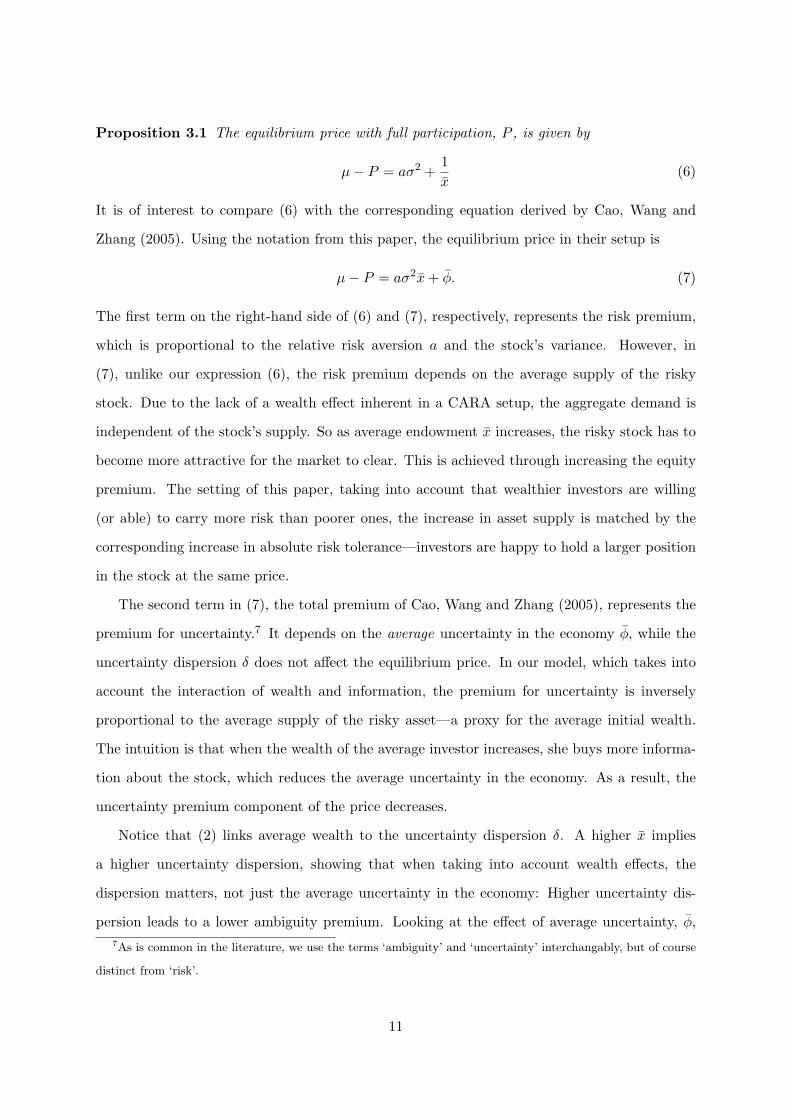
Proposition 3.1 The equilibrium price with full participation, P , is given by
µ− P = aσ2 +1x
(6)
It is of interest to compare (6) with the corresponding equation derived by Cao, Wang and
Zhang (2005). Using the notation from this paper, the equilibrium price in their setup is
µ− P = aσ2x+ φ. (7)
The first term on the right-hand side of (6) and (7), respectively, represents the risk premium,
which is proportional to the relative risk aversion a and the stock’s variance. However, in
(7), unlike our expression (6), the risk premium depends on the average supply of the risky
stock. Due to the lack of a wealth effect inherent in a CARA setup, the aggregate demand is
independent of the stock’s supply. So as average endowment x increases, the risky stock has to
become more attractive for the market to clear. This is achieved through increasing the equity
premium. The setting of this paper, taking into account that wealthier investors are willing
(or able) to carry more risk than poorer ones, the increase in asset supply is matched by the
corresponding increase in absolute risk tolerance—investors are happy to hold a larger position
in the stock at the same price.
The second term in (7), the total premium of Cao, Wang and Zhang (2005), represents the
premium for uncertainty.7 It depends on the average uncertainty in the economy φ, while the
uncertainty dispersion δ does not affect the equilibrium price. In our model, which takes into
account the interaction of wealth and information, the premium for uncertainty is inversely
proportional to the average supply of the risky asset—a proxy for the average initial wealth.
The intuition is that when the wealth of the average investor increases, she buys more informa-
tion about the stock, which reduces the average uncertainty in the economy. As a result, the
uncertainty premium component of the price decreases.
Notice that (2) links average wealth to the uncertainty dispersion δ. A higher x implies
a higher uncertainty dispersion, showing that when taking into account wealth effects, the
dispersion matters, not just the average uncertainty in the economy: Higher uncertainty dis-
persion leads to a lower ambiguity premium. Looking at the effect of average uncertainty, φ,7As is common in the literature, we use the terms ‘ambiguity’ and ‘uncertainty’ interchangably, but of course
distinct from ‘risk’.
11

on the ambiguity premium, the result is in line with what we expect from the previous insights
of the ambiguity aversion literature: the ambiguity premium increases as average uncertainty
increases.
In order for all potential investors to participate in the stock market, the model parameters
must satisfy certain conditions. If the investor with the highest level of uncertainty holds a long
position in stock, the other investors—facing less uncertainty—will also participate in the stock
market. Hence, full participation requires
µ− (φ+ δ)− P > 0. (8)
Denote the wealth of the poorest investor by xmin. From (1) it follows that xmin = 1/(φ+ δ).
Therefore full participation implies
1xmin
− 1x< aσ2, (9)
meaning that it is most likely to occur when the dispersion of the initial wealth is low, and
accordingly information will be relatively evenly distributed across the population of investors.
3.3 Equilibrium with Limited Participation
When wealth dispersion is high, some investors may choose not to hold the risky stock, as it
does not provide a sufficient premium for these investor to take on the risk it has for them.
This is a notable distinction from a classic Bayesian setting, where investors also have imperfect
knowledge of a parameter. In such a setting, investors with less information (a more diffuse
prior) will elect to invest less, but still participate: non-participation will occur only in cases
of measure zero. Because of the kink in the indifference curve that uncertainty aversion—
essentially first-order risk aversion—induces, this is not the case in the present setup, non-
participation can occur.
Denote by φ∗ the threshold level of uncertainty at which investors are at the margin between
participating and opting out of the market for risky assets. Investors with a higher level of
uncertainty, φi > φ∗, do not participate in the stock market, while the rest do. The threshold
level φ∗ can be determined by (4), looking at the marginal investor choosing to invest:
µ− φ∗ − P = 0. (10)
12

The next proposition characterizes the equilibrium P and φ∗ for the limited participation equi-
librium.
Proposition 3.2 In the equilibrium with limited market participation, the threshold value of
uncertainty φ∗ is implicitly given by
lnφ+ δ
φ− δ=
φ∗
aσ2ln
φ∗
φ− δ− 1aσ2
(φ∗ − φ+ δ). (11)
The equilibrium price is given by
P = µ− φ∗. (12)
We now turn to analyzing the model’s predictions and relating them to the empirical evi-
dence.
4 Wealth Share, Market Participation and Risk Premium
Given the fact that even in developed countries a large fraction of households do not participate
in the stock market, we focus mainly on which observed investment patterns can be explained
by this limited participation equilibrium. Below we look at three features: 1) stock market
participation and its relation to wealth, 2) wealth share invested into the risky asset, 3) equity
premium.
Stock Market Participation
Investors with high levels of uncertainty are more likely not to participate in the stock market.
Given the link between initial wealth and uncertainty, it is the poor households that stay away
from the stock market in our model, which is consistent with the empirical evidence .
It is not unusual to observe non-participation even among the households whose wealth
exceeds $100,000, as shown by Mankiw and Zeldes (1991). From our model it follows that if
an investor with some wealth A participates in the stock market, then an investor with wealth
B, such that B > A, will also participate. While this seems to be at odds with the findings of
Mankiw and Zeldes, this model could easily be extended to account for this fact. We assumed
that investors’ uncertainty intervals are symmetric around the true µ. This means that the
13

worst-case expected return of a rich investor, whose interval is narrow, is always higher than
the worst-case expected return of a poor investor, whose interval is wide. In this sense, a rich
investor in our model always seems more optimistic than a poor one.8 As a result, we cannot
have a situation with a poor investor investing and a rich investor not investing.
However, in the style of Bayesian updating, different investors may have different prior means
around which their ambiguity intervals are centered. Under this assumption it is possible to
have a situation of a wealthy investor, while having less ambiguity, being more pessimistic in the
“worst-case scenario” sense than a poor one. Given this, a wealthier household may optimally
have zero holdings in the stock market, while a poorer one participates in the stock market.
Such an extension would not change our main qualitative results. Indeed, we will still have that
the minimal value (left boundary) for a narrower interval is higher on average than that for a
wider interval.9 Wealthier households will still on average be more optimistic about the risky
stock’s payoff – consistent with our assumptions.
To investigate the predictions of our model regarding stock market participation, we look
at the proportion of participating investors among the whole population, denoted by π, where
π =φ∗ − (φ− δ)
2δ. (13)
Empirically, economic growth has led households’ wealth to increase over time. Looking at this
effect within an essentially static model makes use of the comparative static results, analyzing
the effect of higher initial endowments on the stock market participation. Suppose the initial
stock endowment of all investors increases by a factor of k, so that the new endowment of
investor i equals k ∗ xi. In terms of the ensuing uncertainty, this affects both the average level
of uncertainty, which becomes φ/k, and the uncertainty dispersion, which becomes δ/k.
Proposition 4.1 Equilibrium market participation π rises as aggregate wealth increases: have8This is the case for long positions being held in the market on average, i.e. with positive net supply assets.9To see the intuition behind this, consider the following simple example. Suppose that after purchasing the
information the resulting uncertainty interval has a width Y and is equally likely to have any position around
the true µ. As is easy to see, the left boundary of the interval is uniformly distributed between µ − Y and µ.
Hence, the average worst case scenario is given by µ− Y/2. The wider the interval, i.e. the higher Y , the lower
is the average worst-case value.
14

thatdπ
dk> 0.
Proposition 4.1 shows that the proportional increase of the investors’ initial endowments
leads to higher stock market participation. Indeed, from (9) it follows that a proportional
increase of both xmin and x decreases the left-hand side of this inequality, thus moving the
economy towards the full-participation scenario. A recent comprehensive study of the household
stockholding in Europe by Guiso, Haliassos and Japelli (2003) documents that stock market
participation has increased over time. This paper provides a model consistent with this finding
in Proposition 4.1.
An alternative but related explanation for limited participation, also described by Guiso,
Haliassos and Japellli, involves entry costs. The increase in participation is explained by the
fact that these costs have been decreasing over time as a result of the increasing competition
among financial institutions. Another cost-based explanation concerns transaction costs. For
example, it used to be expensive to have a well-diversified portfolio of stocks since transaction
costs were incurred on each individual stock. Today there are many mutual funds that allow
any investor to own a certain index at a small cost.
However, cost-based explanations cannot account for some features of the data. For example,
many households with high wealth, for whom entry costs are a very small fraction of the assets,
do not participate in the stock market. Models with uncertainty-averse investors, such as the
one analyzed in this paper, are able to explain such findings. However, for our explanation
to work it is essential that investors are “sufficiently” heterogeneous in terms of their level of
ambiguity. Otherwise, the full participation case is likely to occur.
Welch (2000) reviews several papers on the estimation of the equity premium and concludes:
“Unfortunately, there is neither a uniformly accepted precise definition nor agreement on how
the equity premium should be computed and applied.” Given that even academics and pro-
fessionals studying the stock market cannot agree on how to estimate the equity premium, it
is natural to expect a great deal of heterogeneity across households, including wealthy ones,
regarding the precision of their estimates of µ.
15

Wealth Share
Our model implies that wealthier investors will choose to invest a larger fraction of their wealth
into risky asset markets. As mentioned earlier, making the parameter of investors’ absolute
risk tolerance depend on wealth only goes part of the way here: this adjustment by itself would
imply investors devoting a constant fraction of their wealth to the risky asset. Only when also
considering uncertainty aversion, do investors’ portfolio shares in the risky asset increase in
wealth. As investors become wealthier, their level of uncertainty is reduced as they purchase
more information.
One of the findings of Guiso, Haliassos and Japelli (2003) is that initial wealth has a positive
but small effect on the asset share invested in the stock market – for those investors who do
participate. They interpret this evidence as supporting the relevance of participation costs.
The reasoning is that, while wealth is important for deciding whether to participate in the
stock market or not, once investors have incurred these costs there is not much difference in
their stockholdings.
Our model provides an alternative explanation for this finding. The relationship between
the initial wealth and the level of uncertainty is decreasing and convex. This essentially implies
that returns to scale in information acquisition are decreasing. So at very high levels of wealth,
a small increase in endowment has only a small effect on the level of uncertainty, and hence on
portfolio choice. Effects are larger for those with lower levels of wealth—among the group even
participating in the stock market, already the wealthier section of the population.
Equity Premium
Various studies investigate the relationship between limited participation and equity premium.
Some papers assume, without modelling the underlying mechanisms, that some investors do
not participate in the stock market, for example Basak and Cuoco (1998), Mankiw and Zeldes
(1991), and Brav, Constandinides and Geczy (2002). These studies suggest that limited partic-
ipation increases the equilibrium equity premium compared to the full-participation case and
hence can help resolve the equity premium puzzle as described by Mehra and Prescott (1985).
Surprisingly, when endogenizing the decision whether to participate or not, Cao, Wang and
16
Zhang (2005) show that the opposite is true. They find that increasing the uncertainty in the
economy decreases both the participation and the equity premium. This would imply that
limited participation in fact makes the equity premium puzzle even worse.
The insights from our model can reconcile these findings. Cao et al. primarily want to
look at the endogeneity of the participation decision, which they generate through ambiguity
aversion. But the underlying utility specifications they use also differ from the papers looking
at exogenous participation restriction: Basak and Cuoco use CRRA, whereas Cao et al. use
CARA. Our model allows us to combine the nice features of the two settings: we have both
endogenous participation and the more desirable wealth effect as present in CRRA settings.
The equilibrium in our model depends on several parameters, and changing each parameter
is likely to affect both the participation rate and the risk premium. Cao et al. choose to vary
the uncertainty dispersion δ. However, in our model δ is not an exogenous parameter but rather
is determined by the value of the initial endowment, via the information acquisition. For this
reason, when looking at comparative statics, we alter the investors’ endowments.
As before, we consider a proportional increase k > 1 of the investors’ endowments. As
we have already shown, this leads to an increase in stock market participation due to more
information being purchased. In the next proposition we look at the effect on the equity
premium.
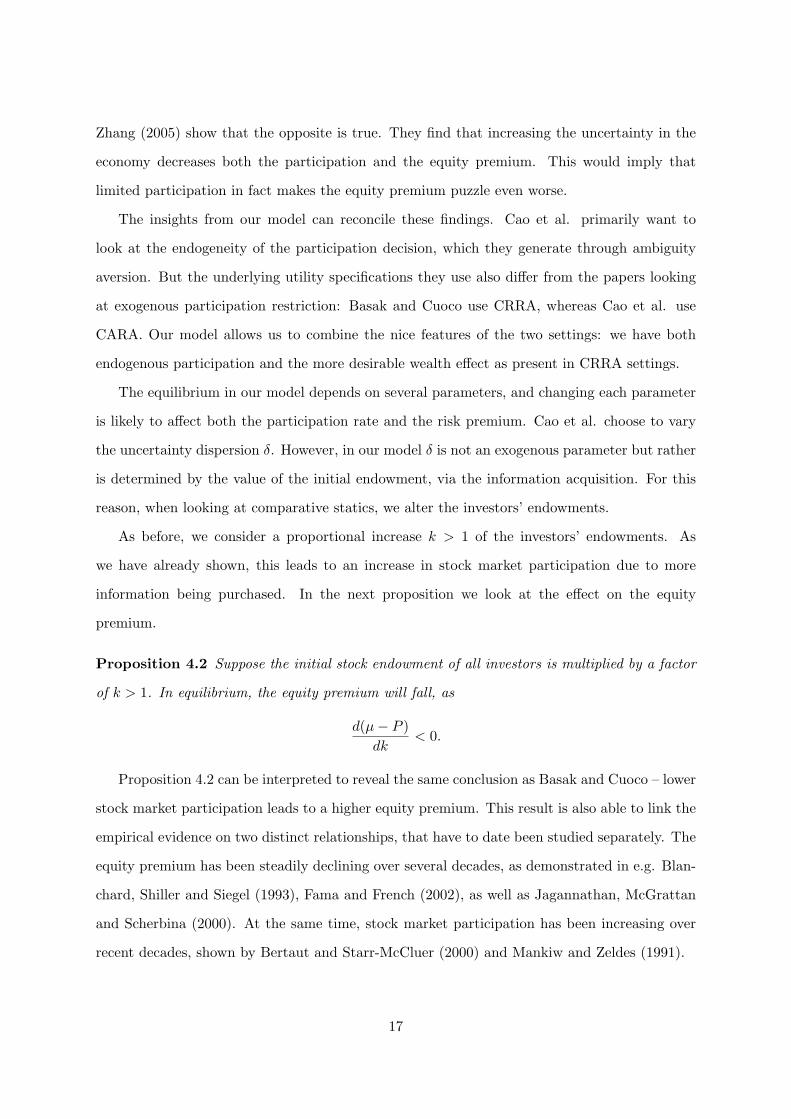
Proposition 4.2 Suppose the initial stock endowment of all investors is multiplied by a factor
of k > 1. In equilibrium, the equity premium will fall, as
d(µ− P )dk
< 0.
Proposition 4.2 can be interpreted to reveal the same conclusion as Basak and Cuoco – lower
stock market participation leads to a higher equity premium. This result is also able to link the
empirical evidence on two distinct relationships, that have to date been studied separately. The
equity premium has been steadily declining over several decades, as demonstrated in e.g. Blan-
chard, Shiller and Siegel (1993), Fama and French (2002), as well as Jagannathan, McGrattan
and Scherbina (2000). At the same time, stock market participation has been increasing over
recent decades, shown by Bertaut and Starr-McCluer (2000) and Mankiw and Zeldes (1991).
17

5 Conclusion
We incorporate the so-called wealth effect into the CARA portfolio choice of ambiguity averse
investors by linking an investor’s absolute risk aversion to her wealth. The resulting model
explains several salient features of households’ stockholding. Namely, we show that the wealth
share invested into risky assets increases with wealth. In addition, the model predicts that
wealthier households are more likely to participate in the stock market than poorer ones. Finally,
the model provides an explanation for the fact that market participation increases over time,
while the equity premium decreases. Combining the features of wealth-dependent absolute risk
aversion and uncertainty aversion, we can reconcile the conflicting conclusions regarding the
equity premium when limited market participation is endogenous vs. exogenous. By adjusting
the portfolio choice properties of CARA utility to reflect the impact of wealth on portfolio
choice, the intuition that limited stock market participation leads to a higher risk premium
can indeed also be generated in a setting of endogenous market participation and ambiguity
aversion.
18
A Appendix
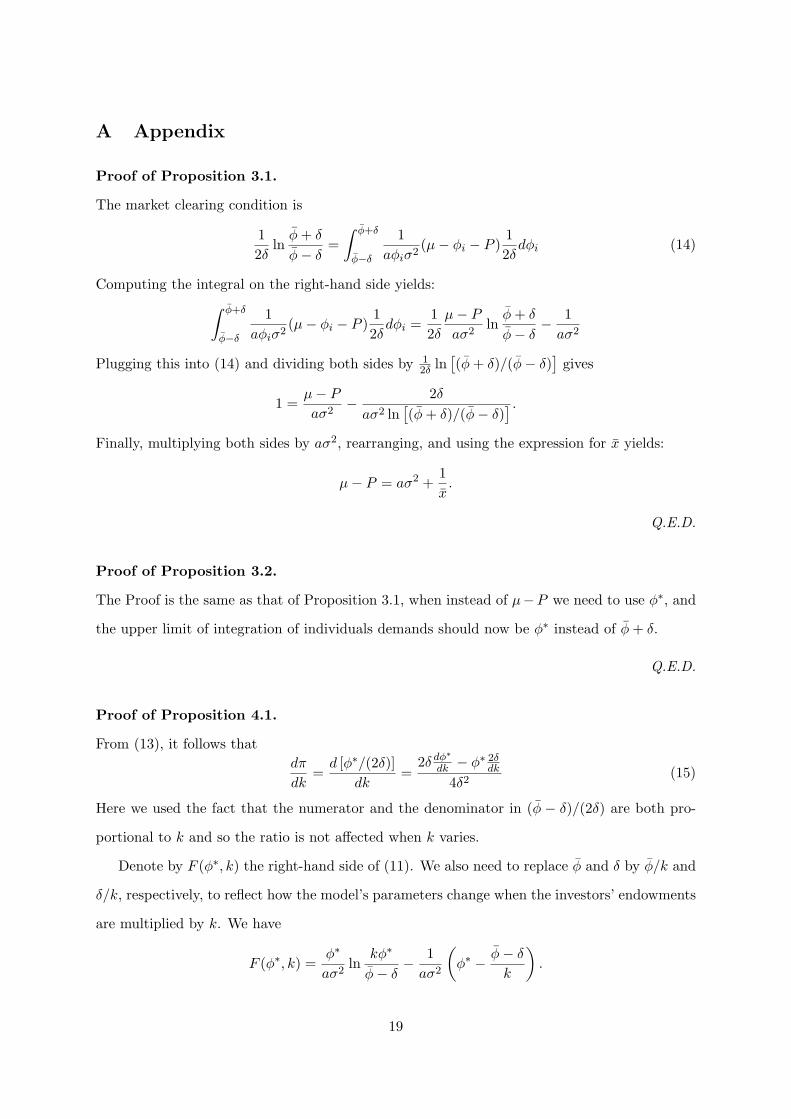
Proof of Proposition 3.1.
The market clearing condition is
12δ
lnφ+ δ
φ− δ=∫ φ+δ
φ−δ
1aφiσ2
(µ− φi − P )12δdφi (14)
Computing the integral on the right-hand side yields:∫ φ+δ
φ−δ
1aφiσ2
(µ− φi − P )12δdφi =
12δµ− Paσ2
lnφ+ δ
φ− δ− 1aσ2
Plugging this into (14) and dividing both sides by 12δ ln
[(φ+ δ)/(φ− δ)
]gives
1 =µ− Paσ2
− 2δaσ2 ln
[(φ+ δ)/(φ− δ)
] .Finally, multiplying both sides by aσ2, rearranging, and using the expression for x yields:
µ− P = aσ2 +1x.
Q.E.D.
Proof of Proposition 3.2.
The Proof is the same as that of Proposition 3.1, when instead of µ−P we need to use φ∗, and
the upper limit of integration of individuals demands should now be φ∗ instead of φ+ δ.
Q.E.D.
Proof of Proposition 4.1.
From (13), it follows thatdπ
dk=d [φ∗/(2δ)]
dk=
2δ dφ∗
dk − φ∗ 2δdk
4δ2(15)
Here we used the fact that the numerator and the denominator in (φ − δ)/(2δ) are both pro-
portional to k and so the ratio is not affected when k varies.
Denote by F (φ∗, k) the right-hand side of (11). We also need to replace φ and δ by φ/k and
δ/k, respectively, to reflect how the model’s parameters change when the investors’ endowments
are multiplied by k. We have
F (φ∗, k) =φ∗
aσ2ln
kφ∗
φ− δ− 1aσ2
(φ∗ − φ− δ
k
).
19

To differentiate the implicit function φ∗(k), we need to compute Fφ∗ and Fk. We have
dF
dφ∗=
1aσ2
lnkφ∗
φ− δ+
φ∗
aσ2
1φ∗− 1aσ2
=1aσ2
lnkφ∗
φ− δ,
anddF
dk=
φ∗
aσ2
1k− 1aσ2
φ− δk2
.
We now have thatdφ∗
dk= − dF/dK
dF/dφ∗=
φ−δk2 − φ∗
k
ln kφ∗
φ−δ
(16)
Plugging this into (15) and ignoring the denominator as we are only interested in the sign of
dπ/dk, we get
2δφ−δk2 − φ∗
k
ln kφ∗
φ−δ
+ φ∗2δk2
We now multiply the RHS byk2
2δaσ2ln
kφ∗
φ− δ
which, being positive, does not change the sign of dπ/dk. This yields
φ∗
aσ2ln
kφ∗
φ− δ− k
aσ2
(φ∗ − φ− δ
k
).
Evaluating the last expression at k = 1, we see that it equals the right-hand side in (11) and
so is positive since the left-hand side is positive. Hence, an infinitesimal increase (decrease) in
endowments increases (decreases) the market participation. But since this is true for any φ∗ it
means that φ∗(k) increases for all k-s until the full participation is achieved.
Q.E.D.
Proof of Proposition 4.2.
The result immediately follows from (16) because φ∗ > φ− δ.
Q.E.D.
20

References
At-Sahalia, Y., J. A. Parker and M. Yogo, 2004, “Luxury Goods and the Equity Premium,”
Journal of Finance, 59(6), 2959–3004.
Basak, S., and D. Cuoco, 1998, “An Equilibrium Model with Restricted Stock Market Partic-
ipation,” Review of Financial Studies, 11, 309–341.
Bernardo, A.E., and K.L. Judd, 2000, “Asset market equilibrium with general tastes, returns,
and informational asymmetries,” Journal of Financial Markets, 3, 17–43.
Bertaut, C.C., and M. Starr-McCluer, 2000, “Household Portfolios in the United States,”
FEDS Working Paper No. 2000-26.
Blanchard, O.J., R. Shiller, and J.J. Siegel, 1993, “Movements in the equity premium,” Brook-
ings Papers on Economic Activity, Macroeconomics, 2, 75–118.
Brav, A., G. Constandinides, and C. Geczy, 2002, “Asset Pricing with Heterogenuous Con-
sumers and Limited Participation: Empirical Evidence,” Journal of Political Economy,
110, 793–824.
Cao H.H., T. Wang, and H.H. Zhang, 2005, “Model Uncertainty, Limited Market Participation,
and Asset Prices,” Review of Financial Studies, 18, 1219–1251.
Dow, J., and S. Ribeiro da Costa Werlang, 1992, “Uncertainty Aversion, Risk Aversion, and
the Optimal Choice of Portfolio,” Econometrica, 60(1), 197–204.
Donkers, B., and A. van Soest, 1999, “Subjective Measures of Household Preferences and
Financial Decisions,” Journal of Economic Psychology, 20(6), 613–642.
Dow, J., and S. Werlang, 1992, “Uncertainty aversion, risk aversion and the optimal choice of
portfolio,” Econometrica, 60, 197–204.
Epstein, L.G., and T. Wang, 1994, “Intertemporal Asset Pricing under Knightian Uncertainty,”
Econometrica, 62(2), 283–322.
Fama, E.F., and K.R. French, 2002, “The equity premium,” Journal of Finance, 57(2), 637–
659.
Gilboa, I., and D. Schmeidler, 1989, “Maxmin Expected Utility Theory with Non-Unique
Prior,” Journal of Mathematical Economics, 18, 141–153.
21

Gilboa, I., and D. Schmeidler, 1993, “Updating Ambiguous Beliefs,”Journal of Economic The-
ory, 59(1), 33–49.
Gomes, F., and A. Michaelides, 2006, “Asset Pricing with Limited Risk Sharing and Hetero-
geneous Agents,” Working Paper.
Grossman, S.J., and J.E. Stiglitz, 1980, “On the Impossibility of Informationally Efficient
Markets,” American Economic Review, 70, 393–408.
Guiso, L., M. Haliassos, and T. Japelli (2003), 2003, “Household Stockholding in Europe:
Where Do We Stand and Where Do We Go?” Economic Policy, April, 117–164.
Guiso, L., and M. Paiella, 2005, “The Role of Risk Aversion in Predicting Individual Behavior,”
Working Paper.
Jagannathan, R., E.R. McGrattan, and A. Scherbina, 2000, “The declining U.S. equity pre-
mium,” Quarterly Review, Federal Reserve Bank of Minneapolis, 24, 3–19.
Haliassos, M., and C.C. Bertaut, 1995, “Why Do So Few Hold Stocks?,” The Economic Jour-
nal, 105, 1110–1129.
Hansen and Sargent (2001) ” Robust Control and Model Uncertainty ” Author(s): Lars
Peter Hansen and Thomas J. Sargent ” Source: The American Economic Review, Vol.
91, No. 2, Papers and Proceedings of the Hundred Thirteenth Annual Meeting of the
American Economic Association (May, 2001), pp. 60-66
Hansen, L.P., and T. J. Sargent, 2001, “Robust Control and Model Uncertainty,” American
Economic Review, Papers and Proceedings of the Hundred Thirteenth Annual Meeting of
the American Economic Association, 91(2), 60–66.
Hellwig, M.F., 1980, “On the Aggregation of Information in Competitive Markets,” Journal
of Economic Theory, 22, 477–498.
Lewellen, W.G., R.C. Lease, and G.G. Schlarbaum, 1977, “Patterns of Investment Strategy
and Behavior Among Individual Investors,” Journal of Business, 50(3), 296–333.
Makarov, D., and A. Schornick, 2010, “A Note on Wealth Effects Under CARA Utility,”
working paper.
Merton, R.C., 1987, “A Simple Model of Capital Market Equilibrium with Incomplete Infor-
mation,” Journal of Finance, 42(3), 483–510.
22
Mankiw, N. G., and S. P. Zeldes, 1991, The Consumption of Stockholders and Non-Stockholders,
Journal of Financial Economics, 29, 97–112.
Mehra, R., and Prescott, E. C., 1985, “The equity premium: A puzzle,” Journal of Monetary
Economics, 15, 145–61.
Peress, J., 2004, “Wealth, Information Acquisition and Portfolio Choice,” Review of Financial
Studies, 17(3), 879–914.
Perraudin, W.R.M., and B.E. Sorensen, 2000, “The demand for risky assets: Sample selection
and household portfolios,” Journal of Econometrics, 97(1), 117–144.
Persky, J., 1992, “Retrospectives: Pareto’s Law,” Journal of Economic Perspectives, 6(2),
181–192.
Saha, A., C.R. Shumway, and H. Talpaz, 1994, “Joint Estimation of Risk Preference Structure
and Technology Using Expo-Power Utility ,” American Journal of Agricultural Economics,
76(2), 173–184.
Van Nieuwerbergh, S., and L. Veldkamp, 2010, “Information Acquisition and Under-Diversification”,
Review of Economic Studies, forthcoming.
Verrecchia, R., 1982, “Information Acquisition in a Noisy Rational Expectations Economy,”
Econometrica, 50(6), 1415–1430.
Vissing-Jorgensen, A., 2002, “Limited Asset Market Participation and the Elasticity of In-
tertemporal Substitution,” Journal of Political Economics, 110, 825–853.
Vissing-Jorgensen, A., 2003, “Perspectives on Behavioral Finance: Does ”Irrationality” Dis-
appear with Wealth? Evidence from Expectations and Actions,” NBER Macroeconomics
Annual.
Wachter, J., and M. Yogo, 2007, “Why Do Household Portfolio Shares Rise in Wealth?,”
Working Paper.
Welch, I., 2000, “Views of Financial Economists on the Equity Premium and on Professional
Controversies,” Journal of Business, 73(4), 501–537.
Wolf, C., and L. Pohlman, 1983, “The Recovery of Risk Preferences From Actual Choices,”
Econometrica, 51(3), 843–850.
23