Embed Size (px)
Citation preview

Explainers: Expert Explorations with Crafted ProjectionsMichael GleicherUniversity of Wisconsin – Madison(on sabbatical at INRIA, Rhone-Alpes)Warning: this presentation uses the Bariol font family that you have to pay for. I recommend it – it’s cheap and beautiful

Explainers
An approach to explore high dimensional data:
Organize data according to user-defined concepts
Explain user-defined concepts according to the data
Give the user control over tradeoffs

Paris
4,8,1,3,… Atlanta
5,2,1,7,…New York
4,8,1,3,…
London
5,2,1,7,…
Boston
3,2,5,1,…
Tokyo
9,2,6,4,…Beijing
7,3,2,7,…San Jose
5,2,1,7,…
Jakarta
3,2,5,1,…
Sydney
9,2,6,4,…
Munich
7,3,2,7,… High Dimensional Data
Objects have associated Vectors

Paris
4,8,1,3,… Atlanta
5,2,1,7,…New York
4,8,1,3,…
London
5,2,1,7,…
Boston
3,2,5,1,…
Tokyo
9,2,6,4,…Beijing
7,3,2,7,…San Jose
5,2,1,7,…
Jakarta
3,2,5,1,…
Sydney
9,2,6,4,…
Munich
7,3,2,7,…
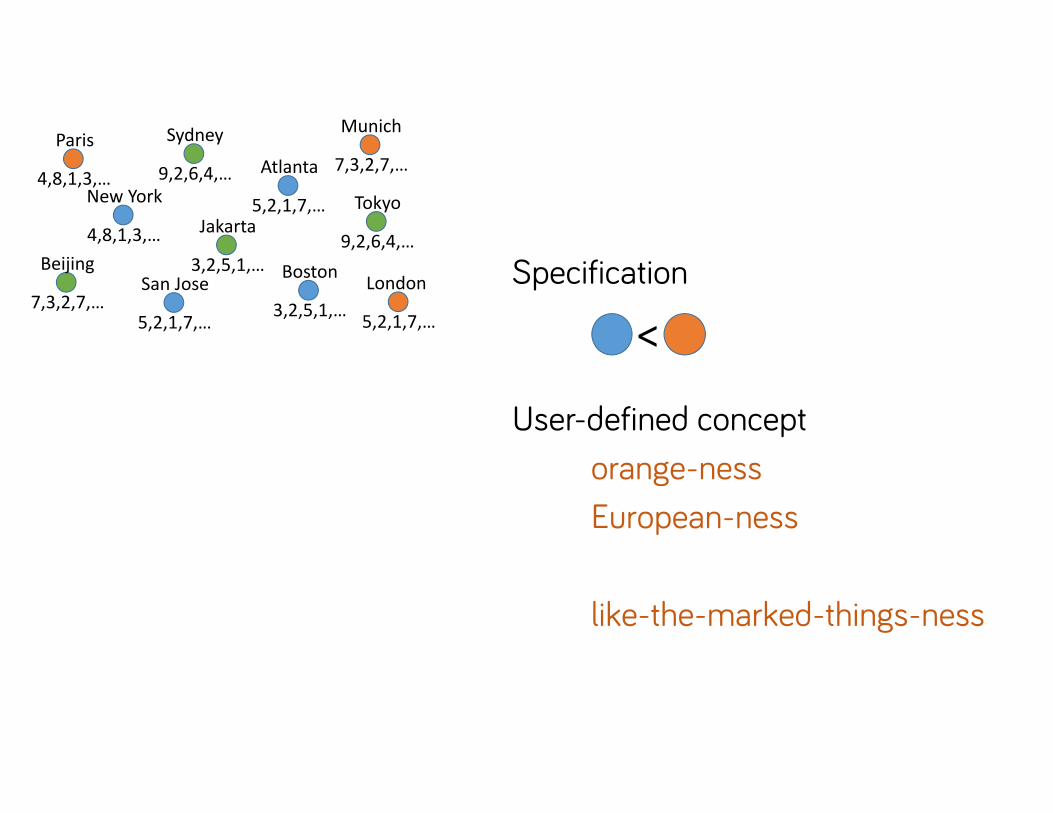
Projections
Functions map Vectors to Numbers
Produce a new axis or dimension(or view)
Paris
4,8,1,3,… Atlanta
5,2,1,7,…New York
4,8,1,3,…
London
5,2,1,7,…
Boston
3,2,5,1,…
Tokyo
9,2,6,4,…Beijing
7,3,2,7,…San Jose
5,2,1,7,…
Jakarta
3,2,5,1,…
Sydney
9,2,6,4,…
Munich
7,3,2,7,…
Specification
User-defined conceptorange-nessEuropean-ness
like-the-marked-things-ness
<

Paris
4,8,1,3,… Atlanta
5,2,1,7,…New York
4,8,1,3,…
London
5,2,1,7,…
Boston
3,2,5,1,…
Tokyo
9,2,6,4,…Beijing
7,3,2,7,…San Jose
5,2,1,7,…
Jakarta
3,2,5,1,…
Sydney
9,2,6,4,…
Munich
7,3,2,7,…
Explainer
With user control of tradeoffs between:
Correctness:does it align with the user specification?
Understandability:can the user interpret the mapping?
Diversity:can we generate alternate mappings?
Explainers:Projections crafted to meetuser specifications <
<

American
‐ness
Paris-ness vs. New York-ness 5 views of American-ness
-8 -6 -4 -2 0
-8
-6
-4
-2
New York London
BerlinBostonChicago
AucklandMelbourne
MinneapolisTel Aviv
Paris
Mumbai
Suzhou
Cairo OsloShanghaiWarsaw
Doula Qingdao
Paris-ness
New
York-ness

OrganizeRelationships between points
based on data and concepts
Rankings
Outliers
Extrema
Exemplars
Similarities
ExplainRelationships with the data
connect concepts and variables
Where do the orderings come from?
Are variables correlated with concepts?

An Example: Shakespeare’s PlaysTo make things concrete
More Examples online!http://graphics.cs.wisc.edu/Vis/Explainers

Texts Vectors
4, 0, 3.6, 4.7, 0, 3.4, …3, 2.4, 0, 4.2, 4.7, 5, …1.5, 2.3, 0, 1.2, 6.2, ……
36 Plays = 36 Vectors
115 “Measurements” of each text = 115 dimensions

What measurements?
Count words of each type
Words (phrases) have a type (tag)
Docuscope (from CMU)Simple matchingHand-built dictionaries
115 Categories

genre
Comedy Tragedy History
Late Plays
Categorization given by Shakespeare’s contemporaries
Category for plays written after that
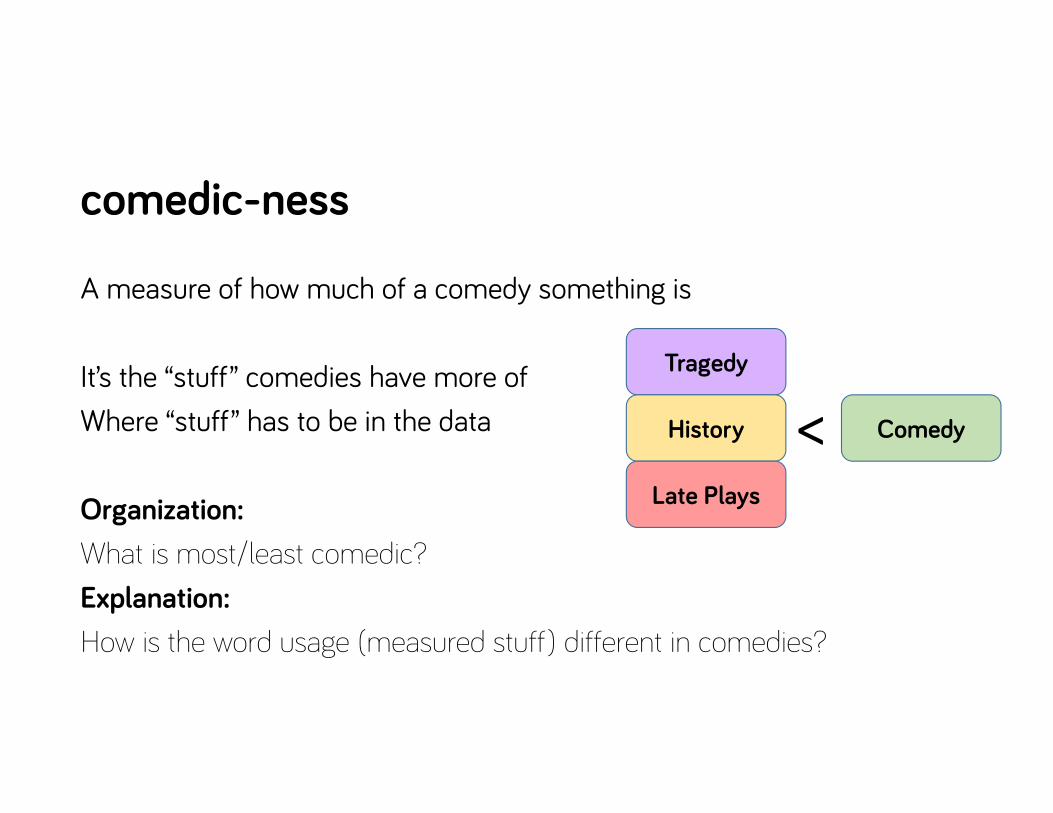
comedic-ness
A measure of how much of a comedy something is
It’s the “stuff” comedies have more ofWhere “stuff” has to be in the data
Organization:What is most/least comedic? Explanation:How is the word usage (measured stuff) different in comedies?
Comedy
Tragedy
History
Late Plays
<


A comedicness explainer
c = f (V)c = comedicnessf = a function (Explainer) that maps from V to cV = vector from a text (length 115)
Choose f such that:1. It is correct (meets specification)2. It is understandable (simple)3. We can have alternatives (other functions that meet 1 and 2) as well

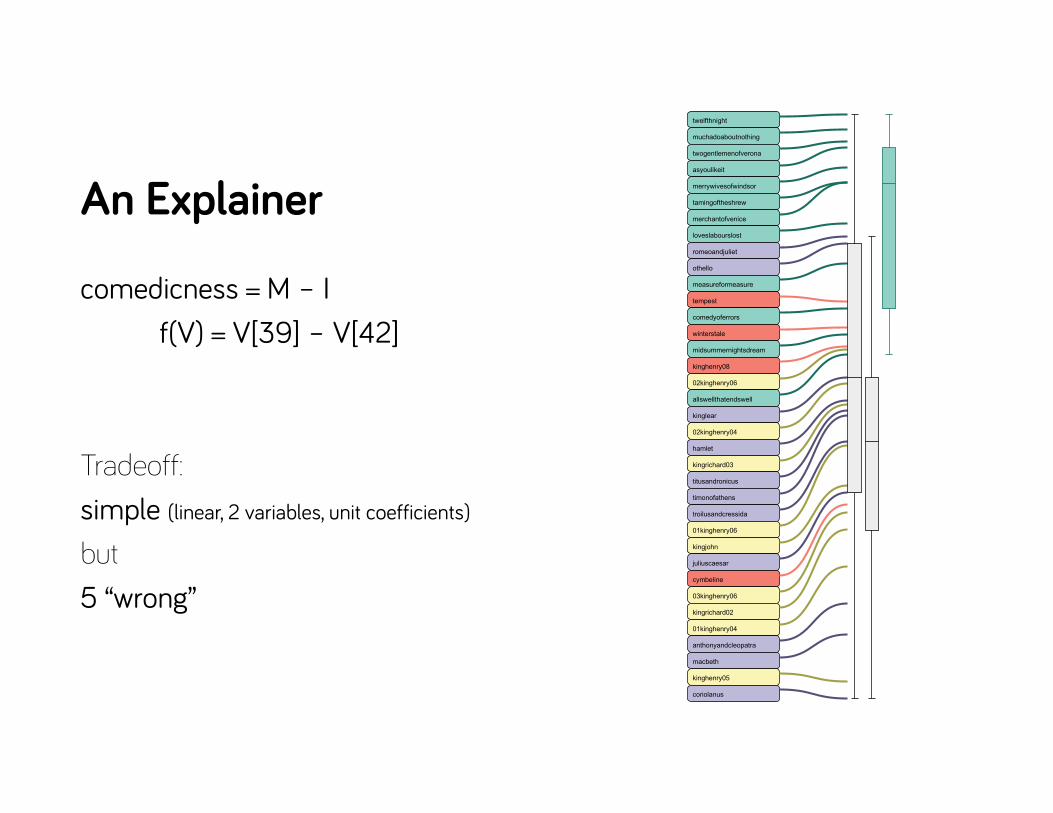
An Explainer
twelfthnight
muchadoaboutnothing
twogentlemenofverona
asyoulikeit
merrywivesofwindsor
tamingoftheshrew
merchantofvenice
loveslabourslost
romeoandjuliet
othello
measureformeasure
tempest
comedyoferrors
winterstale
midsummernightsdream
kinghenry08
02kinghenry06
allswellthatendswell
kinglear
02kinghenry04
hamlet
kingrichard03
titusandronicus
timonofathens
troilusandcressida
01kinghenry06
kingjohn
juliuscaesar
cymbeline
03kinghenry06
kingrichard02
01kinghenry04
anthonyandcleopatra
macbeth
kinghenry05
coriolanus
comedicness = M – If(V) = V[39] – V[42]
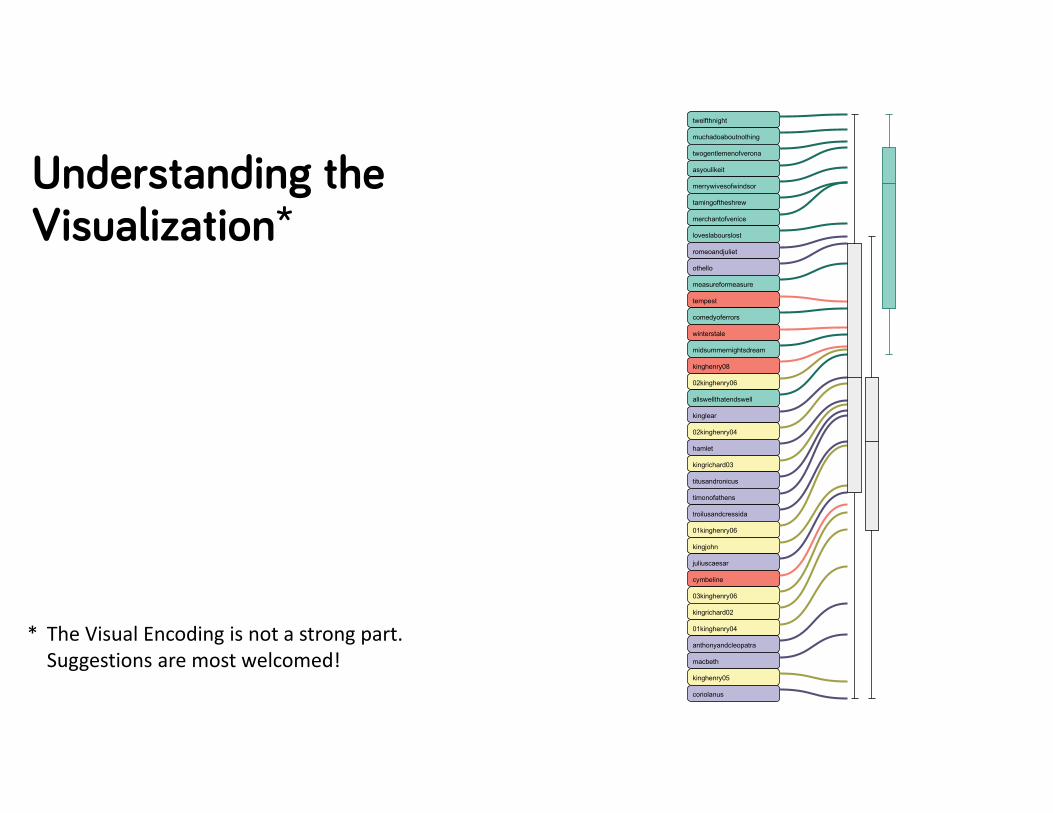
Understanding the Visualization*
* The Visual Encoding is not a strong part.Suggestions are most welcomed!
twelfthnight
muchadoaboutnothing
twogentlemenofverona
asyoulikeit
merrywivesofwindsor
tamingoftheshrew
merchantofvenice
loveslabourslost
romeoandjuliet
othello
measureformeasure
tempest
comedyoferrors
winterstale
midsummernightsdream
kinghenry08
02kinghenry06
allswellthatendswell
kinglear
02kinghenry04
hamlet
kingrichard03
titusandronicus
timonofathens
troilusandcressida
01kinghenry06
kingjohn
juliuscaesar
cymbeline
03kinghenry06
kingrichard02
01kinghenry04
anthonyandcleopatra
macbeth
kinghenry05
coriolanus

Understanding the Visualization*
* The Visual Encoding is not a strong part.Suggestions are most welcomed!
Objects in rank order
Color by specified class
twelfthnight
muchadoaboutnothing
twogentlemenofverona
asyoulikeit
merrywivesofwindsor
tamingoftheshrew
merchantofvenice
loveslabourslost
romeoandjuliet
othello
measureformeasure
tempest
comedyoferrors
winterstale
midsummernightsdream
kinghenry08
02kinghenry06
allswellthatendswell
kinglear
02kinghenry04
hamlet
kingrichard03
titusandronicus
timonofathens
troilusandcressida
01kinghenry06
kingjohn
juliuscaesar
cymbeline
03kinghenry06
kingrichard02
01kinghenry04
anthonyandcleopatra
macbeth
kinghenry05
coriolanus
Understanding the Visualization*
* The Visual Encoding is not a strong part.Suggestions are most welcomed!
Lines connect rank (left) to value (position on number line)

Understanding the Visualization*
* The Visual Encoding is not a strong part.Suggestions are most welcomed!
Box Plots show class separation
Left: all dataRight: each class of interest
twelfthnight
muchadoaboutnothing
twogentlemenofverona
asyoulikeit
merrywivesofwindsor
tamingoftheshrew
merchantofvenice
loveslabourslost
romeoandjuliet
othello
measureformeasure
tempest
comedyoferrors
winterstale
midsummernightsdream
kinghenry08
02kinghenry06
allswellthatendswell
kinglear
02kinghenry04
hamlet
kingrichard03
titusandronicus
timonofathens
troilusandcressida
01kinghenry06
kingjohn
juliuscaesar
cymbeline
03kinghenry06
kingrichard02
01kinghenry04
anthonyandcleopatra
macbeth
kinghenry05
coriolanus
An Explainer
twelfthnight
muchadoaboutnothing
twogentlemenofverona
asyoulikeit
merrywivesofwindsor
tamingoftheshrew
merchantofvenice
loveslabourslost
romeoandjuliet
othello
measureformeasure
tempest
comedyoferrors
winterstale
midsummernightsdream
kinghenry08
02kinghenry06
allswellthatendswell
kinglear
02kinghenry04
hamlet
kingrichard03
titusandronicus
timonofathens
troilusandcressida
01kinghenry06
kingjohn
juliuscaesar
cymbeline
03kinghenry06
kingrichard02
01kinghenry04
anthonyandcleopatra
macbeth
kinghenry05
coriolanus
comedicness = M – If(V) = V[39] – V[42]
Tradeoff:simple (linear, 2 variables, unit coefficients)
but5 “wrong”
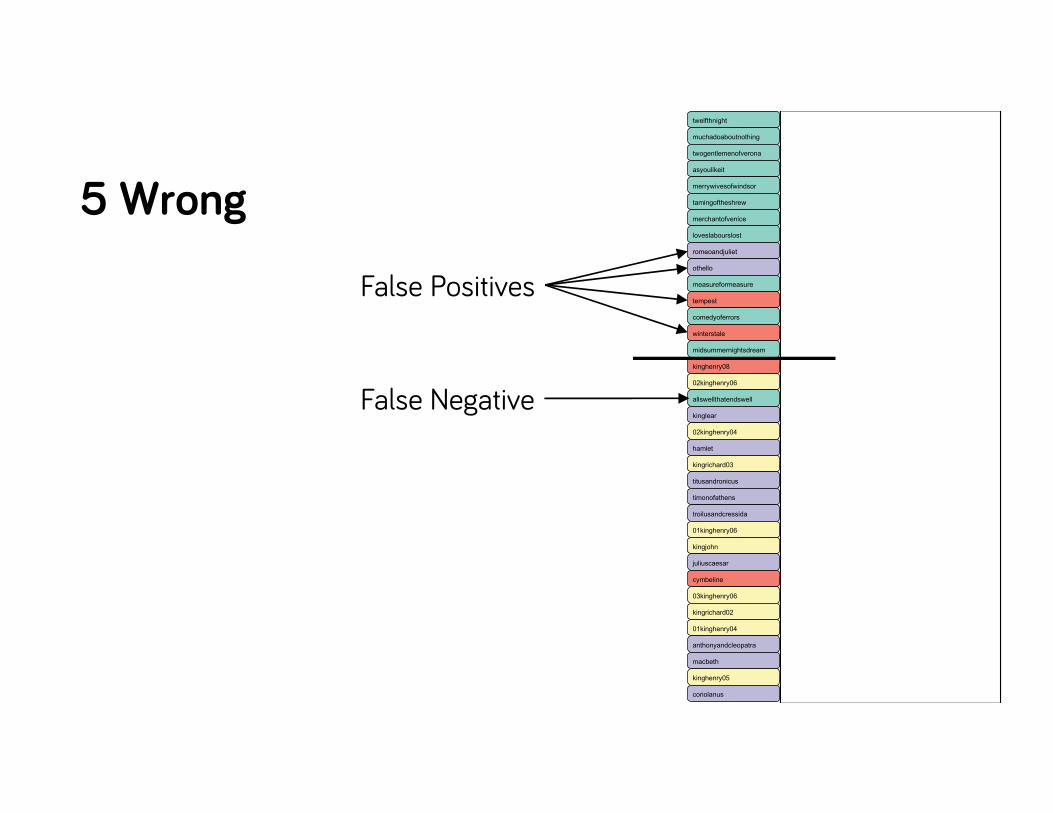
5 Wrong
twelfthnight
muchadoaboutnothing
twogentlemenofverona
asyoulikeit
merrywivesofwindsor
tamingoftheshrew
merchantofvenice
loveslabourslost
romeoandjuliet
othello
measureformeasure
tempest
comedyoferrors
winterstale
midsummernightsdream
kinghenry08
02kinghenry06
allswellthatendswell
kinglear
02kinghenry04
hamlet
kingrichard03
titusandronicus
timonofathens
troilusandcressida
01kinghenry06
kingjohn
juliuscaesar
cymbeline
03kinghenry06
kingrichard02
01kinghenry04
anthonyandcleopatra
macbeth
kinghenry05
coriolanus
False Positives
False Negative

Wrong?
Interesting Outliers“Romeo and Juliet” is pretty comedic
Ambiguous ClassificationsLate Plays are called Tragi-Comedies
Near-MissesA tiny shift, and this would be different
twelfthnight
muchadoaboutnothing
twogentlemenofverona
asyoulikeit
merrywivesofwindsor
tamingoftheshrew
merchantofvenice
loveslabourslost
romeoandjuliet
othello
measureformeasure
tempest
comedyoferrors
winterstale
midsummernightsdream
kinghenry08
02kinghenry06
allswellthatendswell
kinglear
02kinghenry04
hamlet
kingrichard03
titusandronicus
timonofathens
troilusandcressida
01kinghenry06
kingjohn
juliuscaesar
cymbeline
03kinghenry06
kingrichard02
01kinghenry04
anthonyandcleopatra
macbeth
kinghenry05
coriolanus

M – I (5 wrong)C – B – I (4 wrong)C – I – 10 M (1 wrong)31 D – 100 M – 3 A (none wrong)
“standard” L1 SVM (none wrong, reasonable margin)25.3698 Q + 11.8823 U + 6.9492 F + 5.4897 A + 4.1489 P - 3.3765 N + 2.6392 D + 2.0172 F - 1.5404 I + 1.1864 R - 0.7958 C + 0.7272 D

What’s Understandable*?
Simple form (linear vs. non-linear, …)A+B vs. ,
Parsimony (few variables)A+B vs. W+X+Y+Z
Simple Coefficients (small integers)A – 2B vs. 1.235 A – 4.327 B
Familiar VariablesA + B vs Q + W

Simpler Functions
Easier to Understand
More likelyto lead to Theory
Less Expressive
Less Likely to be Accurate

Tradeoffs
Give the user control over the tradeoffs

DiversityF + Q – IC – M – IP + N + D
Same:CorrectnessSimplicity
Different:ExplanationsOrderings

How to find functions?
Optimization problemMinimize
amount “wrong”“Cost” of function
Support Vector Machine (SVM)

How to Implement Explainers?
Fancy MathEncode tradeoffs into the SVM Solve for the best tradeoffsAdjust parameters to tune
Solve one big optimization problem
Not a standard SVM, so needs a slow and finicky solver
Brute ForceSample space of variable setsSolve an SVM for eachSort and filter to find interesting ones
Solve many small optimization problems
Generates a diverse and interesting exploration of tradeoffs

Finding the interesting explainers
2667 Explainers generated
Rank-by-Feature or “Scagnostics”style analysis
2667 points – each an explainer5 properties of each

1 2 3 4nvars = number of variables
21
3
5
10
qlevel= qu
antization (largest)
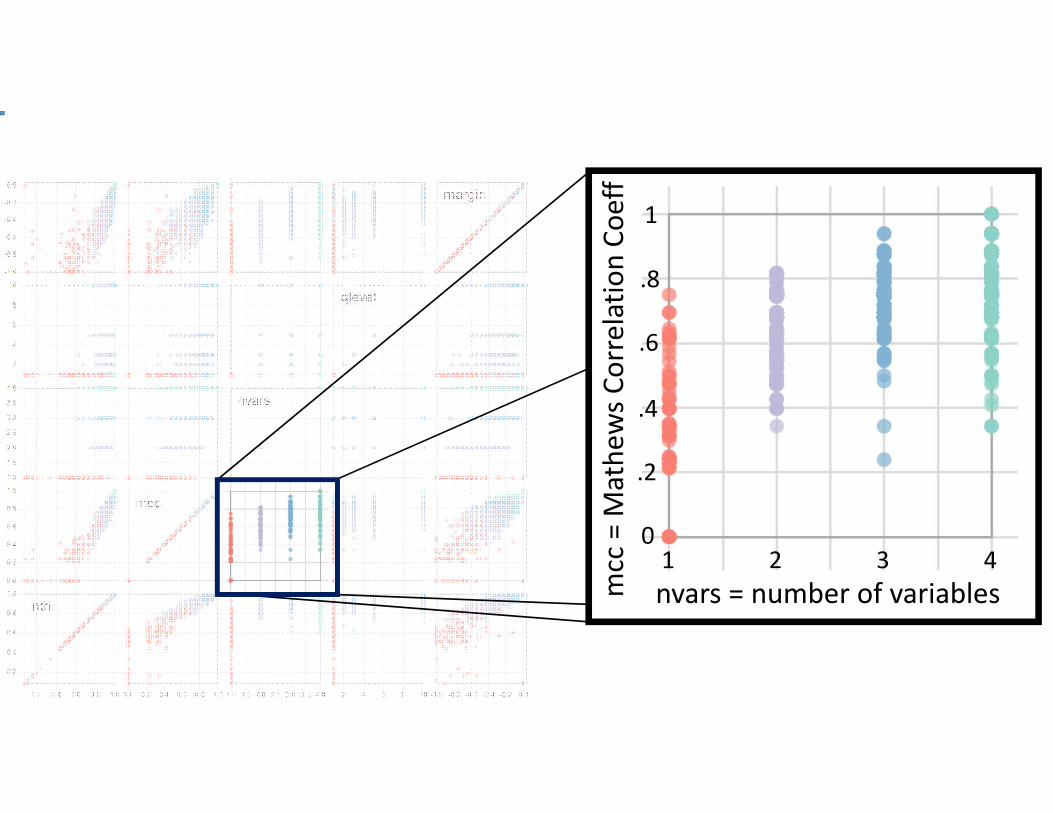
nvars = number of variables1 2 3 4
.2
0
.6
.8
1
.4
mcc = M
athe
ws C
orrelatio
n Co
eff

Qlevel = quantization (max)1 2 3 105
.2
0
.6
.8
1
.4
mcc = M
athe
ws C
orrelatio
n Co
eff

Isn’t this just…Some prior approaches to help situate our work
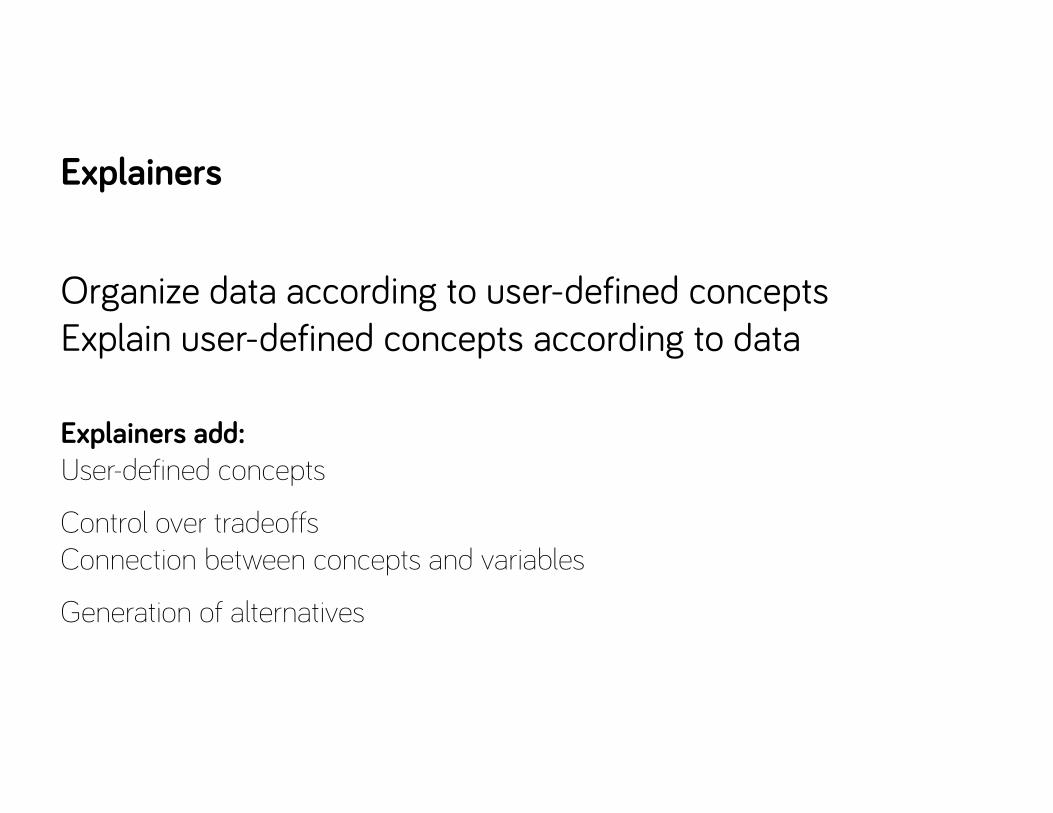
Organize data according to user-defined conceptsExplain user-defined concepts according to data
Explainers
Explainers add:User-defined concepts
Control over tradeoffsConnection between concepts and variables
Generation of alternatives

Organize data according to user-defined conceptsExplain user-defined concepts according to data
Dimensionality Reductione.g. PCA, CCA, IsoMap, … - standard statistical and ML practices
Explainers add:User-defined concepts
Control over tradeoffsConnection between concepts and variables
Generation of alternatives

M. Witmore and J. Hope. The Hundredth Psalm to the Tune of “Green Sleeves”: Digital Approaches to Shakespeare’s Language of Genre. Shakespeare Quarterly, 61(3) 357‐390.
A total of 776 pieces of Shakespeare's plays from the First Folio, each piece consisting of 1000 words, rated on two scaled PCs (1 and 4). The cumulative proportion of variation accounted for by the first four principal components is 12.33 percent, with component 1 accounting for 3.83 percent and component 4 accounting for 2.35 percent.

Organize data according to user-defined conceptsExplain user-defined concepts according to data
Machine Learning Classification Techniques
Explainers add:User-defined concepts
Control over tradeoffsConnection between concepts and variables
Generation of alternatives

Organize data according to user-defined conceptsExplain user-defined concepts according to data
User-Driven Spatializationse.g. Semantic Interaction (Endert++), LAMP (Paulovich++), Star Coordinates (Kandogan), …
Explainers add:User-defined concepts
Control over tradeoffsConnection between concepts and variables
Generation of alternatives
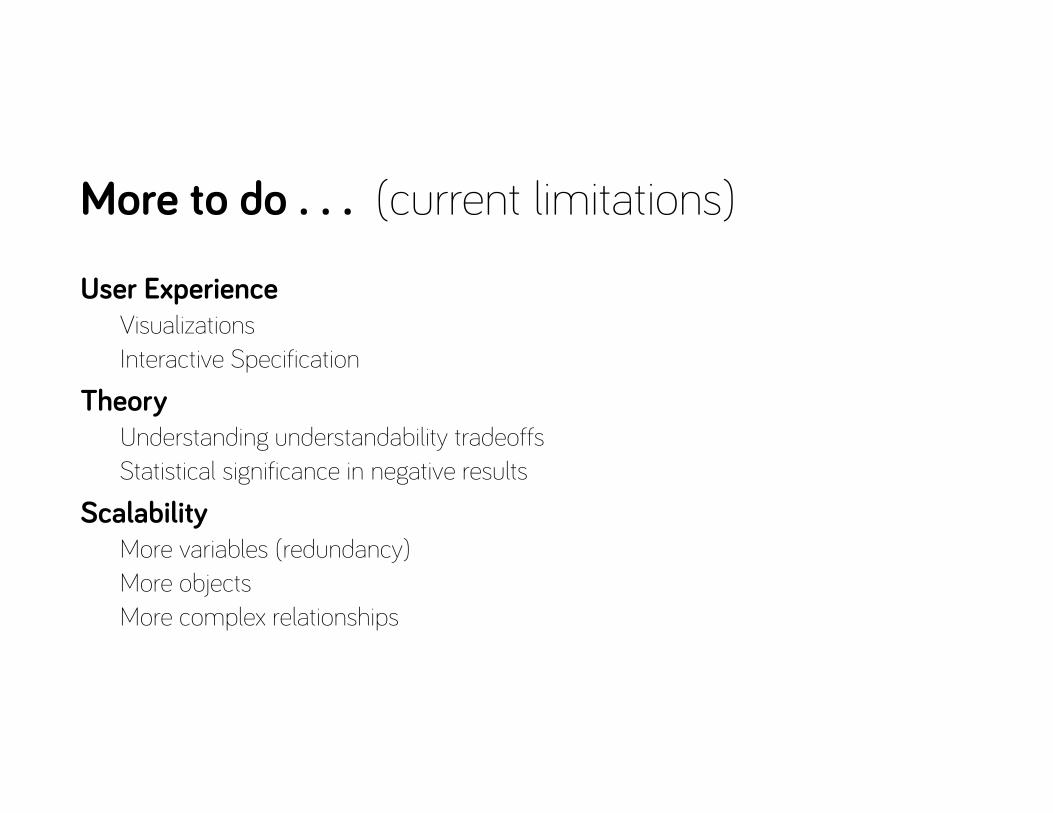
More to do . . . (current limitations)
User ExperienceVisualizationsInteractive Specification
TheoryUnderstanding understandability tradeoffsStatistical significance in negative results
ScalabilityMore variables (redundancy)More objectsMore complex relationships
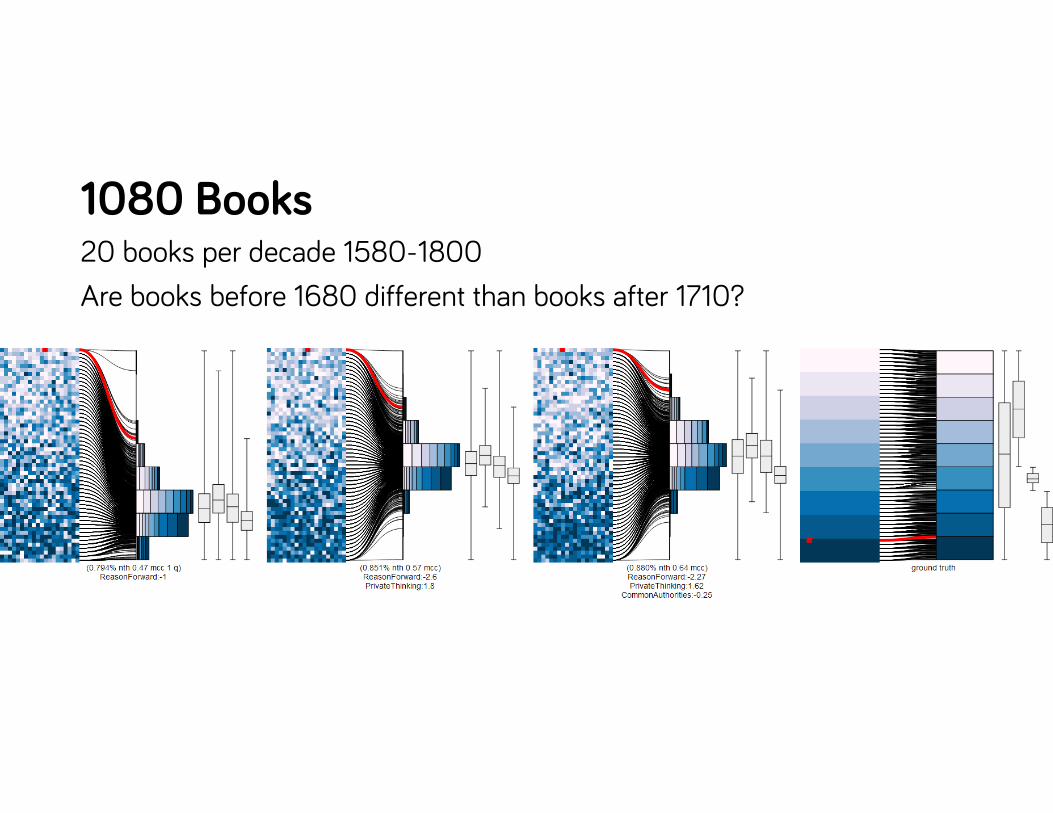
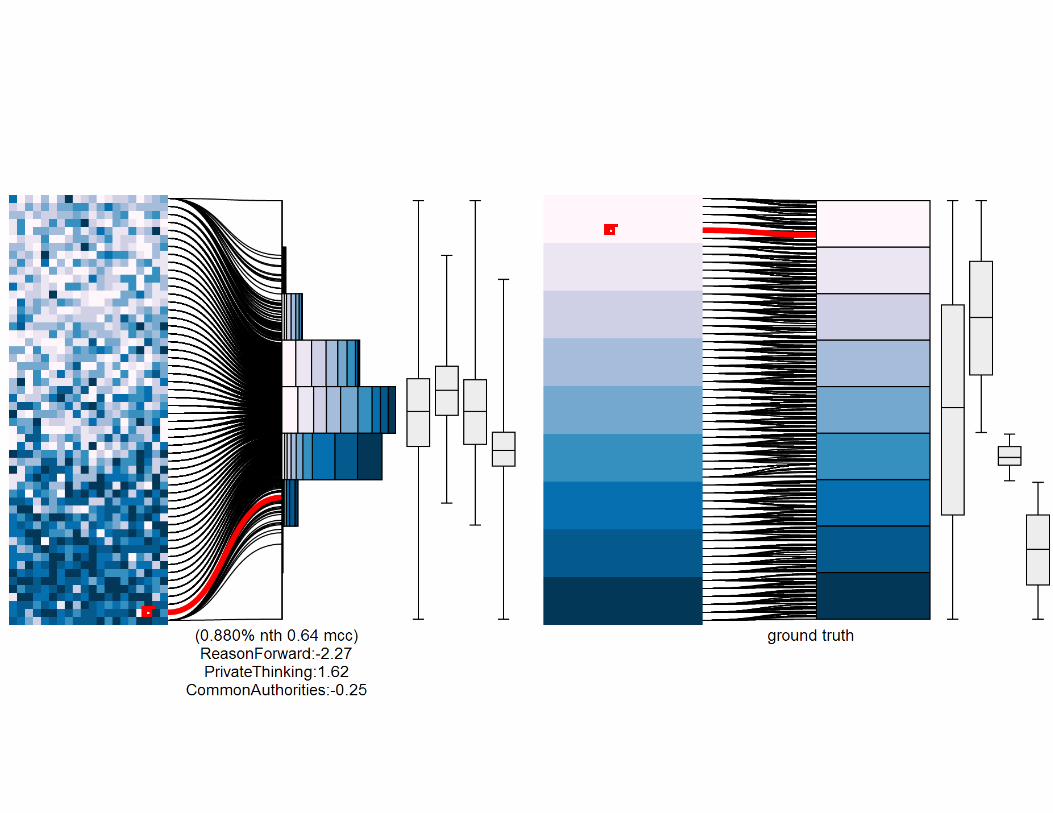
1080 Books20 books per decade 1580-1800Are books before 1680 different than books after 1710?

Key Ideas
User-defined conceptsMultiple goals: organize and explainUser-control over tradeoffs: correctness, simplicity, diversity Alternative viewpoints
Details:Types of SimplicityImplementation with SVM

Acknowledgements:This work would not have been possible without my fantastic domain collaborators, and the optimization and machine learning wizards in my department.
This work is supported in part by the Andrew Mellon Foundation through the “Visualizing English Print” project. This work is supported in part by NSF Awards IIS-1162037, CMMI-094103, and DRL-1247262.
More Examples Online!http://graphics.cs.wisc.edu/Vis/Explainers
Explainers
An approach to exploration and discovery in high dimensional data thatorganizes data according to user-defined conceptshelps explain these user-defined concepts in terms of the dataand generates alternative viewpoints
using machine learning techniques and providing control over tradeoffs.

Until we take the time to learn about how the other side thinks, we can’t really work together.
Once we learn how each other thinks, our ways of thinking can infuse each other’s.
This is not just building tools for our friends.It’s a lot more fun and interesting
Acknowledgements:This work would not have been possible without my fantastic domain collaborators, and the optimization and machine learning wizards in my department.
This work is supported in part by the Andrew Mellon Foundation through the “Visualizing English Print” project. This work is supported in part by NSF Awards IIS-1162037, CMMI-094103, and DRL-1247262.
More Examples Online!http://graphics.cs.wisc.edu/Vis/Explainers

One journal cover imageleads to (at least) three challengesThe scatterplot has too many points!
Splatterplots – a method for dense scatterplotsTVCG 2013 – Thursday afternoon
But you can get an average sense anyway…Perception of average value in scatterplotsInfoVis 2013 – Tuesday afternoon
The axes are meaningless!Explainers – crafted projectionsVAST 2013 – Wednesday morning